Guest essay by Monckton of Brenchley
The IPCC published its First Assessment Report a quarter of a century ago, in 1990. The Second Assessment Report came out 20 years ago, the Third 15 years ago. Even 15 years is enough to test whether the models’ predictions have proven prophetic. In 2008, NOAA’s report on the State of the Global Climate, published as a supplement to the Bulletin of the American Meteorological Society, said: “The simulations rule out (at the 95% level) zero trends for intervals of 15 yr or more, suggesting that an observed absence of warming of this duration is needed to create a discrepancy with the expected present-day warming rate.”
To the continuing embarrassment of the profiteers of doom, the least-squares linear-regression trends on Dr Roy Spencer’s UAH satellite dataset shows no global warming at all for 18 years 6 months, despite a continuing (and gently accelerating) increase in atmospheric CO2 concentration, shown on the graph as a gray trace:

Dr Carl Mears’ RSS dataset shows no global warming for 18 years 8 months:

By contrast, the mean of the three much-altered terrestrial tamperature datasets since May 1997 shows a warming equivalent to a not very exciting 1.1 C°/century:

It is now time to display the graph that will bring the global warming scare to an end (or, at least, in a rational scientific debate it would raise serious questions):

The zones colored orange and red, bounded by the two red needles, are, respectively, the low-end and high-end medium-term predictions made by the IPCC in 1990 that global temperature would rise by 1.0 [0.7, 1.5] Cº in the 36 years to 2025, equivalent to 2.78 [1.94, 4.17] Cº/century (page xxiv). The boundary between the two zones is the IPCC’s then best prediction: warming equivalent to about 2.8 C°/century by now.
The green region shows the range of measured global temperatures over the quarter-century since 1990. GISS, as usual following the alterations that were made to all three terrestrial datasets in the two years preceding the Paris climate conference, gives the highest value, at 1.71 C°/century equivalent. The UAH and RSS datasets are at the lower bound of observation, at 1.00 and 1.11 C°/century respectively.
Two remarkable facts stand out. First, the entire interval of observational measurements is below the IPCC’s least estimate in 1990, individual measurements falling between one-half and one-third of the IPCC’s then central estimate.
Secondly, the interval between the UAH and GISS measurements is very large – 0.71 C°/century equivalent. The GISS warming rate is higher by 71% than the UAH warming rate – and these are measured rates. But the central IPCC predicted rate is not far short of thrice the UAH measured rate, and the highest predicted rate is more than four times the UAH measured rate.
The absolute minimum uncertainty in the observational global-temperature measurements is thus 0.71 C°/century, the difference between the UAH and GISS measured warming rates. Strictly speaking, therefore, it is not possible to be sure that any global warming has occurred unless the warming rate is at least 0.71 C° century. On the mean of the RSS and UAH datasets, the farthest one can go back in the data and yet obtain a rate less than 0.71 C° is August 1993.

In short, the Pause may in reality be as long as 22 years 5 months – and the more the unduly politicized keepers of the terrestrial records tamper with them with the effect of boosting the rate of warming above the true rate the more they widen the observational uncertainty and hence increase the possible length of the Pause.
In 1995 the IPCC offered a prediction of the warming rates to be expected in response to various rates of increase in CO2 concentration:


The actual increase in CO2 concentration in the two decades since 1995 has been 0.5% per year. So there should have been 0.36 C° global warming since then, equivalent to 1.8o C°/century, as shown by the single red needle above.
Once again the graph comparing observation with prediction displays some remarkable features. First, the IPCC’s 1995 prediction of the warming rate to the present on the basis of what has turned out to be the actual change in CO2 concentration over the period since 1995 was below the entire interval of predictions of the warming rate in its 1990 report.
Secondly, all five of the principal global-temperature datasets show warming rates below even the IPCC’s new and very much lower predicted warming rate.
Thirdly, the spread of temperature measurements is wide: 0.38 C°/century equivalent for UAH, up to 1.51 C°/century equivalent for GISS, a staggeringly wide interval of 1.17 C°/century. The GISS warming rate over the past two decades is four times the UAH warming rate.
Fourthly, the measured warming rate has declined compared with that measured since 1990, even though CO2 concentration has continued to increase.

So to the 2001 Third Assessment Report. Here, the IPCC, at page 8 of the Summary for Policymakers, says: “For the periods 1990-2025 and 1990to 2050, the projected increses are 0.4-1.1 C° and 0.8-2.6 C° respectively.” The centennial-equivalent upper and lower bounds are shown by the two red needles in the graph above.
Once again, there are some remarkable revelations in this graph.
First, both the upper and lower bounds of the interval of predicted medium-term warming, here indicated by the two red needles, have been greatly reduced compared with their values in 1990. The upper bound is now down from 4.17 to just 3.06 C°/century equivalent.
Secondly, the spread between the least and greatest measured warming rates remains wide: from –0.11 C°/century equivalent on the RSS dataset to +1.4 C°/century equivalent on the NCEI dataset, an interval of 1.51 C°/century equivalent. Here, as with the 1990 and 1995 graphs, the two satellite datasets are at the lower bound and the terrestrial datasets at or close to the upper bound.
Which datasets are more likely to be correct, the terrestrial or the satellite datasets?
The answer, based on the first-class research conducted by Anthony Watts and his colleagues in a poster presentation for the Fall 2015 meeting of the American Geophysical Union, is that the satellite datasets are closer to the truth than the terrestrial datasets, though even the satellite datasets may be suffering from urban heat-island contamination to some degree, so that even they may be overstating the true rate of global warming. The following graph shows the position:

NOAA’s much-altered dataset (J. Karl, prop., say no more) appears to have overstated the true warming rate by some 60%. Watts et al. determined the true warming rate over the continental United States by a sensible and straightforward method: they adopted as normative a standard for the ideal siting and maintenance of temperature monitoring stations that had been independently drawn up and peer reviewed, and then they applied that standard to all the stations in the contiguous United States, excluding all stations that did not comply with the standard. The result, in blue, is that from 1979-2008 the true rate of warming over the continental U.S. was not the 3.2 C°/century equivalent found by NOAA, nor even the 2.3 C°/century equivalent found by UAH, which keeps a separate record for the 48 states of the contiguous U.S., but just 2.0 C°/century equivalent.
On this evidence, the satellites are far closer to the mark than the terrestrial datasets.
Thirdly, the measured rate of warming has again fallen, directly in opposition to the continuing (and gently accelerating) increase in atmospheric CO2 concentration and in anthropogenic forcings generally.
This inexorably widening divergence between prediction and reality is a real and unexplained challenge to the modelers and their over-excited, over-egged predictions. The warming rate should be increasing in response not only to past forcings but also to the growth in current anthropogenic forcings. Yet it has been declining since the mid-1980s, as the following interesting graph shows:

At no point has the rate of global warming reached the lower bound of the interval of global warming rates predicted by the IPCC in 1990:

Displaying the three prediction-vs.-reality graphs side by side shows just how badly off beam have been the official predictions on the basis of which governments continue to squander trillions.


The graphs show between them a failure of prediction that is nothing less than abject. The discrepancies between prediction and observation are far too great, and far too persistent, and far too contrary to the official notion of high climate sensitivity, to be explained away.
The West is purposelessly destroying its industries, its workers’ jobs, its prosperity, its countryside, and above all its scientific credibility, by continuing to allow an unholy mesalliance of politicians, profiteers, academics, environmental extremists, journalists and hard-left activists to proclaim, in defiance of the data now plainly shown for all to see for the first time, that the real rate of global warming is “worse than we thought”. It isn’t.
Great post,
May I suggest an addition to your time clocks. A green shaded area that shows rates of warming prior to the great scare commencing which would then show natural variability and that the current warming is no different to the past.
You really didn’t notice, that there is an information in the article that IPCC was predicting how fast it will warm after 1990, and there is no comparisson of that prediction with periods 1990-2015? Many other periods are presetet, but not 1990-2015 – the one it shout be shown in the first place? Guess why!
Sorry, my mistake. There is comparison of period 1990-2015.
Te fraud is somethine else here. Here are 1990 IPPC predictons:
http://www.skepticalscience.com/pics/FAR_projections.png
1.94-4.17 °C warming was predicted to occur within 1990-2090 period.
Warming predicted within 1990-2015 period was similar to that, what actually hapenned in that period.
As always, awesome job Viscount Monckton of Brenchley !!
Chritopher Monckton, you may he underestimating the errors!
I understand that CAGW theory predicts that the tropical troposphere will rise 30 percent faster then the surface, and the overall trophsphere will rise wp percent faster.
Yet it appears your UAH and RSS charts compare troposphere T to predicted surface warming, not the greater warming predicted for the troposphere. Corrections welcome, and great post!
Ah!!! fat fingers, small phone, old eyes and nasty autocorrect!
…and the overall trophsphere will rise 20 percent faster.
It seems to me that the (increasing) CO2 in the atmosphere ought to increase the LWIR radiation absorption (in the 15 micron band) “instantaneously”, within attoseconds of a new CO2 molecule taking up residence (for the next 200 years), it should already be catching LWIR photons, and within nanoseconds it should be imparting that energy to the atmospheric N2, O2, Ar molecules of the air and warming them.
So I have a hard time contemplating any time offset, between CO2 increases, and atmospheric Temperature increases.
And it seems to me that what Dr. Roy and Prof Christy are measuring is in fact the Temperature of that atmosphere (yes via a well established proxy thermometric means).
So I am dumbfounded by the complete lack of any apparent connection in MofB’s first two graphs, or the RSS and UAH data linear trend (of zero) to the clearly obvious continual annual growth of that atmospheric CO2, whatever its source is.
We can talk about water amplifications of CO2 initiated warmings till the cows come home.
But then there isn’t any CO2 warmings to be waking up the H2O at some later, yet to be determined time for them to do their amplification thing.
And since we now know, that much of the actual surface station supposed measured data is actually somebody’s wild a**** guess of what such data should be, and wasn’t measured by anybody, and a lot of it is false data from phony ocean water temperature exercises; is it any wonder, that we aren’t impressed with their protestations of emergency international calamity interdiction requirements and the money to go with it.
g
George E. Smith has the matter in a nutshell. The initial warming effect of CO2 should indeed be instantaneous, but it is not occurring. It is possible that natural factors may be overwhelming the warming signal from CO2, but even if that is the case the warming from CO2 must be very small.
The truth is LWIR in the 15 micron band is absorbed to extinction after a short traverse through the atmosphere, so any additional CO2 has no effect. That is why there has been no global warming over the last 18 to 19yrs even though the CO2 conc has been steadily increasing.
Currently in schools, children are being taught that there is no such thing as failure.
Grades used to be A = average, B= bad, C= catastrophic.
(BTW – AGW has redefined catastrophic to mean microscopic)
Now Grade A = attended (or just enrolled).
So the term “abject failure” today would probably be treated as a grammatical mistake by most teachers.
This is exactly how it was when i taught class at Miami University a couple years ago. In fact, the Department head pressed me to bump people’s grades up just the slightest bit because people complained they had a B or a B-, in the Lab classes i taught. It’s not like it was a hard lab. Only 1 person they didn’t press me on and that was because they didn’t show up to 10 (out of 16) lab sessions (1 of them being the final). Achievement has been replaced by entitlement.
Walt, serious question: Are you being somewhat sarcastic, or is this literally true regarding how school children are being taught?
I know that in games and sports, they have done away with winners and losers, but is it a fact that the grading system of evaluating each students progress and achievement level has been abandoned?
Just curious…little surprises me these days regarding our educational system.
(Or maybe I am surprised, but have come to accept being surprised as the norm.)
The Swiss canton Berne wanted to abolish grading some years ago, at the behest of the teachers. Guess who put an end to this nonsense: the pupils, who didn’t stop to nag and complain until the teachers gave up.
Object there Walt ! An abject is a speech impediment !
When I went to school, C was a passing grade, demonstrating all of the required standard knowledge of the subject. Class averages in any subject always fell right around 50% for the whole class.
But then they asked real questions, and they didn’t give you the answers to select from.
I still have ALL of my high school report cards, with actual exam marks on them. I believe I even have one in which my exam score was more than double what the average for the whole class was. I think it was 98 / 48.
Not bringing up my luck, just that 48% for the class average was not considered a problem. And we were the top class out of three classes taking the same subject material.
A 15 foot jump to clear a 16 foot chasm, is not generally regarded as a win.
g
@george e., 10:56 am, plus many, The downfall of education systems started 30-40 years ago. As parents we were heavily involved until unions decided that parent involved in their kids education was “detrimental” to our kids. We continued their education at home ( on top of the forced school system), they are fine as 35-40 year olds now thank god and can think on their own feet. It is truly a crime what the school systems in western countries has done to our children and it is no surprise that Asian kids are so far ahead of us.
But try to fight them. We had to leave one district after ( even physical against my wife!) confrontations but the crap just followed us until we just started the “home schooling “.
Lord Monkton. I took the liberty of making a small addition to your excellent piece.
Thank you for your tenacity and scientific prowess.
The Western world EU, USA, now Canada etc.. with their ubber Liberal socialist Government’s are purposelessly (Classic Obamanomics) destroying their industries, its workers’ jobs, its prosperity, its countryside, and above all its scientific credibility, by continuing to allow an unholy mesalliance of politicians, profiteers, academics, environmental extremists, journalists and hard-left activists to proclaim, in defiance of the data now plainly shown for all to see for the first time, that the real rate of global warming is “worse than we thought”. It isn’t.
.
‘report on the State of the Global Climate, published as a supplement to the Bulletin of the American Meteorological Society, said: “The simulations rule out (at the 95% level) zero trends for intervals of 15 yr or more, suggesting that an observed absence of warming of this duration is needed to create a discrepancy with the expected present-day warming rate.”
To the continuing embarrassment of the profiteers of doom, the least-squares linear-regression trends on Dr Roy Spencer’s UAH satellite dataset shows no global warming at all for 18 years 6 months, …’
The usual pea-moving. NOAA writes about trends in surface temperature, and in fact about ENSO-adjusted global mean temperature^*. So Lord M immediately reaches for his favorite satellite measures of the troposphere. Now it may be that I similar statement could be made about the troposphere (after ENSO adjustment). Or it may not. NOAA didn’t make it.
But the key thing (apart from ENSO) there is the 95% level. That says that if you look at just one instance from the population, and find it out of range, that is something that would happen only one time in 20, so you can say that it is likely something unusual is going on. But if you look here and there, hither and yon, then of course you will find occurrences. One in twenty events do happen. And if you extend your range to different regions, they will be found even more often.
* NOAA said “the simulations rule out…” What simulations (my bold)?
“The 10 model simulations (a total of 700 years of simulation) possess 17 nonoverlapping decades with trends in ENSO-adjusted global mean temperature within the uncertainty range of the observed 1999–2008 trend (−0.05° to 0.05°C decade–1). “
I am having difficulty discerning your point, Mr. Stokes.
I think Mr Stokes should be more worried about his own body temp ( and his BP) every time he sees one of Moncton of Brenchley’s posts.
I think Mr nick should be worried more about his own body temp ( and his BP) it seems to go to dangerous high levels every time Moncton posts.
Mr Stokes digs himself further into the mire every time he comments here. The official theory is that global warming, particularly when caused by wicked, naughty fossil fuels, should cause more warming in the troposphere than at the surface (see Santer, 2003, cited by IPCC, 2007). So, if the lower troposphere shows no warming for more than 15 years, a discrepancy has arisen: for the implication, confirmed by Anthony Watts’ excellent research, is that the surface-temperature datasets ought to be showing a lot less warming over recent decades than they do.
Mr Stokes’ second point is as half-baked and ill-thought-through as the first. He makes much of model simulations that “possess 17 non-overlapping decades with trends in ENSO-adjusted global mean temeprature” that show a zero or near-zero trend. Well, of course they do, for very nearly all of the 17 decades precede any anthropogenic influence. What is remarkable about the present stasis (RSS, UAH) or near-stasis (the rest) in global temperatures is that it is occurring notwithstanding rising anthropogenic forcings, including CO2 concentrations.
Mr Stokes should stop wasting his time contriving ever more elaborate attempts to explain away what is made manifest in the graphs in the head posting: the IPCC’s models have consistently and considerably exaggerated their predictions of warming rates, and the trends in observed temperature are very substantially below what was predicted i n each of the first three Assessment Reports. Best to admit that fact than to produce tortuous, ill-considered attempts at diverting attention away from it.
“models have consistently and considerably exaggerated their predictions of warming rates”
====
That’s because the models have been fed temperature records that have consistently and considerably exaggerated the rate of warming….by cooling the past…and warming the future
….the models are only doing what they have been told
I would like to see model runs on raw unadjusted un-algorithumed unfaked original temperature records…
..I would be willing to bet the models are not doing such a bad job
But we will never know….and the models will never be right
[Comment deleted. “Jankowski” has been stolen by the identity thief pest. All Jankowski comments saved and deleted from public view. You wasted your time, sockpuppet. -mod]
I find myself wondering yet again if Nick Stokes is any relation to Sir George Gabriel Stokes?
Seems like and apples-oranges issue here. You compare measured (and adjusted) surface temperature trends obtained from surface thermometers with surface temperature trends as predicted by models and lower troposphere trends as measured by satellites. You note that climate models predict greater temperature increases in the lower troposphere than at the surface. So a better comparison would seem to be between the modeled troposphere and the satellite (and balloon) measured troposphere. From my meager understanding of these matters, it seems that such a comparison might show an even greater discrepancy.
But if you look here and there, hither and yon, then of course you will find occurrences. One in twenty events do happen.
====================
You fail to account for the fact that no one had to looked hither and yon. The Pause happened on the very first occurrence. No sooner was the paint dry on the climate models than they started to diverge from reality and run hot.
What are the odds that 100 climate models will ALL run hot simply by chance? The same odds that if you toss a coin 100 times it will land heads every time. The odds are 1/2 to the power of 100. As close to zero as you can get.
“The Pause happened on the very first occurrence.”
Not of the dataset that they were talking about. Another had to be searched for. And then there is a whole range of years that can be scrutinised.
But the omission of mention of the ENSO adjustment that really does it. It’s well known that every couple of decades a big ENSO comes along and makes a huge spike in the temperature, especially in the troposphere. And for many years later, if you take a trend from that date, you’ll get a negative trend. Thgis arithmetic consequence is not what they are interested in. So they specifically removed the ENSO effect, to see if a truly significant effcet might be found in the remainder. That is where their 15 year figure comes from.
At the present time, your own figures show the following:
So RSS shows no statistically significant warming for 22 years and 8 months.
So UAH6.0beta4 shows no statistically significant warming for 22 years and 11 months.
So if I understand things correctly, the real question seems to be whether or not these times will go under 15 years in 8 months from now. Is that correct? (The reason I say 8 months is that by August 2016, this present super El Nino will presumably be back to normal so the 1998 and 2016 El Ninos will cancel out.)
“So RSS shows no statistically significant warming for 22 years and 8 months.”
Yes. But the trend actually observed was 0.772°C/Century. Lower than expected, but not zero. Saying that it isn’t statistically different from zero is just saying that in a whole lot of other Earths, with the same climatic conditions, 2.5% could have trend less than 0 (and 2.5% would have trend >1.574). That isn’t saying much.
So no, the 15 yrs and 22+ yr figures are quite different. When NOAA says that 15 year runs happened only 5% of the time, they are referring to actual occurrences (in their model).
An El Nino rise to balance 1998 would probably bring the trend to something more than 0.772, and that probably would be significantly different from zero. That shows a weakness in the calc of stat sig here. It would say that there was less than 2.5% chance of the trend since 1997 being negative, and yet a few months ago it was negative. What caused the change was ENSO, and there is likely better than a 2.5% chance of the El Nino happening. The random model on which the stat sig is based just doesn’t include that.
That is why the NOAA quote that this post leads with was based on trends with the ENSO effects removed. With ENSO, pauses are common, for reasons that don’t have much to do with the climate issues they are interested in. So they remove them. Then, and only then, it is true that there is less than a 5% chance of observing a 15 yr pause (in surface temp).
” It’s well known that every couple of decades a big ENSO comes along and makes a huge spike in the temperature, especially in the troposphere. And for many years later, if you take a trend from that date, you’ll get a negative trend.”
I would council patience, Nick.
It appears they are doing their darnedest to airbrush these dips out of the surface records.
Hard to claim “warmest year ever” year after year if some big fat el nino way back in 1998 keeps standing head and shoulders above the crowd.
But give them time, they’ll work it out.
Thank you! Do you have a program that removes ENSO effects, or is such a program even possible to create?
Mr Stokes again makes several bad points. He insists that NOAA’s removal of ENSO effects is important, but does not appear to understand that ENSO is a synoptic phenomenon – a cycle – and that its duration is typically only 3-4 years. Over 15 years it is broadly self-canceling. The El Niño spike of 1998, for instance, is near-perfectly offset by the spike of 2010. Remove both and the trend is near identical to what it was before the removal.
He then fails to grasp that the minimum observational uncertainty in a record covered by several datasets is the difference between the least and greatest trends over the period of interest. Mr Brozek had pointed out, correctly, that the usual computational significance tests broadly concur with the observational uncertainty demonstrated in the head posting.
Next, Mr Stokes demonstrates a poor understanding of what observational uncertainty is. He says that the RSS warming over 22 years is about 0.8 K/century equivalent. Noting in passing that that is not exactly a life-threatening warming rate, one should appreciate that the observational uncertainty derived from the difference between the RSS and GISS warming rates means that the True warming rate may be as far below the RSS rate as the GISS rate is above it.
Nex, he complains that UAH made corrections to its dataset. So it did -but it did so for genuine reasons well explained. Contrast this with the recent tampering so with the sea-surface temperature dataset on which the terrestrial datasets crucially depend. The indefensible decision was taken to adjust the ARGO bathythermograph temperatures massively upward to bring these inconvenient data into line with the earlier and far less reliable ship-bucket data.
As the head posting shows, on all datasets the observed warming rate is well below IPCC’s 1990 and 1995 predictions, and the 2001 least prediction only narrowly manages to overlap with some of the much-exaggerated terrestrial datasets, and only then because the I tire prediction interval has been so drastically reduced compared with the extremist IPCC predictions of 1990 that got the climate scam going,
Werner,
These are GCM results, so they have considerable ability to remove ENSO effects based on the mechanics.
But Foster and Rahmstorf (2011) did remove ENSO (and volcano and solar) effects from both surface and satellite indices. They used regression against MEI. The results is here. No pause to be seen:
http://www.moyhu.org.s3.amazonaws.com/2016/1/F%26R.png
Mr. Stokes, do you agree with this statement or not?
“The simulations rule out (at the 95% level) zero trends for intervals of 15 yr or more, suggesting that an observed absence of warming of this duration is needed to create a discrepancy with the expected present-day warming rate.”
Because it sounds like they are saying 15 years indicates a discrepancy. You seem content to do a bunch of hand waving, But even if you’re right and there is not, in the end, a discrepancy, the fact remains that the benchmark for investigating the validity of the models has been met.
The use of one data set versus another isn’t moving the pea. Rather, it’s a look at untortured data vs. tortured data. Everyone will use the data set which enforces the point they want to make.
“Rather, it’s a look at untortured data vs. tortured data. E”
Here is Roy Spencer’s account of the changes made in going to V6. Examples:
“That is no longer possible, and an explicit correction for diurnal drift is now necessary. The correction for diurnal drift is difficult to do well, and we have been committed to it being empirically–based, partly to provide an alternative to the RSS satellite dataset which uses a climate model for the diurnal drift adjustment.”
“The LT retrieval must be done in a harmonious way with the diurnal drift adjustment, necessitating a new way of sampling and averaging the satellite data. To meet that need, we have developed a new method for computing monthly gridpoint averages from the satellite data which involves computing averages of all view angles separately as a pre-processing step. Then, quadratic functions are statistically fit to these averages as a function of Earth-incidence angle, and all further processing is based upon the functional fits rather than the raw angle-dependent averages.”
Only raw data there.
Michael Jankowski,
All excellent points. It takes an ulterior motive to use Phil Jones’ Hadcru, or any ground-only stations.
To say nothing of adjusting state of the art ARGO buoy data to match wooden buckets and ship intake systems.
Hello Nick, thank you for your copy and paste of DrSpencer’s methodology. What is that, the bazzillionth time now?
Do, be a dove, please show us all of the changes, times and dates of and the actual adjustments to, the land based temp set….
…and Nick, please tell us which independent accurate and precise instrument data set the land based thermometers data are verified with?
(Nick knows the satellites are checked with the most accurate instuments we have on weather ballons)
Nick…..two last requests from the above comment…..One, the rational for each of the changes to the land based temp set. And two, what changes have not been made to the land based temp record that “should” be made…..ie-urban heat island.
Ohhhhhhh ooooooppppppsssssss……my request is “overly broad” and it would require too many hours of your time?!?……as well as tooooooooooo much space for a simple copy and paste….WOW
[Comment deleted. “Jankowski” has been stolen by the identity thief pest. All Jankowski comments saved and deleted from public view. You wasted your time, sockpuppet. -mod]
Phil Jones, July 5, 2005:
“The scientific community would come down on me in no uncertain terms if I said the world had cooled from 1998. Okay it has but it is only seven years of data and it isn’t statistically significant.”
I tried to prove his statement true with Hadcrut3 from 1998 to July 2005, but the slope was positive! Was Hadcrut3 adjusted since his statement was made? See:
http://www.woodfortrees.org/plot/hadcrut3gl/from:1998/to:2005.6/plot/hadcrut3gl/from:1998/to:2005.6/trend
Nick,
As far as I’m concerned, all this talk about model output is just wasted time. As you are a proponent of leaving the climate science to the experts, I’m sure you would agree that writing software should be left to the software engineer (just as building bridges should be left to the equivalent experts). However the models (and much of the temperature record keeping/averaging) are just large pieces of software. Software which was written by people, which though they may be experts in their fields, have little or no training in software engineering. As a professional software engineer I can assure you that writing such complicated software without following industry design and testing standards will result in unreliable code which is riddled with bugs. Nobody should trust the output of any software that has not been verified and validated. None of the models, to my knowledge, have been through that process. Using such software (unvalidated and unverified) is like using uncalibrated instruments in an experiment: worthless.
” I’m sure you would agree that writing software should be left to the software engineer”
No, I don’t. You might as well say that writing blog comments should be left to English majors. I was writing programs before the term SE was invented. They worked then and they work now.
I wrote a program for producing a monthly global average surface temperature. The code is set out and described in a series terminating here. It was not written “following industry design and testing standards”, and I’m sure you could find much to criticise. But it works. Every month on about the eighth, I post the results. I have done that for about four years. The latest for December (and 2015) is here. About a week later, when the GISS results come out, I post a comparison. They are very close – a recent review is here. I think that indicates that both my program and GISS/NOAA are doing something right.
But you can possibly do better. I’m all ears.
Nick says:
I think that indicates that both my program and GISS/NOAA are doing something right.
Yes, I agree. I also agree that the pre-Copernicus scientists of their day were doing something right, when they created programs to predict the retrograde movement of planets with epicycles. They were quite accurate.
Then Kepler came along and blew that nonsense out of the water.
You’re doing something similar. You are taking natural events and assigning an anthropogenic cause. But you still can’t answer a few critical observations:
There is nothing happening that exceeds past temperature parameters, from when there were no industrial CO2 emissions. What is observed now is not unusual, or unprecedented. It has happened repeatedly, and to a much greater degree in the past.
And you always avoid Occam’s Razor, which says that the simplest explanation is most likely the correct one: we are observing natural variability in global temperatures, because CO2 at current levels just does not have the effect you claim. In fact, the rise in CO2 has been a net benefit.
You would see that if the scales ever fell from your eyes. You’re desperately searching for solid evidence that there is something happening that can only be explained by human emissions. But you can’t find anything, so you argue around it, trying to build a circumstantial case. That’s for the courtroom, Nick, not for scientists. In science, skepticism is essential. But you’re no skeptic.
You’re a smart guy, Nick, so you must be aware of these things. So somehow you’re getting compensated, either with money, or with pats on the head from people you want to impress, for promoting their alarmist views. You have no skepticism of the ‘dangerous AGW’ conjecture. Without skepticism, you’re just studying epicycles.
[Comment deleted. Identity thief post. ~mod.]
Hi Michael Palmer,
If you have the patience, I’ll answer your question as a skeptic of the “dangerous AGW” (DAGW) conjecture sees it.
First, WUWT isn’t a peer reviewed publication. It’s a site where all different views are expressed. In fact, it’s been the Internet’s “Best Science” site for the past three years. If you conflate this site with peer reviewed papers, I suggest you read Montford’s The Hockey Stick Illusion, and some of the Climategate email sites. You will see that they are not credible because climate peer review, and the associated journal system has been thoroughly corrupted. There isn’t any doubt about that.
On this site you will find plenty of comments that argue for the DAGW conjecture. Some folks, like Brandon Gates, Nick Stokes, and Joel Shore try make rational arguments, which are all based on their belief that “dangerous” AGW is happening, or that it will happen if CO2 keeps rising. But they’re wasting a lot of time arguing over a very minuscule effect that is too small to even measure. I have yet to see any of those folks arguing that AGW is too small to worry about. Therefore, their arguments conclude that there is something to worry about. Thus: “dangerous”.
Others, however, make no bones about their belief that human CO2 emissions are causing dangerous global warming. They are convinced that a climate catastrophe is occurring, or that it soon will. I won’t name any more names because others seem wacky. But the ones above are people I respect, because even though they’ve been completely wrong so far about DAGW, they try to make a good case. I make the counter-case: show us any global damage, or harm, caused by human CO2 emissions.
So even though DAGW is clearly a conjecture (and AGW isn’t far behind), those writing the papers for journals are being as careful as Nick, Joel, and Brandon. They’re too smart to say what they really believe (except maybe Gates). But all their arguments go in the direction of DAGW, and they never admit that AGW is something we very likely don’t have to worry about. (If new evidence appears that shows a cause for concern, I’ll accept it. It’s the knowledge that matters most to skeptics, not the bragging rights.)
The literature is no different from the three folks I mentioned here. Most of the scientists who pass the journal gate-keepers are in it for various reasons, money and status not being the least of them. They’ve staked out their position, and they won’t back down. They’re certainly not the skeptics that Profs. Feynman, Langmuir, and Popper wrote about. They have an agenda, and it’s not to gain more knowledge or to accept the current un-scary observations.
On the other hand, skeptics really have no position other than: “Show us! Post convincing evidence that the rise in CO2 is something we should worry about. Convince us that our national priorities need to be re-ordered because of the ‘carbon’ scare.”
But so far, I haven’t seen any convincing evidence. If they can’t quantify the fraction of AGW out of global warming from all sources like the natural recovery from the LIA, and from volcanic eruptions, el Ninos, and other causes, then AGW remains an unproven conjecture. They are asserting that AGW is a problem. But their evidence is lacking.
Data, Michael. That’s what is missing. Measurements are data — but there are no measurements quantifying AGW. That means AGW must be too small to measure. If they can measure subatomic forces to twelve decimal places, why can’t they measure the fraction of global warming being caused by human CO2 emissions? (I’ve repeatedly explained exactly why not, but they never respond with a good answer.)
They also post links of “adjusted” data (which isn’t really data at all unless every step of the process, from the raw data through all adjustments is thoroughly documented). It’s interesting that the final product shown to the public almost always shows more scary warming; almost never cooling. The warming is always ascribed to human emissions. And of course, the maps are colored in scary reds. That isn’t an accident. Red implies danger.
But CO2 has risen from only about 3 parts in 10,000, to 4 parts in 10,000 over the past century. That’s just one part in 10,000. And it’s been up to almost 20X higher in the past without causing a climate catastrophe. But they never use the ‘parts per ten thousand’ metric. Its always something like, “CO2 has gone up by X %!!” Can you see the agenda?
So when you try to frame the debate in terms limited to what’s in the climate peer reviewed literature, what you’re leaving out is the fact that climate alarmism is based on DAGW, not on AGW. I’m sure you’ve seen the graphs of the number of papers containing scare words like ‘man-made global warming’. Now that number is accelerating. Can’t you see the grant trolling? Without something to scare the public, the money spigot will be turned way down. So just because they don’t overstep and write “dangerous” AGW, certainly anyone who follows the debate knows that’s exactly what they’re peddling.
Now let me turn the argument around, and ask you: how many papers conclude that AGW is a non-problem? You say you’ve read much of the literature. Give me a reasonable ratio of the number of papers that you think conclude that AGW is something to worry about, versus the number that says it isn’t.
Better yet, get the three folks I mentioned above to state unequivocally that based on all available evidence, there is no global harm or damage being caused by the rise in CO2, and there is plenty of evidence showing its benefits; what people worried about has turned out to be a false alarm, and unless something changes those facts we should not spend any more public money to fix what has turned out to be a non-problem. Other areas of science are being starved of funding that has gone instead into ‘studying climate change’. Let’s get our priorities back to normal.
Good luck. If you can do that, maybe we can tackle the corrupted climate journal/peer review system, which is still being controlled by the same self-serving charlatans.
[Comment deleted. Identity thief post. ~mod.]
…in effect the word “dangerous” is not part of the science.
Neither is the climate peer review/journal system. It’s self-serving propaganda, and just because a clique has gotten together and put their ‘Appeal to Authority’ stamp on it, that doesn’t mean it’s science. Montford shows that in spades.
You’re not replying to the many points I made. Since ‘silence is concurrence’, we can drop the discussion now.
[Comment deleted. Identity thief post. ~mod.]
Michael Palmer,

I spent some time patiently explaining for you exactly where the “dangerous” narrative comes from, and who promotes it, and why it’s false. You’re right, you don’t have to respond. But I think the reason is because you cannot refute my explanation. If I’m wrong, explain where I’m wrong.
Next, ‘skepticgonewild’ says:
The NOAA fully expected the warming to resume in the next few years since the time interval would then exceed 15 years.
That’s the same error that Dr. Phil Jones made. Jones stated that 15 years would be needed to statistically confirm that global warming has stopped. Count the years:
http://realclimatescience.com/wp-content/uploads/2015/06/ScreenHunter_9549-Jun.-17-21.12.gif
Here are fivew WoodForTrees databases showing the same thing. Global warming stopped a lot longer than 15 years ago.
Since global temperatures refuse to do what the alarmist crowd predicted, the UN/IPCC doubles down every time, while raising their ‘confidence’ levels:
http://www.energyadvocate.com/gc1.jpg
Even B.E.S.T. admits that global warming has stopped.
And the left-leaning Washington Post agrees:
The only response the climate alarmist clique has is to repeat their narrative, that we are facing “dangerous man-made global warming”. They completely disregard the facts, and hope the public listens to their alarmism, rather than independently verifying it.
NOAA is part of that deception:
They would not have to fake the temperature record if there was actually dangerous warming occurring. Since there isn’t, they fabricate it.
Never listen to just their words. Always watch their actions.
[Comment deleted. Identity thief post. ~mod.]
[Comment deleted. Identity thief post. ~mod.]
Michael Palmer,
Your arguments are becoming increasinly lame and nasty, telling me I know nothing about science.
Well, I know more than you do, because I know the difference between a hypothesis and a conjecture. And I know when someone tucks tail and skedadles, rather than answering questions or replying to points I’ve made.
You jumped into this and asked me a question. Fair enough; I took some time to politely answer you. But you didn’t like what I wrote. I’ve pointed out that you are unable to refute it. Your response:
I don’t have to refute anything you’ve said.
My reply: That’s just a smoke screen. You are simply incapable of refuting my points. If you could have, you would have. Instead, you lower yourself to schoolyard taunts:
You flunk science 101. …you have shown that you don’t have any conception of what “science” is.
Ah, but I do. That has you flustered. So you try to wing it:
Science does not concern itself with the values of a given phenomena.
Wrong-o, pal. Science is absolutely concerned with that. It’s called “data”, and it comes from measurements — which you lack.
More tap-dancing:
Science does not and cannot say if AGW is “beneficial,” nor can it say if AGW is “dangerous.” Unfortunately, when you say “dangerous” AGW, you have left the study of science.
Wrong again. First off, you don’t read very well. I wrote to you that ‘the rise in CO2’ has been a net benefit. And your whole thought process is out to lunch: science constantly assigns values to outcomes. That is exactly what scientists do all the time: Are antibiotics good? Is syphilis bad? And so on. Since you mentioned it, I think AGW has also been a net benefit. Where’s the downside? Show us any global harm, or damage caused by AGW. Or by CO2. Be specific.
While you’re at it, have you read all of the climate peer reviewed literature? You seem to think so, because you stated that “dangerous” does not appear anywhere. You wrote that “none of your points address where the “dangerous” comes from.” But I spent some time explaining in detail to you exactly where that narrative comes from, and why. Like I said, you just don’t like the answers, but you’re incapable of refuting them. You don’t come across as being able to make a coherent argument, Michael. For your sake, I hope you’ve got tenure. From your responses it’s clear that you wouldn’t rise very far in the private sector.
See, you’re confused about everything. I have you so spun up now that you’re posting multiple consecutive comments. I always like that, it shows you’ve got nothin’, so you continue to post random new thoughts as they occur. That amuses me. But I’d prefer that you reply to my specific points. I hate to see a guy floundering around like that (and yes, I know it’s ‘foundering’. Both apply).
When you make the statement “science constantly assigns values to outcomes.” you are playing with words. Science does not assign “good” nor “bad” to outcomes. Science is value neutral. Good and bad belong to the study of ethics, a branch of philosophy. So when you label AGW “dangerous” you have left the study of science. Is CO2 beneficial? That depends on the meaning of “beneficial” which of course, science cannot answer.
Mr Palmer, assessing if a phenomenon is dangerous or not DO belongs to science. Many science paper explicitly do that. With or without using the word “dangerous” itself.
So, if indeed no scientific paper says that climate change is “dangerous”, well, let’s don’t make fuss nor spend money nor write no rules about it. We already have so many dangerous things to cope with.
Correctomundo, paqyfelyc. Palmer is clueless.
Once in a while we run into someone who paints himself into a corner with illogical nonsense, like Palmer is doing here. The .edu factories collect numbskulls who couldn’t make it in the real world.
So he’s a good example.
Science is used to solve problems. Problems are subdivided into good and bad outcomes. As it turns out, AGW and CO2 are good, confounding the worrywarts. Some of them pointlessly nitpick, instead of manning up and admitting they called it wrong.
Human nature is amusing when you understand it.
[Comment deleted. Identity thief post. ~mod.]
OK this has deteriorated into a childish food fight, ALL OF YOU – STOP.
Otherwise I’m closing the thread.
“ Near-zero and even negative trends are common for intervals of a decade or less in the simulations, due to the model’s internal climate variability. The simulations rule out (at the 95% level) zero trends for intervals of 15 yr or more, suggesting that an observed absence of warming of this duration is needed to create a discrepancy with the expected present-day warming rate.”
What Nick fails to realize is the context of the above quote. The title of the section where the above quote appears:
“Do global temperature trends over the last decade falsify climate predictions?”
The NOAA answered their question. No. Global temperature trends over the last decade do not falsify climate predictions. Why? Because near-zero and even negative trends are common for intervals of a decade or less in the simulations, due to the model’s internal climate variability.
What time interval would then create a discrepancy? Answer: 15 years or more, “The simulations rule out (at the 95% level) zero trends for intervals of 15 yr or more, suggesting that an observed absence of warming of this duration is needed to create a discrepancy with the expected present-day warming rate.”
The NOAA concluded by stating:
“Given the likelihood that internal variability contributed to the slowing of global temperature rise in the last decade, we expect that warming will resume in the next few years, consistent with predictions from near-term climate forecasts.”
The NOAA fully expected the warming to resume in the next few years since the time interval would then exceed 15 years.
Good post. It would be great if Nick would respond.
“It would be great if Nick would respond.”
I’ll try. But it’s difficult now. For the last year, all my comments have gone through moderation. But now they seem to be going to the spam bin (the last four). Maybe they will be fished out.
“The NOAA fully expected the warming to resume in the next few years since the time interval would then exceed 15 years.”
Again, the NOAA was explicitly writing about ENSO-adjusted trends, of surface temperature. The box begins:
“Observations indicate that global temperature rise has slowed in the last decade (Fig. 2.8a). The least squares trend for January 1999 to December 2008 calculated from the HadCRUT3 dataset (Brohan et al. 2006) is +0.07±0.07°C decade —much less than the 0.18°C decade recorded between 1979 and 2005 and the 0.2°C decade expected in the next decade (IPCC; Solomon et al. 2007).”
They then say
“The trend after removing ENSO (the “ENSO-adjusted” trend) is 0.00°±0.05°C decade, implying much greater disagreement with anticipated global temperature rise. “
That’s the context. It was actually the ENSO-adjusted zero (surface) trend that was bothering them. The ordinary trend was positive. That’s why it is so improper to ignore that caveat. It’s essential to their argument.
Nick St0kes:
You say
NO!
Every climate model runs hot and every climate model always has run hot.
This is not news: I first published on it in peer reviewed literature in 1999.
None of the models – not one of them – could match the change in mean global temperature over the past century if it did not utilise a unique value of assumed cooling from aerosols. So, inputting actual values of the cooling effect (such as the determination by Penner et al.
http://www.pnas.org/content/early/2011/07/25/1018526108.full.pdf?with-ds=yes )
would make every climate model provide a mismatch of the global warming it hindcasts and the observed global warming for the twentieth century.
This mismatch would occur because all the global climate models and energy balance models are known to provide indications which are based on
1.
the assumed degree of forcings resulting from human activity that produce warming
and
2.
the assumed degree of anthropogenic aerosol cooling input to each model as a ‘fiddle factor’ to obtain agreement between past average global temperature and the model’s indications of average global temperature.
Nearly two decades ago I published a peer-reviewed paper that showed the UK’s Hadley Centre general circulation model (GCM) could not model climate and only obtained agreement between past average global temperature and the model’s indications of average global temperature by forcing the agreement with an input of assumed anthropogenic aerosol cooling.
The input of assumed anthropogenic aerosol cooling is needed because the model ‘ran hot’; i.e. it showed an amount and a rate of global warming which were greater than observed over the twentieth century. This failure of the model was compensated by the input of assumed anthropogenic aerosol cooling.
And my paper demonstrated that the assumption of aerosol effects being responsible for the model’s failure was incorrect.
(ref. Courtney RS An assessment of validation experiments conducted on computer models of global climate using the general circulation model of the UK’s Hadley Centre Energy & Environment, Volume 10, Number 5, pp. 491-502, September 1999).
More recently, in 2007, Kiehle published a paper that assessed 9 GCMs and two energy balance models.
(ref. Kiehl JT,Twentieth century climate model response and climate sensitivity. GRL vol.. 34, L22710, doi:10.1029/2007GL031383, 2007).
Kiehl found the same as my paper except that each model he assessed used a different aerosol ‘fix’ from every other model. This is because they all ‘run hot’ but they each ‘run hot’ to a different degree.
He says in his paper:
And, importantly, Kiehl’s paper says:
And the “magnitude of applied anthropogenic total forcing” is fixed in each model by the input value of aerosol forcing.
Kiehl’s Figure 2 can be seen here.
Please note that the Figure is for 9 GCMs and 2 energy balance models, and its title is:
It shows that
(a) each model uses a different value for “Total anthropogenic forcing” that is in the range 0.80 W/m^2 to 2.02 W/m^2
but
(b) each model is forced to agree with the rate of past warming by using a different value for “Aerosol forcing” that is in the range -1.42 W/m^2 to -0.60 W/m^2.
In other words the models use values of “Total anthropogenic forcing” that differ by a factor of more than 2.5 and they are ‘adjusted’ by using values of assumed “Aerosol forcing” that differ by a factor of 2.4.
So, each climate model emulates a different climate system. Hence, at most only one of them emulates the climate system of the real Earth because there is only one Earth. And the fact that they each ‘run hot’ unless fiddled by use of a completely arbitrary ‘aerosol cooling’ strongly suggests that none of them emulates the climate system of the real Earth.
Richard
“NO!
Every climate model runs hot and every climate model always has run hot.”
That makes no sense as a rebuttal here. Lord M has invoked a statement from NOAA about a fifteen year pause to say that there is something wrong with AGW, which he says now lies outside 95% limits. That 15-year pause statistic was calculated using models (with ENSO correction). It is Lord M who is invoking model results, not I. I am just pointing out that the NOAA calc, right or wrong, was not calculated for the circumstances to which he wishes to apply it.
Nick Stokes:
You provide a plain daft excuse for my having shown you to be plain wrong.
You wrote
That was a clear assertion that the ‘pause’ was a statistical “one time in 20” probability so no big deal. It may have been your misinterpretation of what NOAA wrote in 2008, but so what?
I replied that your assertion was plain wrong when I wrote with explanation
“Every” is very different from “one time in 20”.
But you have replied
Twaddle!
At very best, your response is sophistry. You said the ‘pause’ was a “one time in 20” probability according to model performance.
You were wrong about model performance and I explained that you were wrong.
“Every” is very different from “one time in 20”.
Richard
“That was a clear assertion that the ‘pause’ was a statistical “one time in 20” probability so no big deal.”
It’s not my assertion. Lord M says, quoting NOAA, that a 15 year pause would rule out a zero trend at the 95% confidence level (not mentioning their proviso of ENSO removal). I’m just explaining what that means – a 5% chance that it could happen in any one observation, and more if you look in repeated places. That is just standard statistical test stuff, and has nothing to do with whether models run hot or cold.
NS:
Have it your way.
You now claim to be making a purely semantic argument about the specific words Monckton of Brenchley quoted.
Monckton of Brenchley was addressing the fact that model predictions are for warming that are too high (i.e. the models ‘run hot’): he cited the 2008 NOAA statement as example that the models say pauses like the present one are improbable because the models ‘run hot’.
You arm waved about “improbable” not being “impossible”. That was puerile.
I pointed out that your arm-waving is not relevant because as I explained
But if you want to think you have ‘won’ your argument then do because your semantic point does not alter the fact that Monckton of Brenchley was addressing the reality of model predictions being for warming that are too high (i.e. the models ‘run hot’).
Richard
Nick, just wondering in which branch of science people stick to a model+ theory having a 1 out of 20 success record…
“listen, it’s true that our theory predict that rats would survive the experiment, and that 19 out of 20 died. But statistically this can happen, you know, so let’s keep our theory for now”
O_o
Post-modern science, I guess.
Maybe I am getting old…
richardscourtney January 14, 2016 at 2:02 am
As always, another exquisitely lucid and salient contribution.
Thank you for taking the time, Sir.
Mods:
I posted a response to the above post but it has vanished. Please see if it is in the ‘bin’ and recover it or if it is not there then let me know so I can resubmit it. Thanking you in anticipation
Richard
Until yesterday, mentioning my name would put your comment into moderation. Now it seems to send it to the spam bin. That’s where my comments have been going.
[Reply: it’s the same folder. Your comments are always approved. Lots of comments are delayed for one reason or another, some by Anthony and some by WordPress. Moderators don’t have that editing authority. ~mod.]
Nick:
So you think you know how to identify a trend in a time series?
Want to make a quick $100,000?
Doug Keenan has generated 1000 global-temperature type time series. Some were generated using a trend; some were not.
He has already published an encrypted file of how the series were generated, so he has no way to change things after the fact.. If you can get 900 out of a 1000 right you will win the $100,000 prize.
GISTEMP’s confidence intervals are worthless, except to show us that their alterations to the thermometer-based temperature record are unjustified.
“GISTEMP’s Overconfidence Intervals”
http://bit.ly/1RnNu9X
http://bit.ly/1JMCUa7
great graphics
Very nice comparison, thank you very much.
Your statement ‘In short, the Pause may in reality be as long as 22 years 5 months’ led me to this thought:
Around another 22 years before, in the seventies, was the ‘Cooling Hype’.
Cooling, I fear much more than warming, but more and more I think that hypes I fear most.
Regards, Lorenz
Great presentation! Shameful that the MSM simply ignores information like this.
Another excellent contribution. Thanks for posting.
Also, just found this. It was inevitable:
http://newsdaily.com/2016/01/global-warming-could-stave-off-next-ice-age-for-100000-years/
I had hoped I was the only one who had come across that brilliant essay spin (called a ‘study’) including his eminence, Hans Joachim Schellnhuber, the original 2 degree dart thrower, but alas you are perhaps more of a news junkie than I am. How to spin warming good into bad and now we have ‘natural’ carbon dioxide plus, by inference, ‘unnatural’ man-produced carbon dioxide? Clearly humanity is a virus that only an elite few should survive. Where can one buy some pompous to become one of the guys (survivors)? No thanks.
” Clearly humanity is a virus that only an elite few should survive. “….Bubba, that is EXACTLY what the liberal elite believe !!
marcus,
From the wiki~
“Liberalism is a political philosophy or worldview founded on ideas of liberty and equality.[1] The former principle is stressed in classical liberalism while the latter is more evident in social liberalism.[2] Liberals espouse a wide array of views depending on their understanding of these principles, but generally they support ideas and programs such as freedom of speech, freedom of the press, freedom of religion, free markets, civil rights, democratic societies, secular governments, and international cooperation.[3][4][5][6][7][8][9]
Liberalism first became a distinct political movement during the Age of Enlightenment, when it became popular among philosophers and economists in the Western world. Liberalism rejected the notions, common at the time, of hereditary privilege, state religion, absolute monarchy, and the Divine Right of Kings. The 17th-century philosopher John Locke is often credited with founding liberalism as a distinct philosophical tradition. Locke argued that each man has a natural right to life, liberty and property,[10] while adding that governments must not violate these rights based on the social contract. Liberals opposed traditional conservatism and sought to replace absolutism in government with representative democracy and the rule of law.”
That corresponds pretty well with what I’ve learned . . and I’m wondering why you keep using the term liberal in such an inverted way . . Is it just ’cause the TV talking heads do?
JohnKnight…..you mean to tell us that liberals in the USA want liberty and equality?!?
Have you been awake and coherent for any of the past decades?
By the by, “liberalism” does not equal “a liberal”. Much in the same sense that “Communism” (please do show us the wiki link that extolls the beauty and wonderment of a true Communist society where everyone gets the same of everything….koooooommmmbayahhhhhhhhhh!!!!!) does not equal “a Comminist”. You see, in Communist USSR, there were wait lines for toilet paper for the masses but what of the Politbureau???
Trot out your fancies, they dont meet reality.
The meaning of ‘liberal’ has indeed been inverted from the original definition.
Authoritarians have hijacked it.
Given that western democracies are the best embodiment so far of workable non-authoritarian societies then ‘liberating’ peoples from such a system is simply a return to more authoritarianism which is what modern ‘liberals’ are all about.
The same goes for the term ‘progressive’ which has been perverted in an identical manner.
George Orwell accurately described the process in his novel ‘1984’ and termed it ‘Newspeak’.
It is all around us and if left unchecked will eventually destroy the western democracies.
gaelansclark,
“JohnKnight…..you mean to tell us that liberals in the USA want liberty and equality?!?”
Yes, but many calling themselves liberals are not really liberal . .
If the same people took up calling themselves Saints, . would you grasp why I might question your calling them Saints?
Soooo …. they are saying that (A)GW is bad because it is delaying an ice age Catastrophe!
I would love to see a soup-to-nuts essay on the subject of warmer vs. colder.
Left out of many excellent discussions is the very pertinent question of just why warming is a thing to be feared, rather than welcomed.
Our planet contains vast areas that are perpetually frozen wastelands, cold enough to kill an unprotected person in minutes, and even larger areas that are seasonally so.
Contrast that with the fact that the hottest places on the Earth are survivable for indefinitely long with a pair of sandals and an adequate water supply.
With the possible exception of an encroaching sea, I have never seen any convincing argument demonstrating that a hotter world is a less hospitable place for life…human or otherwise.
This point should not be ceded any more than any of the other misinformation being promulgated by the warmista fearmongers.
spectacular graphics – particularly like the inkblot, etch-a-sketch of ‘predicted warming’
Great post but ultimately a waste of time because it’s preaching to the converted and won’t convince any warmists.
https://tamino.wordpress.com/2016/01/13/hottest-year-on-record/
Just because the horses aint drinkin’ is no reason to not lead them to the water.
Menicholas is right: the truth prevails more quickly if people take the trouble to tell it.
Says I, “You can lead a horse to water, but you can’t make it think.”
“the truth prevails more quickly if people take the trouble to tell it.”
Indeed.
And, in any case, it is my belief that there is a large ocean of humanity sitting between the scientific realists and skeptics on one side, and the CAGW alarmists on the other side, who are struggling to decide what to make of the whole thing.
Many have strong doubts about CAGW and alarmism in general, and this group seems to be growing in size and conviction.
But many others are in the sway and thrall if the warmista alarmists, and it is the constant barrage of misinformation and appeals to emotion that bring many to the beliefs they have.
So, IMO, it is vitally important to keep on keeping on, and to never let the fear mongers be the only voice heard.
And for your efforts in that regard, Viscount Monckton, I thank you.
Sincerely.
The horses have been led to the water countless times. The problem is, the wrong end of the horse is presented to the trough.
I received this from someone who studied politics at university
It was with a picture of a cat in a lab so I replied “and dogs can’t?”
I get the feeling that Tamino is either dishonest or is like an arts graduate and doesn’t appreciate the pitfalls of extrapolating data.
[Comment deleted. “Jankowski” has been stolen by the identity thief pest. All Jankowski comments saved and deleted from public view. You wasted your time, sockpuppet. -mod]
IIRC, a few years back someone posted a screencap of what tamino did to his (skeptical) comment – all the vowels had been removed.
Robert B:
I thought those “who studied politics at university” believe there are only THREE types of people in the world; i.e. those who can count and those who can’t.
Richard
Lol, all climate scientists are dyslexic. They adjust warming factors down (UHI) and cooling factors up. ( the ice age scare)
Well, not all climate scientist are dyslexic, but 10 out of 4 are!
There are 10 types of people in the world.
Those who understand binary, and those who don’t.
Great post!
Those are some really clear and striking graphics in this posting, Viscount Monckton of Brenchley. They are ideal for emailing to waverers in the debate.
Viscount Monckton, you NAILED IT!!
The abject failure is in not owning up to the prediction error. That is fundamental. In a similar vein, a dictator does not own up to shortcomings, an infallible church leader only admits shortcomings of a predecessor with a few century lag, and deadender advocacy groups assault those who even point out the suggestion of a discrepancy.
Nice summary. One suggestion: it would be instructive when you cite the predictions from the first three Assessment Reports to include the “certainty” value given. As I recall they started out around 90% and have become more certain with each report, even as your graphs show the mismatch between observation and projection has increased.
As Inigo Montoya once said about “inconcievable”, we can note of the IPCC and “certainty”:
Robert McCloskey Quotable Quote
“I know that you believe you understand what you think I said, but I’m not sure you realize that what you heard is not what I meant.”
Alan Watt,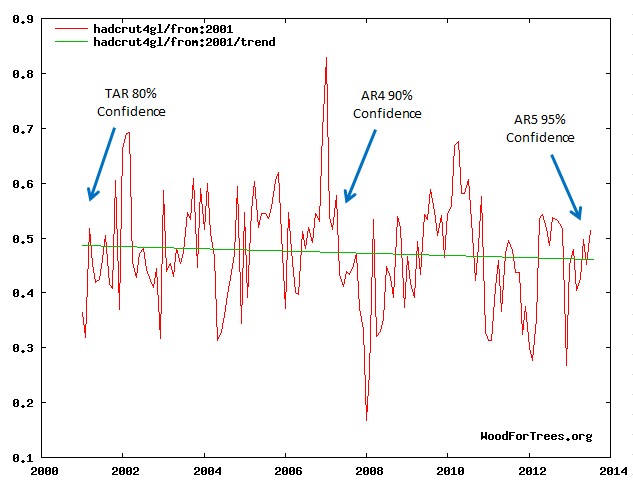
Did you mean this chart?:
Every graph in this post shows about .4deg C warming from 2012 to the present. How is the name of little green apples is that no warming for the past 18 plus years. It has obviously been warming for the past 4 years.
And if you’re going to go with the two point ( start/stop ) trend line BS don’t bother. That is a lie, and not remotely a trend. Heck if you want to do it with 2 points, go back to the Holocene Warming and you have not had any warming for 8 thousand years.
I am not a scientist, or even good at math. I also really hate what the alarmists are doing to science. But please, lets at least be honest: If there has been .4C warming in the past four years, surely one cannot say there has been not been any for18 plus years.
You really should spend some time learning before you continue to embarrass yourself.
Lord Monckton did not use a two point trend line.
Oh dear, perhaps you should have kept quiet
Mr Denier-o makes an ass of himself again, even though it has already been well explained to him that a least-squares trend is determined on the basis of every monthly data point in the interval, not merely the starting and ending points.
A rather high standard of scientific and mathematical knowledge is expected of commenters here. Try reading any elementary textbook of statistics to see how a least-squares trend is actually determined. Your suggestion that it is determined only from the start-point and endpoint is nonsense.
Also, read the head posting itself rather carefully. One needs at least 15 years of temperature data before one can start drawing tentative conclusions about trends, as NOAA’s State of the Climate report for 2008, cited in the head posting, made clear.
It should be blindingly obvious merely from looking at the temperature graphs in the head posting that there are various ups and downs in temperature during the periods shown. However, the trend line indicating which way temperatures have really moved over the entire selected period is obtained by straightforward calculation. I say there has been no global warming on the RSS dataset for 18 years 8 months because the trend over the past 18 years 8 months, as calculated from the data, is zero.
Thank you for the explanation. I have found a couple of links to learn more about least squares trends. My apologies for my lack, which has caused embarrassment.
Roy Danio said:
Thank you for the explanation. I have found a couple of links to learn more about least squares trends. My apologies for my lack, which has caused embarrassment.
I gotta say, that was pretty classy. Plenty of folks would have either disappeared, or called names.
Well said denio Stick around and learn with us.
Lord Monckton,
Maybe people do make asses of themselves but as a Catholic can I remind you of something that the Catechism of the Catholic Church states;
2478 To avoid rash judgment, everyone should be careful to interpret insofar as possible his neighbour’s thoughts, words, and deeds in a favourable way:
‘Every good Christian ought to be more ready to give a favourable interpretation to another’s statement than to condemn it. But if he cannot do so, let him ask how the other understands it. And if the latter understands it badly, let the former correct him with love. If that does not suffice, let the Christian try all suitable ways to bring the other to a correct interpretation so that he may be saved.’ (St Ignatius of Loyola, Spiritual Exercises.)
Thanks, Alba. The world has been putting that sentiment in my face for days.
I need the reminder.
Ps Good Job, R.D.
Roy …..negative 4 added to four equals…ZERO !!! You have to add together ALL the ups and downs..
I am not a scientist, or even good at math.
===============
a self evident truth
If there has been .4C warming in the past four years, surely one cannot say there has been not been any for 18 plus years.
====================
there is quite a large change in the average temperature of the earth every 6 months as we move closer and farther away from the sun because the orbit is not circular.
so, by your reasoning, you cannot say there is any warming of cooling longer than 6 months. How can there be even 1 year of warming, when after 6 months of warming the earth always starts to cool?
Thank you all for the answers, and I do understand fairly well now. However I think the argumentum ad hominem was a bit over the top. And if it makes you feel better to make me out to be stupid, I am glad I could help.
Hello Roy, a joke, if you will.
Super ego and ego walk into a bar, the barman says “i’d like to see some ID”
Cheers.
Mr Denio is in no position to complain about ad-hominem remarks. His original posting included the following sentence: “And if you’re going to go with the two point ( start/stop ) trend line BS don’t bother. That is a lie, and not remotely a trend.”
Accuse your opponents of lying when you do not know what you are talking about and you can expect them not to be too gentle with you in response. Better manners than yours are expected here.
True C.M., yet his honest, humble and exceedingly rare response at 6:09 deserves recognition.
Roy, I suggest an apology to Mr. Monckton is in order . .
[Comment deleted. “Jankowski” has been stolen by the identity thief pest. All Jankowski comments saved and deleted from public view. You wasted your time, sockpuppet. -mod]
I agree: Roy Denio displays a sincere desire to understand – a trait shared by real skeptical folks, layman and scientists.
Agreeing with
dbstealey @ January 13, 2016 at 7:13 pm
JohnWho,
Maybe yes, maybe no. Roy came on a bit strong at the outset and got a slap or two.
The mea culpa is good but the nom de guerre is suspect.
Though it is not the whole world, the USCRN (US climate reference network) another un-adjusted dataset shows NO warming for 10 years, the entire run of the data set.
Search WUWT for USCRN to see some nice graphs of the USA data.
Pristine rural sites, great sensors, NO adjustments allowed.
And, like the satellites—NO warming is observed.
Yes and it would be more accurate if his Lordship would say instead of “measured warming rates” – “reported warming rates”.
See, there measured (Raw) is not there reported (final).
DD More makes a fair point.
As always, an excellent and clear article from his Lordship.
Funny that the Noble Lord Monckton undermines the validity of terrestrial temperature measurements on the basis of their having been corrected when the UAH version 6 that he cites as evidence of lack of warming is the result of a very large correction of the previous UAH version. The UAH series has been the subject of repeated corrections over the last 25 years, so why Lord MOnckton trusts it I can’t imagine
Funny that you don’t understand the nature of the corrections made to the satellite records.
If you don’t trust advancements in temperature measuring technology, I suggest you ask every doctor you visit to use the time tested method when taking your temperature.
http://realclimatescience.com/2016/01/satellites-versus-surface-temperatures/
I’ll stick with the satellite approach.
repeated corrections
============
Anthony’s study of category 1-2 stations shows that UAH’s results do a much better job of capturing the true surface temperature than does GISS.
The problem for GISS is land use. The bulk of their US sampling is from areas that have been contaminated by land use changes. UAH also has land use changes, but a smaller percentage as compared to GISS. The problem is in trying to adjust out the effects of land use changes. Every adjustment adds uncertainty.
The category 1-2 station have almost no land use changes, and thus require no adjustments.
It may (or may not, as you choose) be worthwhile to make the distinction that UAH “corrects” the way measurements are made while NOAA “corrects” the measurements after they are made.
Roy,
If that was all the data we had i.e. 18 yrs worth, then it would show a zero slope line trend at MoB has stated. It is not a 2 point line. Surely you don’t think temps have to remain flat all the time to say there is no warming or cooling. You are right – temps have increased in the past 4 years. And if you said temps have risen since 1910 you would be right. There is no correct starting point for picking trends and you are right – go back a long time and temps may appear to have remained flat. But 18 years, and counting, is significant because the IPCC was very certain that by now temps would have risen.
This changes nothing because the climate scam isn’t scientific – it’s politics. Always has been. Hence the strength of presentations like this matter little, as they – alarmists, aren’t interested, aren’t listening and aren’t accepting of contrary scientific evidence that could compromise their political motives. Nice work as ever though, Lord M.
Cheshirered is wrong. It is always valuable to tell the truth to shorten the period when it is unheard.
For the illumination of Cheshirered and in support of the noble Lord; politics is most certainly influenced by strong, repetitive argument – as science should not. It may be, as you postulate, that “alarmists aren’t interested”; but alarmists don’t make policy, politicians do – like it or not.
Politicians pay attention – believe it or not – and are well aware of and interested in the work of Lord Monckton, Mr Watts et al. Do they “matter little”. I should say not. They matter a great deal.
Declaration of Interest.
I am a politician and (democratically elected) serving member of the ruling party of Great Britain.
I am delighted to say that the “political environment” (lovely couplet that one) has almost reached the point that questioning CAGW is no longer a statement of resignation from office. Almost. Keep it coming.
Of course Lord M you’re absolutely right there. Maintaining exposure of blatantly exaggerated projections IS essential, even if those currently in positions of influence or benefitting from the scam refuse to listen. It may take time but eventually the truth will out. Great job as ever.
Phil’s dad, Reminds of the saying “Telling the truth is an act of rebellion” hope the time comes soon when truth is the norm.
And some politicians are paying attention!
I thought Senator Cruz was very well informed on climate issues. I recently found out why. Here:
http://judithcurry.com/2015/12/10/reactions-on-the-senate-hearing/
Judith Curry says this:
“Senator Cruz seems very much into the Data, and generally knowledgable about the scientific process. One of his staffers is an avid reader of CE, WUWT and apparently Steve Goddard’s blog.“
Excellent post !
The writer’s prior post of 4th. December 2015 (“The robust Pause resists a robust el Niño Still no global warming at all for 18 years 9 months”) contains fifteen (15) bullet-point type, EXCELLENT, short paragraphs which I attach here.
May I say; there are none (to my knowledge) capable of writing or speaking with such clarity, fairness and such dignity.
START PASTE
The RSS satellite dataset shows no global warming at all for 225 months from March 1997 to November 2015 – more than half the 443-month RSS record.
.
There has been no warming even though one-third of all anthropogenic forcings since 1750 have occurred since the Pause began in March 1997.
The entire UAH dataset for the 444 months December 1978 to November 2015 shows global warming at an unalarming rate equivalent to just 1.14 Cº per century.
Since 1950, when a human influence on global temperature first became theoretically possible, the global warming trend has been equivalent to below 1.2 Cº per century.
The global warming trend since 1900 is equivalent to 0.75 Cº per century. This is well within natural variability and may not have much to do with us.
The fastest warming rate lasting 15 years or more since 1950 occurred over the 33 years from 1974 to 2006. It was equivalent to 2.0 Cº per century.
Compare the warming on the Central England temperature dataset in the 40 years 1694-1733, well before the Industrial Revolution, equivalent to
4.33 C°/century.
In 1990, the IPCC’s mid-range prediction of near-term warming was equivalent to 2.8 Cº per century, higher by two-thirds than its current prediction of
1.7 Cº/century.
The warming trend since 1990, when the IPCC wrote its first report, is equivalent to 1 Cº per century. The IPCC had predicted close to thrice as much.
To meet the IPCC’s central prediction of 1 C° warming from 1990-2025, in the next decade a warming of 0.75 C°, equivalent to 7.5 C°/century, would have to occur.
Though the IPCC has cut its near-term warming prediction, it has not cut its high-end business as usual centennial warming prediction of 4.8 Cº warming to 2100.
The IPCC’s predicted 4.8 Cº warming by 2100 is well over twice the greatest rate of warming lasting more than 15 years that has been measured since 1950.
The IPCC’s 4.8 Cº-by-2100 prediction is four times the observed real-world warming trend since we might in theory have begun influencing it in 1950.
The oceans, according to the 3600+ ARGO buoys, are warming at a rate of just 0.02 Cº per decade, equivalent to 0.23 Cº per century, or 1 C° in 430 years.
Recent extreme-weather events cannot be blamed on global warming, because there has not been any global warming to speak of. It is as simple as that.
END PASTE
PS: I do so agree that 1952 was a very good year.
Regards,
WL
Warren, you should check out all of his videos..Very informative and sometimes even funny !! IMHO
Thank you Marcus. I am aware of same and I agree !
Regards,
WL
From a blog post of mine 13 December 2015
A climate treaty based on a failed model, a victory for the political class
Scientific theories stand or fall based on the accuracy of their predictions. Exactly 100 years ago Einstein’s theory of gravity was welcomed because it corrected an inacurate prediction of Newton’s theory.
It’s worth staying the course to follow what I’m about to describe. The orbits of all our planets are nearly circular — but not exactly so. A circle has a single center; an ellipse has two ‘centers’ (focal points). Planetary orbits have the sun at one focal point of the ellipse (this was known even before Newton). This means that every orbit has a point at which the planet is farthest from the sun (called the aphelion) and a point at which it is closest (the perihelion).
The perihelion doesn’t stay in the same place with each succesive orbit. Rather it moves — this is called the precession of the perihelion. Newton’s formulation of gravity predicted a certain rate at which the perihelion of the planet Mercury moved between sucessive planetary orbits — which was not corroborated by actual measurement.
Physicists a century ago were seriously exercised by this inaccuracy. So how large was it? Quite small. Recall that a circle contains 360 degrees. A degree is far too large for astronomical work. So each degree contains 60 minutes and each minute contains 60 seconds. So a second is 1/3600 of a degree. The discrepancy was a mere 43 seconds per CENTURY.
Contrast this with the inaccuracy of the models of global warming, NONE of which predicted the current stability of global atmospheric temperature as measured by satellite for the past 18+ years. It’s not that CO2 isn’t a greenhouse gas the accumulation of which (other things being equal) should reflect radiation back to earth and warm the planet. No one disputes that. It is the magnitude of the CO2 effect and the importance of other factors determining global temperature which is crucial. Clearly global temperature should have continued to rise in the past 19 years as CO2 rose. This is what the models on which the Paris agreement is predicated predicted But there has been no rise.
It’s also fairly sleazy that all the ‘adjustments’ being made to temperatures as measured on the surface of the earth mostly adjust past temperatures downward to preserve the rise. Note that satellite temperatures are the most accurate we have and there is no way to adjust them. Unfortunately they just don’t go back that far.
It is far more accurate to say that global warming has stopped for the past 18+ years. Saying that it has paused implies that it will continue. Some 50 post-hoc explanations of ‘the pause’ have been published.
Bottom line: the concern over global warming is based on models which have failed in their predictions of the present. There is little reason to regard them as more accurate for their predictions of the future.
” It’s not that CO2 isn’t a greenhouse gas the accumulation of which (other things being equal) should reflect radiation back to earth and warm the planet. No one disputes that.”
Not to get into an old argument , but I think you will find plenty of people disputing that over at Principia Scientific !
Oooops . I probably should not have brought up that on Lord Monktons’ post , akin to farting in Church.
Sceptical is as sceptical does is my point .
Nick would also agree here since the lower Cl is negative. Here are the relevant numbers from his algorithm:
http://moyhu.blogspot.com.au/p/temperature-trend-viewer.html
For RSS:
Temperature Anomaly trend
May 1993 to Dec 2015
Rate: 0.772°C/Century;
CI from -0.030 to 1.574;
t-statistic 1.886;
Temp range 0.125°C to 0.299°C
So RSS shows no statistically significant warming for 22 years and 8 months.
For UAH6.0beta4:
Temperature Anomaly trend
Feb 1993 to Dec 2015
Rate: 0.822°C/Century;
CI from -0.014 to 1.658;
t-statistic 1.928;
Temp range 0.009°C to 0.196°C
So UAH6.0beta4 shows no statistically significant warming for 22 years and 11 months.
Well done, Werner.
Thank you!
“The West is purposelessly destroying its industries, …”
=============
Ain’t nobody stupid enough to push that button again, is there ?
It is undoubtedly the case that climate model predictions are not consistent with the observed (and adjusted) temperature data, and appears not to have improved since 1990.
But this is not evidence that emissions of greenhouse gases have no impact on climate – only that scientific knowledge of atmosphere, ocean circulation, feedback mechanisms etc are inadequately modelled or understood. Confidence claims and assurances that the science is settled are inappropriate.
The “pause” seems in large part an artifact of el nino in 1998. All that has been proven is that however many times the same data set is analysed, you get the same answer – just as you do if you take a little number away from a big one!
The open questions which need to be answered are:
– can the science be improved so that observations and models are more confidently aligned
– if there is an issue what is the best solution – reduce emissions , mitigate or ignore.
The pause does not depend on the 1998 El Niño spike, for that was offset by the 2010 spike. The models have failed.
Christopher, further to your comment about the spike due to the 1997/98 El Nino, that event was followed by the 1998/99/00/01 La Nina.
Cheers.
The slope for RSS is negative whether you start from May 1997 or November 2000. See:
http://www.woodfortrees.org/plot/rss/from:1997.3/plot/rss/from:1997.3/trend/plot/rss/from:2000.8/trend
“scientific knowledge of atmosphere, ocean circulation, feedback mechanisms etc are inadequately modelled or understood. Confidence claims and assurances that the science is settled are inappropriate.”
Very comforting to know how little uncertainty underpins A) dismantling the world’s incredibly inexpensive, efficient, and reliable fossil fuel-based energy production and distribution system, and B) condemning billions of human beings to a hopeless subsistence existence, and untold millions of the middle class to declining resources and security.
Brian, your response is the correct one. Terry admits that the predictions are inconsistent with observations, but seems perfectly ready nonetheless, to inflict Trillions of dollars of costs on the world economy. Just wave off the fact that the theory has failed the most important test of validity, and barge ahead regardless.
Ignore is the only policy based upon reality.
CO2 has risen monotonously since 1945. During that interval, the slope of temperature was strongly negative until c. 1977, then weakly positive until c. 1996 (or 1993-4), then slightly negative again since c. 1997.
And for this, we are to reduce CO2 emissions? Why, when the increase has benefited life on this planet?
“The simulations rule out (at the 95% level) zero trends for intervals of 15 yr or more, suggesting that an observed absence of warming of this duration is needed to create a discrepancy with the expected present-day warming rate.”
How did this get interpreted by alarmists once the pause was obvious? That the 95% confidence interval of a fit needed to be below 0°C/century and that the CI were 3 times as big as one would estimate assuming random noise. Basically, the world needed to be cooling at 2°C/century and heading for an ice age before they would conceded the models were flawed.
Feynman would expect the “profiteers of doom” to raise a white flag conceding falsification of their hypothesis. But, I think their hypothesis is clearly not even just wrong (falsified), it was only ever just an ages old mythological story signifying a deep yearning for guilt via an original sin meme.
Christopher Monckton, I thank you for your long term persistent efforts at keeping the story alive that there no significant change in GAT temperature for more than 1.5 decades and possibly more than 2 decades. It is a pleasant rhythmic drum beat you have established with your periodic posts on the topic.
John
Reblogged this on Public Secrets and commented:
The Intergovernmental Panel on Climate Change (IPCC) can’t get a single prediction about global warming right, and yet we’re supposed to take drastic, economically harmful action on their say so? Yeah, right.
“The IPCC published its First Assessment Report a quarter of a century ago…”
When phrased like that it gives one a real feel for how long this has been going on. And it also makes me realize how old I am getting, not that I needed to be reminded again.
To a fellow Floridian,
does it help to know that not all of that quarter century was this century?
97% of it surely.
JohnWho January 13, 2016 at 7:42 pm
“To a fellow Floridian, does it help to know that not all of that quarter century was this century?”
No.
Another excellent essay from this author, thanks.
Is Global Warming a Reality?
Part-I: The use of average of a wider area to study its impact on localized areas like agriculture is bad in science as the average present wide space and time variants in it. Global average temperature anomaly consist of wide variants in terms of climate system and global circulation patterns wherein wind speed and direction plays an important role. Such an average has no significance when we assess the impact on changes in weather, ice and in sea level and as well on water resources & agriculture. Though we are talking of anomaly, they present high variations in space and time: ocean to land; Southern Hemisphere to Northern Hemisphere; country to country and region to region within a country; location to location within a region.
Global warming is put on false foundations. In the literature, it is commonly seen that the word “climate change” is misused as de-facto “global warming”; and “the global [land & ocean] average temperature anomaly” is misused as de-facto global warming. Global warming refers to temperature while climate change refers to meteorological parameters, more specifically to precipitation and temperature. Precipitation presents fluctuations but they are region specific, following general circulation pattern-climate system. This modifies the temperature accordingly. Also, unusual cold & warm conditions prevailing over different parts of the globe are associated with local general circulation patterns and associated multi-decadal Oscillations/Southern Oscillation. For example, Polar Regions are affected by the frequency & duration of occurrence of circumpolar Vortex [6 months day and six months night] and in India the location of High pressure belt around Nagpur.
IPCC in its AR5 stated that more than half of the global [land & ocean] average temperature anomaly is associated with the “greenhouse effect” component [global warming is a part of it] and the remaining [less than half] component is associated with the “non-greenhouse effect” [ecological changes]. It must be noted the fact that: the urban-heat-island effect with its’ dense met network overemphasized and rural-cold-island-effect with less dense met network is underemphasized in the global [land & ocean] temperature anomaly and thus as a result it is over emphasized; but this is not so with the satellite data. The model based predicted temperature anomaly curves are compared with global average temperature anomaly but not with global warming component.
The consensus [the average] of the climate models used by the IPCC for their 5th Assessment Report shows no long-term increase in global precipitation from 1861 [the start of the mean of the climate model outputs] to 1999 [the end of the 20th century] though their global average temperature anomaly during the same period presented an increasing trend. However, increase or decrease in precipitation shows a decrease or increase in temperature. For example, during the 2002 and 2009 drought years in India, the annual average temperature has gone up by 0.7 and 0.9 oC.
Sea Breeze and land Breeze patterns over East and West Coasts of India are different. Here we can get the clue from the human comfort equation wherein under the same temperature & humidity conditions with changing wind speed [direction also play an important role based on the location] the human comfort changes. Same way, heat and cold waves, wherein the high pressure belt location and winds decide the direction in which they move and create the heat wave condition in summer and cold wave condition in winter. It is like advection of heat or cold based on winds direction & strength.
Though the precipitation presents fluctuations with different periods, in a rare case of solidarity they all present below or above the average precipitation condition. For example, in the Southern Hemisphere, the fluctuations, though, cycles varied from 52 to 66 years [the main cycle], they all coincidentally come under the below the average condition in 2013. This resulted above the average temperature anomaly in Southern Hemisphere. However, this will be part of natural variation superposed on trend.
The central England the longest continuous instrumental record of annual mean temperature shows 0.95 oC rise during 356 years [1659-2016]. The peak similar to that observed after 1990 was also presented after 1730.
NOAA satellite data of sea ice extent from 1972 – 1990 presented a fluctuation pattern but Northern Hemisphere fluctuation pattern is in opposite direction to that of the Southern Hemisphere fluctuation pattern. That means in one hemisphere when ice is diminishing in the other hemisphere ice is increasing. ARGO buoys data of 430 years show the Oceans are warming by around 0.23 oC per Century.
Part-II: There is a big discussion on: Why there are differences between surface temperature measured in Stevenson Screens and atmosphere as measured by satellite. Here we are not talking of station value but a region value and the averaging over that region. Also, we are talking of trend and not the fluctuation part. To get meaningful answer to such questions we must compare and explain for the causes of differences.
Reports state that “RSS satellite monthly global mean surface temperature anomaly data set shows no global warming for 18 y 8 m since May 1997, though one-third of all the anthropogenic forcing have occurred during the period of pause. The UAH satellite data showed a pause almost as long as the RSS data set. However, the much altered surface datasets show a warming rate 1.1 oC per Century during the period of pause for May 1997 to September 2015. During 1997-2016 the difference in the warming trend between RSS [satellite data] and GISS [surface data] is around 0.25 oC. Also, Global Temperature trends [Phil Jones] repeated with around 0.15-0.16 oC during 1860-1880, 1910-1940 & 1975-2009. Between 1979 and 2014 two volcanoes have occurred, namely Chichon in 1983 and Pinatubo in 1991 presented cooling effect prior to 1997/98 El Nino.
Part III: When the data presents different patterns, blindly fitting the data to linear, it gives misleading conclusions. For example, if we use the data of 1978 to 2015 [444 months or 37 years], UAH satellite data presents a trend of about 1.14 oC per Century. After seeing this trend that contains period before and after 1997/98 El Nino, I pointed out saying that while fitting such data, we must eliminate the anomaly associated with El Nino affect or fit the data sets prior and after El Nino periods separately to see the trend. I have seen this in https://kenskingdom.wordpress.com/ an article “Earth and Water” on January 13, 2016. The analysis of both the periods namely prior and after 1997 showed a “nearly zero trend”. Some mentioned that prior to 1997 volcanic activity cooled the temperature and after 1997 the raised temperature did not come down in surface data but in satellite data it did come down and followed a zero trend pattern. If the difference is zero at 1997, it is 0.25 oC at 2015. That is the difference in around 18 years is 0.25 oC and the surface data showed an increase of 1.1 oC per Century.
In the North Extra Tropics: the differences between the prior and after 1997 data series of 229 and 216 months data series with zero trend showed a sudden jump around 1997 by 0.48 oC on land 0.26 oC on ocean. This is the difference between volcanic cooling and El Nino warming on land and in ocean. The below table show the differences under three surface measurements and two satellite measurements in three different periods:
Measurements 1990-2015 1995-2015 2001-2015
[oC per Century]
Surface measurements:
GISS 1.71 1.51 0.76
HadCRUT4 1.62 1.52 1.11
NCEI 1.58 1.49 1.40
Average 1.64 1.51 1.09
Satellite measurements:
RSS 1.11 0.42 – 0.11
UAH 1.00 0.38 0.12
Average 1.05 0.40 0.00
After the El Nino in 1997/98 the global average temperature anomaly has gone up and maintained that trend under the ground based data series; but under satellite data series the temperature anomaly has come down and presented no trend. Under the Southern Oscillation, the temperature rises during El Nino phase and thereafter the temperature drops down and later recovers to normal condition. However, the changes in temperature associated with the Southern Oscillation and volcanic activity becomes part of intra-annual and intra-seasonal variations and thus their contribution to long term trend is insignificant.
From the above table it is clear that in all the data sets, they presented a decreasing trend per Century. Can we call this a non-linearly decreasing trend in the contribution of anthropogenic greenhouse gases effect?
Some argued that the atmospheric temperature anomalies are necessarily different from surface anomalies. Usually, atmospheric anomalies are less than the surface maximum in hot periods and higher than the surface anomalies in cooler periods. It is like night and day conditions. We need to average them and thus they should present the same averages both surface & satellite measurements.
Here we must remember the fact that the surface data does not cover the entire climate system and general circulation patterns. Particularly in land areas, the met stations are dense in urban areas and sparse in rural areas — this is clearly evident in Australia’s met net work and also the periods are different. Satellite data covers all the climate systems and general circulation patterns. Thus, surface data is more biased with urban conditions and thus expected high global temperatures. This is what the present scenario. Lowering the past data series and raising the current data series also add to this. Naturally surface data will be higher than satellite data.
What we need to address now is: study the local regional temperature patterns and look in to causes for regional and local differences. Then only it serves the needs of policy makers to common man. Without that, simply harping on global average will lead to disasters in coming decades with trillions of dollars spending on good for nothing theory of “Global Warming & Carbon Credits”.
Dr. S. Jeevananda Reddy
Formerly Chief Technical Advisor – WMO/UN & Expert – FAO/UN
Fellow, Andhra Pradesh/Telangana Akademy of Sciences
Convenor, Forum for a Sustainable Environment
Hyderabad, Telangana, India
jeevanandareddy@yahoo.com
…Need paragraphs, shorten with link. ( just a suggestion)
Dr. S. Jeevananda Reddy,
“What we need to address now is: study the local regional temperature patterns and look in to causes for regional and local differences. Then only it serves the needs of policy makers to common man. Without that, simply harping on global average will lead to disasters in coming decades with trillions of dollars spending on good for nothing theory of “Global Warming & Carbon Credits”.”
Thank you for trying to get the science back on track, and back to work trying to help real people with real need of useful climatology/meteorological information and research. No doubt some in the field have never stopped in the effort you champion here, and it’s a shame they are being drowned out by this grotesque caricature of real science they call “climate change”.
The big difference between alarmists and sceptics is how much we think we know. They know they know how the climate must change – we know they don’t know. But better still, we know we don’t know and that anyone who thinks they can predict the climate is a fool …
… except this year we have an el nino that failed to produce the expected warming. In addition there are two reasons to believe we are about to see cooling (low sunspot activity and what appears to be a 60year cycle in the climate which peaked around 2010.
So, 2016 appears to have the greatest chance of a trend as three different indicators suggest cooling. If however we do see cooling (in the only reliable temperature from the satellites), then there is a good chance of global cooling in the next 20 years. But given how small these global changes are compared to local effects, I doubt anyone will be able to spot it except by looking at statistics.
Their theory does not work because the primary feedback agent is probably albedo, rather than CO2. Prof Clive Best has a good review of the albedo feedback concept over on his site.
http://clivebest.com/blog/?p=7024
Climate ‘Computer modelling’
Posted on January 14, 2016 by madmikedavies
The blogosphere is full of claims of bad science and data corruption in the climate change machine. Most of these claims are sound and CAGW is mostly discredited.
To confound the public and compound their errors and bad science billions of dollars have been spent on supercomputers and computer models which continually make alarmist predictions which are at odds with the empirical observations.
The whole UN/IPCC proposals, claims and plans are built on this crumbling edifice. I came across the following quote which seems apt.
‘To Err is Human; To Really Foul Things Up Requires a Computer’
madmike
Yes the projected harms are worse science on top of failed science.
Instead of basing there projected harm’s on actual observations of both T change and harm flux, they are based on the modeled mean of consistently wrong in one direction climate models.
Inconceivable!##, but the shisters use falsified predictions to project harms. Models trump reality.
Additionally, even if greater warming ever manifests, there is much evidence that the projected harms are greatly exaggerated and the benefits largel underestimated.
What I don’t understand is I was able to dismiss the CAGW claims myself over 5 years ago just by examining the graphs in the Wikipedia article on Milankovich, and my knowledge of geology 101 and oscillators. How has this fraud persisted so long
When all the “solutions” to a problem all strangely converge towards socialism, then we don’t have science, we have a secular religion.
buckwheaton:
When all the solutions to a problem all converge towards socialism then we have additional evidence of the efficacy of socialism.
If there is a “problem” and if all its solutions converge towards socialism then any other conclusion is a non sequitur.
Richard
Real world data shows that socialism makes all problems worse.
MarkW:
Real world data shows your political opinions are wrong.
Richard
richardscourtney
He put the word solutions in quotes, and you know why, I believe . . And that makes what you just did . . well, you know what, I believe ; )
JohnKnight:
I do know what I did: I told the truth.
I don’t know – and I don’t want to know – what you “believe”.
Richard
I truly do not see the need of looking back only a decade or two or even three to show that models are wrong. Going from 1940 to the present only shows 0.5 C per century based on the surface data (which is likely in error on the high side anyway). The period of 1850 to present only shows less than 0.5 C per century. Picking a start point in the local low period (1945 to 1978) and going forward is cherry picking for a slope. There is no basis from the data for saying there is any measurable effect, even though it is likely there is a small human effect.
“…the mean of the three much-altered terrestrial tamperature datasets since May 1997…”
TAMPERATURE! I love it. Make it so.
That’s a beaut. I imagine the conversation between Karl and his superiors went something like that classic scene in Casablanca:
Captain Renault (Karl): But, I’ve no excuse to [alter the data].
Major Strasser (his boss): FInd one.
…
Rick (Dr. Curry): How can you [change the data]? On what grounds?
Captain Renault (Karl): I’m shocked, shocked! To find [that the two sea surface measurements differ in quality]. I’ll adjust the best ones to agree with the worst ones.
Can someone comment about creating a simple model which duplicates observed temperature data in terms of long term trend and month to month variability. When I create such a model, when the month to month variability is high enough to match actual data (using random values), the resulting trends are too great.
It would be interesting – and not to mention more relevant – to see the difference between the various temperature records and more recent models (e.g. AR5). The models in 1990 really aren’t comparable to current models, so its fairly unfair to keep using them as a comparison point. But I am really interested in seeing how the most recent models perform!
Cheers,
Benben
In response to the apical stone of an Egyptian pyramid, one needs a minimum of 15 years’ data to make a fair comparison between prediction and observation. So we can’t test the AR4/CMIP3 or AR5/CMIP5 models yet.
And it’s not unfair to show how wildly exaggerated were the original predictions on which the scare was based.
Dear Monckton of Brenchley,
Thank you for your reply.
The thing is, these projections from the 90’s weren’t much more than back of the envelope linear extrapolations. They weren’t used for anything else than to say ‘look, there might be a problem in this direction, more research is necessary’. And then a lot of research was done, and based on AR5 projections people still think there is a problem.
Obviously I really enjoy debating this with my colleagues, which is why I keep reading this blog. And just yesterday I spent an evening talking with a couple of policy makers in environmental policy on this topic. They said that current policy is made on the basis of current science, which is a valid point to make. If WUWT wants to make a useful contribution to the debate then critiquing AR5 is the way to go (and conversely, critiquing 1990 models weakens your argument).
With respect to having to wait 15 years… I agree that would obviously be best. But it’s not really a useful option when deciding what policy to make today (and it’s not a lot of fun either! I don’t want to wait 15 years to continue debating this with my friends). Looking at how accurate AR5 models are at recreating past climate patterns is a valid approach for getting a rough feel for how accurate they will be in predicting future trends. Important point: for policy purposes, climate models don’t need to be perfect, they just need to be good enough (e.g. economic models suck, but we still use them every day). The interesting question is, are AR5 models good enough for policy?
Also interesting would be to see how AR5 compares to AR3 and AR1. I’ve seen a lot of comments here that climate models have not become any better at all in the past decade. Is that actually true? Can we have a graph showing that? It would be a good stick to beat my science friends with!
Cheers,
benben
It’s not clear that Lord Monckton has always been so reticent about AR5. In connection with the Monckton et al. paper’s Fig. 6, which supposedly demonstrated the skill of the authors’ “irreducibly simple climate model,” he and his co-authors say of the “IPCC (2013 final draft)” that it projects a 0.13 K/decade trend for the remainder of this century, a trend that exceeds the 0.11 K/decade trend the Monckton et al. paper says the HadCRUT4 dataset exhibited for the last 67 years.
Unfortunately, that paper didn’t burden its readers with the forcing assumptions on which that graph was based, so its logic is, well, obscure. Since RCP 6.0 scenario’s trend for the rest of the century is over half again the trend it recommends be assumed for the last 67 years, for example, that graph’s trend comparison could be seen to suggest that if anything the IPCC may actually have underprojected the coming trend, not overprojected it.
Of course, the HadCRUT4 values have resulted from numerous trend-increasing adjustments, and one can always reach different conclusions by using different datasets, time intervals, and/or forcing values. The values mentioned above are merely the ones that the authors inexplicably thought demonstrated the superiority of their model’s skill over that of the models on which the IPCC relies.
Mr Born , having been caught lying in the opening sentence of a head posting futilely and ignorantly attempting to attack our paper in vol. 60 no. 1 of the Science Bulletin of the Chinese Academy of Sciences, and having been called out on his lie by numerous commenters, and having had the oseudoscience in that posting utterly dismantled, has been whining lay petulant ever since.
Let readers decide for themselves by downloading the paper from scibull.com. From the home page just click “Most read papers” and we are by an order of magnitude the all-time no. 1.
AR5 my dear sirs, AR5. I’m not saying anything about who is wrong or right. I’m just much more interested in seeing how modern models perform than how those really simplistic 1990’s graphs look!
Cheers,
Ben
I flubbed the tags in my last comment. It should have been:
So long as Lord Monckton continues thus to slander me in his attempts to divert attention from the substance, which in this case is that his paper’s purported demonstration of skill is anything but, I will continue to set for the facts that show that I’m not the one who’s the liar here.
The basis for his allegation is a passage in which I referred to a post of mine as a request and to his reply post as turning it down.
The issue was the contents of Monckton et al.’s Table 2. That table’s caption claims that all of its entries, which Monckton et al. refer to as “transience fractions,” were “derived from” a paper by Gerard Roe. Unless “derived from” means “inconsistent with,” however, that caption is a falsehood. Roe’s Fig. 6 shows that at every point in time after t = 0 the response value for a higher-feedback system must exceed that for every lower-feedback system. In contrast, the Monckton et al. table’s first-row entries dictate that in the early years the lowest-feedback system’s response exceed higher-feedback systems’.
Readers before me had placed those quantities at issue in blog threads in which Lord Monckton participated. Characteristically, however, any answers he gave were at best evasive; even in the face of objections that such values appeared to be non-physical he failed to explain how he could possibly have inferred from Roe et al. that the zero-feedback values would be unity for all time values.
To elicit a clear explanation, therefore, I cranked up the volume: I wrote a post specifically entitled “Reflections on Monckton et al.’s Transience Fraction.” In that post I explicitly stated that the manner in which Monckton et al. inferred that table’s values had not been made entirely clear.
So it was hardly a stretch for a subsequent post of mine to refer to that earlier post as a “request for further information about how the Table 2 ‘transience fraction’ values . . . were obtained from a Gerard Roe paper’s Fig. 6.” Nor was it inappropriate for me to characterize as turning down that request a reply post in which Lord Monckton merely repeated the paper’s contention that “The table was derived from a graph in Gerard Roe’s magisterial paper of 2009 on feedbacks and the climate” without explaining, as I requested, how that could possibly be true.
By hyperlinking the word “request” to it, I explicitly identified my previous post as the request. I similarly hyperlinked “turned down” to his reply post. No one who knows how to click on a hyperlink could have had any excuse for not knowing what those terms referred to.
Such is the forthright, above-board, completely transparent behavior that Lord Monckton has chosen to characterize as a lie. That he would thus resort to slander is an indication of how desperate he is to avoid a technical discussion, in which it would be apparent to anyone that the authors did not understand even their own “transience fraction” concept. His doing so is of a piece with the posts in which he claims to have “utterly dismantled” mine: it continues his practice of distortion, evasion, and misdirection.
Incidentally, “whining” is the term Lord Monckton appears to use to refer to rigorous arguments to which he has no creditable answer.
Thanks, Christopher, Lord Monckton. This is (as always) a very good essay.
You keep beating CAGW’s dead horse, but politicians keep riding it.
The only solution to a political problem is a political solution.
This is O/T but it’s just too amusing not to share …
http://www.telegraph.co.uk/news/weather/12099202/Snow-and-ice-as-Britain-freezes-in-first-snow-of-winter.html?frame=3549391
There is either a highly amusing typo, if that’s what it is, or a glorious pun in the description of your 3rd graph. when you refer to “terrestrial TAMPERature”. Surely that should be the new standard description of the land-based records, as they have indeed been extensively tampered with. 🙂
So, ‘fess up. Did you mean to say that, or was it accidental? If the former, chapeau!!!
TAMPERature was deliberate, and I’ve used it before, but it bears using again.
Ah, I see someone else caught that first, a few hours ago. Sharp eyes, Jeff.
This is probably offtopic, but I want to know.
Disclaimer: I’m no climate scientist. Neither am I a meteorologist. I try to think scientifically.
When I read Heinlein’s ‘Farmer in the sky’ in the eighties, his proposed heat trap sounded very
much like the now often heard greenhouse effect.
And it is very believable and also observable. With a cloud cover at night, it stays much warmer than with clear skies. This seems to imply that there is some kind of greenhouse effect.
Anyone?
Thanks, Lorenz
Of course there is a greenhouse effect. That is not really in question, or should not be. Given an atmosphere which absorbs radiation significantly in the band radiated by the surface, all things being equal, that atmosphere causes the surface to warm beyond what it otherwise would have been.
It is the “all things being equal” that is the rub. E.g., if increasing CO2 produces additional warmth, which then causes water to evaporate leading to clouds that shield the surface from incoming radiation, then the increase in CO2 may cause no discernible change in surface temperatures at all.
The Earth’s thermal regulatory system is very complex. They are many other potential feedbacks such as the cloud reaction suggested about which can ameliorate, or entirely cancel, any induced warming. So, it is by no means guaranteed that increasing concentration of a specific “greenhouse” gas will necessarily produce an increase in surface temperatures.
lorenz,
As I see this matter you ask about, it is entirely possible that CO2 in the atmosphere will have some effect on global average temperatures, but entirely impossible that human CO2 emissions would be a dominant effect. And unlikely to be more than a minor player in the vast exchange of energy between the Sun and deep space, via the Earth ; )
One detail (among many I feel) that perhaps might give you a quick grasp of the problem with attributing vast powers of change to CO2, is that it has been experimentally discovered/demonstrated that any such “interference” in the energy emissions from ground toward space, is limited and increases at an ever diminishing rate with additional CO2.
For a cloud cover analogy, imagine a thin cloud layer obscuring the moon. Say, 50% obscured on average. Another layer obscures quite a bit more, another quarter of the view, and then a significant eight . . but the next and next etc, fade into insignificance.
The CO2 gas itself has done it’s little warming thing for the most part, and we’re in fade away territory in terms of further effect, as I understand the matter. . Only through supposed “positive feed-backs” is it even possible to go scary with this. The trace plant food gas enraging the Furies and triggering a great flood, and whatever suits the current political narrative, is dependent on CO2’s effect getting amplified.
Mr. Monckton is essentially asking, as I hear him; to put it crudely ; )
*What if we don’t amplify that signal? What if it’s just “normal” physical matter, and causes a slight warming, and not Super Warming! . . The fart that ate the windstorm!!* ; )
Thanks for your explanations. I just had read the Wiki-articles on moon and mars. They both have an average surface temperature around -55°C. So that’s without an atmosphere. Venus, by comparison has around 464°C, with an atmosphere of quite different composition, and nearer to the sun.
So there IS a greenhouse effect, but the science is far from settled. (As if it ever could B-)
(You’re welcome of course, lorenz . . One thing about Venus that needs to be born in mind when discussing “greenhouse effect” is that the atmosphere there, is over 90 times as dense as here on Earth!)
It matters not one jot what climate models and imaginary, creative temperature definitions are fed into them can be massaged to say. A large part of what Lord Chris and subsequent respondents postulate is founded on changes these temperatures may cause in various parts of our Earth.
Fixation on an incorrectly selected parameter at least causes vast additions of hot air and friction to a political ploy without any obvious progress toward its final solution or extinction.
Temperature is a spatial and temporal property of matter. It may be measured in a clearly defined, finite, element of matter in equilibrium with its neighbours and that measurement taken as the average for that element. Mass or energy transfer to or from that element over time will change its temperature property. These transfers are the basis for our weather systems. The integral of weather is climate.
It beggars my belief that an imaginary global average temperature was selected as the prime driver of this socio-eco-political debate when the most likely scientific driver for it is global average heat (energy) content. Ask a global warming believer to define average global temperature and watch as apoplexy sends the questioner to Google where it will not be found.
Lord Chris’ fixation on the history of IPCC and temperature driven effects (or non-effects) at least allows readers to see the futility of the debate so far.
Whether we like it or not, the true-believers found their manufactured alarm on globally-averaged temperatures. Yet globally-averaged temperatures are not rising. They are worried, therefore, and rightly.
If the stock market continues its swoon, again, we’ll soon find our priorities.
It ain’t gonna be new methods to increase the price of electricity, which seems to be truly the last recession-proof game.
“They show ZERO variance from standard gas law. They prove definitively there is no previously un-noted effect. “
The “standard gas law” can get you the dry adiabatic lapse rate. That is the rate of change of temperature with altitude. Given a temperature at some altitude, then you can figure out the temperature at all altitudes. But, from where do you get that reference temperature?
It’s like saying the speedometer on your car gives you your velocity, so why would you need a GPS unit to tell you where you are? I traveled in a straight line from point A at uniform velocity V for time T, so I am now at point B = A + V*T. Fine but, where actually is B? I cannot know until you tell me where point A is.
A cherry-pick of a cherry pick.
You are starting off with the result you want, then picking the period on that basis.
HT, Lord Monckton always posts a wealth of detailed evidence. You only post your baseless opinion. That’s really lame.
You make assertions, and expect readers to accept them? Why? You have no credibility; those are just your opinions. Without any evidence, facts, or data, your assertions mean nothing.
You can’t understand that, can you?
Never underestimate the deviousness of your opponent, they might just be trying to SMOKE you out.
dbstealey.
You do know what a “cherry pick” is, don’t you?
Now, if you were to go about this like a true skeptic, you would counter my argument by demonstrating why it isn’t a cherry pick.
This is a good video to watch for background.
Harry Twinotter — Though I did not understood the issue from the video, I would like to give my experience on the satellite data.
Indian Meteorological Society [IMS] organizes a national symposium “TROPMET” since 1992. In 1995, the IVth in the series was conducted at National Remote Sensing Agency [NRSA], Hyderabad during February 8-11, 1995. The symposium proceedings were published at:
R. K. Gupta & S. Jeevananda Reddy, [Edts.] 1999. “Advanced Technologies in Meteorology”, Tata McGraw-Hill Publ. Comp. Limited, New Delhi, 549p.
In this two of my articles are also included, with titles “Advanced Technology in Disaster [Due to Agricultural Drought] Mitigation: An African Experience” [9-16 pp] and “Problems and Prospects of the Application of Meteorological Data in Agriculture: Models and Interpretation of Results” [419-426pp].
Out of nine sessions, three sessions allocated to space measurements and applications. Several scientists from several institutions presented papers using such data. During the presentation sessions one scientist who was associated with the institution that is responsible for decoding the data from space instruments, observed that the data is not correct. Then I questioned him, if the data is not correct why did you release such data for research by institutions? When you detected the errors, you should have informed the groups whom you supplied the data. But, he did not responded to it. Later, I came to know that this is game of politics.
International agency in the same way, the satellite temperature data was put on the internet and later withdrew from the internet as this data showed far less than ground based data. In fact, I used this data in my book published in 2008 [available on net].
In ground based average temperature is derived from maximum and minimum, thinking it followed a sine curve [with day and night length are the same. In reality it is not so. If you cut the hourly data from the thermograph, the average may or may not be equal based on the skewness from the sine curve that vary with the cloud conditions and changes in the duration of day & night.
Dr. S. Jeevananda Reddy
“In ground based average temperature is derived from maximum and minimum, thinking it followed a sine curve [with day and night length are the same. In reality it is not so. If you cut the hourly data from the thermograph, the average may or may not be equal based on the skewness from the sine curve that vary with the cloud conditions and changes in the duration of day & night.”
I am very happy to see you make this point, Dr. Reddy.
This very obvious detail has bothered me for a very long time, and we rarely see it mentioned.
But I think it is only one of many problems with the surface data, and using such to derive a so-called global average temperature.
The furtively pseudonymous “Harry Twitotter” appears, as usual, to be unable to read. The graphs presented in the head posting give results for all five principal global-temperature datasets (no cherry-pick there, then), and for three separate time-periods whose start-points are, respectively, the years of publication of the First, Second and Third ASSessment Reports of the IPCC, whose predictions the head posting tested against the measurements of the five global-temperature datasets. No cherry-pick there, then, either.
The fact is that the world is not warming anything like as fast as predicted. There is no climate crisis. And that’s that.
So, increasing CO2 in the atmosphere 40% from 280 to 400ppm since industrialisation doesn’t increase the energy retained by Earth, causing climate change.
I’ll be enormously reassured when nearly every climate scientist and informed scientist and scientific society on the planet explains why.
Dennis Horne,
Explain what dark matter is. What mediates it? After all, it comprises most of the universe.
What, you can’t explain it? That’s OK. You don’t have to explain something to know it has an effect or not. You just have to observe.
You commented on the observation that CO2 has increased by 40%. But global warming stopped many years ago.
What do you make of that? Looks like those climate scientists and scientific societies were wrong, doesn’t it?
So, who are you gonna believe? Those scientists? Or your lyin’ eyes?
Good gracious a dark-matter man! I would expect added greenhouse gas to add energy. Indeed, if it wasn’t found I would assume difficulties with detection and measurement. Anyway, the results are in.
http://berkeleyearth.org/wp-content/uploads/2016/01/Annual_time_series_combined1.png
http://ds.data.jma.go.jp/tcc/tcc/products/gwp/temp/ann_wld.html
Who to believe? Gosh, I wish all questions were so easy to answer!
Interesting result from Berkeley Earth.
For 2015, they are saying it is a clear record this time. No “statistical ties” and stuff like that.
Oh well I will wait and see what spin is put on it. The usual tactic is to just deny the data, followed up by some sort of Conspiracy Theory.
Ah, now any evidence contrary to HT’s assertions is a “conspiracy theory”.
Got it.
Satellite data shows that 2015 is nothing to write home about. But spin that any way you like…
dbstealey.
So you are unwilling to discuss the video. Or the results from Berkeley Earth.
Got it 🙂
otterboi, I don’t watch your videos. Waste of time. As for Berkeley Earth:
Wake me if you get it…
You commented on the observation that CO2 has increased by 40%. But global warming stopped many years ago.
Then this ‘allegation’ must be of interest to you. CO2 increase and global surface temperature increase since 1958 are correlated at the >99% confidence level:
http://www.woodfortrees.org/plot/gistemp/from:1958.16/mean:12/normalise/plot/esrl-co2/mean:12/normalise
Dennis Horne says:
I would expect added greenhouse gas to add energy.
And I would think you need to get educated on the difference between insulation and ‘adding energy’. CO2 does not “add energy”.
Next, your graph is simply an overlay of CO2 and temperature. It doesn’t show “correlation” like you think it does.
As a noobie here, you probably don’t know that changes in temperature cause subsequent changes in CO2. So I suggest reading the WUWT archives for a few weeks, at least. Use the keyword “CO2”. You will find lots of information on causation.
Then come back and we can discuss the issue as educated folks.
Dennis Horne –
“I would expect added greenhouse gas to add energy.”
No, at best, you would expect them to trap more energy. And, perhaps you would expect a heavier object to fall faster than a lighter object. Or, that light beamed from an object moving toward you would travel faster than from an object moving away from you. Expectations come in all shapes and sizes. Not all of them pan out. That is why the scientific method demands that you confirm your expectations experimentally.
There are several avenues for feedback responses which could render any warming tendency of additional CO2 null and void. There are convective flows of energy past the filter of IR radiative gases in the lower atmosphere. There are cloud responses, vegetative responses, and others.
The Land-Ocean plot you show is doubtless fudged towards the end. Sure, you can claim it isn’t, but we’ve seen too much of that activity to have any confidence in that claim. Moreover, the warming trend from 1910-1940 is every bit as rapid as the trend from 1970-2000, yet the rate of CO2 emissions was not anywhere near the same in the two periods. The growth was not exponential – it was clearly delineated into two separate regimes in the two periods – so you cannot argue it is just a logarithmic response.
So, not only is it not proven that CO2 has been a significant driver of temperatures, it is not at all proven even that it can be one. Believing that it has and that it is, is a statement of faith, not of science.
“CO2 increase and global surface temperature increase since 1958 are correlated at the >99% confidence level:”
Nonsense. You can make any two trending variables with minimal curvature of the same sign look similar to one another by scaling and offsetting – just do a linear regression on the one with respect to the other. What is difficult it getting correlation between all the peaks and valleys, as here. That plot shows that CO2 concentration is the effect, and temperature is the cause.
MODTRAN calculations quantify that increase in energy being trapped, and when you add H2O to the mix CO2 effectively becomes irrelevant. Do the calculations yourself. BTW 600 million years and no Co2 driven catastrophic warming. I have 600 million years of evidence, you have the opinion of “experts.”
http://www.sustainableoregon.com/_wp_generated/wpcdf36281.png
Lord Monckton, have you ever tried to identify a CO2 signal? The problem I see with all the Climate Science is that they focus on average warming. CO2 impacts warmning through trapping radiated heat from the earth. Therefore the only identifiable warming due to CO2 would be at night, when the earth is cooling. During the daytime visible light greatly overwhelmes anything CO2 could even hope to do. Record high temperatures are never caused by CO2, trapping heat can never raise the temperature above the temperature of the radiating body. CO2 in other words can only slow cooling, it can never warm something above the temperature that already exists. Insulation doesn’t warm, it slows cooling. The most likely Co2 signals would be over the dry deserts and dry antarctica, where H2O has been removed from the equation. The CO2 signal would be a relative warming of night relative to the daytime. Is there any data showing that deserts have been cooling less with increases in CO2? Has the spread between day and nightime temperatures been narrowing? Is the slope of peak nightime temperatures VS peak daytime temperatures been increasing? Is there any evidence that areas with a dry atmosphere have seen nighttime temperatures increasing? That would be an interesting study. A graph of Sahara/death valley/Antarctica night time temperatures vs atmosperic CO2 would be a good study.I would have thought that that experiment would have been the first study by the climate alarmists to prove thier point.
Antarctica is not co-operating! It has been cooling for the whole UAH satellite record. See:
http://wattsupwiththat.com/2015/10/23/polar-puzzle-now-includes-august-data/
And for the reason for this, see:
http://onlinelibrary.wiley.com/doi/10.1002/2015GL066749/full
“How increasing CO2 leads to an increased negative greenhouse effect in Antarctica”
“For this region, the emission to space is higher than the surface emission; and the greenhouse effect of CO2 is around zero or even negative, which has not been discussed so far.”
You’ll never see any local difference effects from CO2 warming. The GHG forcing is about 2 W/m2. That is enough to warm the whole column above of air at about 0.01°C/day, if that were all it did. That doesn’t give an ECS – most of the heat actually ends up in the ocean. But it doesn’t warm just that column; air doesn’t stay still. The wind is blowing through all the time. The heat is redistributed much too fast for differences in forcing to show.
This is a “Just So” story.
Not sure that is true at all. H2O masques the impact of CO2 in many areas. With or without CO2, the same amount of heat would be absorbed, H2O simply saturates the GHG effect. H2O certainly shows localized effects. If in fact CO2 did cause any warming, it certainly would show localized warming where it is the dominant GHG, given that CO2 is evenly distributed around the world. While areas with H2O may not warm due to the additional CO2 because it those areas already are saturated, the areas with nothing but CO2 should show an increase with additional CO2. If that isn’t the case, then there is a serious problem with the GHG theory. Why wouldn’t an increase in CO2 not result in warming if in fact the GHG effect is real? And is the local area only has CO2 as its GHG, why wouldn’t it show warming? Once again, CO2 is a constant. Any increase in the constant should shift the curve upward.
co2islife.
“CO2 in other words can only slow cooling, it can never warm something above the temperature that already exists.”
This is incorrect. CO2 does cause warming by modifying the heat balance from energy coming in, and energy going out.
You are correct about one thing. Nights are warming faster.
Actually, the excitation-deexcitation collisions between CO2 molecules and photons in its principal absorption bands emit heat directly, as though a tiny radiator had been turned on. it is by this method that the atmosphere is warmed. However, determining how much warming will result from the sum of all such collisions is an extremely complex question, and it is evident that the models that predicted high climate sensitivity were wrong.
If and when warming resumes (theory leads us to expect that eventually it will), the reduction in warm-to-cold differentials, of which the more rapid warming at night is an instance, will be likely to have the effect of reducing storminess, especially in the extratropics. One foreseeable consequence is that the infestation of useless windmills will serve to slow storm systems down, causing precipitation events to become more severe.
HT sez:
CO2 does cause warming by modifying the heat balance from energy coming in, and energy going out.
Aren’t assertions great? Anyone can make them. No validation needed.
I am going to assert that a warmer world will be a wetter world, and a warmer and wetter world with more CO2 will lead to an explosion in agricultural productivity.
Show me any example where in a desert with no wind to bring in heat that the nighttime temperature is ever greater than the daytime temperature. Just show me one single example where you can show me that the air is of a greater temperature than the radiating body. Just one.
Correction, Nights aren’t “warming,” they are cooling less. The entire AGW theory is based upon visible light warming the earth during the day (incoming radiation which is tranparent to CO2), and then CO2 trapping a small fraction of the outgoing IR radiation between 13µ and 18µ. The very fact that people beleive that by trapping 10% of the IR spectrum can warm something above the temperature of the radiating body is beyond me. Somehow energy must be created somewhere somehow. This chart alone should give everyone pause as to the AGW theory, as should simple MODTRAN calculations where H2O is introduced to the atmpsphere.
http://www.ces.fau.edu/nasa/images/Energy/GHGAbsoprtionSpectrum.jpg
Monckton of Brenchley.
“One foreseeable consequence is that the infestation of useless windmills will serve to slow storm systems down, causing precipitation events to become more severe.”
I have not heard this one before – what an imagination you have.
Monckton of Brenchley – I have come to the same conclusion as you about predictions by climate models and have suggested that the entire modeling operation be shut down. They have never been able to get any of their predictions right since Hansen introduced climate models in 1988. He had three versions, A, B, and C. A was “business as usual,” meaning an attempt to track coming real temperatures until 2019. The other two were “guess what” models showing benefits of emissions control. By 2005 his attempt to predict real temperature was already 0.7 degrees higher than observed reality and was still going up. They have had 27 years by now to improve on Hansen, have graduated to supercomputers and million-line code, and still their predictions are widely off the mark. Unfortunately, they pretend that these results mean something, give them to politicians who accept them as scientific truth, and they get used in making climate policy. Since climate data do contain noise it interferes with understanding of the actual temperature trends that climate follows. As a result, some of your temperature graphs are right and some are wrong because you are not aware of the existence of a step warming that starts in 1999. In three years it raised global temperature by a third of a degree Celsius and then came to a stop in 2002. It is not greenhouse warming but has an oceanic origin, related to the large amount of warm water carried by the super El Nino of 1998 that just departed. As a result, all of the twenty-first century is warmer than the twentieth, except for the super El Nino of 1998. No fitted curve should pass across the dividing line established by the step warming. Even Hansen could see the difference by looking at the first decade of the twenty-first century and quickly pronounced the temperature rise as the work of greenhouse warming. The satellite era begins in 1979 and from that point to the beginning of the super El Nino there exists a hidden hiatus. It is hidden only by official ground-based temperature curves but visible in satellite curves and visible even in Anthony Watts’ corrected ground-based curves. There is no temperature rise during this period but you don’t know this because it has been covered up by a fake warming they call “late twentieth century warming.” I discovered it in 2008 and even put a warning about it into my book in 2010. GISS, NCDC and HadCRUT3 are all involved in this plot as traces of common computer processing they share in their publicly available temperature curves testify. As a reault of this arrangement, the super El Nino sits between two hiatuses, one in the eighties and nineties and clearly visible in satellite (but not ground-based) data, and the current one that starts with the twenty-first century. The super El Nino itself is not part either one but behaves as though it belongs to the current hiatus. By accident, both the current hiatus and the hidden one in the eighties and nineties are both 18 years long. Oh, one more thing. During a hiatus the greenhouse effect stops working. The time taken up by a hiatus must be subtracted from the time that the greenhouse effect can use.
Mr Arrak is referring to what is known as the “Singer Event”, after Professor Fred Singer, who first pointed out that there had been little warming from 1979-1997 and none from 2001 to date, and that just about all the warming that has arisen occurred from 1997-2000, peaking with the great el Nino.
I wrote a column about the Singer Event some years ago.
It does not alter the fact that the usual suspects simply use linear-regression trends without getting into complications of that kind, however interesting. My limited ambition in these postings is to demonstrate that, even by their own methods and using their own data, even after it was tampered with, the predicted warming rates have not occurred, a fact which – to any rational observer – would raise serious questions about why the models are exaggerating climate sensitivity.
Indeed. We’re all here to learn; I certainly don’t know much.
How Reliable are Satellite Temperatures?
Dennis Horne,
Andy Dessler lives off the government’s global warming scare, so it’s not unexpected that he would try to denigrate satellite data. Another commenter wrote this a few days ago:
…satellite data has…
(1) the most uniform global coverage
(2) the advantage of minimizing/ignoring localized temperature artifacts
(3) undergone more scrutiny than any other dataset
(4) been the most transparent with data and methodology
(5) been essentially independently-verified by the analysis of multiple organizations (RSS and UAH) which at times have been somewhat “rivals” at odds with each other.
Why would you use anything else for 1979-present (and future)?
And satellite data has been coroborrated by seventeen thousand radiosonde balloon measurements, which show the same flat temperature trends.
Lately here we’ve seen some attempts to claim that satellite data is questionable. But it is the most accurate global temperature database in existence, far better than any land based records. Satellites are very expensive to launch and maintain. Why would successive governments spend that money if the data was wrong? And both RSS and UAH are closely scrutinized by each other because they are rivals.
The attacks on satellite temperature data all come from people who feel threatened by the failure of their ‘dangerous man-made global warming’ predictions. If you understand human nature, you will understand their motivations.
Until and unless satellite data can be shown to be wrong, it will remain the gold standard of global temperature measurements. No one has shown it’s wrong yet.
Arno,
You write “During a hiatus the greenhouse effect stops working.
This cannot be. If the greenhouse effect came to a full stop, we’d have similar temperatures as the moon has. Please explain
“The IPCC published its First Assessment Report a quarter of a century ago, in 1990”
Jesus … I remember NOBODY gave a sh** about it, in those olden days. The Iron curtain just had fallen, everybody was confident in a new happy era, without fear of a nuclear war. Commies were aghast.
Nostalgia …
dbstealey, Bartemis
I wouldn’t visit your sandpit without a bucket and spade and the right answers.
Incidentally, stopping energy escaping a system has the same effect as adding it. Which is why lagging your hotwater tank reduces your bill. Isn’t it.
And it’s well known changes in temperature cause changes in CO2. It’s equally well known that an increase in atmospheric CO2 causes a rise in temperature.
World governments accept the climate scientists and scientific societies are right. The only thing that will change that is the temperatures dropping and the ice growing.
We’d all welcome that. But it ain’t happening.
You might suppose that you know that an increase in atmospheric CO2 causes a rise in temperature, but you forgot to impart that knowledge to Mother Nature.
CO2 took after World War II, but the planet cooled so much over the next 32 years that scientists thought they could see the ice sheets once again looming over the northern horizon. Then, quite accidentally, a continued monotonous rise in CO2 coincided with natural global warming from 1977-96. Since then CO2 increase has if anything accelerated, without any gain in global temperature.
So, while CO2 is a GHG, its increase in the air doesn’t necessarily correlate with rising atmospheric temperature in the real world climate system. Indeed for 50 of the past 70 years and counting, it has not done so.
Sorry. Meant took off after WWII, the Big One.
“Incidentally, stopping energy escaping a system has the same effect as adding it.”
When there is a persistent inflow. But, you have not established that the aggregate response is to significantly modulate the flow. You have merely made a leap of faith.
“It’s equally well known that an increase in atmospheric CO2 causes a rise in temperature.”
Sorry, no. It is not known that, in the present climate state, an incremental increase in atmospheric CO2 concentration necessarily results in an incremental rise in temperature. It is a conjecture.
“World governments accept the climate scientists and scientific societies are right.”
Argumentum ad populum.
“The only thing that will change that is the temperatures dropping and the ice growing.”
Antarctic ice has been growing for some time. Arctic ice has been rebounding for 5 years now. And, the RSS satellite temperature set shows a decline over the past 18 years, 8 months. Get ready for La Nina’s revenge.
Re. the argumentum ad populum, not only is this assertion a logical fallacy, but governments have a vested interest in higher taxes and more control. Nor do all regimes buy into the scam.
Dennis Horne says:
…stopping energy escaping a system has the same effect as adding it… an increase in atmospheric CO2 causes a rise in temperature.
Well, you’ve just falsified the CO2 conjecture.
And:
World governments accept…
…money for the ‘man-made global warming hoax.
And:
…temperatures dropping and the ice growing. We’d all welcome that.
Speak for yourself. Warm is good. Cold kills.
“We’d all welcome that. But it ain’t happening.”
I know that there are plenty of people who would not welcome that.
Being proven wrong at this stage will be career death for a lot of people, among other reasons.
As for cooling…stay tuned.
The rotund female has yet to exercise her vocal cords.
World governments believe the scientists and accept the science. I call that a victory for science and common sense.
I call it Orwellian.
Stalinist. Lysenkoism redux.
World governments believe…
So do you. And some folks believe in the Tooth Fairy.
The CO2=AGW conjecture is very weak, despite being investigated for over a century. Any effect is simply too small to measure, making it a complete non-problem.
That’s science. But then there’s politics…
Before the 1980s, hypothetical AGW was considered beneficial, as indeed natural global warming since the depths of the LIA during the Maunder Minimum has been. Arrhenius a century ago and Callendar in the 1930s thought that AGW would be a great boon. The already failed hypothesis was also considered a good thing when revived in the 1970s, in order to counteract then worrisome global cooling.
More CO2 is also a good thing all on its own, having greened the planet remarkably since 1945.
WTF does “World governments” even mean ?
It feels like wolves herding sheep to me.
Imagine the One World Order Hitler would have implemented. Imagine Rome under Tiberius, Caligula and Nero. Imagine Russia under Stalin, and N Korea under Kim Jung. Imagine France under Robespierre. Why people love to empower Governments over the indivudual is way way way beyond me. Under a One World Government, who would be there to stop it when it went wrong?
Mr. Horne,
There is no evidence that carbonated oxygen has ever caused any warming of the earth’s “atmosphere”: none whatever.
If you have any such evidence, perhaps you would be so kind as to give it. Thank you in anticipation.
WL
The selective moral outrage is laughable. A 2 year old could spot the issues with ground measurements. NASA, and NOAA and others have published temperature graphs far before the Satellite data, and anyone can compare what was published in the past and what is published now. The IPCC replaced its original temperature graph with the Hockeystick. The Climategate emails detail outright fraud in the temperature reconstructions, and these people are attacking satellite data? What a joke. Anyway, this video should backfire. You have insiders claiming fraud in the temperature reconstructions. You have Michael “blame others of what you are guilty of” Mann, attacking the Satellite Data. There should be a Congressional investigation into both data sets, tested with double blind methods to get to the truth. These climate “scientists,” by shooting in the tent, have exposed that there is outright corruption in the field of climate science. This needs to be investigated, and Michael Mann provides the justification. Clearly something is amiss in the field of climate “science.”
https://youtu.be/UVMsYXzmUYk
Peter Sinclair, AKA: “potholer” is a serial propagandist like John Cook. He has no clue about real science.
These rent-seeking scientists are attacking satellite data because it falsifies their hoax. They all avoid the fact that radiosonde balloon data shows the same flat trend as satellites.
By the alarmist cult’s own argument, it isn’t the global temperature that matters, it is the trend: is the planet warming, cooling, or what? Satellites and balloon data show the trend is flat:
The satellites and radiosonde data is in agreement. Dessler, Sinclair, and most of the other alarmist scientists are lying. For money. Big surprise, huh?
That is the response I was hoping for, and why there needs to be an investigation. I want to see the people like Michael Mann defending the ground measurements and adjustments, while claiming that BOTH Sattellite and Balloon measurements are incorrect. That is the smoking gun trial I would like to see to put all this nonsense to bed.
Both data sets can’t be right. One set of data is confirmed by another, and the third is not. In real science the confirmation tips the scale. BTW, no independent researcher before Michael Mann ever reconstructed a hockeystick, his was the first that rejected all temperature reconstructions before him. No one would ever be able to reconstruct the Hockeystick when simply given raw data. His efforts to “hide the decline” and “nature trick”, and his ability to pressure and collude with other researchers is unique to his efforts. They could never be independently reproduced.
WUWT, would you commission a series or articles where Dr Spencer and Christy can refute these claims? I’d like to know the truth. Was the phase off, and are they still using data that hasn’t adjusted for that issue?
https://youtu.be/UVMsYXzmUYk
co2islife,
If you’ll notice, Dr. Christy’s comment was carefully cherry-picked to leave the impression Peter Sinclair intended. Same with the other honest scientists.
The only question that needs to be asked is whether the trend in global temperature is rising fast, as Michael Mann claims. But Mann also says that 2015 was the “hottest year EVAH!
But look at the satellite (RSS) chart below. We see that 2015 was far from the warmest. Conclusion: Michael Mann is lying.
http://realclimatescience.com/wp-content/uploads/2015/06/ScreenHunter_9549-Jun.-17-21.12.gif
Clearly one must be lying, but are the challenges about RSS valid? Is there truly a problem with the data that hasn’t been fixed?
co2islife,
Look at the chart. Even if satellite temps were all off by some small fraction of a degree, how can Mann claim that 2015 is the hottest year ever?
Mann attempted to erase the LIA and the MWP. You’re still willing to give him the benefit of the doubt? Hey, maybe all those women were lying about Bill Cosby, too…
@CO2is life,
Just look at the explanations given by the video’s various warmist spokesmen. Are they speaking the truth, as you understand it? For example, watch Carl Mears @~5:00 in the video… he says that “the pause” is counted starting in 1998 because of the huge El Nino induced temp upswing, i.e. to purposely mislead- make a pause where none exists. We know that isn’t true. There are far too many threads here at WUWT which cover that topic thoroughly, to fall for that mischaracterization. The pause starts now and goes backwards until it doesn’t work anymore. That’s just one of the many inaccuracies in the testimony of the people in this video.
You might notice that the speakers never go so far as to say that the satellite data is wrong, just that errors had been made in past (now corrected) and they attempt to make it sound like the satdat is unreliable.
This video repeatedly excerpts the recent Senate hearings and shows the partial testimony of a US Admiral, tasked with determining if climate change is “real”. When the Admiral was prompted by a couple of Dem. Senators, the Admiral did not state that there is a problem with the satellite data. He went on and on about how difficult the problem is, as if he were trying to get the listener to infer that the problems were insurmountable, or led to bad conclusions, but he would not cross that line into saying the satdat was not up to snuff, not the best data we have. He repeatedly would not go there, speaking an untruth. He DID NOT say the satellite data, or derived conclusions were wrong.
There are too many inaccuracies made by the speakers… too many to view them as anything other than an attempt to mislead the viewer — to promote the warmist agenda.
However you did not show all of 2015 since the slope is no longer negative from January and the last few months were missing.
With all due respect, you really should update your graph to show RSS was the third warmest in 2015. With mean of 5 and a start in May, you get the following:
http://www.woodfortrees.org/plot/rss/from:1997.3/mean:5/plot/rss/from:1997.3/trend
☺
Werner,
You’re right. I had saved that screencap in a folder, and it’s not quite all of last year. This one is, and 2015 is still not “the hottest ever” as Mann said. It looks like only the 3rd or 4th warmest year.
It is third in both RSS and UAH6.0beta4.
Here are the top 14 in RSS including 2015:
1 1998 0.550
2 2010 0.468
3 2015 0.358
4 2005 0.331
5 2003 0.320
6 2002 0.315
7 2014 0.254
8 2007 0.252
9 2001 0.247
10 2006 0.232
11 2009 0.218
12 2013 0.215
13 2004 0.202
14 2012 0.183
Here are the top 14 in UAH6.0beta4 including 2015:
1 1998 0.482
2 2010 0.340
3 2015 0.266
4 2002 0.213
5 2005 0.200
6 2014 0.184
7 2003 0.184
8 2007 0.162
9 2013 0.137
10 2006 0.116
11 2001 0.115
12 2009 0.100
13 2004 0.078
14 1995 0.068
There is easily demonstrated evidence of temperatrure adjustments.

Here are more
https://stevengoddard.wordpress.com/data-tampering-at-ushcngiss/
Thanks for your responses. You’ve totally convinced me my judgement is sound: more CO2 causes Earth to retain more energy. We can just hope a few degrees of warming is all we get and we manage to reduce CO2 emissions.
I’m sure you are ready to share the life choices you’ve made, that might affect the climate ?
Dennis,
If you believe this, then how do you explain the fact that for 50 of the past 70 years, during which time CO2 has increased monotonously, the planet cooled or its temperature has been flat? And even during the 20 years of slight gain, global average temperature, however measured, fluctuated widely and fell pronouncedly in a number of years.
Why do I believe it? Because I believe the science. Why do I believe the science? Because, in the long run, the balance of informed opinion is what matters. And what is the balance of informed opinion? Nearly every climate scientist, informed scientist and scientific society on the planet is persuaded the emission of CO2 is causing Earth to retain more energy. Changing the climate. That is the reality. There is no substantive error. No fraud. No conspiracy.
In the end it’s a judgement. I don’t believe 9/11 WTC was a controlled demolition, nor fluoridation and ‘chemtrails’ are mind control, nor creationism nor intelligent design, because none makes any sense to me.
I understand the relationship between energy/heat and temperature. I can see the difficulties in detecting and measuring such a vast and complex system. I know from experience how easy it is to argue the jigsaw doesn’t show the true picture because some pieces (of evidence) are frayed and others are missing.
Of course it is possible the science is wrong. What would it take to show us? A well-informed genius with good science. The door is open.
Dennis Horne,
Look up “Confirmation Bias”. Your comment is riddled with it.
Why do I believe it? Because I believe the science. Why do I believe the science? Because, in the long run, the balance of informed opinion is what matters. And what is the balance of informed opinion? Nearly every climate scientist, informed scientist and scientific society on the planet is persuaded the emission of CO2 is causing Earth to retain more energy. Changing the climate. That is the reality. There is no substantive error. No fraud. No conspiracy.
In the ends it’s a judgement. I don’t believe 9/11 WTC was a controlled demolition, nor fluoridation and ‘chemtrails’ are mind control, nor creationism nor intelligent design, because none makes any sense to me.
I understand the relationship between energy/heat and temperature. I can see the difficulties in detecting and measuring such a vast and complex system. I know from experience how easy it is to argue the jigsaw doesn’t show the true picture because some pieces (of evidence) are frayed and others are missing.
Of course it is possible the science is wrong. What would it take to show us? A well-informed genius with good science. The door is open.
Dennis Horne,
Posting twice like that can’t be a mistake, can it? They’re 4 minutes apart. And we get what you “believe” because you use that word 3 times in the first line.
You say:
There is no substantive error. No fraud. No conspiracy.
You’re obviously new to this. It’s been established beyond any reasonable doubt that there’s been plenty of fraud, and the conspiracy was self-admitted repeatedly in the Climategate email dumps. You could read The Hockey Stick Illusion by Montford, available on the right sidebar. But I doubt you will, because of your belief.
Belief is a hard thing to change. It is the antithesis of an open mind. Tell a Jehovah’s Witness he’s got it wrong. See what he says. Your belief is like that. No facts, observations, evidence, data, or lack of measurements of what you think must be happening can change your belief.
The past hundred plus years has been a true “Goldilocks” global temperature century. The earth is currently at the colder end of global temperatures. It’s been up to 8ºC warmer in the past and even more, repeatedly, with no ‘climate catastrophe’. In warmer times the biosphere flourished with life and diversity.
But you simply discard every fact that contradicts the “dangerous AGW” (DAGW) narrative — and there are a lot of them. Instead, you put your trust in people who have been caught admitting that they control the climate peer review / journal system, and if it’s threatened by contrary facts they have no problem “redefining what peer review means”. They brag about their expense paid holiday conferences, and conspire to avoid paying taxes. You trust politicians, and the media. But you don’t have any confidence in satellite or balloon measurements.
You believe because there’s comfort in your belief. Dr. Michael Crichton nailed it in this article:
Today, one of the most powerful religions in the Western World is environmentalism. Environmentalism seems to be the religion of choice for urban atheists. Why do I say it’s a religion? Well, just look at the beliefs. If you look carefully, you see that environmentalism is in fact a perfect 21st century remapping of traditional Judeo-Christian beliefs and myths.
There’s an initial Eden, a paradise, a state of grace and unity with nature, there’s a fall from grace into a state of pollution as a result of eating from the tree of knowledge, and as a result of our actions there is a judgment day coming for us all. We are all energy sinners, doomed to die, unless we seek salvation, which is now called sustainability. Sustainability is salvation in the church of the environment. Just as organic food is its communion, that pesticide-free wafer that the right people with the right beliefs imbibe.
Believers aren’t scientific skeptics; the two don’t go together. I have much respect for people with any ethical belief system. But we’ve seen that most believers in the “dangerous AGW” hoax who comment here tend to be somewhat hypocritical. For example, ‘u.k.(us)’ asked you:
I’m sure you are ready to share the life choices you’ve made, that might affect the climate?
In other words, have you given up the use of the fossil fuels that you’re convinced are leading to a climate catastrophe?
Whenever someone is asked that question here, they either don’t respond, or they try to justify why it’s OK for them to use evil fossil fuels. Some explain that they ride a bicycle, or use solar panels. But they’re just rationalizing. They still use plenty of fossil fuel products.
You won’t get the West to stop using fossil fuels, and the East will keep ramping up. So what’s your answer, assuming that you, too, will keep burning fossil fuels? Do you really believe what you say? Or is it just easier to bask in your belief, and not have to think?
Questioning the climate alarmist narrative is the hard way. It’s difficult to go against the flow and not accept preconceived media assertions; to think for yourself, to question everything. Lots of folks still take it easy and assume that what a ‘scientist’ says must be true, because scientists aren’t like other people. They’re special. They would never lie for money, or status, or advancement. They just wouldn’t. Right?
” Because I believe the science.”
No you don’t. You believe in abdicating your own capacity for reasoning to those who have the imprimatur of those in power. You’re a sheep.
“Because, in the long run, the balance of informed opinion is what matters.”
No, in the long run, reality matters. And, in the real world, consensual scientific opinion has often been dead wrong. It has generally sorted itself out in the long run, but sometimes, that run has been very long, indeed.
[Comment deleted. Identity thief post. ~mod.]
[nope, sorry, you are wrong, and wrong again -mod]
Shades of Al Capone taunting Eliot Ness.
Dear “mod”
…
You posted: “[nope, sorry, you are wrong, and wrong again -mod]”
….
First of all, please don’t confuse financial employment fraud with scientific fraud. These are two different animals.
Secondly, I suggest that if you wish to reply to my comment please post under an identifiable name so that you can’t be labeled as an “anonymous coward”
[Reply: this (other) moderator did some investigating and found that in fact, you are an identity thief who has stolen the real Michael Palmer’s name and is posting under it. As usual when that happens, you have wasted all the time spent composing and posting your comments, because they are deleted now except for this one. David, you need to get a life, or a girlfriend, or a job. Or something. ~mod.]
The climate has been studied for a long time. Large numbers of scientists are studying it now. The evidence from different approaches is Earth is retaining more energy. There is a broad consensus. That is reality.
It doesn’t matter any more what the deniers believe or the rigmarole they write on blogs. They can’t persuade the climate scientists and informed scientists and scientific societies. The only people who listen are themselves. They’ve lost the scientific debate. Those who deny CO2 is a greenhouse gas and the importance of greenhouse effect are regarded as nutters, even by sceptical climate scientists.
All deniers are doing is making it harder to make rational decisions about what we do.
Best to just admit you’re wrong so we can get on with it:
[Snip. “Potholer” (Peter Sinclair) videos are not welcome on this site. Please do not post any Sinclair videos here again. ~mod.]
NOTE. My last post did not appear, so I posted it again. Both posts disappeared without trace. Then both appeared. Fortunately you don’t have to read posts. Of course I know you will. Got to feed the hobby horse…
Dennis Horne, may I fix your first paragraph? Thank you:
The
climate hasepicycles have been studied for a long time. Large numbers of scientists are studyingitthem now. The evidence from different approaches isEarth is retaining more energyepicycles are proof that the sun circles the earth. There is a broad consensus. That is reality.Your next paragraph is contradicted by so many examples that it’s clear your belief is simply eco-religion. For example, Prof. Richard Lindzen is an internationally esteemed climatologist, with twenty dozen peer reviewed papers to his name. He headed M.I.T.’s atmospheric sciences department. And he flatly disputes the ‘dangerous AGW’ nonsense that you believe in. And the original climatologist, H.H. Lamb, produced extensive studies showing that the current ‘climate’ (global temperatures) are unusually benign. But Michael Mann came along and tried to erase Lamb’s LIA and MWP reconstructions. And you believe Mann??
I could give you dozens of similar examples, but I already know your reaction. Your mind is made up and closed tighter than a submarine hatch.
Regarding your belief in the mythical “consensus”, that has been so thoroughly debunked that it’s embarassing to anyone who still mentions it. The OISM Petition alone has more than 31,000 co-signers, all of them professionals with degrees in the hard sciences, including more than 9,000 PhD’s. They say in effect that CO2 is harmless, and beneficial to the biosphere. Since CO2 is the basis for the “carbon” scare, that statement demolishes the man-made global warming narrative. You can’t find 10% of that number who contradict the OISM statement. You couldn’t even find one percent. You know what? You can’t post the names of even one-tenth of one percent of scientits and engineers who contradict the OISM statement. So enough with the alarmists’ ‘consensus’ claims. They’re bogus.
Finally, you oughta wait more than 4 minutes to see your comment. Certain words get comments held up. Words like “deniers”. That’s against site policy here. You’re a noobie, so you’re probably getting a pass this time. And I do read your comments. I don’t reply necessarily to teach you, because some things aren’t worth it. But this site gets thousands of readers a day, some new ones all the time. For their sake, we can’t let the alarmist nonsense you post go uncorrected.
[Comment deleted. Identity thief post. ~mod.]
Michael Palmer (you’re really just a Palmer impersonator, aren’t you?),
1. Prove that a ‘Spice Girl’ signed the OISM statement.
2. The OISM ended at the Kyoto meeting in 1997. It served its purpose of derailing the protocol. No new names were accepted after that.
3. Saying who is not on it is deflection. Your challenge is to find the names of 1% of the OISM numbers, of alarmist scientists who have written contradicting the conclusions. If you can, you will be the first. Good luck.
OK, you have your work cut out.
Ready…
Set…
…GO!
[Comment deleted. Identity thief post. ~mod.]
How come your name isn’t on it, David?
I was asked to sign the OISM petition but I did not consider that my publication record at that time was long enough to justify signing.
dbstealey,
“Your next paragraph is contradicted by so many examples that it’s clear your belief is simply eco-religion.”
It seems to me D. Horne is all about authority/conformity. A thug, essentially ; )
Baa-aaah…
Woof-woof…
All I hear from you is, baa–aah, baa–aah. Sounds like you have identity issues, too.
Did a certain promise at 3:41 to accept Richard Muller’s science pass unnoticed?
Hey, keep ‘correcting’ my posts. Bring out a few dinosaurs. Lindzen against the American Physical Society and the American Meteorological Society, and all the others. Reminds me of the old lady complaining everybody except her is driving up the highway the wrong way…
Sorry to hear of your old lady’s affliction.
Dennis Horne,
Michael Mann’s ‘realclimate’ blog disagrees with Muller, because B.E.S.T. says that global warming is natural, not man-made.
So you’ve gotta decide between your alarmist heroes. Which one is wrong?
Me, I think they’re both wrong…
My thanks to the moderators for allowing me to comment. As has already been stated by others, it’s important people coming to this site see nonsense countered.
Isn’t it interesting how it is argued science is not done by the consensus (true) but somehow there isn’t a consensus (not true). And that a consensus isn’t important anyway… Which is strange because if that is so why try and invent one to counter nearly every informed scientists and scientific society on the planet?
http://www.huffingtonpost.com/kevin-grandia/the-30000-global-warming_b_243092.html
https://www.skepticalscience.com/OISM-Petition-Project.htm
http://www.skepticalscience.com/scrutinising-31000-scientists-in-the-OISM-Petition-Project.html
[Note: this is a science site. Posting opinions from Huffpo and SkS does not rise to the level of real science. You can post those sources, but they are not considered credible. -mod]
Dennis Horne says:
My thanks to the moderators for allowing me to comment. As has already been stated by others, it’s important people coming to this site see nonsense countered.
Thanx for giving skeptics the opportunity to correct your posts.
As a noob here you probably don’t know how many times your “consensus” nonsense has been debunked. There’s even a peer reviewed, published paper that demolishes your belief system. That paper has never been refuted.
It’s amazing how gullible some folks are. I issued you a direct challenge: post the names of one percent of the OISM’s numbers, who have contradicted their co-signed statement.
Linking to a Huffpo opinion piece doesn’t answer my challenge, and it’s as lame as we’d expect from that source. Only names can answer my challenge. You needed to produce the names of only 310 scientists (using your own criteria) who have stated that the OISM statment is wrong. But instead, you tucked tail and hid behind pseudo-science blogs like ‘skeptical’science, which has the dishonor of being the only blog listed on the sidebar as “Unreliable”. That’s polite for ‘the truth doesn’t matter to them’.
Did you know that neo-Nazi John Cook owns that blog? He is the one promoting your debunked “consensus” propaganda. And you fell for it — assuming you’re not another neo-Nazi. When you’re forced to link to the self-serving people in question, it’s meaningless. What’s Cook gonna do, admit that he’s producing alarmist propaganda?
FYI, there are lots more science professionals on record as disagreeing with the “dangerous AGW” narrative, which is the basis of your eco-religious belief system.
Here are another one hundred twenty five scientists who wrote to the UN Sec-Gen, telling him he’s wrong about his climate beliefs:
http://business.financialpost.com/fp-comment/open-climate-letter-to-un-secretary-general-current-scientific-knowledge-does-not-substantiate-ban-ki-moon-assertions-on-weather-and-climate-say-125-scientists
Your pseudo-science blog tried to claim that a PhD in physics doesn’t qualify someone to understand the climate scam. But you probably worship Ban Ki-Moon, who can’t even do arithmetic. You take sides without the slightest knowledge of what’s being discussed, only parroting alarmist talking points.
Next, here’s a U.S. Senate report that names more than one thousand scientists who also disagreee with the alarmist hoax:
http://cfact.org/pdf/2010_Senate_Minority_Report.pdf
Want more? OK, here are more than 1,350 scientists who specifically support the skeptics’ side of the debate:
http://www.populartechnology.net/2009/10/peer-reviewed-papers-supporting.html
You can add those thousands of names to the 31,487 OISM co-signers.
There is no question whatever that the climate alarmist clique is composed of relatively few scientists who are riding the grant gravy train. They are supported by a fraction of the public that has never understood that the rise in CO2 has not caused the endlessly predicted global warming, and by a smaller part of the public that is delibearately peddling the DAGW hoax for them. But as we see in poll after poll, less than 20% of the public is concerned about the global warming scare — and they’re becoming fewer every day.
You believe there’s a conspiracy involving nearly every climate scientist and every scientific society on the planet.
Sorry, can’t help you.
But keep calling…
Dennis Horne,
Wrong, as always. The conspiracy is well documented in the Climategate email release, and it involves only alarmist scientists.
Pitch me another one!
Dennis Horn writes,
“You believe there’s a conspiracy involving nearly every climate scientist and every scientific society on the planet.”
Was there a vast “conspiracy” in Germany during the dark time, one asks? Or was there a relatively small “conspiracy” that bullied the whole society into going along with them, including what was at the time arguably the most well developed “scientific community” on Earth?
It seems to me absurd to believe a “vast conspiracy” is required to drive us into another dark time of human authority worship, complete with the ostensible stamp of approval from the “scientific community”. All you need is a relatively small group of liars, cheats and cutthroats, with the backing of some similarly defective rich A-holes, as far as I can tell. Such people are not hard to find in any society, and naturally gravitate toward whatever seems to be the strongest “gang” around . .
Dennis Horne:
You say
I agree and, therefore, I am writing to counter your nonsense.
Firstly, I draw your attention to my above post because you persisently claim there is a “consensus” of “science” that supports the AGW conjecture. Others have repeatedly told you that if there were such a consensus then it would have no importance but you ignore that. My above post that I have linked informs that the consensus which you assert does not exist.
Each climate model is a representation of the understandings of the Earth’s climate possessed by the climate scientists who constructed it. But each model emulates a different climate system: i.e. your consensus does not exist because the climate scientists do NOT agree the climate system so cannot agree the response of the climate system to e.g. an increase of atmospheric CO2.
Secondly, you are assuming the effect of an increase of atmospheric CO2 would be significant, but other effects are much larger so would overwhelm it.
For example, changes in cloud cover have so large an effect that they completely swamp any effect of increase of atmospheric CO2: clouds reflect sun light back to space so it does not reach the Earth’s surface.
Good records of cloud cover are very short because cloud cover is measured by satellites that were not launched until the mid-1980s. But it appears that cloudiness decreased markedly between the mid-1980s and late-1990s
(ref. Pinker, R. T., B. Zhang, and E. G. Dutton (2005), Do satellites detect trends in surface solar radiation?, Science, 308(5723), 850– 854.)
Over that recent period of less than two decades, the Earth’s reflectivity decreased to the extent that if there were a constant solar irradiance then the reduced cloudiness provided an extra surface warming of 5 to 10 Watts/sq meter. This is a lot of warming. It is between two and four times the entire warming estimated to have been caused by the build-up of human-caused greenhouse gases in the atmosphere since the industrial revolution. (The UN’s Intergovernmental Panel on Climate Change says that since the industrial revolution, the build-up of human-caused greenhouse gases in the atmosphere has had a warming effect of only 2.4 Watts/sq meter).
Clearly, the effect of an increase of atmospheric CO2 is trivial and is completely swamped by changes to e.g. cloud cover.
But I am responding with science to counter your nonsense, and your posts demonstrate that you do not consider science.
Richard
Dennis Horne,
Enjoying your eco-religious experience here? You don’t do much except make assertions and post appeals to corrupt authorities. Regarding B.E.S.T., they’ve been caught cherry-picking time frames to make their case:
Mr. Horne, you have been refuted once again. Not one thing you’ve ever posted here has withstood even the mildest scrutiny. But keep trying, I enjoy hitting home runs off your weak pitches.
Why not look at an up-to-date graph:
http://ds.data.jma.go.jp/tcc/tcc/products/gwp/temp/fig/an_wld.png
http://ds.data.jma.go.jp/tcc/tcc/products/gwp/temp/ann_wld.html
Dennis Horne,
Thanx for the graphs showing the natural recovery from the Little Ice Age — the second coldest episode of the entire 10 millennium Holocene.
Also, note that there’s no acceleration, and temperatures remain pretty much within specific parameters:
Pitch me another one, these are fun!
Why not look at an up-to-date graph:
http://berkeleyearth.org/wp-content/uploads/2016/01/Annual_time_series_combined1.png
Satellite data is the gold standard of global temperatures. B.E.S.T. is not.
Satellite data:
http://realclimatescience.com/wp-content/uploads/2015/11/PaintImage113.png
Stop throwing your pitches underhanded, they’re too easy!
Trot along back to skepticalpseudoscience, you need some new talking points.
Dennis Horne,
I’ve asked you several questions, but you don’t answer. I answer questions because it’s easy. One characteristic of the alarmist crowd is avoiding answering uncomfortable questions.
How about this — I’ll just ask you one question, and you answer it honestly. Fair enough?
He never answers. I don’t think he even reads. Just keeps repeating ad nauseum the same “everybody does it” mantra. He’s given up thinking for himself, and seems perplexed that others have not, and figures that if he just keeps repeating himself, you’ll eventually come around to his point of view.
@ dbstealey
I admire your efforts to correct and counteract Dennis Horne’s clearly misinformed rantings.
JohnWho,
Thanks, someone’s gotta do it. Horne is getting his talking points from alarmist blogs and parroting them here. Readers who have been here a while have seen all the arguments, and none of them holds water.
The basic facts include the fact that the only corellation between CO2 and temperature shows that changes in temperature causes subsequent changes in CO2. I have plenty of documentation showing that. But no one has ever shown me a chart that shows CO2 causing changes in temperature. I invite Mr. Horne to produce one that’s not a simple overlay.
Next, as this article’s headline points out, no scary alarmist predictions have ever happened. At this point, they’re beginning to sound deranged.
Then there are the Climategate emails, where one scientist wrote that he is fabricating years of temperature data.
At this point, only the eco-religionists are left trying to defend the indefensible DAGW hoax.
Yes, all of that and the fact that he isn’t getting his definition of a “climate skeptic” from a reliable source either.
As far as I know, no “climate skeptic” (one who does not agree with the CAGW concept) says that the climate has not been warming since the end of the LIA, or says that the “Green House Effect” does not exist, or says that CO2 is not one of the “Green House Gases”, or says that humans are not adding a measureable amount of CO2 into the atmosphere. His posts implying that climate skeptics do all of those things shows he has been grossly mislead.
He wants to be part of the discussion but does not have a clue what is being discussed.
JohnWho,
Correctomundo. I’ve never said that AGW doesn’t exist, in fact I’ve always accepted that it does. But since it’s too small to measure, it’s a non-problem. The scare is over “dangerous AGW”. But Planet Earth has been busy falsifying that belief for almost twenty years now.
Satellite data is the gold standard of global temperatures.
Really? Did you watch this rebuttal, posted above several times? I don’t think so.
Or, the alternative is we’ve watched it, and cannot fathom why any serious person would give those clowns any credence.
I don’t think you realise the satellites don’t measure temperature, let alone the temperature on the surface.
Don’t the “surface” stations actually measure the temperature a few feet above the surface?
JohnWho,
Yes, at what’s called the lower troposphere; the altitude of Dennis’s head.
And enough with the “satellites don’t measure temperature” nonsense, Dennis. By that same metric, neither do stick thermometers.
“I don’t think you realise the satellites don’t measure temperature, let alone the temperature on the surface.”
Red herring. Surface measurements do not measure temperature, either. And, if anything, the troposphere is supposed to be warming faster than the surface.
Dr. Christy’s response to the vid:
The vid is really lame, and those guys are hacks. Real scientists, when data contradict their hypothesis, revise the hypothesis. Those idiots revise the data.
Do laws not apply to climate “scientists?” If Dr Christy is telling the truth, which I’m sure he is, and has evidence to support his claims, how can these other scientists make videos sprewing outright lies? If they “scientists” are telling outright lies in these videos, why aren’t they being prosecuted? Congress has got to take a stronger stance against this nonsense. These laws are costing the tax payers billions.
On a serious note, I doubt if anyone would argue that there are problems with the satellite data. I believe and hope that they’ve been properly identified and corrected.
However, the problems with the surface station data is much worse and, in my opinion, can not be corrected no matter how brilliant the algorithm used is. There is no way, with current data, to know what the real temperature is at an improperly sited station at a given time.
So, no matter how much one denigrates the satellite data, it remains the best we have.
Correct again, JohnWho. The surface station network is hopelessly inaccurate, with well over half the stations having between a 2ºC and 5ºC error:
http://www.surfacestations.org/Figure1_USHCN_Pie.jpg
Yet the alarmist crowd goes nuts over a 0.7ºC wiggle. Over more than a century!
With surface stations, we can’t even see an honest fraction of a degree.
The satellite data and the ground data agreed with one another, until the CC gang decided they couldn’t tolerate the blazing discrepancy between models and reality. The “pause” had to go. So Karl et al. were dispatched to remove it by any means necessary.
And, remove it they did, by throwing away the best ocean data available. The only thing standing in their way now is that pesky satellite data, which stubbornly refuses to toe the line. Since they cannot change it, they must undermine it. They believe they can be as blatant and transparent as they like because they have an unending supply of idiot, unthinking myrmidons like Dennis to help sow the seeds of doubt among the uninformed.
Seven seconds into this political propaganda video a picture of Sen. Ted Cruz is put on the screen with the overlaid words: ‘Climate Denier’.
When someone is taken in by videos like that, they have zero interest in science. Dennis Horne is all politics, all the time.
Mr. Horne, you never have answered the questions I’ve asked. If you had a convincing answer, you would have posted it. Instead, you post carp like that.
Please stop posting your political propaganda videos. They belong on Hotwhopper, SkS, or similar very low trafficked blogs. This is a real science site. Thanx in advance for helping to keep it that way.
Well, that’s enough laughs for one day.
You should know though, the climategate nonsense was just a beat-up. It started as a joke. The joke was they were going to ‘fool’ the punters by giving them ‘the truth’. Absolutely and totally exonerated by several independent reviews.
And so it proved to be true. The truth has them flummoxed.
“Well, that’s enough laughs for one day.”
Well, no, we will continue to laugh at your posts even if you’ve stopped posting.
🙂
Of course you will! No surprises there…
Just popped back to offer a bit more real science:
http://www.st-andrews.ac.uk/~rjsw/N-TREND/Wilsonetal2016.pdf
LOLOL!! Telling the temperature from tree rings — hundreds of years ago! As if!
I smell desperation.
Treemometers!
Yeah, that’s the ticket!
Baaaah-bye.
Dennis Horne,
If you believe those were anything but Potemkin Village “reviews”, you’re even more credulous than I thought. There was never, in any of them, one hostile witness called. Not only were the questions so kissy-face that it was embarassing, it turns out that Michael Mann was involved in formulating the questions he would be asked!
You will believe anything that confirms your bias.
Mr Stealey, as ever, is right. I offered to give evidence to Sir Muir Russell’s whitewash of Climategate, but was told I was too late. My request to give evidence was made directly to the unspeakable Russell on the day his inquiry was first publicly announced.
When Jones of East Anglia “university” was interviewed by another bunch of whitewash merchants, Jones was not even asked whether he had destroyed the data he had said he was going to destroy.
“Well, that’s enough laughs for one day”, says the clown.
Dennis Horne can’t produce credible arguments based on verifiable facts or evidence, so he tucks tail with that throwaway line, and skedaddles.
Mr. Horne, you lost the debate because you cannot produce any evidence that supports your alarmist belief system. We get it: you’re a true believer. But this is the internet’s BEST SCIENCE site. Baselsess assertions like yours are not adequate. So trot on back to hotwhopper, or wherever you get the talking points you’re parroting. They just love your kind of pseudo science.
Okay. So let’s recap. The Royal Society, American Physical Society, American Meteorological Society and every scientific society in the world versus … well, a ragbag of losers. I mean, who, outside the Loony Right Republicans listens to them?
The argumentum ad populum, or argument from headcount, is a logical fallacy excoriated by Arisrotle 2350 years ago. The argumentum ad verecundiam, or argument from appeal to authority, is another Aristotelian fallacy. The argumentum ad hominem, or argument from attack on the opponent’s person rather than on his assertions, is a disfiguring subspecies of the argumentum ad ignorationem elenchi, or argument from disregard of the norms of rational disputation, a third Aristotelian fallacy.
A fallacy is a species of argument so fundamentally flawed that no logical conclusion can be drawn from it except that its perpetrator is insufficiently educated, or is unconcerned about seeking the truth. Mr Horne, having uttered three of the most tired and shopworn logical fallacies in two sentences, is not to be credited with aught but invincible ignorance, the theologians’ term for one who will, for partisan reasons, aprioristically reject all evidence however compelling, that demonstrates or illuminates the truth.
Where the Alarmist arguments are not a farrago of classic logical fallacies and inconsistencies, they are an assortment of assertions and Just So stories. It’s all they’ve got. It is very sad and depressing that this is the state of science in the 21st century.
Okay. So let’s say it again. The Royal Society, American Physical Society, American Meteorological Society and every scientific society in the world versus … well, a ragbag of losers. I mean, who, outside the Loony Right Republicans listens to them?
Spouting Latin doesn’t alter the facts.
Baa-aah-aah!
Mr Horne should understand that Arostotle was Greek, not Roman. The mediaeval schoolmen gave the Aristotelian fallacies their concise Latin names one and a half millennia after he had first described them, showing how important they were. And from the Middle Ages to my own generation, logic was taught as one of the three core pre-university subjects, showing its continuing importance.
Then the totalitarian Left campaigned against logic, because it provided everyone with a powerful means to spot defects in the Party Line. In Socialist France, the teaching of logic was actually banned.
Yet, whether the under-educated Mr Horne likes it or not, logic underlies all mathematics and all science. It follows that, where data show a hypothesis to have been false, that hypothesis must be modified or even rejected, even if it had once been universally thought to be true.
As the head posting amply demonstrates, the high-sensitivity hypothesis is definitively contradicted by the evidence that global warming is not occurring at anything like the officially predicted rate. Even the IPCC, the political body that Mr Horne, a true-believer in the Party Line, no doubt regards as the repository of his actually non-existent scientific consensus, has drastically reduced its medium-term predictions in the light of the scandalous disregard for the Party Line that Nature exhibits.
Mr Horne, in sniffly dismissing logic, is sniffly dismissing science itself, just as his totalitarian intellectual progenitors the eugenicists and the Lysenkoists did. We are champions of the scientific method: he is a mere drone, a slave to the Party Line.
“Dennis Horne
January 16, 2016 at 9:34 pm
… and every scientific society in the world… “
Wrong.
Not every scientific society in the world believes that human CO2 emissions, primarily from fossil fuel burning, is the primary cause of “global warming”.
Your statements become even more laughable, even after you stated you had provided enough laughs for one day.
Humor is a good thing though, so even if you are credited with invincible ignorance, you at least have one redeeming virtue.
Mr. Horne should be aware that these august bodies very rarely, if ever, reflect the views of all their members. There are a number of scientists and mathematicians, even amongst the membership of the Royal Society, who have serious reservations about the strength of CAGW.
There is a long history of scientists battling against the received opinions of their peers in order to get the truth accepted. Perhaps Mr. Horne should learn of the derision that the post office clerk, Albert Einstein, suffered from the scientific societies of his day.
Or perhaps he should reflect on the words on Dan Shechtman, the 2011 Chemistry Nobel Prize winner, “For a long time it was me against the world, I was a subject of ridicule and lectures about the basics of crystallography. The leader of the opposition to my findings was the two-time Nobel Laureate Linus Pauling, the idol of the American Chemical Society and one of the most famous scientists in the world. For years, ’til his last day, he fought against quasi-periodicity in crystals. He was wrong, and after a while, I enjoyed every moment of this scientific battle, knowing that he was wrong.”
Have any of those organizations actually polled their membership and then issued a statement that was reflective of that poll?
Yes, when a scientist shows evidence the science is wrong the balance of informed opinion will change. In time. He’ll need to be very clever and well-informed, though, because an awful lot of clever people have produced evidence the science is sound.
The door is open.
Mr Horne will find definitive scientific evidence that the Party Line is wrong in the head posting. The world is not warming apt anything like the predicted rate, Get used to it, and learn that when the data do not fit the theory a true man of science reconsiders the theory.
Dennis,
Do you know this scientific principle?
In science, there is NO consensus. 100% can believe that the earth is flat and the sun rotates around the world. That doesn’t make it true.
Mr Horne, like all others on the totalitarian Left, cannot bear to abandon the repudiation of the scientific method that is entailed by his belief that science is done by consensus. There is, in fact, no scientific consensus even on the question whether more than half of recent global warming was manmade. Even if there were a scientific consensus rather than an anti-scientific Party Line, science proceeds logically and, therefor, admits of no consensus in its eternal search for the objective truth.
Let him produce scientific arguments against the wealth of scientific data presented in the head posting. If not, he is wasting his time.
Science and technology always build on what has gone before. Even Newton and Einstein didn’t start from scratch, they started from what was known and agreed on. That’s a consensus.
I didn’t come here to give you guys a lesson; you didn’t get where you are today by knowing how to learn…
Whatever science is, scientists are people who investigate everything in the universe and try to explain it. Their reports are assessed by other scientists, generally in the same or similar field. If their work persuades enough scientists it’s sound, it becomes accepted for the time being: that’s the balance of informed opinion. After some years and more work and more reports, a consensus may develop. Eventually, like evolution, it becomes, in everyday parlance, a fact. Disputed, but still a fact.
That Man is changing the climate by his emissions of CO2 is accepted by nearly all climate scientists and informed scientists and scientific society on the planet. That’s a fact.
Yes it’s disputed. So is evolution. Vaccination. Fluoridation. Obama’s birthplace, 9/11, Moon landing. ‘chemtrails’ …
Of course man can believe anything. He can even believe in the existence of gods he invented himself…
I thank you all for the time and trouble you have taken to respond to my comments. It’s been a lot of fun.
Dennis Horne
January 17, 2016 at 2:47 pm
…
That Man is changing the climate by his emissions of CO2 is accepted by nearly all climate scientists and informed scientists and scientific society on the planet. That’s a fact.
But what isn’t a fact, and where your ignorance lies, is exactly how much human CO2 emissions effect the temperature of the atmosphere. There is no evidence that shows that this effect is either measurable or detectable. Therefore, it is of little consequence.
Dennis, you really do not understand science at all. You sit there, and keep making the same argument over and over again. We heard it. It isn’t valid. That is why you make no headway.
If you have any facts to share, then do so. But, get some new material. Something. Anything. This is monotonous, and only serves to reinforce the perception that you are a mindless drone.
Since Mr Horne has already had it explained to him that the notion of science by consensus is anti- scientific, his reparative and otiose repetition of his superstitious faith in the existence and rightness of a scientific consensus that he has been told does not in fact exist, and that the head posting demonstrates to be materially incorrect, reflects no credit on him.
… has already had it explained to him that the notion of science by consensus is anti- scientific …
What are your qualifications in science to explain science to me?
What? You didn’t like me explaining what science is? You don’t like my repeating the fact scientists and governments accept the science? Well, of course you don’t. Talking about the truth:
http://woodfortrees.org/plot/rss/from:1979/to:2015/trend/plot/rss/from:1989/to:2015/trend/plot/rss/from:1999/to:2015/trend/plot/rss/from:1998/to:2015/trend
http://woodfortrees.org/graph/rss/from:1979/to:2015/trend/plot/rss/from:1989/to:2015/trend/plot/rss/from:1999/to:2015/trend/plot/rss/from:1998/to:2015/trend
And which graph proves that human CO2 is causing the atmosphere to warm?
Your “truth” is not supported by reality.
Get over yourself, Dennis. You’re clueless and naive.
Doesn’t matter. Almost every climate scientists and informed scientists and every scientific society on the planet has got it sorted.
You and the other losers have lost. Science won.
Dennis Horne,
Enough with your constant ‘appeal to authority’ logical fallacies. Your corrupted ‘authorities’ are using people like you for their tools, because you don’t have a clue about how science or the scientific method works..
Scientists have raging arguments all the time over hypotheses, conjectures, theories… you didn’t know that?
Scientists are always arguing. But amazingly, every organization that has taken a stand on AGW has issued the same alarming statements. In the real world there would be a normal divergence of opinions.
Just the fact that the (usually 6-member) Boards of those organizations got a majority together, and parroted the same ‘dangerous AGW’ narrative without ever allowing their rank-and-file membership to have a say tells intelligent folks that there’s more going on than meets the eye.
Prof Richard Lindzen has written about that process, and he names names. If he was lying he would be sued into poverty. But no one has ever dared to challenge him. Lindzen explains how activists get a Board to issue a policy statement like the ones that are leading you by the nose in the direction they want.
I’ve been elected to a statewide post, and I know how easy it is to trade votes and favors in an executive Board. With people like George Soros in the background, how hard do you think it is to get a majority to simply say something? You are naive and credulous, my friend, if you don’t believe that people can be bought and paid for. It’s easy peasy. Piece o’ cake. A walk in the park. &etc…
The truth is, most people want to be bought. It’s human nature. As Churchill said, (paraphrased from memory): ‘We have already established that. Now we’re negotiating the price.’
And BTW: you must be looking in the mirror, because skeptics have never surrendered. We haven’t lost, and your numbers are dwindling…
He’s just a kid, db. Thinks he’s got it all figured out. Give him a few years. Not worth any more time right now.
[Deleted. More “denier” comments and you will get a timeout. -mod.]
@D. Horne,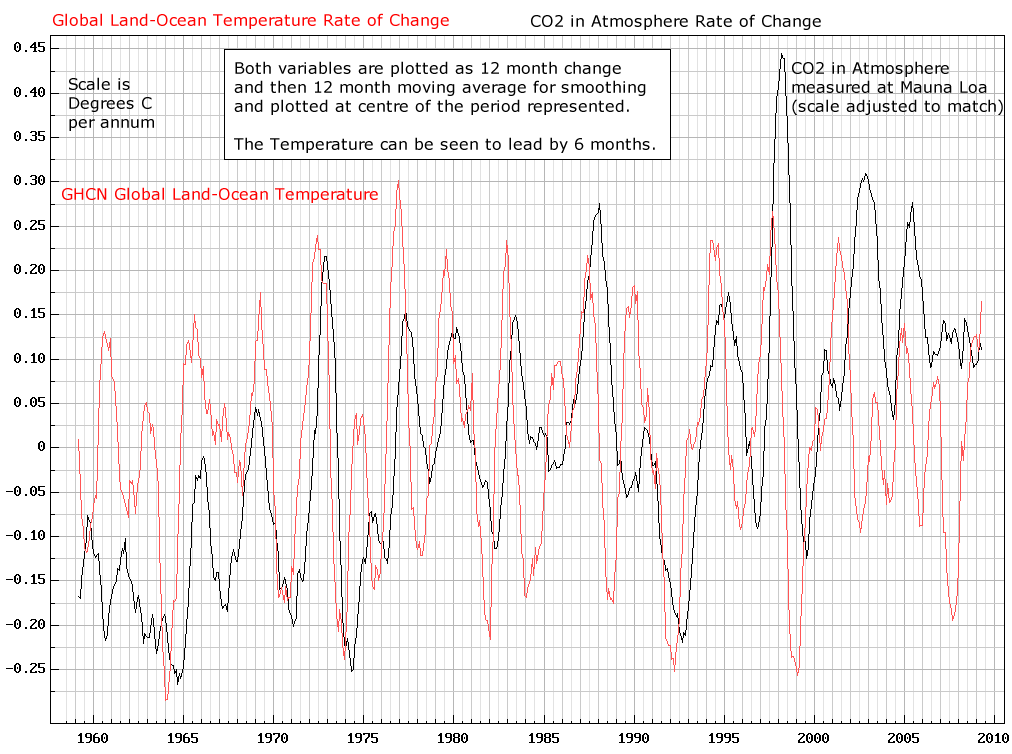

Your charts are worthless. No one else posts nonsense like that. It proves nothing.
But believers in the climate hoax are sure global warming is caused by rising CO2. Here’s a chart that shows causation, and CO2 is not the cause of changing temperature:
(click in charts to embiggen)
Here’s another chart that shows ∆CO2 is caused by ∆temperature:
I challenge you to produce a cause and effect chart, showing that ∆T is caused by ∆CO2.
And if you want more charts on many time scales showing what these two show, ask and I’ll post them. Just say, “Pretty please!”
Doesn’t matter. Heads science wins tails you lose.
Get over it.
Let’s decide what to do about global climate change.
Mr Horne has yet to produce anything recognisable as a scientific argument. His petulant and childishly-repeated argument that there is a consensus and that it must by its mere existence be right, when he has been told that science proceeds logically, that argument from consensus is logically fallacious and that, as the head posting demonstrates, the consensus is plumb wrong, is not likely to convince anyone but himself.
I don’t need to convince anyone. Almost every climate scientist and informed scientist and scientific society on the planet is already convinced. That’s a consensus. That governments around the world accept.
I don’t need to make a scientific argument of any description. I can choose to accept the consensus, or not.
You don’t. But who cares?
The seeker after truth does not place his faith in any mere consensus, however venerable or widespread. Instead, he subjects what he has learned of it to his hard-won scientific knowledge, to scrutiny, to investigation, to inquiry, to verification, to checking, to checking, to checking again. The road to the truth is long and hard, but that is the road we must follow.
The above paragraph is by the Eastern founder of the scientific method, Abu Ali Ibn al Hassan Ibn al Hussain Ibn Al Hussain Ibn Al Haytham, in 11th-century Iraq. Similar sentiments have been expressed by other leading natural philosophers, from Newton and Einstein to Popper. Anyone who places his faith in a supposed consensus, particularly when he has been given information to the effect that argument from consensus is a logical fallacy and hence anti-scientific, and to the effect that the claimed consensus does not in fact exist (see Legates et al., 2013), is, therefore repudiating science in the most fundamental way, replacing it with the mere politics of head-count.
So you think the scientific method is something defined in a book? By a philosopher or ancient “authority”.
The scientific method is the way scientists work such that their results and conclusions are accepted by other scientists as valid. And, subject to verification may even be ‘true’ until falsified.
Dennis Horne:
You write
As I explained to you in my above post to you, science refutes your every argument. Live with it.
Climate always changes everywhere. It always has and it always will.
People will adapt to climate change as they always have,m and your ravings cannot alter that.
Richard
Ah. Mr. Horne’s reply to my challenge is: “Doesn’t matter.” May I translate your words, Mr. Horne? Thank you:
‘I am unable to find any charts that show that CO2 causes global temperature changes’.
Is that accurate?
If not, post your chart(s).
I’ll wait here while you trot off to Hotwhopper and Skepticalpseudoscience for more talking points…
Dennis Horne,
Since in the history of science you can see several famous clear cases (there are actually many cases) where dominating science consensuses were found to be fundamentally wrong, then your appeal to CAGW consensus is a moot point.
You need to either show the real corroborated multiple and independent and objective real world observations that support the CAGW theory or you’ve no scientific merit.
John
I have no scientific merit. Okay. Anyway, I’m not “doing” science. I’m simply stating incontrovertible facts.
When in the history of science have nearly all the thousands of informed scientists and hundreds of scientific societies in the world gone to the public with such a strongly-worded consensus and then been forced to admit they was hopelessly wrong?
Of course, it could happen. I hope it does. I love burning lots of fossil fuel.
Dennis Horne wrote:
I have no scientific merit.
Dennis! Bro! We’re in agreement!
Next:
…I’m not “doing” science. I’m simply stating incontrovertible facts.
Well, you’re stating your opinion and calling it ‘facts’. But you’re not alone there.
And:
…I love burning lots of fossil fuel.
Me, too. The CO2 benefits the biosphere, and there’s no downside. More CO2 is better.
Now, if you could just stop repeating the ‘Appeal to Authority’ fallacy, you would be on the road to redemption and recovery. Maybe the scales would fall from your eyes like Paul on the road to Damascus, and you would see the unstated agendas behind the ‘dangerous man-made global warming’ scare.
Good luck. Lots of others here have started out like you, and later written that they’ve been enlightened. It could happen to you, too.
Mr Horne, clinging ever more dseperately to the sinking ship Consensus, wailingly demands when almost every scientist has agreed but they have yet been proven wrong. The history of science is precisely the history of the brave souls who were not prepared to accept the supposed “consensus” of their day. When Hutton proposed that the Earth must be a great deal older than the 6000 years calculated from the generations of Abraham by the amiable but misguided Bishop Ussher, he was flying in the face of the consensus of his day. When a patent clerk third class in an obscure patent office proposed that Newton’s laws of celestial motion were, at the margins, incorrect his paper was greeted with close to a decade of silent disapproval before the consensus that had reigned for three centuries was discarded.
But at least there was, in these and many other examples, a consensus in the first place, even though it was wrong. At present, however, there is no consensus on the climate question. Legates et al., 2013, surveying 11,944 papers publilshed on climate and related questions in the 21 years 1991-2011, found that just 64 papers, or 0.3% of the sample, had stated their agreement to the proposition that recent warming was mostly manmade. Just about every scientist is silent on the question how much warming was or will be manmade, for the answer is that we do not know, and there is mounting real-world evidence, some of it in the head posting, that the notion that CO2 will have a major effect on temperature – as opposed to an effect – is plumb wrong.
To cling to a consensus on a scientific question is evidence of feeble-mindedness. To cling to a consensus when it is demonstrated that none exists is merely pathetic.
I find intriguing the possibility that the claimed consensus on CAGW is non-scientifically based and may be formed essentially just via PR gimmicks promoting vested scientist’s interests.
Shining the light of reason into that possibility will be fun to do.
John
Dennis Horne says:
Doesn’t matter.
That’s his answer to the facts posted. Below he writes:
I don’t need to make a scientific argument of any description. I can choose to accept the consensus…
Good to know, because Mr. Horne has never made a good scientific argument. There are lots of people like Dennis. They don’t succeed in life. I would ask him for his CV, but it’s clear he doesn’t have one.
What’s really scary is his worship of government. If he ever gets a paying job he will begin to see government not as benign, but as a parasite that is never satisfied.
“What we have here, is a failure to communicate.”
A number of adults here are attempting to communicate with Dennis Horne who is acting like an immature child.
He is correct though, science “wins”. He just doesn’t realize or won’t accept that what he’s being fed isn’t science and when folks here attempt to introduce him to proper science he simply can not process it. So, while science wins, Dennis Horne loses.
I would say that many of the posters responding to him are very knowledgeable and most likely may have better things to do with their time. However, I often learn something new from these responses to “Dennis Hornes” so for what it is worth, I appreciate that they’ve taken their time to provide further enlightenment.
Just going back over the thread I saw this:
“Dennis Horne
January 16, 2016 at 3:17 pm
Isn’t it interesting how it is argued science is not done by the consensus (true)…”
So, Dennis agrees that science is not done by consensus and then proceeds to argue that it is!
Sorry, I can’t help myself – LOL
JohnWho, you, Lord Monckton, Aphan and others have repeatedly demolished Dennis Horne’s pitiful arguments. I’m beginning to suspect that he’s just a young, immature rabble rouser with zero understanding of this subject.
‘Fess up, Horne. Isn’t everything you say just a parroting of the alarmist crowd’s talking points? Post something original and verifiable for a change, and we can discuss it.
dbstealey: “Scientists are always arguing. But amazingly, every organization that has taken a stand on AGW has issued alarming statements.”
So what does that tell you?
1. The scientific societies are very sure the science is right: man-made climate change is real. OR
2. The scientific societies and climate scientists are all part of a vast conspiracy.
In the end it’s a personal choice.
Dennis Horne:
I respect science and I deplore trolls.
I understand your refusal to answer my posts addressed to you is because you are incapable of defending the twaddle you have posted in this thread and I have refuted.
To help you remember what you have failed to answer, I remind that my posts addressed to you are here and here.
Richard
Mr Horne, who seems unwise in the ways of the world, closes what passes for his mind to the likelihood that scientific societies, which are special-interest lobby-groups first and foremost, have signed up the the climate scam because it is profitable. But no society has polled its entire membership before issuing its tendentious me-too climate statements. These statements are all the work of tiny handfuls of over-politicized profiteers and activists, who will do anything rather than consult the entire membership and end up with an answer they disagree with politically and can make no money out of.
The fact is that the closest thing we have to true science is not in the self-serving scientific societies, but in peer-reviewed learned journals. And, as Legates et al., 2013, demonstrated conclusively, in those journals only 0.3% of a very large sample of climate-related papers stated that most of the global warming of recent decades was caused by us.
In any event, as the head posting establishes, the supposed “consensus” could only get the scare going by making exaggerated predictions. The profiteers of doom first began issuing their overblown and anti-scientific forecasts 25 years ago. As the head posting establishes, on all datasets – whether satellite or terrestrial – the predictions of the IPCC, the official embodiment of Mr Horne’s much-vaunted but anti-scientific “consensus”, have repeatedly proven wildly exaggerated.
A reasonable scientific mind would meditate on why there is a large and rapidly growing discrepancy between the over-egged predictions of the computer models and the failure of global temperatures to respond as ordered, rather than futilely bealting about a non-existent “consensus” that, even if it existed, would be wrong.
“Mr Horne … closes what passes for his mind to the likelihood that scientific societies, which are special-interest lobby-groups first and foremost, have signed up the the climate scam because it is profitable.”
I can see you have an open mind.
DH,
I can see that you don’t.
Mr Horne … closes what passes for his mind to the likelihood that scientific societies, which are special-interest lobby-groups first and foremost, have signed up the the climate scam because it is profitable.
I can see you have an open mind.
Lord Monckton is right.
I don’t want to side with Mr. Horne, but I think there are two kinds of consensus (sp?):
We’re quite certain that the next ice age is coming. We seem to be close to the end of an interglacial period.
Whether the next ice age will start in 10 or in 1000 years we don’t know.
So, I don’t like cold. I fear the next ice age (imagine migrating to the south, as far as Senegal possibly), but on the other hand, I think humanity now has the means to avert an ice age, either by enriching the atmosphere with ‘real’ greenhouse gas or by putting up some mirrors in orbit.
How to end up with a “pristine” satellite tropospheric temperature record:
1. Convert microwave emissions of oxygen molecules from broad atmospheric layers into temperature estimates for each layer. (This requires a computer model incorporating many subjective decisions.)
2. Adjust to account for the constantly changing orbital decay of over 10 different satellites.
3. Adjust to account for the constantly changing orbital drift of over 10 different satellites.
4. Adjust to account for drifts in the on-board calibration of the microwave measurements on each satellite.
5. Adjust to account for the transition between earlier and more sophisticated versions of the satellite microwave sensors; a variety of MSUs are currently in use.
These adjustments led UAH to make by far the biggest adjustment to any temperature series in 2015 (v5.6 to v6.0, still in beta).
Dennis Horne:
I see you are still refusing to answer my clear rebuttals of your twaddle.
I know your refusal is because you know your twaddle is wrong.
You know your refusal is because you know your twaddle is wrong.
All onlookers can see your refusal is because you know your twaddle is wrong.
And I will keep pointing out your refusal every time you try to change the subject.
Richard
Mr Horne lists some of the areas in which the satellites might once have been prone to error. What he carefully fails to state is that, unlike the terrestrial temperature records, the satellite datasets are calibrated by comparison of their mid-troposphere outputs with the mid-troposphere measurements of balloon-borne radiosondes, and also by platinum resistance thermometers that in turn calibrate themselves in real time by reference to the known temperature of the cosmic background radiation.
Mr Horne also somehow fails to state that the defects in the satellite records that led to an understatement of the warming rate were corrected more than a decade ago. The recent adjustment to the UAH dataset, which had been running hot, was to correct for the emission of heat from the onboard instrumentation, and had the effect not of increasing but of reducing the temperature trend, bringing it into line with the RSS satellite dataset, which provides a further measure of calibration.
Mr Horne is also culpably silent on the defects of the terrestrial temperature datasets. GISS, for instance, derives half of the warming it shows since 1900 from adjustments, many of them questionable.
Mr Horne is also silent on the calibration problems with the terrestrial datasets: the measurement uncertainty, caused by the fact that no standard instrumentation has yet been brought in worldwide (for fear that it would show very little warming); that no standard siting protocol to exclude the urban heat-island effect has been brought in worldwide (ditto); that the recent adjustments to all three terrestrial datasets to raise the apparent rate of warming still further were based among other things on ignoring the ARGO bathythermographs that give us the best evidence we have of ocean warming (and, in the 11 full years of their operation they show no warming of the ocean surface at all); then there is the bias uncertainty; then there is the coverage uncertainty (this one does not apply to the satellites), etc., etc.
Mr Horne may find it instructive to read the long and agonized series of messages in the Climategate file by a technician at the University of East Anglia explaining the difficulties in compiling the HadCRUT surface-temperature dataset.
Andm, in any event, on all records, terrestrial as well as satellite, the discrepancy between exaggerated prediction and unexciting reality is wide and widening. Shouting “consensus” does not alter that fact, which may easily be discerned from the head posting and verified by the numerous references cited there.
All the data sets show warming.
The projections have agreed with reality within the margin of error.
I don’t need to make a scientific argument of any description. I can choose to accept the consensus
Any fool can say that.
And:
All the data sets show warming.
Wrong, as always.
The latest false propaganda/talking point is that satellite data is inaccurate. That is simply a lie. No systm is perfect, but by comparison to all others, satellite data is by far the most accurate — and it clearly shows that global warming stopped more than 18 years ago.
Horne me boi, satellite corrections were made more than ten years ago, which fixed your #1 – #5. Who is giving you your misinformation to parrot here?
And:
All the data sets show warming
The most accurate ones show about 0.1ºC warming over 25 years, and zero warming for the past 10 – 18 years, but that isn’t the question. The earth is still emerging from the LIA, in fits and starts. What is being observed is natural climate variability, and it has happened before, repeatedly. This chart is from Dr. Phil Jones, an arch-Warmist:
http://jonova.s3.amazonaws.com/graphs/hadley/Hadley-global-temps-1850-2010-web.jpg
Go argue with Jones if you don’t like it …buddy.
You’re free to do as the moderator pleases, Richard.
If you reject a very broadly-based scientific consensus I would need to be delusional to think I could alter your deep-seated beliefs.
[Reply: This moderator is getting tired of your endless thread-bombing. You are constantly repeating talking points that have been debunked, while adding nothing original. -mod]
Mr Horne should change his record. Every time he bleats about “consensus” he reveals himself as feeble-minded. Science is not, repeat not, repeat not done by consensus. It is done by measurement and observation and the application of pre-existing theory to the results. The measurements are in, and on all datasets they show that the IPCC’s wild predictions were childish exaggerations. Mr Horne appears unable to produce any argument against the facts set forth clearly in the head posting. For his information, there is no scientist who, on being presented with these facts, would dare to claim that the predictions of the IPCC had proven skilful, when self-evidently and on all measures, terrestrial as well as satellite, they have not.
Agreed, science is not done by consensus. Nevertheless, work and reports done by scientists are reviewed and assessed by other scientists. In time, what was once original and possibly ground breaking becomes old hat — generally accepted. That is a consensus.
That is what has happened with evolution. It’s still disputed by a few religious fanatics but widely regarded as a fact of life.
The same with man-made climate change. It’s still disputed but accepted by nearly every climate scientist and informed scientist and scientific society on the planet.
Your endlessly repeated claim that scientists disagree is therefore nothing more than wishful thinking. Yes, there are some but the number who have a record of papers published in peer-reviewed journals is probably fewer than 10. Even counting the rubbish de Freitas was removed for allowing.
So, whatever weaknesses there may or may not be in the science, it’s been broadly accepted. You can write all the mumbo jumbo you like, scientists don’t seem to be taking any notice of you.
Of course they might all be wrong. A Nobel Prize awaits the first to prove it.
Mr Horne continues to demonstrate a desperate, invincible ignorance. As has already been explained to him upthread by others, no one here denies that our existence has the potential to influence the weather.
However, there is in fact no consensus, whether in the scientific journals or elsewhere, on the extent of the warming our activities will be expected to cause. The predictions of the amount of warming that should have occupied by now have proven wildly exaggerated. That is a fact that no appeal to mere consensus can in any way alter.
Also, since Legates et al. analysed exclusively papers in the reviewed journals, by definition 100% of the authors of those papers had a publication record. Yet only 64 of 11,944 papers explicitly endorsed the supposed consensus that recent warming was mostly manmade. There are in fact thousands of reviewed papers questioning the exaggerated claims and predictions of the profiteers of doom -and surprisingly few that support them.
In any event, science is not done by consensus, so further appeals to consensus on Mr Horne’s part will merely serve further to underline his petulant ignorance.
Horne says:
A Nobel Prize awaits the first to prove it.
A Nobel prize awaits the first scientist or group that produces a verifiable measurement quantifying AGW, as a specific fraction of all global warming.
You are arguing for something that has never even been measured. How is your argument any different from religion?
Dennis Horne:
Clearly, inability to read can be added to the list of your faults which you have demonstrated in this thread. You now say
Dear boy, if you were capable of reading then you would have read my post addressed to you that included this
As I said, I will persist in ignoring your attempted distractions and keep dragging you back to your refusal to answer my clear rebuttals of your twaddle.
Richard
Feel free to ignore me. You don’t seem to be doing a very good job of it.
The Lord Monckton Foundation archives these threads as a way to warn future generations of the dangers of totalitarian political interference with science. Future generations will be amazed at how incapable of independent thought the totalitarian true-believers such as Mr Horne were. The good news is that the hard Left are well known to all to be the drivers of the climate scare. As the scare collapses, so will the Left.
Good gracious. I’m going down in history.
Monckton of Brenchley January 18, 2016 at 3:18 pm
Mr Horne, who seems unwise in the ways of the world, closes what passes for his mind to the likelihood that scientific societies, which are special-interest lobby-groups first and foremost, have signed up the the climate scam because it is profitable.
You might go down in history too.
Dennis Horne:
Your reply to Viscount Monckton maintains your record of only making erroneous comments in this thread.
Nobody has made any suggestion that you will “go down in history”
but
Viscount Monckton has earned his place in history: there is no “might” about that.
Richard
Are you contradicting Lord Monckton? Or don’t you know what ‘archive’ means?
The Lord Monckton Foundation archives these threads … such as Mr Horne …
Dennis Horne:
I know what “archive” means but you are claiming to not know what “history” means.
You still have failed to address any of my refutations of your nonsense and everybody can see your failure is because you know you have only spouted nonsense.
Richard
Dennis Horne,
You’re arguing with everyone. Get a life, pal. You clearly have mental problems. It’s you against the world, eh? You need a girlfriend. Or whatever.
Dennis Horne:
Your inability to read is extraordinary!
I AM ignoring YOU but I am refuting your infantile nonsense so it cannot mislead others.
Why do trolls think THEY are important?
If you had any importance then you would be making useful contributions to things.
You still have failed to address any of my refutations of your nonsense and everybody can see your failure is because you know you have only spouted nonsense.
Richard
I can read you, buddy.
Dennis Horne:
You say to me
I am not your “buddy”: I consider that suggestion is an insult.
And if you can “read” me then there can be no excuse for your failure to address my refutations of your nonsense.
You still have failed to address any of my refutations of your nonsense and everybody can see your failure is because you know you have only spouted nonsense.
Richard
Oh, I though ‘buddy’ was quite mild as an insult.
dbstealey January 16, 2016 at 6:08 pm
…. Did you know that neo-Naz* John Cook owns that blog? He is the one promoting your debunked “consensus” propaganda. And you fell for it — assuming you’re not another neo-Naz*.
Dennis Horne:
You are posting yet more evasion.
You still have failed to address any of my refutations of your nonsense and everybody can see your failure is because you know you have only spouted nonsense.
Richard
You never answered either Richard or me. Or anyone, for that matter. You just make non-stop assertions which are simple-minded talking points you copy from thinly-trafficked alarmist blogs.
So why not answer when asked? Are you a neo-Nazi like Cook? Or are you just a juvenile parrot who doesn’t have a girlfriend …or whatever.
[trimmed. .mod]
You believe you have refuted my comments. So? What’s bugging you?
You think nearly all the climate scientists and informed scientists and scientific societies in the world are either wrong (or part of a scam).
If you are a scientist prove it. You’ll be hailed a genius.
Don’t bother ‘proving’ anything to me. As you implied I’m not important. Indeed, you have my permission to keep on ignoring me.
Horne says:
nearly all the climate scientists and informed scientists and scientific societies in the world…
You’re a one-trick pony. If you didn’t have the ‘Appeal to corrupted authorities’ logical fallacy to constantly parrot, your comments would look like this: ( “…” ).
Dennis Horne:
You keep posting red herrings in attempt to provide evasions.
I think this is because you lack any ability to understand the evidence put to you by several including me.
I “implied” nothing about you. I have said you are not important, but your silly assertions require repudiation to prevent them misleading others. Your comment could be understood to be a request for a clear statement of my opinion of you and, therefore, I provide that. I am not aware that I have ever met you, but your posts in this thread indicate that either
(a) you are an employed troll obtaining payments for making silly posts
or
(b) you are a sad act trying to bolster his low self-esteem by putting meaningless words on a screen for others to see.
I have proven much to you. And that includes my being a scientist when I have repeatedly referred you to my above post here that references and explains some of my past work.
You still have failed to address any of my refutations of your nonsense and everybody can see your failure is because you know you have only spouted nonsense.
Either admit you are wrong, or address my refutations, or run away.
Richard
richardscourtney: ” includes my being a scientist…”
The information I give is the accepted science. Prove it wrong and you will be hailed a genius.
Come on, give it a shot. As a scientist. Or not…
D. Horne asserts:
The information I give is the accepted science.
Accepted by whom? By science illiterates, and rent seeeking scientists. You’re in the former category.
And:
Prove it wrong
We have, over and over. But we still get the same reaction from you:
http://www.moonbattery.com/kathleen-backus.jpg
Yep, that’s Dennis.
Dennis Horne:
Are you mad? You say
But you have provided NO scientific information of any kind, “accepted” or otherwise!
You have only claimed a “consensus” that I have demonstrated does NOT exist.
That is one of the refutations of your nonsense I have already provided.
There is no evidence for anthropogenic (i.e. man made) global warming (AGW); none, zilch, nada.
Three decades of research conducted world wide for more than three decades at a cost of more than $5 billion per year has failed to find any evidence for AGW.
In the 1990s Ben Santer claimed to have found some such evidence but that was soon shown to be an effect of his having selected a sequence from within a time series!
Provide some such evidence and you would certainly be awarded at least two Nobel Prizes.
I repeat,
You still have failed to address any of my refutations of your nonsense and everybody can see your failure is because you know you have only spouted nonsense.
Richard
PS Your paymasters are wasting their money.
I developed a global warming/climate change model using Planck’s law, 380ppm atmospheric CO2 emissivity (Hottel), mean beam lengths, the fourth power law (Stefan Boltzmann) in 2008 and predicted that the then 10 to 11 year pause would go on for at least another 8 years and that is exactly what has happened. This is in complete contrast to other climate change models.
The simple truth is LWIR in the 15 micron band is absorbed to extinction after a short traverse through the atmosphere, so any additional CO2 has no effect. That is why there has been no global warming over the last 18 to 19yrs even though the partial pressure of CO2 has been steadily increasing from 0.00038 to 0.00040 or so atmospheres.
Chemengris is correct as far as the lower and perhaps the mid troposphere are concerned. It is only in the upper troposphere that the air is dry enough to prevent the principal absorption bands of water vapor from overlaying and swamping those of CO2. But whether a very large warming of the entire troposphere is possible as a result of the very few excitation/de-excitation collisions between photons in CO2’s absorption bands and the sparse CO2 molecules in the thin upper air is certainly a moot point. As far as the temperature records are concerned, it is beginning to look as though the original predictions of the IPCC were wildly exaggerated.
Whatever the projections or ‘predictions’ as you call them, Earth is heating and temperatures are rising.
Not good news.
Dennis Horne
Ah. But WHY do you claim “Not good news”? If in fact the earth is indeed warming at all.
What is the credible “harm” and what are the POTENTIAL HARM done to the world’s people for a theoretical decrease in global average temperatures between 0.0 and -1.0 degrees, and what is that probability of an decrease? (True, none of YOUR models is allowed to predict any decrease at all, but then again, NONE of your models forecast an 18 year pause in global average temperatures either, nor the very real decrease in global average temperature between 1945 and 1976.)
What is the credible “harm done” and what are the BENEFITS to the world’s people for a theoretical increase in global average temperatures and an increase in global CO2 levels between 0.0 and 1.0 degrees, and what is that probability of an increase? (More than 25% of climate models forecast only that little of an increase!)
What is the credible “harm done” and what are the BENEFITS to the world’s people for a theoretical increase in global average temperatures between 1.0 and 2.0 degrees, and what is that probability of an increase? (About 25% of climate models forecast only that increase!)
What is the credible “harm done” and what are the BENEFITS to the world’s people for a theoretical increase in global average temperatures between 2.0 and 3.0 degrees, and what is that probability of an increase? (More than 20% of climate models forecast only that little of an increase!)
What is the credible “harm done” and what are the BENEFITS to the world’s people for a theoretical increase in global average temperatures between 3.0 and 4.0 degrees and a continued increase in global CO2 levels, and what is that probability of an increase? (Less than 15% of climate models forecast only that much of an increase!)
What is the credible “harm done” and what are the BENEFITS to the world’s people for a theoretical increase in global average temperatures greater than 4.0 degrees, and what is that probability of an increase? (Less than 10% of climate models forecast only that much of an increase; yet your favorite “gloom and doom” forecast REQUIRES much more than a 5 degree increase in temperatures by the year 2100 for even a measurable – much less harmful – increase!)
Dennis Horne,
Thanx for showing the planet’s natural recovery from the LIA. And we always like to see those “adjusted” graphs from B.E.S.T., which tried to pull a fast one before:
Falsus in uno, falsus in omnibus.
And you baselessly assert: Not good news.
Explain why a warmer world is a bad thing. The planet has been up to 8ºC warmer in the past without causing any ‘climate catastrophe’. In fact, the biosphere flourished with life and diversity during warmer times. It’s cold that kills.
Since you’re the official parrot of the scientific illiterates who occastionally post here, explain what the problem is at this point:
http://jonova.s3.amazonaws.com/graphs/lappi/gisp-last-10000-new.png
Dennis Horne:
Whatever the projections or ‘predictions’ as you call them, Earth STOPPED heating and temperatures STOPPED rising nearly two decades ago.
This is not good news because the Earth has yet to recover from the LIA such as to attain the warm temperatures of the Medieval Climate Optimum.
But this is science and you have repeatedly demonstrated that you refuse to accept science.
And you are still providing evasions.
You still have failed to address any of my refutations of your nonsense and everybody can see your failure is because you know you have only spouted nonsense.
Richard
Mr Horne, in quibbling over my use of the word “predictions” for the IPCC’s predictions, is plainly unaware of the IPCC’s documents. Its First ASSessment Report in 1990 opens its paragraphs of prediction with the words “We predict …”. If, therefore, he objects to the use of the word “predictions” now that the predictions have failed, he should take the matter up not with me but with the IPCC.
Me, I call a spade a spade and a prediction a prediction and a failed prediction a failed prediction.
http://ds.data.jma.go.jp/tcc/tcc/products/gwp/temp/fig/an_wld.png
http://berkeleyearth.org/wp-content/uploads/2016/01/Annual_time_series_combined1.png
Dennis Horne:
You have resorted to posting very debateable graphs.
But if they were correct then, so what?
Nobody disputes that the Earth has been warming from the Little Ice Age since centuries before the industrial revolution.
Your graphs are merely additional evasions.
You still have failed to address any of my refutations of your nonsense and everybody can see your failure is because you know you have only spouted nonsense.
Richard
Mr Horne, at last realizing that merely chanting the “consensus” mantra is not going to impress anyone with scientific training, for most of us here are from a generation to whom logic was taught, has now begun to do some science by posting a pair of graphs showing global temperature rising. However, the point is fairly made in the head posting, which he appears not to have read before presuming to criticize it, that the three terrestrial temperature datasets of longest standing – GISS, HadCRUT4 and NCEI – all show warming over the past 18 years 8 months, albeit at not much more than the equivalent of 1 Celsius degree per century, which is likely to be beneficial rather than life-threatening.
Since he is not aware of much of the history of the climate scare, he should know that until a couple of years ago all datasets – including these three terrestrial datasets – were showing no global warming. The RSS satellite continues, as it did then, to show no warming. But the terrestrial datasets have all been altered to make it seem as though there has been warming this millennium, when their unadjusted versions would probably have shown no warming at all, like the satellite datasets.
The subject of the head posting, however, is not whether or not the world has been warming in the past 18 years 8 months. It may or may not have warmed, depending on which datasets you favor or which storyline you want to peddle. The head posting, however, fairly shows the warming rates on all five datasets from 1990 to now, from 1995 to now, and from 2001 to now (the start dates being the publication years of the IPCC’s First, Second and Third ASSessment reports). It should be evident, on the basis of the graphs provided, that none of the datasets shows warming at anything like the central prediction made by the IPCC in 1990, or for that matter in either of the two subsequent reports.
Data, as has already been explained upthread, trumps mere theory every time. The theory was that from 1990 to now there should have been warming of close to three-quarters of a Celsius degree, but there has not been warming at anything like that rate. The models have failed. They have been compelled to reduce their medium-term predictions so as not to be as badly embarrassed as they were by the wild exaggerations printed in IPCC (1990); but they have not correspondingly reduced their long-term predictions, as they would have done if they were acting professionally rather than politically.
My model considered first generation photon absorption only for a) dry air and b) moist air (water vapour partial pressure 0.023 atmospheres). I then assumed that further excitation/de-excitation collisions would have very little warming effect before the final exit and did not justify the considerable maths/physics reasoning that would be required for a few extra decimal places.
Temperature Anomaly
I don’t like this term. It implies a ‘normal’ temperature. What’s that? Which gremium decides, what is normal and what not?
lorenz:
You ask
Temperature anomalies are a method of pretending the trivial global temperature anomaly rise of ~0.8°C over the last century is significant.
Global temperature rises by 3.8°C from January to June and falls by 3.8°C from June to January each year and nobody notices. Indeed, global temperature is highest when the Earth in its orbit is most distant from the Sun so radiative forcing is lowest. A good explanation of this is here.
Please note that warmunists claim global temperature should be prevented from rising by 2°C. They must be ignorant of the fact that global temperature rises and falls by nearly four times that amount each year while nobody notices.
Richard
Ooops!
I intended
… global temperature rises and falls by nearly TWO times that amount …
Sorry.
Richard
So if you took the temperature of a running bath you would get the same reading no matter where you measured it and whether or not you stirred it — you would get the ‘average’. You wouldn’t get one part very much hotter than another. Even though the average might be lower. It would be perfectly comfortable everywhere.
Ding-ding-ding-a-lingNo bell Prize.
Ok, so somebody decided that the global temperature a hundred years ago was the norm.
Who is this somebody? How did he get to select this specific date?
If I’d have to choose a norm I’d select the roman warm period.
Dennis Horne:
Are you trying for the record of making the most stupid comment ever on WUWT?
Global temperature is an average. Indeed, the erroneous graphs of global temperature that YOU have posted in this thread each provides a time series of averages.
It is a pity that you again demonstrate you cannot read because if you were able to do that then you would have read the link I provided which explains that the seasonal variation of up 3.8°C and down 3.8°C is because temperatures vary by different amounts in the two hemispheres.
3.8°C rise in global temperature IS nearly double the 2°C rise in global temperature warmunists say they want to avoid. Nobody notices the 3.8°C rise.
And the Earth is NOT “comfortable everywhere” (try living in the Sahara or Antarctica equipped for a warm day on Miami Beach).
That ringing you heard, was it between the voices in your head?
And you still have not answered my rebuttals of your twaddle.
You still have failed to address any of my refutations of your nonsense and everybody can see your failure is because you know you have only spouted nonsense.
Richard
lorenz:
The climate normal is any period with length of 30 years.
The IPCC AR5 Glossary defines climate as being
So,
climate is ‘average weather’ over any “period of time ranging from months to thousands or millions of years” but the period needs to be stated.
The 30 years refers to a standard period to which climate data is compared: it is NOT climate. And its length is arbitrary: it was adopted in 1958 as part of the International Geophysical Year (IGY) because it was thought that there was insufficient data for use prior to 30 years before 1958. It is an unfortunate choice because 30 years is not a multiple of the solar cycle length, ot the Hale cycle length, or any other climate cycle length.
To obtain a temperature anomaly for a month (e.g. June) the average temperature of 30 successive years of that month (i.e. 30 successive June temperatures) is obtained and that value is subtracted from the average temperature of the month (e.g. another June) to be reported.
Richard
So, we’re moving from a position of no warming and wrong to “exaggerated”.
Dennis Horne:
You again demonstrate your inability to read.
Viscount Monckton did NOT “move”. Read what he wrote.
Your misrepresentation of Viscount Monckton is another evasion.
You still have failed to address any of my refutations of your nonsense and everybody can see your failure is because you know you have only spouted nonsense.
Richard
Goodbye,
– Dunce.
Dennis Horne:
“Goodbye”? Do you mean you are leaving?
If you are then I suppose that good news means your paymasters have at last recognised they have been wasting their money.
Richard
Mr Horne should read the head posting before attempting to comment here again. He will find plenty of evidence that the original predictions made by the IPCC in 1990 were wild exaggerations. That is why the IPCC, in subsequent reports, reduced its medium-term predictions very substantially – but not substantially enough. The warming rate – on all datasets – has been falling faster than the predictions have been falling, so the IPCC’s predictions are still exaggerated.
And the head posting does not assert “a position of no warming”. Instead, it shows that the two satellite datasets show no warming, but it also fairly shows that the three longest-standing terrestrial datasets show warming (though they did not do so for this century until a couple of years ago, when the records were all altered to fit the theory – never a good move, because it leaves traces. The most notorious example of outright tampering was the decision by NCEI arbitrarily to alter the ARGO bathythermograph records of sea temperature to bring them into line with the previous sea-temperature record compiled from canvas buckets dipped into the ocean, ships’ engine intakes etc., etc. That piece of desperate and unjustifiable was reported to the Senate Science, Space and Competitiveness Subcommittee, which now no longer believes any of the terrestrial records.
As Senator Cruz and Dr Curry said at the hearing, the satellite data – for all their faults and uncertainties – are the best data we have.
Cruz. The old joke, how do you know when a politician’s lying? Judith Curry: “Satellite data are the best we have”. Just can’t find another climate scientist to agree. Because it’s not true.
Dennis Horne:
Please justify your silly assertion that there are other assessments of the global average temperature anomaly which are as good as the satellite data. Your justification needs to include an independent validation such as the radiosonde (i.e. weather balloon) data provides for the microwave sounding unit (i.e. satellite) data.
Also, you still have failed to address any of my refutations of your previous nonsense and everybody can see your failure is because you know you have only spouted nonsense.
Richard
Richard
Thanks for the explanation and the link.
fits very nicely with my own private definition of climate. 😉
An unusual cold December is no cause for alarm, but a series of those might be.
btw, I just read the ‘Little Ice Age’ Wikipedia article. I find it very funny that
is followed by many examples of worldwide cool periods (Africa, Antarctica, Australia, China…).
lorenz:
Thankyou for your acknowledgement that I was able to provide some help. Please let me know if you think I may be able to help in future.
You mention the distorted wicki report of the LIA.
Wicki is very distorted on everything concerning AGW. So, I think you may want to read the original studies of the LIA collated by ‘CO2 Science’ that can be accessed fromhere.
Also, your interest in the LIA suggests to me that you may enjoy reading studies of the MWP collated in the MWP Project.
Richard
Richard
Thanks for the links.
I bookmarked them for later use.
Lorenz
Monckton of Brenchley should read what’s happening now and stop living in the past.
http://www.metoffice.gov.uk/news/releases/archive/2016/2015-global-temperature
http://www.metoffice.gov.uk/media/image/d/2/hadcrut4_graph_small.jpg
Mr Horne should read the head posting. On all datasets, the rate of global warming is well below the IPCC’s wildly exaggerated predictions.
Agreed, the actual warming today may be less than that projected 20 or 25 years ago.
Jolly Good News. Calls for a celebration. Doesn’t it.
Because, without doubt, it’s bad enough. We’ve increased CO2 40% from 280 to 400ppm. With the best agreements in the world, there’s a lot more CO2 to go into the atmosphere.
Of course it would help if intelligent people would stop being silly. Fancy non-scientists thinking they know more than nearly all the climate scientists and informed scientists and scientific societies on the planet.
Dennis Horne:
Sadly, your suggestion that you were leaving was another of your falsehoods, and you have posted more nonsense. But you forgot to address my rebuttals of your earlier nonsense.
You still have failed to address any of my refutations of your nonsense and everybody can see your failure is because you know you have only spouted nonsense.
Richard
Mr Horne should read the head posting. On all datasets, the rate of global warming is well below the IPCC’s wildly exaggerated predictions. Warmer weather is not automatically a bad thing: it is a good thing for most species on Earth, including us.
Yes, the CO2 concentration has risen, but, to the nearest tenth of one per cent. If there is CO2 in the air it will cause some warming, but on balance not very much.
richardscourtney January 19, 2016 at 3:04 am
** richardscourtney January 14, 2016 at 2:02 am
https://en.wikipedia.org/wiki/Energy_%26_Environment
Abstracting and indexing
According to the Journal Citation Reports, the journal has a 2012 impact factor of 0.319, ranking it 90th out of 93 journals in the category “Environmental Studies”.[5]
Criticism
According to a 2011 article in The Guardian, Gavin Schmidt and Roger A. Pielke, Jr. said that E&E has had low standards of peer review and little impact.[8] In addition, Ralph Keeling criticized a paper in the journal which claimed that CO2 levels were above 400 ppm in 1825, 1857 and 1942, writing in a letter to the editor, “Is it really the intent of E&E to provide a forum for laundering pseudo-science?”[8][9]
Climate change skepticism
When asked about the publication in the Spring of 2003 of a revised version of the paper at the center of the Soon and Baliunas controversy, Boehmer-Christiansen said, “I’m following my political agenda — a bit, anyway. But isn’t that the right of the editor?”[12]
No wonder the climate scientists ignore you.
You suffer delusions of grandeur.
Dennis Horne,
E&E is a recognized peer reviw journal.
From someone who trumpets ‘peer reviewed science’, you are certainly being hypocritical. Either an author is peer reviewed, or he isn’t.
The proper way to argue is to find out if Richard Courtney was forced, (like Michael Mann), to issue a debunkibg Corrigendum, then admitting that there were serious errors in his paper. If you could find a retraction or correction of some sort, your argument would carry weight.
But you’re just being juvenile and a poor loser in your last comments. And I note that you never answered the question: what’s your CV?
Crickets…
Post it here, if you have one, chump. Otherwise, your opinion is not credible, while Courtney’s is.
Is Richard S Courtney a scientist? I don’t think so. He’s a PR man or something like that who had his views printed in a magazine or journal that has no scientific standing whatsoever. That’s not my opinion, it’s clearly general knowledge.
If I decide to lash out against nearly every informed scientist and scientific society in the world then ask me for my credentials. Otherwise they’re irrelevant.
All one needs to accept such a long-standing and broadly-based scientific consensus is a rational mind.
Naturally if someone really clever and informed can prove it wrong, we can all relax. And rejoice.
Dennis Horne,
You never answer the question: what is your CV? Do you even have one? How are you qualified to give an opinion? Are you a scientist?? Yes or no? If yes, prove it. Richard already has.
Richard Courtney is a published, peer reviewed author. You, of all people, lack the credibility to decide which publications are acceptable. In fact, because of your one-trick-pony endlessly repeating the ‘appeal to corrupted-authorities’ logical fallacy, and your ad hominem logical fallacy here, it’s clear you have no other arguments. You lose.
[Comment deleted. Identity thief/sockpuppet. -mod]
Dawtgtomis is gonna be mad that an identity thief has stolen his name.
Dennis Horne:
Nobody cares that you know nothing about me.
My entire income in my adult life was from my employment as a research scientist. Not only am I not a “PR man or something like that”, my health prevents me being anything like that.
I have published in journals including Nature and Microscopy but I am most pleased to have published in E&E: Energy & Environment is indexed in the ISI and is cited 28 times in the IPCC reports .
Now, if you were able to refute my work you would, but you cannot so you make spurious comments about me. Sad, very sad.
Richard
Horne says:
Is Richard S Courtney a scientist? I don’t think so.
The juvenile site pest D. Horne still avoids disclosing having an education, if any, that could support his opinions. Horne would get a promotion up to ignoramus if he posted his hard science accomplishments.
So, Horne, what qualifies you to give an opinion on a published, peer reviewed author?
Monckton of Brenchley January 21, 2016 at 1:26 pm
No CO2 no greenhouse effect. No greenhouse effect and we’d all be freezing. Wouldn’t we.
No, because there is enough water vapour (partial pressure 0.023 atmospheres) with much wider absorption bands than CO2.
Thank you. How much water vapour would there be if the surface temperature were -18 Celsius?
At -18C the moisture content of air is 1480ppm.
chemengrls,
Don’t bother trying to explain, it’s way over D. Horne’s head. He just doesn’t understand.
[American Chemical Society]
http://www.acs.org/content/acs/en/climatescience/climatesciencenarratives/its-water-vapor-not-the-co2.html
The greenhouse effect that has maintained the Earth’s temperature at a level warm enough for human civilization to develop over the past several millennia is controlled by non-condensable gases, mainly carbon dioxide, CO2, with smaller contributions from methane, CH4, nitrous oxide, N2O, and ozone, O3.
The water vapour carrying capacity of air is very high; at 40C it is 79000ppm, 27C 35000ppm, 20C 23000ppm, 0 deg C 6050ppm in a form that will absorb LWIR. Even at 0 deg C it is 20 times greater than CO2. It is also a scrubbing agent on condensation, with a large interfacial area that will effectively scrub out CO2, and oxides of N2 (CH4 is only 1ppm and not worth bothering about).
dbstealey January 21, 2016 at 2:00 pm
If you were ill would you seek the opinion of doctors qualified in the field and accept the consensus or would you seek the opinion of cranks, quacks, barefoot doctors and one or two doctors dismissed by their colleagues as having a bee in their bonnets?
No doubt you would if they said there was nothing wrong with you.
Because your judgement is unsound. You’re handicapped by wishful thinking.
Dennis Horne,
You quoted the wrong part. Here’s the question you need to answer:
You never answer the question: what is your CV? Do you even have one? How are you qualified to give an opinion? Are you a scientist?? Yes or no? If yes, prove it. Richard already has.
A central characteristic of the alarmist contingent is that you hide out from answering questions. I’ll be happy to answer yours, like I have many times. But since you never answer questions, it’s your turn. Answer the question I asked.
Richard [S Courtney] already has [proved he is a scientist]
Where?
D. Horne,
I know why you won’t answer a simple question. You have no credibility. You’re just another uneducated lemming who parrots nonsense.
And that is why you won’t post your CV: you don’t have any credible education in the hard sciences.
So you try to make up for your inadequacy by attacking the accomplishments of a published, peer reviewed author:
Is Richard S Courtney a scientist? I don’t think so.
What you think does not matter. You’re surely the most pathetic commenter in this thread. If you can prove you’re qualified to pass judgement on someone who knows far more about the subject than you can ever hope to learn, I will retract and apologize.
But we all know the truth, don’t we? You’re nothing.
Are global average temperature rising? Hmm, let me see…
http://arstechnica.com/science/2016/01/thorough-not-thoroughly-fabricated-the-truth-about-global-temperature-data/
http://cdn.arstechnica.net/wp-content/uploads/2016/01/1850-to-2015-temps-no-rss.png
WARNING: Arstechnica is infested with spyware, and twice now they’ve been hacked and lost the personal info of readers.
That aside, as usual Horne presumes that global warming is man made. But he doesn’t have any credible evidence for his belief system. Show him any chart of rising temps, and he gets all excited. heh…
WARNING. Arstechnica. Can you the truth?
http://arstechnica.com/staff/2014/12/ars-was-briefly-hacked-yesterday-heres-what-we-know/
[Reply: it is a fact that AT has had major security problems. Their response is self-serving. Linking to the same blog means very little. -mod]
Horne,
The only thing you’ve shown is natural global warming as the planet rebounds from the LIA. If AGW was being added, the warming would be accelerating.
But it’s not. In fact, despite the full court press by politicians who crave a carbon tax and their tame, rent seeking scientists, global warming stopped many years ago. Only credulous fools believe otherwise.
Figure 1. How Does CO2 Compare To Other Climate Drivers?
http://www.ucsusa.org/global_warming/science_and_impacts/science/CO2-and-global-warming-faq.html#.VqGs6Pl97tQ
http://www.ucsusa.org/assets/images/gw/climate-influence-faq.PNG
D. Horne,
That chart is the most preposterous bunch of self-serving nonsense I’ve seen in a long time. It is a stupid magnet; that’s how it attracted you.
Water vapor is by far the biggest climate driver outside of the sun and oceans, but they parse water vapor, saying “water vapor from methane”
That’s just another example of the UN/IPCC’s duplicity. Intelligent folks aren’t swayed by nonsense like that. But you’ve been convinced, LOL!
Since 2002 there has been NO global warming. NONE. So their “human induced Climate Drivers” is falsified as total nonsense. IPCC pronouncements are only swallowed by the gullible.
That’s you, Horne.
Since 2002 there has been NO global warming. NONE. So their “human induced Climate Drivers” is falsified as total nonsense. IPCC pronouncements are only swallowed by the gullible.
National Oceanic and Atmospheric Administration reported 2015 the warmest worldwide since 1880, breaking the previous 2014 record by the widest margin ever observed. During 2015, the average temperature across global land and ocean surfaces was 1.62F (0.90C) above the 20 C average,
NASA confirmed 2015 broke records for heat in contemporary times.
Doesn’t look like a fair fight, dbstealey. Looks like “they” are all out to “get you”.
And you believe everything they tell you, Mr. Credulous?
Both NOAA and NASA/GISS have repeatedly ‘adjusted’ the temperature record — and their ‘adjustments’ always end up showing more scary warming. What are the odds of that, eh?
You are being led by an invisible ring in your nose, by corrupt bureaucrats who know exactly what they’re doing. But you can’t see it, because you like not thinking for yourself.
You wild-eyed Chicken Littles are terrified that CO2 has risen by one (1) part in ten thousand over the past century, and you’ve been convinced by charlatans that the result will be climate catastrophe. Every comment of yours reveals more ignorance. I’m astonished that someone with zero accomplishments like you isn’t embarrassed to post talking points as if he understands.
Have you got something against body piercings?
Have you got something against body piercings?
I was wondering about that hole in your head.
Hole in the head? [snip]
richardscourtney January 22, 2016 at 10:10 am
Richard, my apologies. Published in nature, eh, that’s very impressive.
[Ad-homs and “denier” links snipped. -mod.]
You can understand how anyone could make a mistake. Please accept my apologies.
D. Horne:
It’s still unclear which person is which, but no matter. I am impressed with whomever is being so jealously reported upon in your posted links (and what, may I ask, is a “denier”? What is being denied? Be specific… oh, forget it. You won’t answer anyway).
I’m impressed with both individuals, and unlike you, the person linked has accomplished all those things and has my respect. He is impressive, doing work you can only dream about as you wait on lunch patrons. The jealous ‘desmog’ writers don’t report on the other person, leaving readers to guess which is which. But no one has to guess about you, because we know. Don’t we?
You’ve been asked many times to post your own accomplishments, to the sound of crickets chirping. So we know what that means:
It means you have no accomplishments. You are a human zero. A nothing. A failure. It shows in your comments, which are simple-minded parroting of similar nothings.
Prove me wrong, chump. Now’s your chance. Post your CV, and prove me wrong, LOL!
Dennis Horne:
You made no “mistake”. You made a vitrioic and untrue personal attack against me as an attempt to deflect from the fact that you have not and cannot answer my rebuttals of nonsense you have posted in this thread.
Richard
I made no comments other than what appears above, so the accusation of ad hominem is entirely false. I never mentioned the word den***. I did link to two sites describing a man of the same name who is a fake.
richardscourtney January 23, 2016 at 1:16 am
Where?
Dennis Horne,
If you would stop your envious ad hominem attacks and just debate science, you could save millions of pixels.
But first, post your qualifications. I think you’re an [trimmed].
Prove me wrong. If you can.
[Please do not insult uneducated parrots by comparing them to trolls. Sometimes they repeat the truth, though they know not what they are saying. .mod]
Dennis Horne:
You are still trying to deflect from the fact that you have not and cannot answer my rebuttals of the nonsense you have posted in this thread. And your post I am now answering is more untrue nonsense posed as a silly question
Richard
Not on here they wouldn’t.
Nearly all climate scientists and informed scientists and every scientific society on the planet VERSUS …
Dennis Horne
Studies quoting (government-paid) “scientists” find 97% (well, only 75 of 13,500 scientists surveyed)
Nearly allclimate scientists are government-paid slavishly addicted to the continued government-funding only made possible by government bureaucrats and politicians desiring the 1.3 trillions in control of the new carbon taxes made possible by and enabling the government-donors in the 31 trillion annual carbon trading schemes invented by ENRON in the 1990’s …Studies of “so-called” scientific societies find their heads and leaders are following their money, their politics, and are only united denying their members ANY voice in the bureaucratic claims made by their bureaucratic administrators to the government bureaucrats.
RACookPE1978 January 23, 2016 at 12:31 pm
Why didn’t I think of that?
Thank goodness for “so-called” experts who don’t belong to scientific societies to put me right.
Why didn’t I think of that?
Must… resist… temptation…