Satellite data shows globe will stay below 1.5°C target at the current rate of warming, resulting in 1.1°C
 December 18: University of Alabama, Huntsville
The average temperature of Earth’s atmosphere has warmed just over four tenths of a degree Celsius (almost three fourths of a degree Fahrenheit) during the past 37 years, with the greatest warming over the Arctic Ocean and Australia, said Dr. John Christy, director of the Earth System Science Center at The University of Alabama in Huntsville. Microwave sounding units on board NOAA and NASA satellites completed 37 complete years of collecting temperature data in November, giving us nearly global coverage of climate change during that time.
If that trend was to continue for another 63 years, the composite warming for the globe would be 1.1 C (about 2 degrees Fahrenheit) for the century, Christy said. That would put the average global temperature change over 100 years well under the 2.0 C (3.6 degrees F) goal set recently at the climate change summit in Paris.
Due in part (but not exclusively) to the ongoing El Niño Pacific Ocean warming event, the global temperature trend has been trending slightly warmer over the past several months, Christy said. While the current global trend is just under 0.115 C (rounded down to 0.11), he expects the trend line to cross 0.115 C in the next several months, raising the global trend to 0.12 C per decade.
Two major volcanic eruptions in the first half of the 37-year satellite temperature record (El Chichon in 1982 and Mount Pinatubo in 1991) depressed temperatures over large portions of the globe. While natural events, their random eruptions during the first half of the dataset has the effect of tilting the trend upward more than it otherwise would have been.
While a 0.12 C trend isn’t exactly a sprint to climate catastrophe (the 1.2 C or 2.2 degrees F rise over 100 years would be roughly equal to the warming seen most spring days between 10 a.m. and noon), it nonetheless has been a steady trend for the past several years. Take away the random variations caused by warm and cold weather systems, and any long-term trend, no matter how small, will produce climate records on a regular basis. Add to that long-term warming the additional heat of a large El Niño, and record-setting monthly average temperatures should be both routine and expected.
Despite that, early indications are that 2015 will end as the third warmest year in the satellite temperature record, behind 1998 and 2010. That is the early indication. Typically, the warmest temperatures are seen in the second year of an El Niño warming event, although there have been exceptions. If the typical pattern holds true, the second year of the current El Niño would be expected to bring more record high temperatures in 2016, perhaps including a new record high temperature for the year.
The fastest warming place on Earth over the past 37 years has been in the Arctic Ocean north of the Svalbard archipelago, where temperatures have been rising 0.5 C (about 0.9 degrees F) per decade. The fastest cooling spot was over the eastern Antarctic near Dome C. Temperatures there have been falling at the rate of 0.41 C (about 0.74 degrees F) per decade.
Global Temperature Report: 12/1978 through 11/2015
Global climate trend since Nov. 16, 1978: +0.11 C per decade
37-year temperature trends:
Global average trend.: +0.11 C (about 0.20 degrees Fahrenheit) per decade since December 1978.
Northern Hemisphere: +0.14 C (about 0.25 degrees Fahrenheit) per decade since December 1978.
Southern Hemisphere: +0.09 C (about 0.16 degrees Fahrenheit) per decade since December 1978.
Tropics: +0.10 C (about 0.18 degrees Fahrenheit) per decade since December 1978.
37-year composite changes:
Global Composite: +0.41 C (about 0.73 degrees Fahrenheit) composite change since December 1978.
Northern Hemisphere: +0.52 C (about 0.93 degrees Fahrenheit) composite change since December 1978.
Southern Hemisphere: +0.33 C (about 0.60 degrees Fahrenheit) composite change since December 1978.
Tropics: +0.37 C (about 0.67 degrees Fahrenheit) composite change since December 1978.
37-year warming
Trend per decade Composite
Globe +0.11 C +0.41 C
Land +0.20 C +0.74 C
Ocean +0.08 C +0.30 C
N.H. +0.14 C +0.52 C
Land +0.21 C +0.78 C
Ocean +0.09 C +0.33 C
S.H. +0.09 C +0.33 C
Land +0.18 C +0.67 C
Ocean +0.07 C +0.26 C
Tropics +0.10 C +0.37 C
Land +0.21 C +0.38 C
Ocean +0.07 C +0.26 C
NoPole +0.23 C +0.85 C
Land +0.19 C +0.70 C
Ocean +0.26 C +0.96 C
SoPole -0.01 C -0.04 C
Land -0.01 C -0.04 C
Ocean -0.01 C -0.04 C
USA48 +0.19 C +0.70 C
Australia +0.24 C +0.89 C
The complete version 6 beta lower troposphere dataset is available here:
http://vortex.nsstc.uah.edu/data/msu/v6.0beta/tlt/uahncdc_lt_6.0beta4.txt
Archived color maps of local temperature anomalies are available on-line at:
As part of an ongoing joint project between UAHuntsville, NOAA and NASA, Christy and Dr. Roy Spencer, an ESSC principal scientist, use data gathered by advanced microwave sounding units on NOAA and NASA satellites to get accurate temperature readings for almost all regions of the Earth. This includes remote desert, ocean and rain forest areas where reliable climate data are not otherwise available.
The satellite-based instruments measure the temperature of the atmosphere from the surface up to an altitude of about eight kilometers above sea level. Once the monthly temperature data are collected and processed, they are placed in a “public” computer file for immediate access by atmospheric scientists in the U.S. and abroad.
Neither Christy nor Spencer receives any research support or funding from oil, coal or industrial companies or organizations, or from any private or special interest groups. All of their climate research funding comes from federal and state grants or contracts.
— 30 —
“If me aunt had Bxxx she’d be me uncle” assuming it evens warms that much. It could actually cool dramatically
No worries for alarmists. The IPCC will just declare that 1.1 degrees C per century will have catastrophic consequences, and point to scary “warmest year ever” in cooked book “surface data”.
Note the agreement with our host’s data from pristine surface stations.
UAH USA48 ———- .19 C / decade (11/1978-11/2015)
Unperturbed USA — .20 C / decade (1979-2008)
Bingo.
The was the first number that JUMPED out at me… along with the fact and this is just weird. However, land whether it be NH, SH, or tropics are all warming at the same rate. Which is similar to oceans, they are all warming at the same rate, with the exception of the Arctic.
Globe land – .20 / decade
NH land – .21/ decade
SH land – .18/ decade ** relatively close
tropics land – .21/ decade
No Pole land – .19/ decade
contiguous 48 – .19/ decade
I find it not only weird but highly unlikely that all the land would be warming at the same rate, could there be a problem with how the wavelengths are interpreted….
I did find the fact that the satellites and unadjusted/ well sited thermometers have a similar rate of warming… However, once again don’t read into it, thermometers measure temp at 1.5 meters, while satellites measure at all levels of the troposphere.
Brian
Brian, your list excludes So Pole land, whose rate was -.01/decade.
Completely unrelated, its disconnected from all other major landforms. All the ‘NoPole’ land is connected to either Asia, Europe, or N America so part of continental land forms, minus of course the islands.
Remember, the S Pole is an island that has a completely different weather system. That said, you are correct, there is a huge difference between that and the rest.
Well, it is a rate per decade. So maybe on the decadal time scales the land and atmosphere are in equilibrium? The oceans, however, would take much longer (60 years to centuries? or millenia?). If the rate of ocean warming (not just sea surface temp’s) was the same, that would be a problem.
Nice point.
I must admit i am having difficulty reconcling that we all seem to accept that the earth is warming .19C or .20c per decade and the Pause which states there has been NO warming for 18+ years. Can those that know more than me please comment
Let us suppose we have a man who was conceived 37 years ago and who is now 6 feet (72 inches) tall. And let us suppose he reached this height 18 years ago. His average growth rate would be 72 inches/37 years = 1.9 inches per year. However at the same time, he did not grow in the last 18 years.
Werner Brozek
Best explanation I have seen. You make it so simple. Thankyou.
Eugene WR Gallun
That’s neat. I was actually thinking about asking the question: how well does Anthony’s best data match the satellite record?
If the global match is as good as your figures for the USA, then that’s a major boost for Anthony – and the satellite/radiosonde records.
The massive divergence between the satellite and ground records is surely the elephant in the room. At some point it will become completely unsustainable – and something will have to give.
Chris
May I humbly suggest that the criteria for comparison between this work and the satellite record concerns only the land figures.
A glance at the UAH data shows that there is something ‘odd’ above land v oceans over the satellite period.
The land temperature has risen much faster over that period than the oceans. Perhaps they have compensated for that and thereby messed up prior data?
https://www.dropbox.com/s/gixvd270vdrl4z4/rlh-full-uah-triad%20plots.r
I suppose that these might be more directly relevant.

Anyone care to comment of phase of the signals thus displayed? Causation anyone. The Ocean looks like it was pushing the land much earlier than the ‘peak’ La Nina in the middle. And now we are pretty much in phase. Care to guess which way this all might go?
El Nino damn it. Up not down.
“If we looked at untampered NOAA/NASA data covering the same time period as the satellite data, it might be possible to better speculate on Richard’s “it might be right [that NOAA/NASA data is methodically biased].”
I don’t think that ‘tampering’ are quite the words to use. ‘Tunnel vision’ might be closer.
Nice reality check.
Hi Werner,
Yes, the obvious explanation did also occurr to me. However, in some of the graphs published on WUWT that show the actual warming rate is lagging well below the climate models overinflated rates, the last 18 years are still shown as small increases and not as flat line. This leaves me a bit vulnerable when trying to argue with my warmist colleagues
RSS is very slightly negative for 18 years and 9 months, so starting with March 1997 gives a flat line on WFT.
UAH6.0beta4 gives a negative slope for 18 years and 6 months, so you need to start in June 1997. However WFT only shows version 5.6 which is a huge problem. You have to go to the following site to verify what I said about UAH6.0beta4:
http://moyhu.blogspot.com.au/p/temperature-trend-viewer.html
Drawing linear trend lines on various parts of a cyclic pattern is willful self-deception (such as from 37 yrs of data on what is probably ~60 yr cycles). Mr Nyquist said something about that.
Yep,, he most certainly did. And since the underlying signals (e.g. PDO) are quasi-periodic, you need far more than 2 periods to see a signal. More like 5. Hope we keep the satellite record consistent for ~300 years.
Peter
The 21st century will have two negative periods fit in from the ~60 year cycles. It means there will be little warming during the 21st century not counting how solar activity declines in future. Regarding the true indication of climate it really should cover two 60 year cycles, so can compare how both positive and negative phases have changed. It is clear that the natural ~60 year cycle is in charge over the recent period since the 1940’s.
Here’s my take on that, (from elsewhere on WUWT).
The problem of people using straight line ‘trends’ of any climate time series is that I think that Nyquist might have uttered the rather dry observation
“The width of the data capture window available does not support the bandwidth required to get to that frequency. You can’t draw a straight ‘trend’ line on a time series graph as that implies an infinite lower bandwidth which you do not have in that data”.
Straight lines on time series graphs are propaganda at best. Not science. IMHO. He might have agreed.
The width of the data capture window
===========
that is an interesting observation. with a small window to look out, you can’t tell if the data is a straight line or a curve. As such, it is equally valid to fit a long period curve to the data as it is to fit a straight line.
Which means that your trend can exist anywhere along the area swept by the curves, with the straight line no more likely than any other curve. The only thing that sets the straight line apart is that it is the average of all the possible trends. This however does not make it most likely.
In point of fact, it would likely be more instructive to draw two additional curves on the trend, representing the maximum and minimum trend possible given the size of the sample window, and remove the straight line trend altogether, because it provides no additional information, and may well be misleading.
I don’t know you can ever sort the mess out at the bottom end. The amount of noise in the signal will allow almost any phase and some magnitude changes to occur.
This essentially means that you can no clue about ‘cycles’, present or not, in the record much before the record itself. The phase signal which you require to attach to is lost in the dust I believe.
I don’t see how this question of a trend line involves the Nyquist criterion in any way.
The text books for statistical mathematics, describe the specific algorithm for computing the trend line for ANY finite data set of finite elements. It matters not a jot, whether the members of the data set are related in any way whatsoever, or whether they are related by a very specific closed form equation.
M of B uses such an algorithm to compute the trend line that he uses in his “pause” analysis. It’s one of those algorithms that I describe as “numerical origami”.
You follow the formula (the folding sequence) and what results is by definition the trend line for that data set.
Now in the case of climatic data, such as Temperature anomaly data records, there is some expectation that the numbers in the data set are in fact related. They are related in the sense that are observational result of some particular physical system; the earth’s climate or Temperature anomaly if you wish.
Now those experimental recorded numbers are likely to be contaminated by noise, but it is also likely that they are a record, all be it with some uncertainties, of what that system really is doing.
The trend line calculated by that algorithm, however has NO error whatsoever. it IS the trend line for that written set of exactly known numbers. Whether those exactly known numbers are the exact measure of the system is an entirely different question. We KNOW the numbers; they are a published record. So the trend line has no error (if the practitioner is capable of doing essentially 4-H club arithmetic without error.)
However, that accurate trend line has no real meaning whatsoever, other than what the origamist chooses to assert that it means.
If (s)he says it is a jumping frog, or a crane, or a swan, that is his(er) prerogative. But whatever the creator says it is, the algorithm (folding sequence) if followed without error, does produce the required end result.
So a plot of Temperature anomaly data over say 60 years or so, may look anything but a straight line approximation, and in my view it is just plain dumb to assert that the trend line is a valid approximation to what the actual data says.
But there is no way that we are looking at samples of a continuous data function, and asserting that the trend line in some fashion is a corruption due to a failure of any Nyquist sampling strategy.
Nyquist has nothing to do with trend lines. If we were trying to reconstruct some band limited continuous function that the recorded data set is supposed to be samples of, that would be a different question. And we don’t need to actually try to reconstruct that function, to incur a Nyquist penalty. if we have under-sampled the continuous function, there will be aliasing noise in the reconstructed function, and if we under-sample by two or more compared to the Band limited function requirement (of Nyquist), then the aliasing noise spectrum has folded back all the way to zero frequency, which is the AVERAGE of that continuous function over the recorded interval, so the average will be corrupted.
But all of that is unrelated to the trend line algorithm. It may be a totally dumb thing to calculate (I think it is), but the result of performing that prestidigitation IS the trend line for that data set, no matter what the numbers in the set actually represent (if anything).
So don’t invoke Nyquist for an issue that has nothing to do with sampled data theory.
g
Let me put it this way. You have no idea how the straight line you draw is made up. It is the result of a combination of a set of low frequency waves which you do not have the power to resolve because the time window is too short. You do not know how many, how big, what phase they are in. I or 1000 combined together. A straight line is a propaganda exercise (or fool yourself anyway).
By definition on a time series graph you need an infinite bandwidth to draw a straight line. A straight line is defined that way.
“But there is no way that we are looking at samples of a continuous data function, and asserting that the trend line in some fashion is a corruption due to a failure of any Nyquist sampling strategy.”
Then tell me what taking a temperature reading of a thermometer is. A discrete sampling of a continuous function. Every reading you take is a digitisation.
I suppose that a valid treatment if you want straight ‘trend’ lines, is to increase the width of the line in some way to try and compensate. The fact the the ‘line’ may then become taller than the data it is covering may then prove awkward.
The climate alarmist will say, “but, but, but UAH is DENIER temperature data…listen to NOAA instead…”.
Why listen to NOAA? They are constantly ‘adjusting’ the past temperature record:

NASA does the same thing:
They might be credible if the adjustments were split between both warmer and cooler temperatures. But they always make the temperature charts look hotter/scarier.
That cannot be a coincidence.
But it could be right.
If you look at this presentation of the UAH data (same data as above) then it would appear that the land was cooler than the ocean until the ‘big event’. Since then it has been warmer on average. Why?
https://www.dropbox.com/s/gixvd270vdrl4z4/rlh-full-uah-triad%20plots.r
They look like the same data as Steven Goddard Tony Heller
Interesting also to compare the run I did last year with this one.
RichardLH,
The land/ocean breakdown could explain why recent GISS data are warmer than UAH, but doesn’t explain why the earlier GISS published data that dbstealey shows was lowered from the raw data.
Too bad we don’t have satellite data prior to 1979. The 1998 big event could be just a coincidence occurring at the inflection point of a cycle where the land temps exceed the ocean temps on either side of the middle. The whole series from 1979 could be just noise superimposed on a longer term cycle.
What do you make of the discrepancies between your two graphs from 2001 to 2005?
For that I will have to defer to UAH. It obviously shows two things. One, that some of the changes reflect the move to v6.
Others reflect that as the series extends, the lower frequencies come more and more into their correct phase and magnitude alignment. As to which is which, ask UAH I’m afraid.
RichardLH said:
But it could be right.
=================
I could also win the state lottery 5 times in a row. The problem is that every adjustment increases the average rate of warming. This suggests confirmation bias in selecting the adjustment methodology.
Adjustments should be conducted on a double blind basis. As soon as the person making the adjustments is allowed to see the results, the temptation is to tweak the adjustments to get an answer closer to what the person making the adjustments expects to be the correct answer.
This is how bad science is created. As soon as you allow the results of an experiment to feed back into the methods, your experiment is no longer searching for the truth. It is searching to satisfy the expectations of those people conducting the experiment.
The simplest example is proof-reading your own writing. If you expect a word to be there, your brain will fill in the word while you are proof reading. It is only much later, when you have forgotten what you meant to say, that you are able to see the missing word.
Our brains fool us all the time. They fill in missing information with made up information, to allow us to operate with imperfect sense and limited information. We are very good at finding the answer to the problem, even if the problem is poorly understood and the answer is ultimately wrong, as most answers are. Our brains will convince us we are right, track history to the contrary.
RichardLH,
Temperature anomalies don’t tell whether one place is warmer or cooler than another, they only tell us the change relative to some baseline period. Because the baseline period for UAH v6 is 1981-2010, we’d expect all three time series to intersect somewhere around 1995 — which they do.
“Temperature anomalies don’t tell whether one place is warmer or cooler than another, they only tell us the change relative to some baseline period.”
Indeed they do. I cannot conceive how if you continue to add data to the right of the series, you will ever get the two traces to swap sides of the total to the left. I rather suspect that they will stay the side they are on. Some bouncing up and down as I said as phase and magnitude actually are displayed properly as longer and loner periods come into view.
YMMV.
“I could also win the state lottery 5 times in a row. The problem is that every adjustment increases the average rate of warming. This suggests confirmation bias in selecting the adjustment methodology.”
No it suggests that they have seen the same warming as observed by satellite and used that information in a way that makes sense of what they see and what they believe is there. The difference between land and ocean in UAH will show up badly if you are JUST looking hard at the ground data and using the rest for support.
RichardLH,
That doesn’t explain why the ‘adjustments’ done by NOAA, NASA, etc. always show increased warming, but never more cooling. What would explain it is ‘tweaking the data’ to get the results they want the public to see.
Ferd Berple is being polite when he gives NOAA an excuse like confirmation bias — which is a very real effect. I would go a step farther though, and point out that the heads of these government agencies are appointed at-will by the President, who doesn’t even have to threaten their employment. They’re smart guys. They know the score.
When they see the President constantly expounding on “climate change” being the most dangerous problem we’re facing, they naturally get on board with that narrative, and help it along by providing what they amusingly refer to as ‘data’ that fraudulently shows more and more global warming, when real satellite and radiosonde data shows nothing of the sort.
It doesn’t require someone to be much of a student of human nature to see what’s happening here. Those folks know they can be replaced for any reason — or for no reason at all. They serve at the pleasure of the President, and rationalize what they’re doing as ‘being prudent’.
But can we really blame them? Like most of us, they have families to take care of, and bills to pay, etc. No, the buck stops at the President’s level. In the past Administrations, Presidents always left NASA alone to do honest science. Now we see how very easily science can be corrupted into Muslim Outreach-style politics.
“confirmation bias”
That’s exactly what I think is happening. Tunnel vision.
RichardLH,
Indeed temperature anomalies do not. I’ll show you:
http://vortex.nsstc.uah.edu/data/msu/v6.0beta/tlt/uahncdc_lt_6.0beta4.txt
Surely the absolute temperature of the North Pole was not warmer on average than the tropics AND the entire globe in October 2015.
Change the reference period to 1979, and all three series will converge to zero on that year and diverge from there. Conversely, set the reference period to 2015, and that year’s anomalies will be at or near zero whilst all prior years will be trend to negative values in prior years.
“The simplest example is proof-reading your own writing. If you expect a word to be there, your brain will fill in the word while you are proof reading. It is only much later, when you have forgotten what you meant to say, that you are able to see the missing word.”
Yes. When you read something you have just written you are actually not ‘reading’ it but merely using the words to prompt your brain into remembering what it was you thought you wrote. But I have tip for those who do not have time to wait before going to press. Select the text in question and change it all to a wildly different font style. This tricks the brain into having to actually read the work and you will notice errors. Edit, and then change the font back.
Brandon, DB, Ferd, and Richard:
I think there is some conflating going on here. Richard’s data seems to be anamolies from the same baseline. Notice that the green is the weighted average of the ocean and land points. The confluence on all three curves happens whenever the land and ocean anamolies reverse their respective magnitudes. This means that prior to 1998, land temperatures usually averaged lower than ocean temperatures, while the reverse applies after 1998. This is likely a true phenomenon if satellite data are to be trusted. DBStealey’s NOAA data doesn’t show satellite data and his NASA data doesn’t show temperatures prior to 2000. So from what is shown, we can’t tell whether the “flip” at 1998 occurs because of data tampering or whatever.
If we looked at untampered NOAA/NASA data covering the same time period as the satellite data, it might be possible to better speculate on Richard’s “it might be right [that NOAA/NASA data is methodically biased].
Why bother to control the CO2 knob when it’s infinitely easier to just fudge the numbers?
RichardLH,
“
Indeed they do.
Indeed temperature anomalies do not. I’ll show you
What those graphs show is that there is a difference between two sets of anomaly figures (when plotted on the same graph).
A comparison, anomaly to anomaly. Absolute is not in this battle.
“If we looked at untampered NOAA/NASA data covering the same time period as the satellite data, it might be possible to better speculate on Richard’s “it might be right [that NOAA/NASA data is methodically biased].”
I don’t think that ‘tampering’ are quite the words to use. ‘Tunnel vision’ might be closer.
Wrong sub-thread before (MODS: could you delete it from where I put it wrongly in the first place?)
Chic Bowdrie,
As I explained upthread, the convergence of temperatures near 1995 is mainly an artifact of the 1981-2010 baseline … 1995 is the midpoint. Change the baseline period, and the point of convergence will change. It tells us nothing about anything.
We already know that NOAA apply bias adjustments to raw temperature data because they tell us they do. And how they do it: ftp://ftp.ncdc.noaa.gov/pub/data/ushcn/papers/
“As I explained upthread, the convergence of temperatures near 1995 is mainly an artifact of the 1981-2010 baseline … 1995 is the midpoint. Change the baseline period, and the point of convergence will change. It tells us nothing about anything.”
Actually all that does is bounce the lines up and down a bit (in concert). The base line period is merely a ‘DC’ reference.
RichardLH,
Let’s review what you wrote upthread:
http://wattsupwiththat.com/2015/12/19/uah-un-climate-change-goal-new-trend-analysis-shows-were-there-now/comment-page-1/#comment-2102177
If you look at this presentation of the UAH data (same data as above) then it would appear that the land was cooler than the ocean until the ‘big event’. Since then it has been warmer on average.
“Cooler than” and “warmer than” read to me as expressions of absolute temperature, as in: a cup of ice water is cooler than a pot of freshly brewed coffee, or temperatures in summer are ususally warmer than temperatures in winter.
In that case my words have failed to convey my meaning.
The relative warmth and cold. i.e. a comparison between anomalies.
RichardLH,
Yes, and it ALSO affects the point of convergence in this case:
http://3.bp.blogspot.com/-53w3KgQ8p-U/VncYHIQWshI/AAAAAAAAAgk/Rim0VMZuS1A/s1600/UAH%2BTLT%2Bglobal%2Bland%2Bocean%2Bmultiple%2Bbaselines%2B01.png
I think what you’re trying to get at is the relative rates of change. The regression lines in the above plot may or may not help with that for your purposes.
All that appears to be doing is to change the amount of warmth and when it was moved. Same observation with different parameters.
RichardLH,
That’s just it … surely you and I agree that the “amount of warmth” is the same regardless of how it’s plotted. If it appears to you that the amount of warmth is different in those three plots, then I suggest there’s either a problem in how you interpret the meaning of a temperature anomaly or that again I don’t understand your meaning from how you written it.
This is all actually beside the point. My main thing is that I don’t consider it possible to tell whether NOAA/NASA are inappropriately adjusting temperatures by comparing GISSTemp to UAH. The way to attempt to do that is to go read NOAA’s papers and download their data.
No. See below which I accidentally detached from this portion of the thread.
Anyway, the centre of the plot is data capture length divide 2. It not up for grabs.
And the centre of the reference period is defined. They are not the same.
I’ve updated the plot in light of your comments. I’ll have to add it to the R.
There’s no reason to believe that 37-year trend which happens to begin at the end of a cooling period will continue, but it’s significant that even within the Alarmist ideology, the reason for alarm when examined, goes poof.
correct. sampling theory would suggest that the most we can talk about is an 18.5 year trend. perhaps this is where the talk (Santer?) about the models being inconsistent with a Pause of more than 18 years came from.
“The fastest warming place on Earth over the past 37 years has been in the Arctic Ocean north of the Svalbard archipelago”.
I did often wonder why the BBC seemed so interested in producing reports about “global” warming, in Svalbard.
Obviously this is not cherry-picking on their behalf.
However, the BBC is also oddly silent on the topic of Antarctica. And they completely forgot to report the latest NASA study from Zwally.
Which seems to be oddly negligent.
I expect that they blind-folded David Shukman and had him stick a pin in a map of the globe.
“Well, it looks like you happened to pick Svalbard, David. Off you go, to provide a totally non-representative impression of the dramatic changes afflicting the planet”.
http://www.bbc.co.uk/news/world-europe-19508906
Look at Wikipedia to find out Shukman’s, the BBC’s Science Editor, and that fellow alarmist Harrabin’s, the BBC’s Environmental Analyst, academic qualifications and scientific and technological qualifications and work experience. The former has a degree in geography followed only by journalism, and the latter a degree in English and similar journalism. Yet they parade in front of us in the UK on TV regularly, full of their self-importance and talking down as if they were Newton’s prodigies! They talk arrant nonsence and are totally incapable of really understanding even the very basic science and technology involved. They effectively also control all the BBC’s output on this subject.
It’s laughable if it wasn’t so serious a matter.
As an example of Harrabin’s misinformation and false assessment on this subject, they flew him to the northern coast of Australia earlier this year to report on warming ocean’s and increasing CO2 concentrations in the sea. He showed us film of depleted fish stocks and destroyed corals, standing up to his waist in clear sea. There were massive amounts of bubbles pouring out of the sandy sea bed and spiralling up in columns to the surface. The direct implication was, and he confirmed this, was that CO2 was being released and causing this devastation. In fact what was being shown was a typical gas release from subsea volcanic areas: H2S, CO, NOX, and many other extremely poisonous gases. No wonder the coral and fishes were dying. Shukman’s inputs are no more honest or accurate
Yet again, however, the BBC never allowed and statements or available evidence that Harrabin was blatantly misinforming us.
Look up Christopher Booker’s evidence and his ongoing saga, attempting to get the BBC not to back “denialists theories” but simply to provide the balanced reporting on the subject that is enshrined within the BBC’s public broadcasting Charter! Needless to say they won’t debate this, let alone agree to it!
Errant nonsense.
“The former has a degree in geography followed only by journalism, and the latter a degree in English and similar journalism. ”
Yes indeed Cassandra! It seems that in order to board the Climate Gravy Train, a journalist must take a three day Science course in genuflection at the Altar of Catastrophic Climate Change in the Temple of Doom.
Only WUWT would keep 2013 post about the under sea volcanoes near Svalbard. Hot Stuff!
Thanks Anthony.
http://wattsupwiththat.com/2013/08/02/hot-times-near-svalbard-volcanic-range-discovered/
The BBC might not be so keen on Svalbard as its “canary in the mine” if its researchers actually did a bit of research. It seems Svalbarders were on the beach in their swimwear in the 1100s [perhaps a bit of hyperbole but hey..]
See for instance …ftp://ftp.gfz-potsdam.de/home/cegit/egu/pdf/EGU2010-2624-1.pdf
Add to all this the fact that the effect of increased CO2 is logarithmic and you get less of a temperature rise in the coming decades
Atmospheric O2 has been increasing about 5% per decade for the last twenty years. If it continues as an exponential increase at this rate, the temperature response will be linear in time ( log exp –> linear).
“If it continues as an exponential increase at this rate, the temperature response will be linear in time ( log exp –> linear).”
Or the temp response will be nothing, as it has been for nearly twenty years.
“Atmospheric O2 has been increasing about 5% per decade for the last twenty years. If it continues as an exponential increase at this rate…”
I assume you’re talking about CO2. If I look at the Mauna Loa graph it doesn’t look particularly exponential to me.
One more thing: I’ve never heard anybody explain how (what looks to be about) a 5ppm summer/winter variation in CO2 is completely overwhelmed by a 4ppm human contribution? Especially since that 5ppm seasonal drop must be solely due to the summer/winter difference in the northern hemisphere forests which occupy such a small percentage of the overall globe. Also, especially since the majority of the atmospheric O2 doesn’t derive from those same forests but, instead, from photosynthesis in the ocean.
Interesting but the alarmists will throw a stream of yabuts at it.
Yabut, the oceans will be acidic if we don’t reduce emissions by 50%.
Oh well, they still have “extreme weather”, “melting icecaps” “acidic oceans”, “island-swallowing oceans”, “species extinctions”, “carbon pollution”, etc. etc.
Here is a basic question that has not been touched on (to my knowledge). Can temperatures be averaged? Or is it necessary to use enthalpies, to take into account the water content of the mass of air being measured (and the vastly greater heat capacity of water compared with air) ?
Ian M
It’s been touched on, Ian, but pretty much completely ignored. Temperature is an intensive property. Which means averaging temperatures from two distinct places doesn’t give you anything physically meaningful. All of these exercises in global anything related to temperature are moot.
Agree that temperatures from different sites can not be averaged meaningfully. It is meaningful to compare the derivative of temperatures (eg. the slopes of change) to assess patterns over geographical area of interest.
https://rclutz.wordpress.com/2015/04/26/temperature-data-review-project-my-submission/
A single point location, Ron, yes. But even regional averaging is meaningless. I’ve seen a 27f difference between two places 13 miles apart within 20 minutes of each other. Averaging that region would be physically meaningless.
Thus, when NOAA says “hottest year/month ever”, it’s utterly meaningless.
Ian, you are confounding temperature with heat content (thermal mass) at that temperature. That is how miniscule ARGO temperature differences get translated into zettajoules of ocean heat content. Temperatures can be averaged. Whether the resulting average is climate meaningful is a different discussion.
Rud, I’ve been wondering about the meaningfulness of the “global temperature average”. One problem is that the process of averaging throws away a lot of useful information, e.g. whether increase in the average temperature is due to increases in daily maximum temperature o daily minimum temperature. The cynical side of me thinks that “global average temperature” is bandied about because it doesn’t require much thought whereas describing what’s actually going on requires a good understanding of atmospheric physics as well as biology and geology. It would also force people to differentiate the warming caused by GHG’s as opposed to warming caused by land use changes or natural phenomena.
There is also the question of which temperatures are you going to average and how much “weight” to put on them. Ideally, each station would integrate the temperature over a 24 hour period to get the average temperature. Is that how it’s done or is it the high and low or other paradigm?
As far as global temperatures, how close can the average of the station temperatures be to the theoretical average of every point on the globe at 5 feet above ground?
2/3 of the globe is covered in water which has two very energy intensive phase changes from ice to liquid and liquid to vapour. The extreme non-linear ratio between energy and temperature during these phase changes mean temperatures cannot be averaged. Check out Arctic air temperatures when the temperature is near freezing (http://ocean.dmi.dk/arctic/meant80n.uk.php), the temperature volatility drops very low as the ice can absorb or release large amounts of energy with insignificant temperature changes. When temperatures are below freezing, then temperature swings become much more volatile as temperature and energy become linearly proportional.
John Christy,
Your article in the lead post is a benchmark example of clear communication of climate focused science by a scientist. That kind of clarity in expression of science by a scientist is wonderful. Feynman had it and so do you.
John
I believe an earlier version (Beta2 or Beta3) agreed closely with RSS, but Beta4 disagrees particularly in the last few years. Does anybody know why?
Are you sure the differences are significant? The reason I am asking is that when 6.0 first came out, the pause on UAH was one month less than RSS; 18 years and 4 months versus 18 years and 5 months. Now, the difference is only 3 months: 18 years and 9 months for RSS and 18 years and 6 months for UAH.
Since there’s no global temperature, and therefore no global trend, where specifically is UN goal to be effective?
Jeff Alberts December 19, 2015 at 8:39 am
The UN is expecting their goal to be most effective in the Cayman Islands, Switzerland, the Bahamas, and a few other countries noted for “don’t ask, don’t tell” banking policies. I’m pretty sure the rest of the world is on their own.
What is the standard deviation of this 0.12 trend? Does the post’s title/conclusion mean anything? Assuming an average el nino, if there is such a thing, temps could be back at the post 1998 and 2010 level again. So what is all the fuss about? No one knows where temperatures will be in 10 years or anytime in the future.
According to:
http://moyhu.blogspot.com.au/p/temperature-trend-viewer.html
At the 95% level:
Temperature Anomaly trend
Jan 1979 to Nov 2015
Rate: 1.416°C/Century;
CI from 1.008 to 1.824;
(I do not know why the 0.14 is different from 0.12. Perhaps Nick can weigh in.)
Werner,
Yes, it’s an error – sorry about that. I’ve been tinkering to try to add UAH V5.6 to the set of data that can be graphed, and it seems I have mistakenly pointed that diagram to the V5.6 data. Will fix – I think the error arose in only the last few days.
Werner,
It’s fixed now, thanks. Shows 1.13°C, as is correct for V6.0.
I find the graphic extremely illuminating. This should be the standard for tracking temperature changes from here on out IMO. So much better than a single line on a graph that is supposed to encompass all of these measurements.
The reality check above is simply awesome. So now we have balloon, satellite, and land based measurements that agree.
Given the warmist hype, if find it very surprising to see all that white, even if it is over the oceans, nevermind the cooling of the antarctic.
Put another way, The energy retained by the earth’s during the recent period has been 0.04% per decade if you ignore the AMO. Yes, I am assuming a constant specific heat for the whole shebang for simplicity. Obviously that is a very crude assumption about a very complex heat transport problem. Somehow, somehow, I would rather think that a small increase in cloud cover that would reflect the incoming insolation back in a return to sender would more than counteract that. Further, we can see the 20th century as a large Forbush event on average given the increase in the solar magnetic fields during that period. My prediction is colder by 2020 and downright chilly by 2030, if only due to the AMO. Add a bit of inverse Forbush and the wind turbines may have a large ice problem in the not so far future.
Assuming constant specific heat sounds reasonable. While it ignores that rapid change in enthalpy of humid air with temperature, the heat content of the of the atmosphere is small compared to that of the oceans.
Yes, I ignore that entirely for simplicity. If I was designing a heat engine of some sort, it would have to be there.
You might assume a constant specific heat, but to convert temperature to energy requires a mass estimate too. How deep into the ocean did you go and how do you know the temperature gradient has been constant all these years? Is it possible that the deep ocean has cooled while the surface has warmed?
So we will get the thermal inertia from the current El Niño to add to the overall temps the next 24 months or so. Then we will probably move to a pretty substantial La Niña by the end of 2016 if history plays out. If this happens, along with other cycles coming into play, the decade starting 2020 will be pretty interesting.
If it turns cold to much colder by then, global demographics says we will be fighting wars over food and shelter, not worrying about crocodiles and polar bears. If we think we have immigration issues now, it will only get worse.
Most of our food is grown influenced by continental air masses, and if the cold grows over the Arctic during the growing months, early frosts on soybeans, corn and other food crops will severely limit production.
Unfortunately as long as the general population is warm and well fed, the will put up with a lot of nonsense. But a hungry and miserable population just might bring back the guillotines.
Can someone please help an interested non-scientist? The SOI is back into positive figures. What does this mean considering everyone seems to still be expecting a “Godzilla” El Nino?
Hey, how come the IPCC’s map of the world shows everything in various shades of RED , in other words, from hot to extremely hot, except the temps are actually the same as this map !! Wonder why ?? LOL
Need you ask?
No, not really !!
Thanks, Anthony, UAH.
“Global Composite: +0.41 C (about 0.73 degrees Fahrenheit) composite change since December 1978.” This tells the story of the global warming alarm; nothing much to it.
The interesting thing about the last several years being the warmest ever, is that I can recall a substantial amount of news stories of exceptional cold in north and south america, europe, and even unusual snow storms in the middle east and north africa. What I can’t recall are any large quantities of widespread heat waves
Dr Christy doesn’t mention what the error margins are in the UAH v 6.0 (beta) trend and whether these overlap with the ‘best estimate’ trends shown in the surface data. In RSS the trend is 0.122 ±0.063 °C/decade (2σ): http://www.ysbl.york.ac.uk/~cowtan/applets/trend/trend.html
This overlaps with all the ‘best estimate’ trends of the main surface data sets from 1979. Seems likely UAH v6.0 will have similar very wide error margins.
This is why there was no statistically significant warming in the first half of the data set between launch in 1979 and the run up to the Super El Nino of 1997/98. A slight positive trend during this period, but not statistically meaningful.
Ditto, post the Super El Nino of 1997/98. Since then there has been a slight cooling, but not statistically significant.
we are left with essentially two flat trends. Temperatures trending flat between 1979 and the Super El Nino of 1997/98, and then a step change in temperature of about 0.27degC coincident with that event, and then temperatures once again trending essentially flat.
Zero correlation between CO2 and temperature in this data set. Only a one off isolated step change coincident with what appears to be an entirely natural event, ie., the Super El Nino of 1997/98. .
“we are left with essentially two flat trends.”
_______________
Only if we divide the data set into two parts (for what purpose?).
Left alone as a single series, then both RSS and (probably) UAH both show statistically significant warming since 1979.
DWR54
Sure they do, but not because there is a straight line linear trend in and throughout the time series.
There is a step change of about 0.27degC half way through the series; this is where the significant warming occurred. But for that one off and isolated event (coincident with the Super El Nino of 1997/98) there would be no statistically significant trend in the series at all.
Of course, one has to consider carefully how the data series should be analysed, but that said, it is clear that there is no steady straight line linear trend in the data series.
It will be interesting to see whether there is another long lasting step change coincident with the current 2015/16 strong El Nino (similar to that seen with the Super El Nino of 1997/98), or whether the current El Nino simply results in a short term spike, say similar to 2010, and following the La Nina that is likely to take place in 2017, whether the temperature anomaly into 2018 to 2020, stabilise again at around the 2001 to 2003 anomaly level.
I consider that the next 5 years is likely to tell us a lot more about what is going on.l
From:
http://moyhu.blogspot.com.au/p/temperature-trend-viewer.html
Temperature Anomaly trend
Jan 1979 to Nov 2015
Rate: 1.130°C/Century;
CI from 0.724 to 1.536;
t-statistic 5.454;
Temp range -0.197°C to 0.219°C
So in other words, 0.113 +/- 0.0406
Thank you Nick!
Just to be sure we are comparing apples with apples, here are Nick’s number for RSS:
Temperature Anomaly trend
Jan 1979 to Nov 2015
Rate: 1.221°C/Century;
CI from 0.828 to 1.614;
t-statistic 6.087;
Temp range -0.118°C to 0.331°C
So in other words: 0.1221 +/- 0.0393.
Not sure how to read this Werner, as I’m not familiar with Nick’s calculator or how it works.
From what I can make of the above, the trend in UAH v6.0 (beta) since 1979 is 0.11 C/dec with an error margin of 0.04C. If so, this means that UAH v6 shows statistically significant warming since 1979 and an upper error band of 0.15C.
This compares to the surface average of ~0.16C over the same period (NOAA is exactly 0.15C).
All the surface and satellite data sets agree that global warming since 1979 is statistically significant. There are disagreements as to extent, but the error margins in each set are very close to one another.
This is statistical gibberish which bears no relation to measurement error or even the variability of the rate of change. It is a dimensionally inconsistent numerological artefact similar to the number of angels on a pin.
That is correct.
Here is part of my next report that will come after Hadcrut4 comes. As for the other questions, perhaps Nick will weigh in again.
On several different data sets, there has been no statistically significant warming for between 10 and 22 years according to Nick’s criteria. Cl stands for the confidence limits at the 95% level.
The details for several sets are below.
For UAH6.0: Since January 1993: Cl from -0.000 to 1.668
This is 22 years and 11 months.
For RSS: Since April 1993: Cl from -0.016 to 1.575
This is 22 years and 8 months.
For Hadcrut4.4: Since January 2001: Cl from -0.048 to 1.334
This is 14 years and 9 months.
For Hadsst3: Since December 1995: Cl from -0.002 to 2.035
This is an even 20 years.
For GISS: Since January 2005: Cl from -0.029 to 2.505
This is 10 years and 11 months.
Overall, however, the brightness temperatures of a channel will be a function of the temperature of the atmosphere multiplied by the weighting function of the channel and the temperature of the surface multiplied by its emissivity. The trend of the various channel brightness temperatures will correspond to the energy temperature of the layer the channel is tuned for plus a tad from other levels. Windows channels can estimate the surface emissivity/temperature fairly well. A lot of the globe is covered by a saline solution whose emissivity is pretty well known in the absence of wind driven foam.
A trend in the tropo channel for instance would indicate a trend in temperature over a layer subject to an error band of the surface emissivity/temperature assumptions. I worked on those things in the 1970s. I trust them a heck of a lot more than I trust the crew “adjusting” the surface data. Radiosonde data should have uncorrelated errors over time. There is not a lot of it, but what ever trend it shows is probably real.
And now for a little light humor……..
MSNBC is the darling of the liberal left, and just about as intelligent !!
Notice anything wrong in the graph below ??
http://americanlibertypac.com/wp-content/uploads/2015/11/vlcsnap-2015-11-05-08h24m13s010-650×366.png
I didn’t realize Trump had such a dark tan !!!
and Rubio and Cruz were separated at birth…
The only one they recognized was Bush
Everyone with a Hispanic name (Rubio, Cruz) look alike, doncha know.
Perhaps a shade of wishful thinking.
Numbers only add up to 78%?? Oh, as pointed out, the pictures. Guess I am as blind as the guy who put it together.
Eugene WR Gallun
When making the target 1.5 degrees instead of 2 my immediate reaction was this would be the warmists way of saying how effective the measures they are putting in place are. In fact they will probably argue that if even more money is spent then they could get the trend lower. The reality being all along that they can’t affect the temperature and it was never going to reach 1.55 anyway. Without really knowing the about the hole in the ozone layer I suspect that whether they banned CFCs or not the hole in the ozone layer would have been exactly as it is now . By having successfully convinced the world of the evil of CFCs they also can claim success as we don’t really know if the hole really existed in the first place . The best way to solve a problem is to create the illusion of a non existent one then pretend that your non existent solution has solved it. Who cares how much the cost we have saved the world.
Don’t forget that the 1.5 degC figure is 1.5degC above pre industrial times, not 1.5degC per century nor 1.5 degC warming by 2100.
According to the warmists, it is already about 1degC above pre industrial times. that means that the cap they want is just a further 0.5 deg C, of warming and no more. I emphasise that they are seeking to cap future warming as from now at 0.5degC .
So if the warming trend is about 0.12 degC per decade, that will be reached in 4 decades, ie., around 2055.
.
;
Didn’t know they had radiosondes in the pre-industrial times. Ya learn something every day.
I love the smell of science in the morning.
+ 2,000
Could this be why the ‘public servants’ at the Paris COP21 lowered the threshold from 2 degrees to 1.5 degrees? Maybe it’s just me but that looks like a CYA proposal. They know full well what the real record is so they had to both lower the (completely arbitrary) standard to look relevant, and continue to justify their draconian measures (that will not apply to them).
Yes.
The implications of the ‘pause’ is that Climate Sensitivity must be much lower than was originally claimed. It was because of this, that no consensus on Climate Sensitivity could be reached for AR5. All the recent papers in the run up to AR5 were putting Climate Sensitivity no higher than about 1.8 to 2.2. Since AR5, the figure fore Climate Sensitivity has come down.
As the ‘pause’ continues and/or lengthens, Climate Sensitivity (if any at all) must come down.
“The average temperature of Earth’s atmosphere has warmed just over four tenths of a degree”
Has the average temperature warmed? Or has the atmosphere warmed?
Quelle catastrophe! Without a “climate goal”, there will be no need for expensive, feel-good gabfest jamborees in exotic places so they can “fix” it!
Maybe they can invent a new “disaster” they can fixate on and waste $trillions on.
0.4º rise. Hmmm – 37 years ago was 1978. What important thing was going on back then?
Makes you wonder how far the temperature had fallen to create enough panic to spawn such an eerie television presentation. And if 0.4º rise is unexpected given the climate preceding 1978. Great global cooling music in the vid, btw.
It’s not 1.5c since 1978. It’s 1.5c since the beginning of the industrial age. Earth warmed 1c since the 1880s and probably much more than that since the industrial revolution began as that was in the middle of the little ice age. We’ve already reached or passed 1.5c.
I’ve asked this before, but haven’t gotten an answer (and maybe there isn’t one, I don’t know).
Anyway, we have this satellite record spanning 37 years, which has shown a gradual temperature increase, saw the 1998 El Nino/La Nina, and now shows effectively little or no temperature increases. The satellites measure the troposphere, which covers the entire earth, as compared to land or sea based systems which by definition aren’t global. It is arguably the best system for measuring global temperature trends, despite its shortcomings.
My question is, what is the scientific explanation that the warmists use to address the divergence in satellite and radiosonde data as compared to surface temperatures since 1998? I’m not looking for “because it doesn’t agree with them” as an answer. I’d like to know if anyone has actually provided a scientific explanation for the difference, and reason for their ignoring the data. Thanks in advance.
Ignoring the “surface” data tampering issue, they measure different things and shouldn’t be expected to give the same result. I like the explanation Roy Clark gives: http://hidethedecline.eu/media/BLANDET/What%20Surface%20Temperature%20V2_R%20Clark_9%2020%2010.pdf
“The MSAT [meteorological surface temperature] is the temperature of the air in an enclosure at eye level, 1.5 to 2 m above the ground. The minimum MSAT is usually a measure of the bulk air temperature of the local weather system as it passes by the weather station. The maximum MSAT is just a measure of the temperature of the warm air that is circulated by convection from the ground as it is heated by the sun during the day.”
They’ve never provided a scientific explanation for anything before. Why start now?
Greenland melting with a negative trend?
“The fastest cooling spot was over the eastern Antarctic near Dome C …”.
==========================
It’s also interesting that the Antarctic Peninsular, that ‘canary in the coal mine’ area where the ice shelf is going to collapse causing catastrophic coastal flooding, tidal waves, earthquakes, tsunamis, dogs laying down with cats, God knows what all due to human emissions has actually cooled ~ 0.8C in the past 35 years.
negative warming! get your terms right
I think we can all be gracious here – Paris climate agreements worked! Time for the AGW crowd to declare victory and move on. All skeptics can agree. Let’s get to talking about particulates, deforestation, and water pollution.
[Comment deleted. “Jankowski” has been stolen by the identity thief pest. All Jankowski comments saved and deleted from public view. You wasted your time, David. What a sad, pathetic, wasted life. -mod]
Deforestation to plant more sugar cane for ethanol.
[Comment deleted. “Jankowski” has been stolen by the identity thief pest. All Jankowski comments saved and deleted from public view. You wasted your time, David. What a sad, pathetic, wasted life. -mod]
I am in Brisbane and my climate is changing rapidly it’s 5am I had better go and pull some weeds out before it changes a bit more.
“Neither Christy nor Spencer receives any research support or funding from oil, coal or industrial companies or organizations, or from any private or special interest groups”
Which is frankly ridiculous. Every company has the right to promote research in its interest, and they should be lavishly funded in the defense of what is about 10% of the overall economy. But the climate jihadis are so feared by these helpless behemoths that most funding actually goes to their critics. The banalities of the age we live in are sometimes too bizarre to be believed.
I’m a complete layman, but I have a question that has puzzled by law educated mind for some time. This seems like a thread in which it might be appropriate to ask it. The three major non-satellite datasets combine data from land based stations recording temperature c1 metre above ground level with sea surface temperatures. The latter may actually be from surface water or a few metres down,
Why do these datasets not use the temperature c1 metre above the sea surface? Are they actually combining apples with oranges? I would welcome some enlightenment.
“Why do these datasets not use the temperature c1 metre above the sea surface?”
Because we don’t have the measurements. There is a long history of SST measurements. But air temp is much more problematic. People do measure air temp on ships, but these are very affected by the environment where measured. So it is generally reckoned that only night measures are usable (NMAT). But one problem, that is night only. Not apples. And another, it is still sparse, compared with SST.
Also with SST there is now corroborating evidence from satellite AVHRR etc.
Nick Stokes says:
Because we don’t have the measurements.
Nick, you must know that we do have those measurements. One metre above the ocean is in the lower troposphere, which satellites measure. Air temperatures are primarily the result of warming or cooling by the land or oceans. And satellite measurements are corroborated by many thousands of radiosonde balloon measurments; the satellite and balloon data is reinforced, each by the other.
But NOAA, NASA/GISS, and others are in disagreement with that data. In Rational World, the outliers are normally thrown out. But ‘climate science’ is not part of the rational world; it exists in its own bubble, kept afloat by mountains of government money, and a government/media complex that reinforces pseudo-science at the expense of honest, skeptical science. Skeptics are the only honest kind of scientists, no? Yes, Nick, that’s true.
So I would like to ask you the same question I regularly ask others on your side of the fence: what would it take to convince you that your original premise is wrong: that human CO2 emissions will cause rapid global warming and climate catastrophe? (Please don’t try to say that isn’t the alarmist meme, because without the ‘carbon’ scare there would be no good justification for the literally hundreds of billions of dollars being thrown at the ‘problem’.)
Or, could nothing ever convince you that you’re wrong? Not even this:
http://i1.wp.com/www.powerlineblog.com/ed-assets/2015/10/Global-2-copy.jpg
“One metre above the ocean is in the lower troposphere, which satellites measure.”
…
Yes, Mr. Stealey you made a correct statement.
..
Adiabatic temperature changes have nothing to do with the trend, which shows no global warming. The air column has nothing to do with the temperature trend, which shows no global warming. Air temperatures are different at the surface than they are at 4 km, but that also has nothing to do with the temperature trend — which shows no global warming.
But thanx for playing.
But using über-Alarmist Dr. Phil Jones’ own definition of when global warming either stopped, or didn’t stop, we get this.
Global warming has been stopped for many years now. That fact contradicts the alarmist narrative. They were wrong.
So Buster, you are another person who claims a 37 year old man is still growing because you can create a positive trend since his birth. LOL.
BTW Buster, the 1998 El Nino has no affect on the trend as anyone can see who actually looks at the data. It is NOT a cherry pick. In fact, it is almost impossible for skeptics to cherry pick any starting date since the one warm influence (El Nino) is almost always followed immediately by a cool La Nina that balances out the overall impact on the trend. Only alarmists can cherry pick temperature data.
Buster, if data is cyclic in nature then looking at more data is going to mislead you. If you look at the last 6000 years of data we see a cooling trend. That’s one heck of a lot more data than the satellite data. According to you that means we can ignore the warming seen in the full satellite data set. Agreed? You see, that is the problem with just making general statements. They come back to bite you.
What’s important is whether the amount of data has any meaning scientifically. We know from Santer et al 2011 that 17 years is all that is needed to understand “human effects”. If AGW is true then ALL 17 year periods should show those human effects. We now have a greater than 17 year period with no obvious warming. That means human effects are small or non-existent. It also means that using less than the full satellite record is perfectly valid.
Sorry Buster, but we are discussing temperature data. Temperature data can be measured many ways. However, that is not the main point of my response. It was just an aside to show how silly your comment was.
As I clearly stated, what is important is the what the science says about time period. AGW science says 17 years is sufficient. You’re the one that accepts AGW science. You can deny the science all you want but it isn’t going to go away.
No Buster, more data is not necessarily better. If what you said was always true than the 6000 years of data would make your piddly 37 year satellite record moot. You have to look at the data within the requirements of the science. Obviously, you don’t understand much about science. I can see I am wasting my time trying to educate someone who doesn’t want to learn.
Buster, I should have added that this is NOT a “discussion of the measurement of temperature with satelitte AMSU’s.” This is a discussion of whether 18 years and 9 months of satellite data (the pause) is a relevant measurement. Maybe if you properly form the question you will realize how you are going wrong.
“No Buster, more data is not necessarily better”
…
Sorry Buster, but your repeated attempts to ignore the real question is quite illuminating. I already showed you an example where having more data is worse (human growth). So, trying to make a blanket statement that more data is always better has already been proven false. I could produce many more examples. The fact you keep trying to push this falsified claim once again shows your lack of scientific knowledge (or is it just religious denial?).
The only time more data is better is if you KNOW there are no changes in the parameters of the measurement. Do you know that? In this example we know the warming modes of the PDO and AMO occurred in the early part of the data. They change modes towards the end. Hence, we already know for a fact these parameters of the measurement have changed.
Given this, most scientists would try to achieve a balance of say 10 years of warming mode and 10 years of cooling mode. As long as they collect at least enough data to match the 17 year requirement to understand human effects they should be pretty close. The worst result would be to use all the data where you know there is an imbalance. We already know that using 26 years of warming mode data and 10 years cooling mode data should produce overall warming. What would you learn by looking at all the data?
Buster, that is not what anyone is trying to to determine. You keep trying to change the question because you obviously don’t want to know the answer to real question … Is the pause in warming over the past two decades meaningful?
Go back to my previous point. We already KNOW that the full time period should produce some warming just from natural cycles. Hence the fact you can compute warming is meaningless. What we really want to know is whether AGW produces detectable warming in the data.
You do realize you are literally dripping with denial.
dbstealey,
Oh, well in that case …
http://2.bp.blogspot.com/-RqcviJ-LBFo/VTWzaE5AFNI/AAAAAAAAAbk/J2BX64yHG9A/s1600/GISS%2BGlobal%2Bvs%2BCMIP5%2BTemps%2BF.png
… thanks for demonstrating that the models are just about dead-nuts accurate.
… thanks for demonstrating that the models are just about dead-nuts accurate.
I didn’t demonstrate that. If that was true, then there would be no debate about climate models.
Richard M,
Which implies that some cooling can occur from just natural cycles.
Surely you don’t think that looking at the past 18 years of instrumental data when over 150 years are available is the best way to do that?
The denial from Buster continues unabated.
1) Human growth is not “data”
This is so silly I really don’t know how to respond. I guess you’re admitting you don’t even understand what data is.
2) More data is always desired in any scientific experiment
Only if relevant to the question being asked of the data. You’ve claimed the 6000 years of data is not relevant which goes against what you just stated. It’s all temperature data.
3) Guess what…..”N” is the number of observations…..look at what happens with standard error when N increases…
Not relevant to the question being asked of the data.
4) the 37 year satellite datasets (both RSS and UAH) shows warming. Do you disagree?
Never been any disagreement. Just like 6000 years of data shows cooling. However, both are meaningless when trying to determine if a two decade pause in the warming is relevant to AGW.
..
5) There is no “17 year requirment”…….one man’s opinion is not gospel truth in science
So, you are denying peer reviewed research (Santer et al 2011) which agrees in principle with Fyfe 2012.
6) Why don’t you tell me what you learn when you look at ALL the satellite data (all 37 years of it)
Simple. We only know it warmed, we learn nothing about the cause of the warming. And, more importantly, it tells us nothing about whether the two decade pause is relevant. Tell us what meaning that has when we know we’ve been cooling for 6000 years.
Richard M,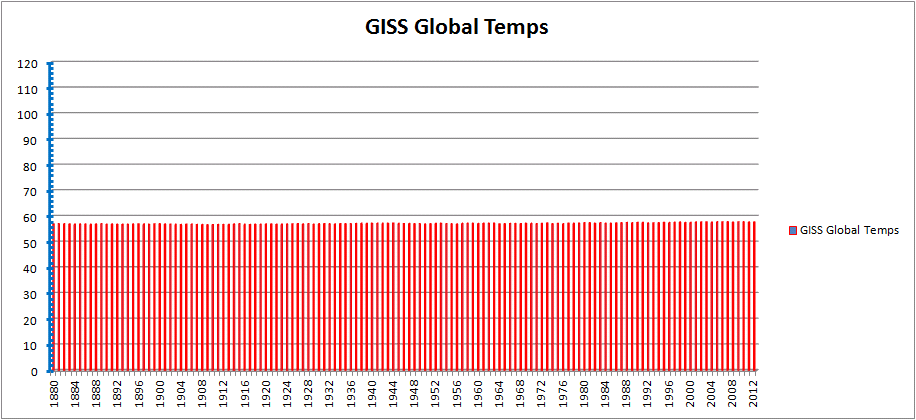
You’re singlehandedly thrashing those two climate alarmists like rented mules, and the reason is clear: they keep deflecting to anything except answering your questions (like deflecting into arguments about “adiabatic temperature changes”, and similar non-answers).
Busted Bluster says:
Everyone knows that starting your plot from the 1997/8 El Nino is a cherry pick.
What Bluster doesn’t know would fill an encyclopedia. One of the things he still understand is that the year 1997-98 was picked by Dr. Phil Jones as his starting point to determine if global warming has in fact stopped. Jones said in an interview that we need more time to determine that question statistically.
That was years ago, and global warming is still in stasis. Even the IPCC agrees with the “Pause”. So “everyone knows” really just means that Mr. Bluster didn’t know. And scientific skeptics (the only honest kind of scientists) pretty much all agree that the planet is still warming in fits and starts from the Little Ice Age. There is no argument against natural global warming, so that’s just another red herring deflection.
I agree with arch-Warmist Phil Jones: we know now that global warming stopped around 1997-98, and that it has not resumed (the “Pause”). It hasn’t been heard from since the late 1990’s, except for the fake global warming fabricated by the Muslim Outreach folks in the government. What causes the paroxysms of impotent consternation in the alarmist cult is the fact that Planet Earth is the final arbiter — and she is clearly saying that the alarmist crowd is flat wrong.
That’s not all. The biosphere is going through the most benign century and a half since the industrial age began. All the wild-eyed running around in circles, clucking and wing-flapping by the Chicken Little contingent is over a ridiculously minuscule ≈0.7ºC wiggle in global temperatures! That is such a tiny non-event that we can’t find a comparably flat time frame in the entire geologic temperature record. So the alarmist cult foolishly picked a totally benign global climate that is laughably unthreatening: an almost perfectly flat, unchanging global temperature for the past century and a half:
There is no indication of any unnatural ‘global warming’. There is no climate crisis. There is no climate emergency. There is no measurable ‘man-made climate change’. There is no Arctic ice death spiral. There is no climate catastrophe. There is no polar bear extermination. There is no coastal flooding. There is no accelerating sea level rise. There is no inundation of Tuvalu or Micronesia. There is no dangerous melting of Greenland, or of the Arctic, or the Antarctic. There is no ticking methane time bomb. There is no harm from the rise in CO2. And so on, and on… including every scary alarmist prediction ever made. Their alarming predictions were wrong. All of them. No exceptions.
And some folks still wonder why skeptics of the “dangerous AGW” climate scare laugh at the ridiculous alarmist crowd. Who wouldn’t?
There is no warming in that plot.
Gates spews silly unscientific nonsense:
Actually, it is. We know from real science (you know, the Einstein, Feynman kind) that it only takes one counter example to falsify a theory. This type of experiment has been done over and over again. If just one measurement does not match the predictions of the theory of relativity then we KNOW the theory is wrong. This has been tried many, many times. So far relativity has weathered dozens of experiments. Basic science.
We KNOW from Santer et al (2011) a period 17 years should show warming as predicted by AGW (95% criteria). Therefore, one period without that predicted warming falsifies the theory. Again, basic science.
Of course, by AGW here I am referring to climate models which generally encapsulate a climate sensitivity of around 3 C.
You really should learn a little science, Brandon.
Hi Buster,
Mostly ignoring me and vice-versa, but I just couldn’t lay off responding to that silly game with the y-axis scaling. Other than that, seems same as it ever is around here, eh?
Do I really need to show height measurements in cm for you to understand my analogy? LOL I never could have predicted anyone was that ignorant.
Yes, but the exact question is critical. You continue to ignore it. Could it be you don’t want to know the answer? Or, maybe you do know the answer which would mean you are a troll.
Of course I understand. I have a math degree. The important value was provided by Santer et al 2011. Your value is not relevant to the question being asked. I love how you continue to ignore this point. How many ways to you think you can ignore the important question without making a complete fool of yourself. (Hint: already too late)
So, you are telling us you have no knowledge of multiple proxy sources and you are in denial of the consensus. OK, I’ll pick one. Greenland ice cores. (PS. Even Marcott showed 4000 years of cooling)
Do you understand the concept of 95% confidence? Apparently not. You might as well say you deny the scientific method. What’s even more important is we know the reasons why a trend might go over 17 years and none of those conditions exist.
And, as I made clear, it is completely meaningless. One can only chuckle that you actually think you made a point. All you did is make it even more obvious you know very little about science.
BTW, YOU’VE BEEN PWNED.
Richard M,
Try Popper and Hume on the problem of induction, or Fischer (and Popper) on statistical hypothesis testing. Recall that the null hypothesis here is that humans are NOT influencing long-term temperature trends.
http://onlinelibrary.wiley.com/doi/10.1029/2011JD016263/abstract
Separating signal and noise in atmospheric temperature changes: The importance of timescale
Abstract
[1] We compare global-scale changes in satellite estimates of the temperature of the lower troposphere (TLT) with model simulations of forced and unforced TLT changes. While previous work has focused on a single period of record, we select analysis timescales ranging from 10 to 32 years, and then compare all possible observed TLT trends on each timescale with corresponding multi-model distributions of forced and unforced trends. We use observed estimates of the signal component of TLT changes and model estimates of climate noise to calculate timescale-dependent signal-to-noise ratios (S/N). These ratios are small (less than 1) on the 10-year timescale, increasing to more than 3.9 for 32-year trends. This large change in S/N is primarily due to a decrease in the amplitude of internally generated variability with increasing trend length. Because of the pronounced effect of interannual noise on decadal trends, a multi-model ensemble of anthropogenically-forced simulations displays many 10-year periods with little warming. A single decade of observational TLT data is therefore inadequate for identifying a slowly evolving anthropogenic warming signal. Our results show that temperature records of at least 17 years in length are required for identifying human effects on global-mean tropospheric temperature.
You should learn the difference between “a minimum length of time to detect a slowly evolving signal” and “the maximum amount of time required to falsify a hypothesis” — especially in a complex multivariate physical system such as AN ENTIRE PLANET.
Now I repeat — we’ve got > 150 years of instrumental temperature data to work with, surely with your superior knowledge of science you don’t think ignoring all but the last 18 years of it is the proper way to separate out a gradual, long-term increase from a bunch of noisy short-term variability?
Recall that the null hypothesis here is that humans are NOT influencing long-term temperature trends.
You go right ahead and ‘recall’ an new invented ‘null hypothesis’. Or any other fantasy you want, but as usual you’re trying to trade places with skeptics who have the only real Null Hypothesis. You’ve only got the debunked Alternative Hypothesis.
See, pretending to be a skeptic won’t work. The climate Null Hypothesis has never been falsified, which means you cannot produce any empirical, testable measurements quantifying the ‘dangerous AGW’ narrative that all alarmists desperately cling to in hopes that we don’t see that y’all have got nothin’…
…well, in your case you’ve got something: your new pet chihuahua. Good boy!
See what you get? You folks always like to start it, but Busted Bluster is learning a hard lesson:
Treat me good, I’ll treat you better
Treat me bad, I’ll treat you worse
Basic game theory.
Buster,
This wins the thread: “Of course I understand. I have a math degree.”
Brandon Gates trolls again:
No, that is not the hypothesis being test by Santer et al. His paper tests climate models which are the encapsulation of AGW theory. Face-palm.
Your entire reply is so utterly clueless I can’t even fathom you thought you were doing anything intelligent. Is your job just to try and fool a few true believers that might drop by? Keep them in the fold?
I know the difference. It was very clear in the paper that 17 years was the 95% criteria. Your silly denial shows you are either a illiterate of basic science or intentionally dishonest. I suspect it is the latter.
Richard M,
“We know from real science (you know, the Einstein, Feynman kind) that it only takes one counter example to falsify a theory.”
Indeed.
Really?
[30] On timescales longer than 17 years, the average trends in RSS and UAH near-global TLT data consistently exceed 95% of the unforced trends in the CMIP-3 control runs (Figure 6d), clearly indicating that the observed multi-decadal warming of the lower troposphere is too large to be explained by model estimates of natural internal variability. This conclusion is dependent on the fidelity with which models simulate the amplitude of observed climate noise, particularly on multi-decadal timescales – an issue that we explore later in Section 6.
Jumping down to Section 6 …
[44] These results suggest that model errors in well-observed interannual variability may not provide reliable information on the size and direction of model errors in low-frequency variability. This reflects the fact that different modes of variability have different characteristic timescales. Model performance in simulating ENSO physics, and in capturing the interannual variability induced by ENSO, is not necessarily an accurate predictor of model skill in representing longer-timescale modes of climate variability (like the Pacific Decadal Oscillation and the Atlantic Multidecadal Oscillation).
AMO, AMO … 60ish year periodicity … ah:
http://climexp.knmi.nl/data/iamo_hadsst.png
Are you sure we’re both reading the same paper?
Bluster … there might be just a chance that Richard M is now actually reading these papers instead of just regurgitating the oft-misquoted bits of them.
Richard M,
Speaking of 95% confidence levels and 150 + years of data …
http://3.bp.blogspot.com/-44o767sAtyg/VnYjEZvlczI/AAAAAAAAAgQ/V54mqEugVV0/s640/HADCRUT4%2Bvs%2BCO2%2Bmonthly.png
… right down the middle of the envelope. Note that the regression training period ends in 1987, and recall what was said about signals emerging from noise in front of Congress in 1988.
Kick him when he’s down? Bbbbbutttt ….
… he’s already declared, “V1CT0LLY!!!1111”
dbstealey,
I don’t know what the hubub is all about, Mr. Circularity …
http://2.bp.blogspot.com/-RqcviJ-LBFo/VTWzaE5AFNI/AAAAAAAAAbk/J2BX64yHG9A/s1600/GISS%2BGlobal%2Bvs%2BCMIP5%2BTemps%2BF.png
… I mean, I sure don’t see much of a difference and I’m REALLY squinting at it. Do you?
Chicken Little says:
I mean, I sure don’t see much of a difference and I’m REALLY squinting at it. Do you?
No need to squint, Chicken:
And your bogus chart upthread is debunked by the WoodForTrees database. Your fabricatewd chart pretends to show accelerating global T. Nice try, chump. But the real world disagrees:
http://l.yimg.com/fz/api/res/1.2/u.i.A9hIbX2Ql7L7LC5_jg–/YXBwaWQ9c3JjaGRkO2g9Njk5O3E9OTU7dz0xMDE1/http://notrickszone.com/wp-content/uploads/2013/09/73-climate-models_reality.gif
The problem you climate alarmist cultists have is Planet Earth. She is busy debunking everything you believe in.
http://realclimatescience.com/wp-content/uploads/2015/06/ScreenHunter_9549-Jun.-17-21.12.gif
I see the trolls are back doubling down on their foolishness. I get a good laugh when I see this level of pure ignorance. We all know the purpose of the paper was to refute claims that the pause at that time (10-12 years) was significant. That is what the quotes you mined are referring to. For example:
They are referring to the trends at the time the paper was written. This was 5 years ago. They were right. The 17 year and longer trends DID show warming at that time. But that was then and we have moved 5 years into the future. The statement is no longer true. That is the point. The current data does show periods of over 17 years with no warming.
Maybe this will help, replace “consistently exceed 95%” above with “do not exceed” and add “lack of” after the word decadal.
You need to be smart enough to apply the criteria of the paper to current data. This is obviously beyond the skill set of Brandon and Buster. Or, are they once again trolling?
Do I need to go on or are you guys done proving your incompetence?
After thinking about it for a moment I think Brandon really didn’t understand the paper at all so maybe I should help him out. The paper does two things. First, it examines the current science (climate models) to develop a criteria to test against. The criteria is the potential pause (lack of warming over time) that would extend past 95% of the pauses found in climate model runs. Essentially, this is a period of time when human effects should overpower natural variation.
What they wanted to do was test the current state of the data against this criteria. What Brandon quoted was the results of testing the criteria against the data in 2010.
What I am doing is taking the exact same criteria and testing is against the data we have today. The criteria is the 17 years with no warming. The data could be UAH or RSS or possibly surface data once we get 60% of the excess adjustments removed.
…on timescales longer than 17 years…
BUSTED.
OMG, Buster just doubled down on his ignorance. LOL. Read the paper and this time try to understand it. Even Brandon should be embarrassed by your comment. That sentence was referring to the warming up to 2010. They are not referring to current data. Try to wrap your little mind around my last comment. You are confusing a test (using criteria from the paper) using data ending in 2010 (the paper) with a test (same criteria) using current data (my claims).
Face-palm.
You can do whatever you want … it just makes you look bad. You clearly have no ability to understand this paper which is not at all a difficult one. You have proven you will ignore any factual data presented to you. You are the perfect example of a real D E N I E R.
BusterBrown@hotmail.com
Why do you believe that any “climate” temperature record follows a straight line? (Well, other than that Mann needed to draw a straight line through the Medieval Warming Period and the Little Ice Age and today’s Modern Warming Period so he could continue to collect hundred of thousands of dollars personally, and many millions of dollars professionally for his protectors at Penn State and NASA/GISS/NOAA. )
No, I want to look at ALL periods of 17 years or greater found in the data.
…
No one is ignoring it. Once again this takes a little understanding of the scientific method. If I can find ONE period of 17 years or longer that shows no warming then I have met the criteria established in Santer 2011.
All it take is one. One, just one. Get it? The fact you can find several periods of warming over 17 years is immaterial. It is meaningless to the scientific method. Maybe a simple analogy would help.
Here’s a claim …. All apples are red.
Now, if I show up with one green apple I have proven your hypothesis to be false. It matters not how many red apples you can produce. The hypothesis is false.
This is exactly what Santer et al 2011 criteria (applied to current data) does to the AGW hypothesis. The fact you can find many periods 17 years or longer that show warming is just like the red apples in my analogy. However, the fact I can find ONE period that is over 17 years is just like finding a green apple. It falsifies the hypothesis. In this case the hypothesis is AGW as encapsulated in climate models.
Sorry if you can’t understand simple science.
Nice job of falsifying AGW. Since 20 is greater than 17 you just proved my point with a nice graphic. It is now your job to find a new version of AGW that produces pauses of 18 years or more. You better be careful because there’s a good chance the pause could extend to over 20 years by this time next year.
BTW, you really should be using statistically significant trends.
Richard M,
Read the abstract again, for Pete’s sake:
[1] We compare global-scale changes in satellite estimates of the temperature of the lower troposphere (TLT) with model simulations of forced and unforced TLT changes. While previous work has focused on a single period of record, we select analysis timescales ranging from 10 to 32 years, and then compare all possible observed TLT trends on each timescale with corresponding multi-model distributions of forced and unforced trends. We use observed estimates of the signal component of TLT changes and model estimates of climate noise to calculate timescale-dependent signal-to-noise ratios (S/N). These ratios are small (less than 1) on the 10-year timescale, increasing to more than 3.9 for 32-year trends.
Do you get it yet? The longer the time period (they went to 32 years) the better the signal to noise ratio.
I admit, I feel a little silly explaining something this basic to a math major.
Skipping down a bit: Because of the pronounced effect of interannual noise on decadal trends, a multi-model ensemble of anthropogenically-forced simulations displays many 10-year periods with little warming.
Mhmmm, and real data show 30 + years of heating and cooling despite very little change in CO2 concentration:
http://3.bp.blogspot.com/-44o767sAtyg/VnYjEZvlczI/AAAAAAAAAgQ/V54mqEugVV0/s640/HADCRUT4%2Bvs%2BCO2%2Bmonthly.png
Abstract concludes: Our results show that temperature records of at least 17 years in length are required for identifying human effects on global-mean tropospheric temperature.
Read it again: at least 17 years are required to find an anthropogenic signal in the noise. Very different from 17 years of no warming = AGW falsified.
Look at the plot above. Notice the 1.96-sigma range is +/- 0.33 K indicating quite a bit of interannual and interdecadal variability. Notice that the regression period ended in 1987. Notice that 2015 is smack in the middle of the predicted range since 1988. Notice that the only time the temperature anomalies went outside the 95% range in that 28 year period were El Nino years.
C’mon, Mr. Math Degree, on what planet does a 28-year series of out-of-sample observations which go right up the middle of a 95% confidence interval constitute a BUSTED hypothesis?
Richard writes “BTW, you really should be using statistically significant trends.”
…
dbstealey,
Well sure, if you zoom in on the y-axis it makes trends look BIG and SCARY, Mr. Alarmist. Bock bock. Let’s zoom out again …
… no problem there, right? RIGHT?? That’s what that plot means, innit? Now this one again ….
http://2.bp.blogspot.com/-RqcviJ-LBFo/VTWzaE5AFNI/AAAAAAAAAbk/J2BX64yHG9A/s1600/GISS%2BGlobal%2Bvs%2BCMIP5%2BTemps%2BF.png
… nothing to see here either! I’m sold DB, I much prefer your method … not a THING to worry about, no sir! Just look at the plot — flatter than Kansas!!! Gosh I’m sure glad I bother paying attention to you … I learn so much!
not a THING to worry about, no sir!
So now you’re finally starting to get it. But if we ever do find a real reason to worry, you’re already wringing your hands and sweating enough for everyone.
Me, I laff at the climate craziness. It’s just a mass delusion.
**********
http://l.yimg.com/fz/api/res/1.2/u.i.A9hIbX2Ql7L7LC5_jg–/YXBwaWQ9c3JjaGRkO2g9Njk5O3E9OTU7dz0xMDE1/http://notrickszone.com/wp-content/uploads/2013/09/73-climate-models_reality.gif
Buster,
Just when I thought there were no more sharks for these two to jump …
BusterBrown@hotmail.com
Now that depends on the description doesn’t it?
For instance if I say it has not warmed in the last 15 years, it is appropriate to show ONLY the last 15 years.
If I say it warmed between 1975 and 1998 why should I show 1700 to present?
jim,
Bluster keeps saying he wants longer data sets:
http://www.thelivingmoon.com/47brotherthebig/04images/Antarctica/415k-year-temp-graph.jpg
These all debunk his notion that we should be worried about a little more warmth [click in images to embiggen]:
http://i.snag.gy/BztF1.jpg
Cold is the real threat. But the alarmist crowd is only worried about warmth.
http://1.bp.blogspot.com/_cHhMa7ARDDg/SsVwqCgB-LI/AAAAAAAABKo/U92CnYMmeSU/s1600-h/Vostok-400Kd.jpg
Are you worried? I’m not.
Busted?
…
Like I explained to you above. That is like bringing another red apple to the table. It is meaningless. We already have found the green apple (over 17 years with no warming). The hypothesis has been proven false.
Once again you went back to the where the paper is comparing the falsification criteria to the data through 2010 (this why they only have 32 years worth of data). I am comparing the falsification criteria to current data. Those words in the paper are meaningless.
This is like looking for apples back in 2010 and finding only red apples. Looks good. But, we are now in 2015. I just showed up with a green apple. Whatever happened in 2010 is now meaningless.
You then continue to reference the comparison to old data. Completely worthless as the lack of a green apple back in 2010 doesn’t change the fact we have now found a green apple.
Richrd M,
Bluster has no clue. It’s hard to believe, but he still doesn’t understand the concept of 18+ years of no global warming. I have a hard time believing anyone could be so dense, so I think he must be funnin’ us. If he’s really that stupid he’s on the wrong site.
dbs, yeah, I figured that out awhile ago. That is why I moved to a really simple analogy. It’s also why Brandon ran away so quickly. He finally got it.
Naw, I’m still here …
http://climexp.knmi.nl/data/itemp2000_global.png
… and more than happy to ask you to find The Hiatus in that one.
Dbstealey…
BusterBrown@hotmail.com
Gee, you draw a straight line at the end of a 140 year length of highly modified surface temperature records, then try to use that to challenge the significantly flatter (near-zero) LAST 18 years of the satellite record covering the entire globe.
Even so, look again at your graph: The last 18 years even of THAT record are flatter, rising less quickly now than the earlier period of your graph when CO2 levels were lower.
Buster
What is remarkable about the plot that you rely upon as showing that there has been no slow down in the rate of global warming is that it clearly demonstrates that there is no increase in the rate of warming between 1950 to date (that is the rate indicated by the blue line linear trend), and ~1910 to ~1945. If anything the rate of warming between about 1910 to about 1945 is greater than the rate of warming as from 1950 to date.
That is particularly damning since the IPCC accepts that manmade CO2 did not cause or contribute towards the 1910 to 1940 warming episode!!.
Whilst we know that there has been significant manmade CO2 emissions post 1950, as can be seen from your plot, this has not led to an increase in the rate of global warming. I emphasize that the rate between 1950 to date, is no greater than the rate between ~1910 to ~1945.
The fact that the rate has not increased is strong evidence to suggest that CO2 at current levels does nothing of significance.
Richard Verney,
No, it suggests that CO2 is not the only factor contributing to interdecadal surface temperature trends. I offer two additional factors for consideration:
http://climexp.knmi.nl/data/itsi_ncdc_monthly.png
http://climexp.knmi.nl/data/iamo_hadsst.png
Note the pre- and post-1950 trends. Meanwhile, below the surface …
http://climexp.knmi.nl/data/itemp2000_global.png
… the rate is clearly increasing. Strong evidence that CO2 does nothing of significance would be data which better explain observed temperature trends above AND below the surface than CO2 +/- other known factors do. If you have something which does that, now would be the time to share.
But by no means should we look at anything over 37 years. That would be ridiculous!
You are once again lacking the basic understanding of science. ALL IT TAKES IS ONE. I’ve given you a green apple and you are still insisting that each time you find another red apple it proves all apples are red.
Buster, we are not looking for the longest trends in the time series. We are comparing the time series against a specific criteria. It’s like looking at apples in a barrel. We aren’t looking to see how many red apples there are. We are looking to see if there are any apples that aren’t red. That is the criteria. Does finding 100 red apples prove that there aren’t any red apples? Of course not. That is what you are proposing. However, if I find one green apple that is all I need to know that all the apples are not red.
You really need to educate yourself on how science progresses. You are embarrassing yourself.
BusterBrown@hotmail.com
False. Dead wrong, no part of this is “simple” . (Well, other than that we do claim you are simply wrong.)
We are looking at the CHANGE in RECENT temperature trends. If we were to look at the longest time interval available – but not limit ourselves by looking foolishly at only a straight line through the data, we would see the Minoan Warming Period, the Roman Warming Period, the Dark Age, the Medieval Warming Period, the Little Ice Age, and today’s Modern Warming Period are all similar in length, shape and trends.
The facts are:
CO2 has increased significantly in the past 85 years.
For 36 years, 1940-1976, global average temperatures declined slightly.
For 22 years, 1976-1998, global average temperatures increased measurably.
For 18 years (and continuing), global average temperatures have remained steady.
Now, just what is this crisis you are so afraid of?
RA,
Actually temperatures declined sharply from c. 1940 to 1977. Look at the data used by NCAR in the 1970s, when science was so worried about a return of the ice sheets. NOAA, NASA and HadCRU have flattened and are continuing to “adjust” upward the actual observations for that chilly interval.
The cooling of the ’40so ’70s was in reality more pronounced than any warming of the late ’70s to ’90s.
You are stating another separate piece of work. However, that has nothing to do with the criteria that was developed and used in Santer et al 2011. In fact, that is exactly what our host did in his latest work that he showed in this thread.
http://wattsupwiththat.com/2015/12/17/press-release-agu15-the-quality-of-temperature-station-siting-matters-for-temperature-trends/
He thinks all those diagrams you and Brandon showed could be less accurate than they should be. Low and behold, he found your data wasn’t very accurate.
“The United States temperature trends estimated from the relatively few stations in the classes with minimal artificial impact are found to be collectively about 2/3 as large as US trends estimated in the classes with greater expected artificial impact.”
Those charts from NOAA and the JMA appear to create warming where none is actually present. Doesn’t matter how long the data runs if they use poor science in creating the data.
While that work is ongoing and related, it is different from the analysis of trends which is what we’ve been discussing. It also has nothing to do with satellite and radiosonde data which most honest people already admit is far more accurate than the highly adjusted surface data.
What I have pointed out is an analysis of the satellite/radiosonde data falsifies global climate models and their view of AGW. Your only recourse is
– demonstrate the criteria used by Santer et al is wrong
– demonstrate the satellite/radiosonde data is wrong
– come up with a new set of climate models that still show 3C of warming and contain long pauses.
Or, you could quit denying reality and accept that AGW has been significantly overstated.
RACookPE1978, I’m sorry…
(Note: “Buster Brown” is the latest fake screen name for ‘David Socrates’, ‘Brian G Valentine’, ‘Joel D. Jackson’, ‘beckleybud’, ‘Edward Richardson’, ‘H Grouse’, and about twenty others. The same person is also an identity thief who has stolen legitimate commenters’ names. Therefore, all the time and effort he spent on writing 300 comments under the fake “BusterBrown” name, many of them quite long, are wasted because I am deleting them wholesale. ~mod.)
Richard M. you post: “Low and behold, he found your data wasn’t very accurate. ”
….
(Note: “Buster Brown” is the latest fake screen name for ‘David Socrates’, ‘Brian G Valentine’, ‘Joel D. Jackson’, ‘beckleybud’, ‘Edward Richardson’, ‘H Grouse’, and about twenty others. The same person is also an identity thief who has stolen legitimate commenters’ names. Therefore, all the time and effort he spent on writing 300 comments under the fake “BusterBrown” name, many of them quite long, are wasted because I am deleting them wholesale. ~mod.)
I see Buster is big into denial.
The surface data was always been suspect to anyone with any understanding of science. It was never intended to be used for scientific purposes. Do you really think the US data is the only data that is going to be found to be improperly adjusted? What do you think will happen when the various algorithms are corrected to produce the right warming in the US? Won’t that also affect the rest of the world? Of course it will.
The oceans already show far less warming than the land. What we should see is a new algorithm that uses pristine data to correct the surface data. This will include the ocean data due to the extrapolation that is being done. What do you think it would show then?
BTW, the US data has been pretty close to the global land data in the computed trends. This also is true for satellites. This would lead one to believe the global land data also has been exaggerated by 60%.
Of course, we are getting off the track of the original discussion. It appears you finally are admitting you agree that satellite data has falsified the current set of climate models. Your response appears to be … ignore it and hope it goes away … aka denial.
LOL.
Richard M says: ” It appears you finally are admitting you agree that satellite data has falsified the current set of climate models”
…
(Note: “Buster Brown” is the latest fake screen name for ‘David Socrates’, ‘Brian G Valentine’, ‘Joel D. Jackson’, ‘beckleybud’, ‘Edward Richardson’, ‘H Grouse’, and about twenty others. The same person is also an identity thief who has stolen legitimate commenters’ names. Therefore, all the time and effort he spent on writing 300 comments under the fake “BusterBrown” name, many of them quite long, are wasted because I am deleting them wholesale. ~mod.)
You didn’t need to say a word, Buster. Your admission was inherent in your attempt to change the subject.
(Note: “Buster Brown” is the latest fake screen name for ‘David Socrates’, ‘Brian G Valentine’, ‘Joel D. Jackson’, ‘beckleybud’, ‘Edward Richardson’, ‘H Grouse’, and about twenty others. The same person is also an identity thief who has stolen legitimate commenters’ names. Therefore, all the time and effort he spent on posting 300 comments under the fake “BusterBrown” name is wasted, because I am deleting them wholesale. ~mod.)
Buster, what you obviously don’t understand is AGW is climate models and climate models are AGW. If you don’t understand this then you really shouldn’t be here discussing science.
As others have noted, it is not appropriate to seek to put a straight line linear trend through time series data of such short duration. In fact, we would not be talking about a ‘pause’ if one applies such a straight line plot across the 37 years of this time series
It is clear from the data, that there is anything but a linear trend in the data being returned. And it is also clear, that the data is a game of two halves each of about 18 years in duration..
Since launch (1979) through to the run up to the Super El Nino of 1997/98 the temperature trend was sight warming, but not statistically significant. It was all but flat. .
Post the Super El Nino of 1997/98, the temperature trend has been a slight cooling, but again not statistically significant. Once again, it has been all but flat.
The upshot is that for the first half of the series, temperatures were essentially flat, then there was a step change in temperature of about 0.27degC coincident with the Super El Nino of 1997/98, and following that event for the second half of the series temperatures have been once again essentially flat.
So this begs the question. What will happen with the current strong El Nino? Unless there is a long lasting step change coincident with this El Nino, as there was with the Super El Nino of 1997/98, we may expect that the La Nina that follows will bring temperatures down and then they are likely to settle again around the 2001 to 2003 anomaly level. Should that happen, by the time AR6 comes along, the ‘pause’ will be over 21 years in duration.
Let us see how the 2015/16 strong El Nino pans out and in particular whether there is a long lasting step change in temperature coincident with it, or whether it results in a short term peak such as that in say 2010.
We will know a lot more in the next 5 years.
,
Well if the presentation I gave above shows anything, it shows that this MIGHT be like a big swing. With the energy flopping backwards and forwards between the oceans and the land. On that ~65 year timescale so well known but somehow ignored. As to any CO2 ‘push’, I can’t say for sure.
Richard,
Your assessment is based on the satellite lower troposphere data alone. If we apply it to the surface data then we see quite different results.
In the surface data, there’s no significant difference between the trends seen between 1979 and 1998 and those seen since 1998: http://www.woodfortrees.org/plot/gistemp/from:1979/mean:12/plot/gistemp/from:1979/to:1998/trend/plot/gistemp/from:1998/trend
Even in the satellite data (RSS in this case) we can see that although the trend is slower, absolute temperatures were much higher over the later period: http://www.woodfortrees.org/plot/rss/from:1979/mean:12/plot/rss/from:1979/to:1998/trend/plot/gistemp/from:1998/trend
This thread is really on the satellite data, so we can leave GISS Temp out of the equation.
Let us not get dragged into discussions regarding the problems and issues surrounding the land based thermometer record, GISS Temp having the most severe issues. That does not mean that the satellite issue is free of issues. All data sets have issues, but at least the satellite data set is checked and calibrated against weather balloons so despite its issues, there are good prospects that it is telling us what the trends are in the lower troposphere. And of course, the AGW theorem rests upon the atmosphere warming which in turn leads to surface warming. the signal to AGW should first be detectable in what the satellite is measure before it becomes detectable at the surface where land based measurements are taken (and then adjusted and homogenised).
Your second plot, which sets out the satellite data strangely has a linear trend line for GISS Temp as from 1998. If it had a linear trend line for the RSS data itself (which is the subject matter of the plot and our discussions) as from 1998, that trend line would show slight cooling, as I have previously noted. The correct plot of your graph should have been:
[http://www.woodfortrees.org/plot/rss/from:1979/mean:12/plot/rss/from:1979/to:1998/trend/plot/rss/from:1998/trend
Now we can see that the satellite data is a game of two halves. In the first half, there is a slight warming trend of about 0.005555degCper year (ie., about 0.1 degC of warming over a period of about 18 years). Given the inherent errors of the instrument and data set, a warming in the order of 0.00555degC per year is not statistically meaningful. As I have previously noted, it is essentially flat, or cannot be distinguished from being flat.
In the second half, there is a slight cooling trend of about 0.00294Cper year (ie., about 0.05 degC of warming over a period of about 17 years). Given the inherent errors of the instrument and data set, a warming in the order of 0.00294degC per year is not statistically meaningful. As I have previously noted, it is essentially flat, or cannot be distinguished from being flat.
So we have two periods where there are essentially flat temperatures. If you like, there are two ‘pauses’ both of about the same duration (circa 17 to 18 years in duration).
There is just a one off and isolated warming episode. that warming episode coincides with the Super El Nino of 1997/98 which as far as we know is an entirely natural event.
Perhaps I should also point out that Michael Mann’s tree rings (well Briffa’s trees) also showed that there was no warming between 1979 and the run up to the super El Nino of 1997/98 and that is why he ditched the tree rings and performed his nature trick It would appear that there was no significant warming between 1979 and the run up to the Super El Nino of 1997/98, and the only reason one see warming in the like of GISS Temp is pollution/corruption of the data due to station drop outs, homegenisation, siting issues and changes, UHI and the like.
Apart from the slight typos, my post had an error in substance. The fifth paragraph which is referring to the cooling trend in the record should have read:
In the second half, there is a slight cooling trend of about 0.00294Cper year (ie., about 0.05 degC of cooling over a period of about 17 years).
I don’t think the data supports ‘flat’ anywhere. It ‘may’ be a suggestion of some, as yet undiscovered, long period cycle/wave. Time will tell.
But you are comparing point samples series with an area sampled one. There are always going to be differences in what they show. The long term ‘trend’ will be the same though.
The differences between Global Satellite and Thermometer temperature data probably only displays the inevitable difference between any point sampled series with the required interpolation/extrapolation and ones which are area/volume based.
This data appears to support some aspects of greenhouse warming/cooling. Note that Australia is one of the warmest. This appears to support water vapor being a negative feedback. If it was a positive feedback then we should see more warming in moist places.
The warming near Svalbard shows the impact of the AMO. If the greenhouse effect was the cause shouldn’t the warming be across the entire Arctic?
The cooling of Antarctica shows greenhouse cooling at high elevations.
All of this supports the idea that the greenhouse effect is real but small and negative feedback dominates. Exactly what many skeptics have been saying for years.
I would say that about 60-80% of the warming seen in the data is due to the ~60 year ocean cycles. This leaves very little warming from GHGs.
I think that the fact that there may have been a smaller weighting applied to the 60-65 year cycle than would have been prudent is begging to dawn.
Several of us predicted this bullshit.
UNFCCC ‘goal’ is with respect to suface temperatures – you know, where we live. The adjusted UAHRSS MSU data is an estimate of temperatures at around 14,000 ft.
Err….apples and pears, surely?
Village Idiot:
“…suface temperatures – you know, where we live.”
What are you, an ant? You don’t live ‘on the surface’, you live in the lower troposphere, which begins at the surface and extends at least up to your head.
Satellites measure the lower troposphere. Satellite data shows no global warming for almost 20 years now. Satellite data is coroborrated by many thousands of radiosonde balloon data points.
At what point would you finally admit that your ‘dangerous man-made global warming’ conjecture has been falsified by Planet Earth? Or, is there nothing that can ever convince you? That makes your belief religious, not scientific.
The climate alarmist contingent is made up of people exactly like you. No amount of physical evidence, or observations, or measurements can ever convince you that your original premise — that a rise in CO2 — will lead to unstoppable global warming and climate catastrophe.
There are diffferent reasons, just as there are different people. some of you are eco-religionists, who have faith that they’re right, and evidence be damned. Others just keep moving the goal posts whenever it’s clear that scientific skeptics are scoring points. Yet others simply refuse to ever admit that they could have been wrong; it’s an ego thing with them. And others, the self-serving climate charlatan scientists who are benefitting financially, and in their carreers, and having their egos stroked by a fawning media, are being bought and paid for. They’re the professional rent-seekers who have exchanged honesty and ethics for loot.
But once in a while the conscience of one of them takes hold, and they admit that empirical observations have falsified the ‘carbon’ scare. Those are the ones to be admired. They have kept their integrity despite knowing they will be attacked for it, and some have even lost their employment for honestly stating their views. and many others have been denied well deserved promotions, pay raises, and carreer advancement because they told the truth, instead of going allong. No douybt you’ve heard the maxim:
“If an honest man is wrong, after demonstrating that he is wrong, he either stops being wrong or he stops being honest.”
You have a choice, just like everyone on the climate alarmist side of the debate. I don’t blame you or anyone else for honestly arguing their point of view. But now, after many years with no global warming despite the steady rise in CO2, your continued insistence that ‘dangerous AGW’ is happening looks like you fit into one of the categories described here. To this day there are no verifiable measurements quantifying what you insist must be happening. So once again: what would it take to convince you that your original premis (CO2=DAGW) might be wrong?
How about an answer to that question?
When someone demonstrates that the Laws of Physics have, in fact, been suspended
The differences between Global Satellite and Thermometer temperature data probably only displays the inevitable difference between any point sampled series with the required interpolation/extrapolation and ones which are area/volume based.
This is no longer a concern. Despite the physics, the Paris Climate Agreement has ended all forms of Climate change, extreme weather, and sea level rise for now and for all time and we here in the USA do not have to pay for it because we are a poor nation with a large national debt, trade deficit, and unfunded liabilities. Apparently the powers that be are convinced that the sun and the oceans will be intimidated into providing an impossible ideal climate for ever after.
Hep, all this nonsense was well documented a few years ago in this documentary.
https://youtu.be/QowL2BiGK7o?t=22m30s
Would some of you WUWT readers please help me understand a few things about MODTRAN?
Here is the program: http://climatemodels.uchicago.edu/modtran/
1) What are the labels on the Water Vapor Scale? 1 is for the default, but how do you adjust it? What would a 2 mean and what would 100 mean if entered? What is the appropriate range for adjustments?
2) Is there an established relationship between Δ W/M^2 and Δ Temperature? What is it?
3) What settings would I use to replicate the Sahara desert and Death Valley, and a rain forest on the same latitude?
Good questions.
2) Isn’t the relationship between Δ W/M^2 and Δ T essentially the illusive climate sensitivity? E.g., a doubling of CO2 is equivalent to a “forcing” of 4 W/m2 which allegedly results in a 1K rise in temperature.
While we’re at it, can someone explain if Modtran calculations can take into account the influence of convection on atmospheric energy fluxes. If they don’t, how can they have any application to predicting temperature change due to changes in CO2 concentration in the atmosphere?
Chic Bowdrie,
Yes.
That’s a very specific metric which unfortunately is also referred to generically as “climate sensitivity”. It can still be related back to the more general form …
… which I posted previously. As a side note, the median estimate for temperature per 2xCO2 as of AR5 is ~3 K, not 1. So we have 3/4 = 0.75 K/(W m^-1) which is within the range of values commonly used for lambda.
The model co2islife is asking about does not.
How could a purely convective model be used to estimate temperature change if it completely ignores changes in latent heat flux? Changes in cloud cover? Changes in solar output? Changes in surface albedo?
Brandon,
My last question was poorly phrased. Any purely this or that model cannot be expected to estimate temperature change well. Long term changes in surface albedo, solar output, and cloud cover would be best reserved for a more complex model after a simpler model adequately accounting for radiation, convection, conduction, and evaporation has been developed. My question comes from wondering how the 4 W/m2 calculated from spectral changes by Modtran can be accurately associated with any specific temperature change without taking all the daily dynamic energy flux variables into account?
Chic Bowdrie,
Finally a sane question, sorry I missed it in all that excitement going on upthread. That Modtran model isn’t intended to produce publication-quality output, it’s educational. The 3.7 W/m^2 figure we read about as the change since pre-industrial comes from a combination of observations and models which do take into consideration the other fluxes and dynamics in the system we know about and have been able to estimate. (I almost said, “all the other fluxes and dynamics” … which is false, we don’t have them all by far, hence the range in estimates and appropriately big error bars on them …)
I’m too tired to Goggle (not a typo) the relevant IPCC AR5 chapter which discusses this, but if you search on “AR5 attribution CO2” yadda yadda, you can probably come up with the linky to the document.
co2islife,
2 would mean twice the mixing ratio of water vapor in the troposphere from the standard atmospheric used by the model. The range for adjustment would be whatever you think is plausible for a given average global temperature change.
NOTE that ground temperature is fixed in this model, only TOA flux changes. If you want to see what the surface temperature would be at 800 ppmv CO2 (a doubling from the default 400 ppmv), you must first note that the starting value for upward flux at TOA is 289.288 W/m^2, and then change the ground temperature offset until TOA flux returns to 289.288 (+0.9°C is the value which does it).
According to the IPCC, the formulation is:
The estimated value for λ (the climate sensitivity parameter) ranges from 0.7-0.8 K/(W m^-1).
The Sahara’s annual mean temp is about 30°C, the Amazon, 27°C (note that the Amazon is several degrees of latitude closer to the equator). Add 273.15 to those values to convert to K. Good luck figuring out realistic values for the water vapor parameter — you’ll find a lot of hits for relative humidity which won’t work in this model without conversion.
OK, that is what In was looking for. If you make the adjustments to reflect the Sahara Desert, ie water vapor = 0 for Midlatitude Summer, +7°C offset. looking down from 70km, 400ppm, fixed relative humidity, no rains for clouds.
Result = 368.95 W/M^2
Now change that to heavy rain and water vapor to 2 and the value changes to 263.038.
That is a full 105 W/M^2, or 25°C. Clearly CO2 is pretty weak relative to H2O.
H2O can alter temperatures by 25°C, and we are worried about CO2 causing 1°C? Really?
According to the IPCC, 1 K change comes from the CO2 doubling, ~2 K comes from net feedbacks, the main one of which IS water vapor.
The fact is we don’t just add water vapor or double CO2. As I understand it, the MODTRAN calculations are based on spectra of atmospheres of defined composition. The composition of humid air can change considerably throughout the day. CO2 not so much. But even if somehow 100 ppm CO2 could be injected into the air, the calculated spectra changes would have to be recorded throughout a sufficiently long period of days where the combined effects of evaporation, convection, and radiation can be appreciated. Where is the data that validates radiative-conductive models predicting temperature changes resulting from changes in atmospheric composition?
Chic,
Hundreds of papers starting from the late 1960s when the first 1 dimensional models were written. Off the top of my head try Harries (2001) I think it is, they compared the outgoing spectra observed in the 1970s with the same observations from a different satellite in the late 1990s and matched the difference up to what a radiative transfer model predicted. IIRC they considered both clear sky and cloudy sky conditions.
Brandon,
This is the abstract from a paper (Chapman et al., 2013) that extends the work of Harries et al.:
“Increased greenhouse gasses reduce the transmission of Outgoing Longwave Radiation (OLR) to space along spectral absorption lines eventually causing the Earth’s temperature to rise in order to preserve energy equilibrium. This greenhouse forcing effect can be directly observed in the Outgoing Longwave Spectra (OLS) from space-borne infrared instruments with sufficiently high resolving power 3, 8. In 2001, Harries et. al observed significant increases in greenhouse forcings by direct inter-comparison of the IRIS spectra 1970 and the IMG spectra 19978. We have extended this effort by measuring the annual rate of change of AIRS all-sky Outgoing Longwave Spectra (OLS) with respect to greenhouse forcings. Our calculations make use of a 2°x2° degree monthly gridded Brightness Temperature (BT) product. Decadal trends for AIRS spectra from 2002-2012 indicate continued decrease of -0.06 K/yr in the trend of CO2 BT (700cm-1 and 2250cm-1), a decrease of -0.04 K/yr of O3 BT (1050 cm-1), and a decrease of -0.03 K/yr of the CH4 BT (1300cm-1). Observed decreases in BT trends are expected due to ten years of increased greenhouse gasses even though global surface temperatures have not risen substantially over the last decade.”
Brightness temperature is calculated from spectra (by MODTRAN/HITRAN or some other device/model?). Note the conclusion “observed (ie calculated) decreases in BT trends are expected (ie not measured) due to ten years of increased greenhouse gasses even though global surface temperatures have not risen substantially over the last decade.” IOW, something is wrong with our model, but at least it does what we expect it to.
Chic Bowdrie,
“AIRS spectra”: http://disc.sci.gsfc.nasa.gov/AIRS/documentation/airs_instrument_guide.shtml
Trends were calculated from observations (ie, measurements).
No, IOW: even though surface temperatures have not risen substantially over the last decade, decrease in brightness temperature was observed as would be expected with an increase in greenhouse gasses. The abstract makes no predictions.
Brandon,
You said there were hundreds of papers validating radiative-conductive models. The Harries et al. paper covered an early period where the calculated model results were used to infer that increased IR active gases could have raised global temperatures. The follow up paper by Chapman it al. likewise showed that a “brightness temperature” can be calculated from changes in atmospheric composition. But the model is useless for predicting temperature changes as indicated in their own conclusion.
Just admit that there is no data that validates radiative-conductive models predicting temperature changes resulting from changes in atmospheric composition.
In regards to global temps, I would rather see maximum and minimum temperatures because we have both day and night. Blurring it all into one global average seems silly to me. It gives the perspective of a flat earth that only ever faces the sun. Eg. How would someone understand a comparison of roller coaster rides by looking at Averages?
That is a great point that people seem to miss about this issue. CO2 is transparent to visible light. CO2 has no real impact on daytime temperatures. The CO2 signature would be nighttime temperatures increasing in the dry deserts, where H2O would not be a factor. There are lots of natural “controls” for H2O, yet the Climate “Scientists” don’t seem to focus on them. Does anyone know of research demonstrating that night time temperatures are increasing over the deserts?
Yes we would expect nights to min temps to rise faster than max temps, but we still expect max temps to rise. I don’t have a handy reference, and don’t recall ever reading one that was desert specific.
Water vapor/cloud feedbacks are two of the most uncertain climate parameters according to the IPCC ARs, and they devote a lot of ink to discussing it. Why you think they’re not a focus, or is being ignored, frankly baffles me — it’s one of the most highly contested topics in current literature.
Is there any evidence that CO2 is leading to an increase in global humidity? I can see CO2 leading to more plant growth and H2O production, but that 1W/M^2 should increase H2O globally. Is there evidence of that?
https://www.climate.gov/news-features/understanding-climate/2012-state-climate-humidity
http://www.climate.gov/sites/default/files/styles/inline_all/public/SpecificHumidity_land_ocean_71-2012.png?itok=TVgMhYuS
Annual specific humidity since 1971 compared to the 1979-2003 average (dashed line) over land (brown line) and ocean (green line). Earth has become more humid in recent decades. Based on direct humidity observations made since the early 1970s. Graph adapted from Figure 2.10 in the 2012 BAMS State of the Climate report.
Bah, I muffed the image link:
The relative humidity has been falling since 1947 throughout the Troposphere:
http://www.climate4you.com/images/NOAA%20ESRL%20AtmospericRelativeHumidity%20GlobalMonthlyTempSince1948%20With37monthRunningAverage.gif
That is also the case for specific humidity except for near the surface:
http://www.climate4you.com/images/NOAA%20ESRL%20AtmospericSpecificHumidity%20GlobalMonthlyTempSince1948%20With37monthRunningAverage.gif
Chris Hanley,
Relative humidity tells us virtually nothing about LW optical thickness of the atmosphere due to water vapor … specific humidity is the better metric. At the surface is where we’d expect to see the largest positive correlation with surface temps … and so it is. (The Clausius–Clapeyron relationship is really difficult to argue with … it’s been around since 1850ish, and meteorologists were learning about it and using it since before Al Gore’s parents were even born, if not earlier …)
Finally, note how very different the y-axis scales on in the bottom plot for each pressure level … three orders of magnitude smaller at 300 mbar than at the surface meaning that the radiative forcing in the upper troposphere due to water vapor is essentially negligible compared to near the surface.
Cloud feedbacks … well that’s something I really can’t argue confidently about being almost certainly positive.
“Cloud feedbacks … well that’s something I really can’t argue confidently about being almost certainly positive.”
===========
Did you in a round-about way, just say, you don’t have a clue ?
The increase in specific humidity near the surface would also imply an increase in lapse rate near the surface. The lack of increase in specific humidity at the 600mb and 300mb levels imply that there is no increase in radiative forcing for the mid to upper troposphere. Perhaps that’s why the UAH and RSS both report a relatively small amount of waring of the mid to upper troposphere.
The lack of increase in specific humidity at the 600 and 300mb levels is at odds with what many of the climate models predict.
Brandon,
During the period 1980 to 1998 where average global temperatures rose faster than at any time in a century, specific humidity near the surface was essentially constant. Also no one expects water vapor to have any significant effect on energy flux at 300 mbar. I submit to you that water vapor and CO2, for that matter, exert their influence mostly by inducing convection after absorption of LWIR near the surface. Where is the evidence that increases in IR active gases increase global temperatures?
u.k.(us),
Pretty much. I know clouds are hard, and figuring out how to describe the ways in which they’re hard is one of those things that exceeds my willingness (if not capacity) to claw up the learning curve.
Chic Bowdrie,
I’ll have to poke around on my laptop tomorrow and look for the data on that.
I don’t make such assumptions. That climate4you guy likes posting a bunch of plots of things with dubious context, IMO. I never know what people will make of them.
There’s no doubt in my mind that convection and evaporation is a major component of heat loss from the surface, and that convection is driven in large part by radiative transfers in addition to surface heating. My understanding is that the upper troposphere — where convection begins to stall out and most precipitation happens — is where downward radiative flux comes into its own as a contributor to the “greenhouse” effect.
Well if these two plots don’t sway you …
http://3.bp.blogspot.com/-44o767sAtyg/VnYjEZvlczI/AAAAAAAAAgQ/V54mqEugVV0/s640/HADCRUT4%2Bvs%2BCO2%2Bmonthly.png
http://2.bp.blogspot.com/-8uR50mjSJ2E/VUQ4mCn9x-I/AAAAAAAAAdY/IIUsevfnRzw/s1600/GW%2BPetty%2BIRIS%2BTropical%2BWestern%2BPacific.png
… then we may need to discuss it from first principles of physics. Try Beer-Lambert law for starters.
Here are some books …
Introduction to Atmospheric Chemistry, by Daniel J. Jacob, Princeton University Press, 1999. Completely free online:
http://acmg.seas.harvard.edu/people/faculty/djj/book/
Principles of Planetary Climate, Ray Pierrehumbert. A classic, but not free:
http://geosci.uchicago.edu/~rtp1/PrinciplesPlanetaryClimate/index.html
The Discovery of Global Warming by, Spencer Weart, more of a history lesson on how we got from Arrhenius to Hansen, completely free online:
https://www.aip.org/history/climate/index.htm
Too tired to do more than spam you with links, discussion will have to wait until tomorrow.
erikemagnuson,
I’m up too far past my bedtime to say much other than the uncertainty in the observations in the upper layers of the troposphere limits our ability to say whether the observations are right enough to quantify how wrong the obviously wrong models are (duh, they’re models). I will perhaps be able to compose a more cogent and referenced response tomorrow.
The change in total water column shows the rise and fall was mainly due to ENSO and Tropics ocean behavior. Many areas over land had recorded increase in sunshine hours with decreasing relative humidity. The specific humidly decline in the atmosphere especially occurs at height where any change in greenhouse effect should be greatest. The specific humidity increases a little at the surface, but that is again mainly due to ENSO and Topical regions behavior. Generally where there is a decline or increase, rules for both relative and specific humidity except at the surface. The main reason for the differences at the surface is down to latent heat over the oceans.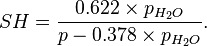

http://images.remss.com/figures/climate/vapor_global60.png
http://images.remss.com/figures/climate/temperature_and_vapor_trop20.png
There is not much difference between relative and specific humidity and both can easily be calculated from each other.
Using this definition of specific humidity, the relative humidity can be expressed as follows:-
“Total column water vapor is a measure of the total gaseous water contained in a vertical column of atmosphere. It is quite different from the more familiar relative humidity, which is the amount of water vapor in air relative to the amount of water vapor the air is capable of holding. Atmospheric water vapor is the absolute amount of water dissolved in air.”
The total column water vapor and specific humidity has always been restricted to how much the air is capable of holding it, like relative humidity.
Brandon,
You say “My understanding is that the upper troposphere — where convection begins to stall out and most precipitation happens — is where downward radiative flux comes into its own as a contributor to the ‘greenhouse’ effect.”
I assume the graphs you show are intended to argue that temperature rise over several past decades are caused by increases in the atmospheric concentration of IR absorbing gases. This is an invalid causation by correlation argument. And it’s not even that good, because there are relatively long periods where temperatures decline while CO2 increases. [Note my earlier response to your comment beginning with “Hundreds of papers….”] To show causation, one has to demonstrate how the changes apparent in the spectra result in temperature changes that aren’t confounded by the influence of other factors, the most important of which are convection and advection.
The radiation absorbed by water vapor and CO2 near the surface is completely assimilated into the bulk air. There is little net radiation at middle elevations until the atmosphere is thin enough that emissions overwhelm molecular collisions. This occurs mostly in the upper troposphere above where most water vapor condenses. There is little radiation at those temperatures that will return to the surface in the face of a convective engine constantly moving energy skyward.
This isn’t my field. However, if it was, I would want something more definitive than vague correlations between model output and temperature. Simple model physics cannot determine the relative contributions to global temperatures. Maybe a complex enough model isn’t feasible. But until models can accurately predict temperature changes due to atmospheric composition, much of what you assert is wishful thinking.
We can append the lower troposphere data from the radiosondes as well and go back to 1958 (57 years).
And we can account for the ENSO variations, the volcano variations (noted in the top post) and the solar cycle variations (which are actually too small but are included since there is a tiny hint of them) and the AMO cycle variation (there really is a 60 year cycle in temperatures probably caused by the AMO) and the CO2 warming influence then becomes the residual.
If we model the lower troposphere temps based on those influences, we get a really, really good match.
http://s21.postimg.org/420tn9opj/UAH_RSS_Had_AT_Model_Nov2015.png
Then is take the warming influence left over and compare that the climate model forecasts. Well, they are a disaster. But there is a tiny warming signal.
http://s11.postimg.org/9fwmivglv/UAH_RSS_Had_AT_Adj_versus_IPCC_Models_Nov2015.png
Going out to the year 2100, there is nothing to worry about because all that we will see in the lower troposphere in another 0.3C of warming. The “adjusted” surface temperature data will, of course, depend on what the people in charge of the NCDC are doing at the time – continue to just make up the temperatures or have finally gotten rid of all the people who have no integrity.
http://s10.postimg.org/y29k2xqzt/UAH_RSS_Had_AT_Warming_vs_IPCC_AR5_Nov2015.png
I’ve been running this system for 7 years now and it seems to continue performing every time I put new actual observations into it.
Chic Bowdrie,
I wouldn’t expect a single variable to explain all temperature changes in a system as complex as this planet.
I agree it helps to identify and isolate as many confounding factors as possible. However, change in the mean temperature of the planet is a function of energy absorbed vs. energy emitted … all convection and advection do is move energy from one place to another.
Please show me the evidence of changes in convection/advection which explain surface temperature trends since the mid- to late-19th century …
http://climexp.knmi.nl/data/iheat2000_global.png
… and which can explain the addition of some 25×10^22 J of energy to the upper two kilometers of ocean.
Now it is my turn to ask what evidence you have to support all this. While you’re coming up with it, we have directly observed downward flux at the surface, by spectral line …
http://www.skepticalscience.com/images/infrared_spectrum.jpg
… and as you can see, the 15 micron CO2 band is quite well represented, as is water vapor on the wings and ozone at 10 microns.
What model output?
What “simple” models are you talking about?
How complex does the model need to be?
My wishes aren’t relevant, evidence of physical phenomena is.
No model will ever be able to exactly predict anything.
Matt G,
One of the key features of an ENSO positive phase is a positive temperature anomaly. Higher temps, higher specific humidity.
Yes that makes sense, decreasing RH implies conditions less likely to produce cloud formation.
I don’t follow. I would expect specific humidity to decrease at night because the sun isn’t driving surface evaporation. Keep in mind that the change in greenhouse effect we’re talking about here is on the order of 3.7 W/m^2 since the mid-19th century, whereas the change in insolation between day and night is on the order of a thousand W/m^2, give or take a few hundred depending on latitude (and season in higher latitudes).
So long as you know all the inputs, the main ones being temperature and pressure. My main point was that the relationship between specific humidity and temperature is not linear …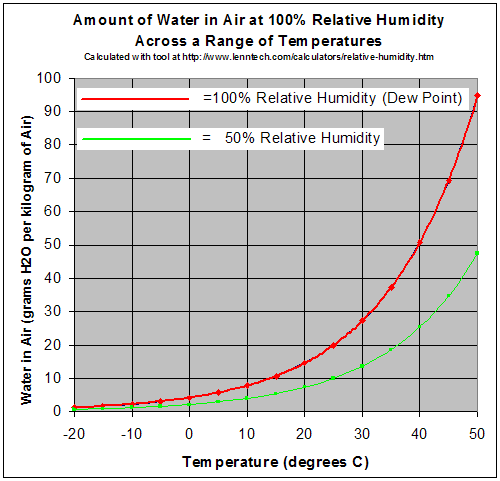
… and that using relative humidity as a proxy for specific humidity is not a good idea unless temperature is pretty tightly constrained.
Brandon,
“Please show me the evidence of changes in convection/advection which explain surface temperature trends since the mid- to late-19th century …”
Convection and advection are phenomena like evaporation. They are processes that are influenced by conditions like atmospheric composition and temperature. Your position seems to be that another phenomenon, radiation, is predominately responsible for energy fluxes through the atmosphere and their influence on temperature. I contend that the role of evaporation, convection, and advection along with radiation are integrally linked in a way that further increases in CO2 have minimal effect on global temperatures. Natural factors may be sufficient to explain nearly all observed temperature changes. Matt G and Bill Illis provided evidence of this.
“Now it is my turn to ask what evidence you have to support [my characterization of energy fluxes through the atmosphere].”
I refer you to Roy Clark for the answer: http://venturaphotonics.com/GlobalWarming.html
“What model output?”
Model output are the values of a dependent variable calculated from an equation containing a set of independent variables. For example, temperature is dependent on solar insolation, albedo, cloud cover, etc.
“What “simple” models are you talking about?”
One dimensional models using only radiation to explain atmospheric temperatures.
“How complex does the model need to be?”
Complexity is not the goal. They only have to be good enough to predict results with reasonable accuracy. Climate models don’t do that yet.
Chic Bowdrie,
“Please show me the evidence of changes in convection/advection which explain surface temperature trends since the mid- to late-19th century …”
I asked for evidence of changes to those phenomena which explain surface and below-surface temperature trends since the 1800s.
Almost. My position is that the change in IR flux in the atmosphere is primarily responsible to the observed change in temperature since the industrial revolution.
I saw Bill Illis’ post here:
http://wattsupwiththat.com/2015/12/19/uah-un-climate-change-goal-new-trend-analysis-shows-were-there-now/#comment-2103166
I have my own regression model using HADCRUT4:
http://1.bp.blogspot.com/-oxFP6mUKqIY/VTWEdb3gJzI/AAAAAAAAAbU/YiRjFJ8Zb8M/s1600/HADCRUT4%2B12%2Bmo%2BMA%2BForcings.png
The natural factors I used do a great job of explaining inter-annual and -decadal fluctuations, but do a terrible job explaining the secular trend over the entire interval. There may be some combination of natural factors sufficient to explain that secular trend better than CO2, but I am not asking for speculation, I am asking for evidence. A time series of some measured natural phenomenon showing a secular trend combined with a description of plausible physical mechanism to explain its influence on temperature would be a good candidate.
Well, no. The crux of his argument is:
The temperatures in the upper troposphere are near 220 K. The assumption that small changes in LWIR flux in the upper troposphere or stratosphere can influence surface temperatures of 288 K requires a flagrant violation of the Second Law of Thermodynamics. Heat does not flow from a cooler to a warmer body.
He is saying what it can’t be, and then spends a lot of time aruging what else it might be.
“What model output?”
I accept that definition of model. Go back to Bill Illis’ post and tell me why his is “something more definitive than vague correlations between model output and temperature”, because I frankly don’t understand the distinction.
I agree. I take it you think 1960s vintage 1D models represent the current state of the art?
Good, I’m of the mind that they should be simple as possible but no simpler.
It’s arguable that everyone (who cares) wants models to be exactly accurate. I reiterate: ain’t never gonna happen.
Brandon,
“I asked for evidence of changes to those phenomena which explain surface and below-surface temperature trends since the 1800s.”
I’ll try to explain better so you won’t have to keep asking. Convection is not a force, or matter, or energy that can directly measured, AFAIK. It’s a response that happens to a system whose thermodynamic equilibrium has been disturbed. I suppose its influence can be demonstrated by measuring heat transfer through two materials of the same heat capacity, one a fluid and the other a solid. The problem is how to differentiate the relative contributions of convection and radiation to heat transfer through the atmosphere. That is what a good model would do. If I had the model and the data with the evidence, I would have presented it by now.
“My position is that the change in IR flux in the atmosphere is primarily responsible to the observed change in temperature since the industrial revolution.”
“and tell me why [the Bill Illis model] is ‘something more definitive than vague correlations between model output and temperature’, because I frankly don’t understand the distinction.”
Your regression model is impressive. So is his. Therefore, I should rephrase that my preference is for something other than a century-long regression model which is essentially a correlation as opposed to a radiative-convective model which more directly measures temperature as a function of specific variables during a relatively short time period. This is difficult given the problem of controlling for all the atmospheric variables and that CO2 doesn’t change that quickly. It appears that your model finds CO2 as primary component while the Illis model, not as much. That’s why a radiative-conductive model is necessary to determine whether or not it’s justified to conclude that the weight your model places on CO2 is correct. What if there is some other factor(s) that would provide a contribution obviating the need for a CO2 dependence in your model?
Did you find anything in Roy Clark’s article that is refutable or contradicts my rationale for asserting that any further increases in atmospheric CO2 can have no further influence on average global temperature?
Chic Bowdrie,
I recognize all too well the difficulty in obtaining quantified evidence of atmospheric phenomena. I am asking you for it because it is what you have asked of me.
I’m glad you brought that up because invoking changes to convection/advection wants a causal explanation.
I fully agree, and will add that it is apparently tremendously difficult to do this.
Fair enough. At the very least we seem to agree that models have an appropriate role IF they’re sufficiently representative, well-designed and validated.
Thank you. Bill does good stuff, but I obviously like my model better. 🙂
Reasonable. I would like to point out that a 1.5 century long model need not sacrifice high time resolution.
Which is the best argument I can think of for training/validating any model against as long a time interval as possible.
Here’s what I get in my model for temperature response to a doubling of CO2 (K/2xCO2) over two different sampling intervals:
1.67 1880-2015
1.65 1958-2015
Essentially no difference. The main difference between my model and his is almost certainly because the radiosonde data he used has a lower trend over 1958-2015 than HADCRUT4.
Or conversely whether the weight his model puts on ln(CO2) is correct — which is really an argument about whether HADCRUT4 is wrong and the ‘sonde data are correct. (Hint: they’re both wrong.)
I’ll shortcut this; the radiative transfer models exist and they are in good agreement with observations … that’s the point of Harries (2001) and other like studies. The problem, as ever, is separating out the temperature response to that signal from the much higher frequency AND amplitude “noise” in the system. Observational uncertainty in temperature measurements is a big part of the difficulty.
Models that include convection/advection also exist … I’d be very surprised to learn that any of the CMIP5 ensemble models don’t.
If there were something even close I would pay attention. Completely eliminating CO2 (or any other IR active species … like water vapor, methane, ozone, etc.) as a factor would be a tall order, I’d need to see that argument in a lot of peer-reviewed literature.
His basic premise that it violates the 2nd law of thermodynamics is the fatal flaw for me.
Brandon,
“I would like to point out that a 1.5 century long model need not sacrifice high time resolution.”
I don’t understand this and probably not necessary. I do appreciate having to separate out the temperature response is a problem with the long term regression models. Obviously you managed it to a good degree.
The radiative transfer models is another story. They only tell you how much radiation escapes to space based on a given atmospheric composition. It doesn’t tell you what effect that would have on temperature and the reason is the convection that is occurring is moving energy through the atmosphere and it’s not being quantitated by those radiative transfer models. Am I wrong?
I think we both agree that CMIP5 models incorporate all the known processes and variables. The problem I suspect is inadequate characterization of the inputs and invalid model assumptions, not the least of which could be the reliance on CO2.
This is why Roy Clark’s paper is so important. The only way heat can be transferred from cooler elevations is when the atmosphere is warmer than below. This only happens due to wind or at night if the surface cools faster than the air immediately above. Otherwise there is never a time when more LWIR transfers down than up. So that satisfies the 2nd Law. But the important part is that collisions are so much faster than emissions close to the surface that the vast majority of radiation absorbed by CO2 and water vapor is transferred to O2/N2 in the bulk air. It expands and rises carrying the energy with it. At sufficient elevation, according to Clark 1km, no DLWIR is capable of reaching the surface. From that point up, the downwelling LWIR and upwelling LWIR will cancel each other out. Only until the atmosphere is thin enough will emissions predominate and that is in the upper troposphere. An adequate radiative-conductive model has to be able to describe this daily dynamic phenomena.
The specific humidly decline in the atmosphere especially occurs at height where any change in greenhouse effect should be greatest.
Relative humidity increases during night due to the sun is driving surface evaporation. The reason during hot/dry days humidity decreases until around it’s highest point in the afternoon. On a similar typical day humidity increases again later in the evening with weakening sun and especially after sunset.
The change in greenhouse effect is only typically around 3.7 W/m2 at TOA and is around 1.0 W/m2 at the surface. Hence, it should be more pronounced higher up in the atmosphere. The 1.0 W/m2 at the surface makes hardly any difference compared to latent heat. Latent heat is a negative feedback from any warming at the surface. The insolation is huge compared with this tiny change and why no positive feedback is observed. Shortwave radiation doesn’t has this problem because it penetrates deep into the water.
Regarding below,
There is not much difference between relative and specific humidity and both can easily be calculated from each other.
There are numerous papers including ones based on models that use relative humidity with radiative forcing and not specific humidity.
http://www.sciencedirect.com/science/article/pii/S1352231008003567
http://www.atmos-chem-phys.net/9/2375/2009/acp-9-2375-2009.pdf
“It is now widely known that the water vapor feedback
in general circulation models (GCMs) is close to that which
would result from a climate‐invariant distribution of relative
humidity”
http://onlinelibrary.wiley.com/doi/10.1029/2009JD012585/pdf
Chic Bowdrie,
For a purely radiative model, you are not wrong. They’re only useful for very approximate estimates, and I think best only used for instructional/conceptual (ie, teaching) purposes.
I’ve said many times in this forum that anyone who can sub in some other observable parameter for CO2 and improve the performance of an AOGCM by so doing will have my full and undivided attention. Nothing against you (I find you pleasant to talk to), my patience wears thin on this point because I’ve read it so often. A major function of science is to debunk bad hypotheses, but I argue that the most important function of science is to produce better hypotheses — which means for me a lot more than just proposing them.
I can never keep track of which version of Trenberth and Kiehl’s energy budget cartoon is current …
http://www.agci.org/classroom/images/trenberth_energy.png
… but this should be good enough. So, from the surface, upwelling LW is 396 W/m^2, downwelling LW (the infamous, much derided “back radiation”) is 333 W/m^2, NET is -63 W/m^2, indicating a net loss from the surface.
Suppose we reduce DWLR to 330 W/m^2 somehow, NET radiative loss from the surface then increases to -66 W/m^2. Assuming solar input stays constant, what do you think would happen to surface temperature?
Here are the numbers as I understand them: only 1 out of every million photons abosrbed by CO2 is re-emitted. The other 999,999 times, the CO2 molecule bumps an O2 or N2 molecule and transfers the energy to it. Since O2 and N2 aren’t good IR emitters, essentially the only way they can ultimately dump accumulated energy into space is to collide with an IR active molecule like CO2, methane, water, CFCs, ozone, etc. About 6% of such collisions cause CO2 to burp out a photon.
I buy that. (The statistic I know is that at sea level a beam of 15 micron radiation only penetrates a few tens of meters before being completely absorbed.) The converse is that from the surface, no upwelling LW is capable of being transmitted higher than 1 km. Another thing to keep in mind is that all along that 1 km path, CO2 is absorbing and emitting — in all directions — the entire time.
Going back to this plot and looking at the top figure …
http://www.skepticalscience.com/images/infrared_spectrum.jpg
… we see that the CO2 “notch” at 15 microns lies on the 225 K temperature curve, which corresponds to an altitude of about 10-15 km. This is sometimes called the “average emission altitude” for CO2, and the implication is that at altitudes above this point, more CO2 would result in cooling, below that — warming. From weather balloon data, this appears to be the case:
http://1.bp.blogspot.com/-rgGRw3GZqN0/VnBiqxSngtI/AAAAAAAAAgE/Qb_cVR0At9I/s640/RATPAC-A%2BTemperature%2BTrends%2Bby%2BAltitude.png
Even more interesting is that these data show us something else we expect — higher rates of warming in the upper troposphere and warming at the surface, but at a slightly lower rate. That is consistent convective and latent heat loss offsetting some of the radiative forcing at the surface up to the point that convection stalls and evaporated water condenses back to liquid (thereby releasing latent heat) in the upper troposphere.
I agree, and I’m telling you that current state of the art models take these things into account. I’m not going to say they’ve got it exactly right.
Matt G, thanks for the references. No time to read and respond right now, will check them out later today.
Good stuff, Brandon. I’m on the road, but will get back to you soon.
Brandon,
I don’t want to irritate you any further, but just because people can’t name a factor that could obviate CO2 doesn’t mean there isn’t one out there somewhere. Have you been following David Evans work? Anyway, I’m not talking about subbing in some other variables. The rap against
climate models is the overdependence on CO2. Is this because they are constrained that way or are they using something like principal component analysis? BTW, what does your model predict for future warming?
Doesn’t matter which Trenbert version of an energy budget model, because the diagram distorts the source and magnitude of DLWIR. As your spectra show, the magnitude near the surface will correspond approximately to 290K and the magnitude in the upper troposphere approximate corresponds to 220K. Because the up and down radiation will always be about the same, the magnitude must decrease as you go higher up. Depending on the solar input at the time and the humidity, at a certain elevation the whole of the radiation will have been absorbed. The energy flux from that point up will be totally due to convection or advection, with the exception of the atmospheric window radiation, until elevations high enough that the ULWIR can get through.
There is something strange about the weather balloon data. The 1998-2015 warming hasn’t been 0.2K/decade and certainly not more than 1979-2004, has it? In any case, I have to think about how that data supports your implication that CO2 warms the surface.
Brandon,
“Even more interesting is that these data show us something else we expect — higher rates of warming in the upper troposphere and warming at the surface, but at a slightly lower rate.”
You lost me there. Greater rates of warming when compared to what? Except for a couple points around 10km and one just above the surface, the 1998-2015 period warmed at a faster rate than the 1979-2004 period. That seems the reverse of what the global temperatures have been doing. What am I missing? And where did you get this data? I don’t understand why the periods aren’t 1970-1979; 1979-1998; and 1998-2015 or something more closely corresponding to discontinuities in the global temperature record.
Chic Bowdrie,
I agree that it’s a logical possibility. However, I consider it more rational to believe what the preponderance of available evidence says. Go back to the beginning of this thread where you asked me for evidence to support my belief. I think that’s a good standard to apply to your own beliefs as well.
No … I can’t say that I even recognize the name.
Ok. But I am saying that to convince me that CO2 isn’t “it”, I would need to see data for some other variable(s) which better explain observations … not just during the instrumental period, but in the paleo record as well. And to be honest, you would have to overturn a large amount of well-established radiative physics going all the way back to Planck … which is what Clark’s “flagrant violation of the 2nd law” argument is attempting to do.
Yes, I’m familiar with that argument. 🙂
No. PCA is a statistical technique for describing co-variance among multiple variables. GCM designers attempt to model using formulations based on physical processes.
Practically anything I want depending on what I assume for the future values of any/all of the parameters. 🙂 Assuming changes to CO2 only (all other parameters fixed at 2014 average) following the RCP8.5 scenario:
http://1.bp.blogspot.com/-0vRIwuR2fhU/VnsZ_3uPpbI/AAAAAAAAAhM/ADCDUFGI1IA/s1600/CMIP5%2BRCP8.5%2Bvs%2BObservations%2Bto%2B2100.png
You’ll note that I compute 4.06 K/2xCO2 for CMIP5 sensitivity to CO2 vs a range of 2.80-3.22 K/2xCO2 based on three observational temperature series. CMIP5 does run hot over the hindcast portion, but not that hot, so this is not a strictly fair comparison because RCP8.5 also includes increases to other forcings (methane, land-use changes, ice albedo feedback, etc.) which my simple multiple regression model does not take into account.
Sorry, no. Every “GHG” molecule is constantly absorbing and radiating LW in all directions no matter what its vertical or horizontal position.
I agree, the 1998-2015 interval in that plot is strange-looking. I redid the trends over the entire interval for which data are available (1958-2015) …
http://3.bp.blogspot.com/-rVss1ZRHvx4/VnsKTcQxreI/AAAAAAAAAg4/VQyhN-gPj6o/s1600/RATPAC-A%2BTemperature%2BTrends%2Bby%2BAltitude%2B1958-2015%2Bglobal%2Bvs%2Btropics.png
… but this time compared the entire globe to the tropics, with … shall I say, interesting … results.
Chic Bowdrie,
I apologize, those numbers should all be multiplied by ln(2) to get temperature change for a doubling of CO2. The revised plot with corrected figures is here:
http://3.bp.blogspot.com/-OOr2sUDv-FA/VnslRfcz7DI/AAAAAAAAAhg/0CwFb2XolaE/s1600/CMIP5%2BRCP8.5%2Bvs%2BObservations%2Bto%2B2100.png
Compared to other layers of the atmosphere, the upper troposphere shows a higher rate of warming.
Data:
http://www1.ncdc.noaa.gov/pub/data/ratpac/ratpac-a/RATPAC-A-annual-levels.txt
Description:
https://www.ncdc.noaa.gov/data-access/weather-balloon/radiosonde-atmospheric-temperature-products-accessing-climate/ratpac-a
Those intervals were based on a particular discussion I was having a few days back, based on the time periods the other person was talking about. When my previous post to you comes out of moderation, you will see that I redid the plot over the entire 1958-2015 interval covered by the data.
Matt G,
If we both accept this plot as a reasonable representation of reality …
http://www.climate4you.com/images/NOAA%20ESRL%20AtmospericSpecificHumidity%20GlobalMonthlyTempSince1948%20With37monthRunningAverage.gif
… then specific humidity shows a net increase in the atmosphere, showing the strongest correlation with temperature at the surface … which is where the water vapor is coming from.
We agree.
That doesn’t make any sense to me. Where are you getting this information?
I agree that the upper troposphere should be more sensitive to a change in forcing than the lower.
I don’t understand, please explain.
I think the more appropriate comparison is change in SW with change in LW.
Energy absorbed is still energy absorbed.
First link: Relative humidity dependence of aerosol optical properties and direct radiative forcing in the surface boundary layer at Xinken in Pearl River Delta of China: An observation based numerical study
So that one is radiative forcing of aerosols, which they are saying is dependent on RH. Very interesting, but not directly relevant to my main point
Second link: Sensitivity of aerosol optical thickness and aerosol direct radiative
effect to relative humidity
Ditto.
Third link: Relative humidity changes in a warmer climate
Mmm hmm. So, assuming fixed RH, if temperature increases specific humidity MUST increase. Read the next sentence: This sometimes gives the mistaken impression that models predict that relative humidity will remain invariant everywhere in warmer climates.
While all this is interesting stuff, it doesn’t address my main point about RH not being a good proxy for SH unless temperature is well constrained. If you have good data for temperature, then yes, one can easily make a reasonable estimate for SH based on RH.
Brandon,
“Ok. But I am saying that to convince me that CO2 isn’t “it”, I would need to see data for some other variable(s) which better explain observations … not just during the instrumental period, but in the paleo record as well.”
I’m not trying to convince you that CO2 isn’t it as much as I’m looking for better evidence that it is. I can now put a name to the evidence I’m looking for, a mechanistic model (Amy Hurford, https://theartofmodelling.wordpress.com/2012/02/19/mechanistic-models-what-is-the-value-of-understanding/https://theartofmodelling.wordpress.com/2012/02/19/mechanistic-models-what-is-the-value-of-understanding/):
“Mechanistic model: a hypothesized relationship between the variables in the data set where the nature of the relationship is specified in terms of the biological processes that are thought to have given rise to the data. The parameters in the mechanistic model all have biological definitions and so they can be measured independently of the data set referenced above.
Phenomenological/Statistical model: a hypothesized relationship between the variables in the data set, where the relationship seeks only to best describe the data.”
The radiative-conductive model that I would like to see would use radiation and humidity data over a fixed relatively short time period to verify how changes in water vapor affect temperature. Water vapor would serve as a proxy for CO2 which wouldn’t change in so short a time interval.
Your model is largely phenomenological. You claim you can predict anything with it depending on your assumptions of future parameter values. I don’t think that would be the case if temperatures don’t rise and CO2 does.
“And to be honest, you would have to overturn a large amount of well-established radiative physics going all the way back to Planck … which is what Clark’s “flagrant violation of the 2nd law” argument is attempting to do.”
There is no well-established physics that validates any claim to LWIR from elevations above 1km making it back to the surface. That is the point of Clark’s paper and why I’m convinced that eventually it will become accepted science that convection moves nearly all energy through the atmosphere except for that going through the window and that any change in CO2 from current levels will have negligible positive effect, if not negative.
I graphed the global RATPAC data you reference and didn’t get the same curve. My plot has surface warming at almost 0.2 K/decade. The upper troposphere also warms, but not as fast over the whole interval. However, that’s not saying much because the whole interval hides a lot of information. I broke it down to 1958-1976, 1977-1999, and 2000-2015. If I did it correctly, all three periods show close to uniform rates of warming at altitudes up to about 9 km. The early period cooled at about -0.25 K/decade and both the other periods at about 0.05 K/decade. I got much different profiles depending on what year I chose the break between the two later periods. I don’t see how any of these data can be used to argue that CO2 has any effect on the lower atmosphere profiles. The data does support a claim that more CO2 helps cool the upper atmospheres.
“Sorry, no. Every “GHG” molecule is constantly absorbing and radiating LW in all directions no matter what its vertical or horizontal position.”
I’m not saying otherwise. What I meant was that at a sufficiently high elevation in the lower troposhpere, all the ULWIR will have been absorbed within 1 km or less. Between that elevation and higher up, where the atmosphere is thin enough, the net radiation will be zero other than that going through the window. The only way for energy to move through those middle distances is by convection/advection.
I think that catches me up. Hope you had a nice Christmas.
I actually find it very difficult to believe that specific humidity has fallen globally in such a consistent manner and strongly question the veracity of this data, however, it raises additional questions if correct. If the more humid time periods are evaluated for total enthalpy versus drier times, what does that indicate in terms of actual change of heat content in the atmosphere. Global warming seems to preoccupy itself with temperature change only. Moisture content of the air can be a tremendous quantity of additional heat. I suppose it is theoretically possible that modern times are warmer but drier and heat content hasn’t changed- but like I said at the outset, I find it hard to believe as air and moisture have a great affinity.
john harmsworth,
The specific humidity plots posted in this thread are based on NCEP reanalysis data, which I wouldn’t normally expect to be taken as reality by most folks in this forum.
Going back to the NCEP reanalysis dataset for precipitable water …
http://www.esrl.noaa.gov/psd/cgi-bin/data/timeseries/timeseries.pl?ntype=1&var=Precipitable+Water&level=2000&lat1=90&lat2=-90&lon1=-180&lon2=180&iseas=0&mon1=0&mon2=0&iarea=1&typeout=1&Submit=Create+Timeseries
I get a linear trend of 5.97E-04 kg m^-2 yr^-1 over 1948-2015. Noting that the latent heat of vaporization of water is 2,264.76 kJ/kg:
… which is actually rather smaller than I would have expected.
Isn’t the main point that we are looking at less than 1 degree C increase since 1880?
The appearance of rising, flat, or cooling temperatures depends on which length of time you choose for your graph. But at the end of the day it has risen less than 1 degree.
Many of the early temperature readings have been adjusted and there is uncertainty as to their accuracy.
Measurement of temperature in terms of variation from an average rather than plotting the baseline temperature creates the illusion of significant increases and this has happened because of the newness of climate science and the lack of defined procedures.
Does a world average temperature have any real meaning at all?
This possible small increase in temperature has not resulted in any increase in natural disasters so why are we about to spend so much money on a misdirected effort to stop further warming?
BusterBrown@hotmail.com (December 19, 2015 at 10:19 pm)
(Note: “Buster Brown” is the latest fake screen name for ‘David Socrates’, ‘Brian G Valentine’, ‘Joel D. Jackson’, ‘beckleybud’, ‘Edward Richardson’, ‘H Grouse’, and about twenty others. The same person is also an identity thief who has stolen legitimate commenters’ names. Therefore, all the time and effort he spent on writing 300 comments under the fake “BusterBrown” name, many of them quite long, are wasted because I am deleting them wholesale. ~mod.)
Now then, that plot is very telling. Because whilst it may suggest that there is no slow down in the rate of warming these past 20 years, it also clearly demonstrates that there is no increase in the rate of warming between 1950 to date (that is the rate indicated by the blue line linear trend), and 1910 to 1945.
If anything the rate of warming between about 1910 to about 1945 is greater than the rate of warming as from 1950 to date.
That is particularly damning since the IPCC accepts that manmade CO2 did not cause or contribute towards the 1910 to 1940 episode. And we know that whilst there has been significant mandmade Co2 emissions post 1950, this has not led to an increase in the rate of global warming; . the rate between 1950 to date, being no more than the rate between ~1910 to ~1945. The fact that the rate has not increased is strong evidence to suggest that CO2 at current levels does nothing of significance.
Satellite data
Cherry picking 1997/98 El Nino? Why using the strong El Nino currently then? Hypocrite
Data from only after excluding the 1997/98 El Nino and the following La Nina.
RSS shows cooling not including the recent El Nino.
http://www.woodfortrees.org/plot/rss/from:2002/to:2014/plot/rss/from:2002/to:2014/trend
UAH shows very little warming not including the recent El Nino.
http://www.woodfortrees.org/plot/uah/from:2002/to:2014/plot/uah/from:2002/to:2014/trend
Surface
Oceans showed no warming until the deliberate tampering data change to show some extra warming with hadsst3gl. NOTE – even from 2001 when global temperatures had not recovered from the La Nina yet.
http://www.woodfortrees.org/plot/hadsst2gl/from:2001/plot/hadsst2gl/from:2001/trend
Yet still doesn’t show warming when the recent El Nino is excluded.
http://www.woodfortrees.org/plot/hadsst3gl/from:2001/to:2014/plot/hadsst3gl/from:2001/to:2014/trend
Hadcrut3gl before data tampering showed cooling.
http://www.woodfortrees.org/plot/hadcrut3gl/from:2002/to:2014/plot/hadcrut3gl/from:2002/to:2014/trend
Hadcrut4 even after tampering still shows cooling not including the recent El Nino.
http://www.woodfortrees.org/plot/hadcrut4gl/from:2002/to:2014/plot/hadcrut4gl/from:2002/to:2014/trend
Gistemp despite all the ongoing tampering, only shows a little warming without the recent El Nino.
http://www.woodfortrees.org/plot/gistemp/from:2002/to:2014/plot/gistemp/from:2002/to:2014/trend
Quite clearly the pause was seen and the strong El Nino now doesn’t change this FACT. All the surface data has had recent tampering to data to show more warming, either with changing different cherries or altering historic data using increasing estimates and less observations.
WFT shows 5.6 which is no longer valid. For 6.0beta4, use:
http://moyhu.blogspot.com.au/p/temperature-trend-viewer.html
Thanks,
Version 6.0beta4 shows slight cooling from between 2002 and 2014.
ScienceRules:
The “intense arguments”? I thought the science was settled.
And:
The physics of the Greenhouse Effect and the calculation of back radiation increases over the decades based on measured increases in atmospheric greenhouse gases should give us the answer needed to determine our state of alarm, or lack thereof, shouldn’t it?
Indeed it should. Can you produce empirical, testable measurements quantifying the fraction of man-made global warming? To one decimal point should be sufficient.
Of course, if you can produce such measurements, you will be the first — and on the short list for a Nobel Prize.
When the warmist can put forward a convincing case explaining why the rate of warming post 1950 to date is no greater than the rate of warming between ~1910 to ~1945, then they may be onto something.
But presently given that the warming episode ~1910 to ~1945, which even the IPCC accepts that CO2 did not play a role, is greater than the rate of warming between 1950 to date, it would appear that CO2 at current levels has no measurable impact.
As many have observed, the signal to CO2 cannot be detected using our best measuring devices and the data that results therefrom. It cannot be extracted from the noise of natural variability and the inherent error bounds of the equipment and the data set that it produces.
Verney makes big mistakes in his reply: That “the IPCC accepts CO2 did not play a role. {in the 1910-1945 warming}. No, the IPCC says that it’s very likely the warming from 1950 is man caused. That statement does not ‘accept that 1910-1945 warming is not man caused. A considerable difference.
And then Verney cites his own faulty conclusion as proof that CO2 has no measureable impact on warming in general.
I suggest he make his incredible case in a peer reviewed journal (other than Energy and the Environment).
ScienceRules,
Aorry, my fault. I was responding to your comment about ‘intense debate’ when I wrote ‘I thought the science was settled’.
Of course it’s not settled, in fact, there’s no convincing evidence that dangerous AGW exists. There are no measurements of AGW, as Richard Verney pointed out above. That makes the ‘man-made climate change’ scare no more than an opinion.
Forget “100% certainty”. There is zero percent certainty about AGW.
And a nice xMass thought for you. Mann might have been right all along, just for the wrong reasons. ?dl=0
?dl=0 ?dl=0
?dl=0
There are ‘hockey sticks’ in nature. You just have to decide of they match what you are looking for 🙂