By Larry Kummer, from the Fabius Maximus website
Summary: The coverage of this El Niño shows the fear and propaganda (used as clickbait by journalists) that clouds American’s vision of the world, keeping us ignorant. It also shows how the antidote lies within our reach. For the El Niño that means reading the NOAA’s well-written reports that accurately predicted this would be among the 3 strongest on record, contrary to the hysterical predictions by activists of a “monster” El Niño. It appears to have peaked, but the full impacts on the weather lie ahead.
The title of NOAA’s latest report about this El Niño gently mocks the hype about its effects (e.g., a “Godzilla El Niño”, destroyer of cites). The text debunks exaggerations about it being the greatest ever. So far this El Nino matches NOAA’s prediction that it would be among the three strongest on record (i.e., in the 65 years back to 1950).
This is another of NOAA’s well-written articles that put the El Niño into its proper historical context as a normal weather event. As usual these days, activists and their journalist fans often ignore what NOAA says (just as they do with the reports by the IPCC) in favor of exaggerations and wild predictions.
I recommend that you read the full essay. Here are some of the high points. Red emphasis added.
Excerpt: “December El Niño update: phenomenal cosmic powers!“
By Emily Becker, with comments by Anthony Barnston
At NOAA’s website, 10 December 2015
If you’ve been following the development of this El Niño, you may have heard in the media that sea surface temperatures in the central equatorial Pacific are at near-record highs. Are we seeing the most powerful El Niño ever?
… The important effects of El Niño on the U.S. and other regions are related to its average strength over the fall and winter, not how strong it is on any particular day or week. We do monitor the weekly and monthly changes in the sea surface temperature and the atmosphere to get a hint at where things are headed, but we’ll ultimately judge the strength of this El Niño by its average over the seasons.
… Right out of the gate, let’s talk about that November sea surface temperature in the Niño3.4 region. The ERSSTv4 data set shows that this November was 2.35°C warmer than the November average — tied with November 1997’s 2.33°C. (Yes, I know those numbers aren’t identical, but they’re within the statistical margin of error, which means as far as rankings are concerned, they’re tied.), This dataset has been carefully maintained to ensure that it is historically consistent, so it’s the best, most reliable one to use to compare 2015 to 1997 (or any other year.)
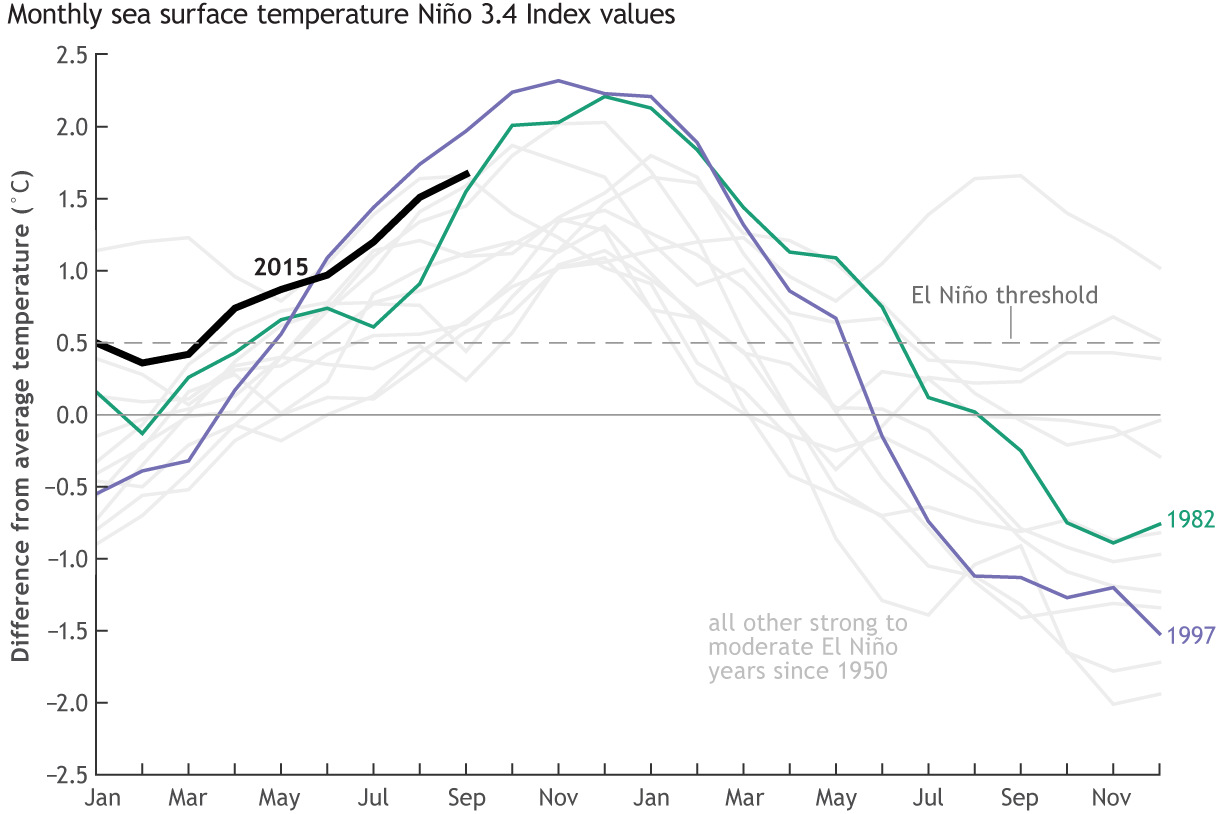
The Niño3.4 ERSSTv4 for September–November is 2.04°C, second to 1997’s 2.18°C. Since we’re looking at this El Niño very likely placing in the top three (with 1997-98 and 1982-83), let’s compare some of the other components of the system right now. I’m going to focus on 1997-98, since by most assessments that’s the strongest El Niño in our short, 1950-present record.

Monthly sea surface temperature in the Niño 3.4 region of the tropical Pacific compared to the long-term average for all moderate-to-strong El Niño years since 1950, showing how 2015 (black line) compares to other strong events.
… If you average the September – November low-level winds over the central Pacific, you get about 8 miles per hour, trailing 1982 (1.5 mph) and 1997 (-2.5 mph) pretty substantially (positive numbers means the wind is blowing from east to west, and negative means west to east). The average wind speed of the trade winds this time of year is about 16 miles per hour.
Another measurement of the atmospheric response to El Niño’s warmer waters is the Equatorial Southern Oscillation: November 2015 is currently third, behind 1997 and 1982. While we’ve seen consistently more clouds than normal over the tropical Pacific this year (evidence of increased convection due to the warm water), this response has also been less than it was in 1997 over the central to eastern Pacific.
There is a lot we don’t understand about how El Niño works, and exactly why the atmospheric response is weaker in 2015 than it was in 1997, despite very similar east-central Pacific temperatures, is going to be a hot research topic going forward. …
A look under the surface
… We monitor the ocean heat content in the upper 300 meters (about 1000 feet) of the equatorial Pacific. 2015 has had a large, consistently above-average ocean heat content since this El Niño began in March, as you can see below. However, a side-by-side comparison with 1997 reveals there is still not as much heat fueling this El Niño as there was 18 years ago. …

From Australia’s Bureau of Meteorology.
What does it all mean?
Every El Niño event is different, and even if there are some strong similarities between this El Niño and another, we’d be really surprised if everything lined up exactly the same. By most measures, this is one of the top three strongest El Niños since 1950, and there’s still a chance it could record the highest Oceanic Niño Index (the three-month-mean sea surface temperature anomaly in the Niño3.4 region, our primary ENSO metric). But ocean temperatures are just one way to measure ENSO, which can be tracked in many ways.
While the warmer-than-average ocean waters are likely reaching their peak about now, they will remain a huge source of warmth for the next several months to drive the main impacts on temperature and rain/snow over North America, which typically follow the peak. The main impacts season is December–March, so we’re just at the very beginning of finding out what this El Niño event will bring to the U.S. There’s no doubt that El Niño 2015-2016, which has already shown its power around the world, will have a significant effect on the U.S. winter.
Comments by Anthony Barnston
It’s going to be a very interesting “horse race” among the 3 events. I agree that the 1997-98 will probably retain its number one rank. As for beating 1982-83 or not, it’s going to be close! In terms of the ERSSTv4 SST data, we are currently running just a bit ahead of 1982-83, but in 1982-83 the SST slightly increased more for December, and stayed nearly as warm in January (using just 1-month average ERSSTv4) than it might do this December and January. So I wouldn’t want to bet the farm either way, as fun as it might seem.
… While most of the US has its strongest climate effects from ENSO during winter (December through mid-March), the West Coast’s impact tends to happen just a bit later in the season, even if the El Nino itself starts winding down. So I’m not at all surprised that so far, the pattern of dryer in the Pacific Northwest and wetter in southern California has not yet appeared in earnest. It’s possible that before that pattern does form, BOTH the southwest and northwest could receive alternating periods of pretty strong storm system passages.
—————————- End Excerpt —————————-
For more about this see Bob Tisdale’s December ENSO Update – “Shouldn’t Be Long Now Until the El Niño Starts to Decay”.
OT a bit http://notrickszone.com/2015/12/16/november-2015-solar-report-remains-the-weakest-since-dalton-minimum-of-early-1800s/#sthash.XuKVjgrQ.dpbs
In November our sun was once again below normal in activity. The 84th month since the current solar cycle started in December 2008 saw a solar sunspot number (SSN) of 63.2, which was 72% of what is the mean for month 84 into a cycle since observations began in 1755. – See more at: http://notrickszone.com/2015/12/16/november-2015-solar-report-remains-the-weakest-since-dalton-minimum-of-early-1800s/#.dpuf
CCR, that’s true about the sun wrt SSNs. But the interesting thing about solar activity is that while SSN, F10.7cm flux, and TSI (total solar irradiance) definitely track each other well statistically over solar cycle lengths, they don’t usually do that over a single solar rotation of ~27 days very much. ?w=700
TSI is the “heat” indice, the one that matters to warming/cooling. SORCE TSI reached it’s lowest value of 1357.0186 while SSNs were near 300 in late Oct 2003 because the sunspot area (SSA) indice was very high, 5690. The same phenomenon occurred last year, April 17 2014, when NOAA’s SSN was 296, but the SSA only reached 1660, and TSI at 1360.7994. TSI is a function on SSA more than SSN (well known). The Venus transit of 2012 also affected TSI.
http://spot.colorado.edu/%7Ekoppg/TSI/TSI_Oct2003.png
http://spot.colorado.edu/%7Ekoppg/TSI/2012_Venus_Transit.jpg
The reason I bring this up is SSN has been nothing special lately, not very high, but TSI has been on the rise since mid-September on a smoothed basis, and had fairly high peaks during each of the last 2 solar rotations:
http://lasp.colorado.edu/data/sorce/total_solar_irradiance_plots/images/tim_level3_tsi_24hour_3month_640x480.png
TSI was higher for most of October and November, compared to September, driving Nov/Dec temps upward:
Sep, 1361.1063
Oct, 1361.3139
Nov, 1361.3688
I’ve determined using simple statistics that there is a long-term SST warming/cooling threshold of 120 sfu/day in F10.7cm flux, statistically equivalent to TSI of 1361.24. With that in mind looking at the last 90 days of TSI above we can see we received a large dose of warming heat over that level, driving Nino area WWV up, seen here, especially around the mid-Nov TSI spike:
The second solar cycle #24 peak in Feb 2015 of high TSI kicked off the El Nino and brought barely ‘record’ high temperatures during the year. Even though it’s the lowest SSN cycle in 100 years, SC24 was (and is) still potent.
In order, as of last week, annual average TSI from http://lasp.colorado.edu/lisird/tss/sorce_tsi_24hr.csv
2015, 1361.4487
2014, 1361.3966
2013, 1361.3587
2012, 1361.2413
2011, 1361.0752
2003, 1361.0262
2004, 1360.9192
2010, 1360.8027
2005, 1360.7518
2006, 1360.6735
2007, 1360.5710
2009, 1360.5565
2008, 1360.5382
The heat has been building up for four years and is now set to drop off, and temps will follow, as they did during the last solar minimum years.
SORCE TSI over it’s duration had a maximum value of 1362.2561, and an average of 1360.6138, albeit during the lowest solar cycle in 100 years. The max TSI was on Feb 6 this year, when the SSN was 71, and SSA was 440.
Just be careful about using those SSNs! They don’t tell the whole story. Temperatures are bounded by TSI level and duration.
I’m presently putting a presentation together to show how TSI spikes drive evaporation, high water vapor plumes, and extreme events. For those who want to investigate the extreme event angle, see http://www.hail-reports.com/ and enter in the date range a week centered on each solar rotation TSI peak over the past 90 days and see for yourself the power of high TSI and how that extra warmth drives tornado and hail activity.
Heh, heh (smiling): CC Reader and Bob Weber, you can hide in this NOAA thread…, but Dr. Svalgaard will find you….
There’s nothing to worry about Janice.
Nice link, thanks!, and a very interesting comment.
Does the TSI correlate with Coronal holes? Since the plasma from a coronal hole is hotter and faster (and therefore more energetic), do these hoes have correlative effects on temperature? As in, the more of them we get, the hotter it is?
“Does the TSI correlate with Coronal holes? Since the plasma from a coronal hole is hotter and faster (and therefore more energetic), do these hoes have correlative effects on temperature? As in, the more of them we get, the hotter it is?”
http://www.spaceweatherlive.com/en/help/what-is-a-coronal-hole
“When a coronal hole is positioned near the centre of the Earth-facing solar disk, these hot gasses flow to Earth at a higher speed than the regular solar wind and cause geomagnetic disturbances on Earth with enhanced auroral activity on high latitudes. Depending on the size and location of the coronal hole on the disk, more or less auroral activity can be expected.”
Geomagnetic disturbances have been shown to affect global temperatures, but it’s not so much about how many geomagnetic disturbances there are as much as it is how big they are and whether or not they are positioned on the Sun at a point where they can affect Earth. At least as far as I know.
I will look into that Phil. Obviously the solar wind temperature varies with coronal hole activity (speed) here:
http://services.swpc.noaa.gov/images/ace-mag-swepam-3-day.gif
but thus far I don’t think those temps affect Earthly temps much – I know others think so but I don’t think they’ve made their case. The thermosphere is hotter than the lower atmosphere, and more tenuous, so how can solar wind heat jump past the lower atmosphere into the ocean undetected?
At this point I’m keeping some areas of my research out of sight until I can reach a verifiable determination; but I do think there is a connection between coronal holes, active regions, and the IMF that ultimately affects TSI. A literature search would be revealing, and Dr. Svalgaard may have something to say about all that.
Thank you goldminor.
Do I gather that you’re expecting a decrease in global temperatures now that we are seeing a “solar minimum”? I don’t want to misunderstand what you are saying. MY question is in reference to this quote (and is perhaps taken out of context):
“The heat has been building up for four years and is now set to drop off, and temps will follow, as they did during the last solar minimum years.”
https://www.washingtonpost.com/news/capital-weather-gang/wp/2015/10/29/the-driest-place-on-earth-is-covered-in-pink-flowers-after-a-crazy-year-of-rain/
Why were all those seeds sitting in the desert? Because they evolved over millions of years and adapted to a recurring natural event. “record’ is a dramatic term. That term may be true since us puny humans began writing it down. The analogy is looking at a square centimeter of beach and finding the biggest rock. Lift your head and look at the mountain behind you (to AGW cultists not anyone here.).
The world did not begin yesterday.
Given NOAA’s hysteria and habit of modifying records to meet there needs, it is easy to ignore anything that comes out of NOAA. It is nice, however, to see they are admitting that Bob Tisdale has been right all along.
This dataset has been carefully maintained to ensure that it is historically consistent,….
Unlike the temperature, rainfall, etc datasets that have “adjusted” to the point of being useless
They will have to do a lot more before they regain my respect.
Chris
And then there is this…if our atmospheric blanket decreases in thickness how will we be affected?
https://tallbloke.wordpress.com/2015/12/16/nasa-finds-boundary-between-earths-ionosphere-and-space-is-shrinking/
Observations made by NASA instruments onboard an Air Force satellite have shown that the boundary between the Earth’s upper atmosphere and space has moved to extraordinarily low altitudes.
These observations were made by the Coupled Ion Neutral Dynamics Investigation (CINDI) instrument suite, which was launched aboard the U.S. Air Force’s Communication/Navigation Outage Forecast System (C/NOFS) satellite on April 16, 2008
So global warming is causing the atmosphere to be lost to space? .. it’s worse than I thought.
Colder atmosphere doesn’t extend so far into space.
Presumably, this should be an indicator that global temperatures are declining rather than increasing?
I figure if the atmosphere is a thinner layer (like comparing a bedsheet with a blanket), then the cold of space is closer to us.
The Congregation of the Church Of Anthropogenic Planetary Destruction is not listening or reading.
For them, The Earth was created by El Nino and is being destroyed by Man.
Antarctica and Greenland are already gone! The research we still “see” them is the work of Satan. Only the true believers have the vision to see the truth.
Ha ha 😉
Members of the CCAPD – repent and come to the Cold Side … La Nina, the mother of polar vortexes is going to return…
Is this the same NOAA where Tom Karl works? Or is it the other NOAA?
Mark asks, “Is this the same NOAA…?” Since NOAA has manifestly shown it will lie to serve its noble crusade to save us all, the question begged is, why tell the truth here? Why not run with the scary “worst El Nino ever” version? Haven’t they run this through the messaging dep’t.? I think the answer must be that they have no way to tie a “man-cause” to a more powerful natural event. If they could they would, need not even be plausible (when has that ever held them back?). Since it’s an entirely natural phenomenon, it must be diminished or people might get the idea humans can’t change the climate (for better or worse).
I think the time line wrt reputation comes into play with keeping them honest.
For example a weather forecaster has zero reputational incentive to weave the climate change narative into his her 10 day forecast. Manipulating the weather computer model to include a CO2
scam. effect then nature in short order would make a fool of them.An ENSO forecaster-tracker is similar in that the timelines involved are well within operational memory of people and institutions. Blown Reputations would matter. Bad forecasts and data manipulations would be exposed as multiple international actors are tracking ENSO-related metrics. Knowingly making deceptive claims and manipulated forecasts would get exposed by nature in a few months and the reputations of the manipulators would be destroyed.
Climate change scammers though are invoking things like starting by 2050, 2100, a hundred years from now, etc claims on everything from temperatures, SLR, ocean acidification effects, etc. They’ll all be retired and/or dead by those timelines, so making politically convenient forecasts buys them grant funding, press coverage, and political favors. Similarly, historical temp records adulterations similarly go on because of the shortness of human memories. We know the 30’s was likley warmer than the present decade, but human adult operational memory of that period gone to a large extent. People do however remember the Global Cooling scare of the 70’s, and it still gives NASA and NOAA fits in “adjusting it out”.
For example a weather forecaster has zero reputational incentive to weave the climate change narative into his her 10 day forecast….
==========
I wish they would…..considering they are wrong more than they are right, they would have debunked global warming years ago
RE: So far this El Nino matches NOAA’s prediction that it would be among the three strongest on record (i.e., in the 65 years back to 1950).
Therein lies another issue. We have a real lack of actual history of ENSO and even more importantly, almost zero history regarding both constructive and destructive interference between PDO and ENSO. Currently I’m betting that PDO is going to whack the current El Nino badly and it won’t even eclipse the ’82 one in actual impact. Thus far all we’ve seen have been very cold northern storms which, while having some moisture in them, have mostly dumped on the PacNW. I also note that the relict “V” of Negative PDO seems to still be superimposed on NH Pacific. That would really screw up any atmospheric rivers that attempt to set up.
And Colorado and Kansas and Missouri
I have lived on the “Wet Coast” of BC Canada and in the interior of BC Canada for 44 years. These storms, (although not regular like a clock) for us? They are nothing new. Many people have mentioned this before , the instant flow of info these days has a huge part to do with the hype about AGW. The fact that in case of a rising river, under passes on highways and so on, people take pictures with their cell phones and show huge devastation like flooded homes and stranded cars etc. but this has nothing to do with AGW. it has everything to do where humans build infrastructure in the most vulnerable locations.
I am trying to say that 200 years ago info could take months to get around. now it is overwhelming and not vetted as to what is actually happening.
What’s up with NOAA using SST in only the Nino 3.4 region as an indicator? The anomalous warmth was significantly greater in 1997-1998 than now in all of the Nino regions combined. I think a more suitable index is of SST in Nino 3.4 combined with the portion of Nino 3 that is outside 3.4.
Yes, indeed, Mr. Klipstein.
Bob Tisdale here: http://wattsupwiththat.com/2015/06/25/the-201415-el-nino-was-not-focused-on-the-region-used-by-noaa-for-their-oceanic-nino-index/
Donald,
“What’s up with NOAA using SST in only the Nino 3.4 region as an indicator?”
They don’t. This is an article for the public, and they wisely keep it simple. For those that want more detail they say…
“Which CAN be tracked in many ways,” but, according to Bob Tisdale,here,
http://wattsupwiththat.com/2015/06/25/the-201415-el-nino-was-not-focused-on-the-region-used-by-noaa-for-their-oceanic-nino-index/
NOAA used the NINO 3.4 region.
I’m glad that someone has finally uttered the phrase…
‘every El Nino is different’.
Indeed.
And here’s the thing. It seems clear now that this El Nino is going to be strong, but probably not going to beat 97-98 and yet the temperatures being recorded (land and ocean) by all the land based agencies is unquestionably higher than anything since modern records began. So you either believe they are making the numbers up, or you accept we are still warming. Seems to me, if you leave the El Ninos in, we are warming…. if you take them out, we are warming. In fact, it is only the satellite data left now that offers any hope for a pause. One wonders how long before they too succumb.
That’s why they do balloon measurements…
Buster,
Yeah, about the time that you admit that the surface temp data sets have issues.
In the only area of the world that has a pristine surface data set, (USCRN) the trends of the satellite data are a very close match to the trends in the surface data.
ClimDiv, with balloons etc included is also very close in trend to the satellite data.
This quite large area sample against un-tainted surface data shows that the data extraction routines of the satellite temperature series are pretty much spot on.
dbstealey
So tell me DB…. Does UAH adjust their data? I think you will find they do. In fact I think you will be hard pushed to find a data set that has any reputation of any kind that is not adjusted in some way for bias. But there’s a challenge for you.
Simon,
You still understand.
Satellite data and most other data is adjusted. But each adjustment can be traced back step by step to the original raw data, so it can be verified. NOAA doesn’t. They just “adjust” it — and their ‘adjustments’ almost universally end up showing greater warming.
So your “challenge” comes from ignorance of the facts. Here’s a challenge for you: Explain why NOAA’s ‘adjustments’ always show more warming. And post their step-by-step adjustments from the raw data. Include the raw data while you’re at it; how it was collected, and the instrument tolerances.
NASA “adjusts” past temps, too, and they always show more warming:
Simon says: “the land based agencies (temperatures) is unquestionably higher than anything since modern records began.”
Given what we know of Urban Heat Islands, historical adjustments, station changes, homogenization processes, and site integrity issues, I can hardly believe anyone could say “unquestionably” higher with a straight face!
Hi Dave in Canmore (I had a chuckle when I saw that), Simon should read this artcle:http://wattsupwiththat.com/2015/12/17/press-release-agu15-the-quality-of-temperature-station-siting-matters-for-temperature-trends/
asybot
Mmmmm…. except NOAA is only one of many land based data set that shows a significant degree of warming of late. And the whole UHI has been debunked sometime ago. The stations not in the cities show the same level of warming so it’s all a bit of a non event.
Simon,

NOAA “adjusts” the data (which then makes it non-data). And it always goes in the direction of showing more global warming, never less:
But you’re such a religious true believer in human culpability that not even evidence that strong can make a dent in your belief. Not even NASA doing the same thing:
dbstealey
So tell me DB…. Does UAH adjust their data? I think you will find they do. In fact I think you will be hard pushed to find a data set that has any reputation of any kind that is not adjusted in some way for bias. But there’s a challenge for you.
Simon,
You don’t understand as usual.
Satellite data and most other data is adjusted. But each adjustment can be traced back step by step to the original raw data, so it can be verified. NOAA doesn’t. They just “adjust” it — and their ‘adjustments’ almost universally end up showing greater warming.
So your “challenge” comes from ignorance of the facts. Here’s a challenge for you: Explain why NOAA’s ‘adjustments’ always show more warming. And post their step-by-step adjustments from the raw data. Include the raw data while you’re at it; how it was collected, and the instrument tolerances.
DB
“Satellite data and most other data is adjusted. But each adjustment can be traced back step by step to the original raw data, so it can be verified.”
Really? Tell me where I can find the specifics of how UAH version 6 is being adjusted? I think you will find Roy is not releasing this despite repeated requests for him to do so. But Roy is on your side isn’t he so you are all good with that. As long as it fits your religious fanatical belief.
Don’t underestimate the effect on NOAA of the “investigation” by Congress. This unexpected storm for scientists trims the alarm by a good measure. It’s a bit late to be good boys but it can’t hurt. With the “Pause” brutally tomkarleized out of existence, I guess an investigation had to be expected. The disappearing of the biggest elephant in the control room was just too over the top.
Rep. Lamar Smith said he has whistle blowers inside NOAA. And the first batch of subpoenaed emails just got turned over. The attempted obstruction of Congress was too legally clear for the Obama administration to ignore, although they did try for a while. This all leads the inference that the whistle blowers said there is ‘good stuff’ in the emails, and Smith’s committee knows what it will eventually find.
ristivan: Except they only sent emails from “not the scientists”. Wow.
And people, look over at the ENSO meter (on the side bar of my browser). It peaked a while back. Wait and see I guess.
Gary,
I suspect the recent spat of polling that showed the general public is not particularly concerned about “climate change”, after many years of hype and hoopla in the propaganda systems, has also had a sobering effect on “embedded” scientists who were under the impression that keeping the disaster flick style tension up in every press release was part of their job description.
Gary,
I agree with you. Rep. Lamar Smith has placed a lot of missing heat on NOAA and I hope he holds their feet to the fire. But the Obama Administration held off any response until the end of the Paris Circus and a budget suitable to him for climate giveaways. O needs his legacy, as we all know.
Anyway, it was nice to see something reasonable come from NOAA for a change.
Based on the graph of Nino 3.4 Region SST from 1950 to present, the three strongest El Ninos prior to the current one were each followed by La Ninas which lasted longer than the preceding El Nino. If that historical precedent is followed, the forthcoming La Nina will cool global temperatures, as Joe Bastardi has been predicting.
http://wattsupwiththat.com/reference-pages/climatic-phenomena-pages/enso/
https://www.longpaddock.qld.gov.au/seasonalclimateoutlook/southernoscillationindex/30daysoivalues/
Other than a brief period in early Dec the SOI has been barely in negative territory.
“(e.g., a “Godzilla El Niño”, destroyer of cites)”
Mystery solved – that’s hat happened to them! All those cites to that “hysteria” that never make it to your articles.
Nick,
“Mystery solved – that’s hat happened to them!”
Nice to hear from you. As usual, your comment makes no sense whatsoever.
“All those cites to that “hysteria” that never make it to your articles.”
I did give examples in the earlier posts. However, I don’t write for you folks in the Gamma Quadrant. Back on Earth people who read the news have seen the many references to a “Godzilla El Nino” and “monster El Nino”, etc. You can too, using Google.
https://www.google.com/search?q=%22godzilla+el+nino%22&ie=utf-8&oe=utf-8#q=%22godzilla+el+nino%22&tbs=qdr:y
https://www.google.com/search?q=%22godzilla+el+nino%22&ie=utf-8&oe=utf-8#q=%22monster+el+nino%22&tbs=qdr:y
Bill Patzert of NASA named “Godzilla”
Lee,
Yes. He uses the term in what I assume is a fun manner to describe El Ninos that come every decade or so — hardly a disaster (like a 100-year flood), let alone like a monster that destroys cities.
As he says, the “Godzilla” label for an El Nino has escaped its creator. now it is being used by activists and journalists to promote fear in the public. There is little documentation for the damage caused by previous El Ninos, and even less comparing that to average losses for weather (without which a total for losses in an El Nino year tell us nothing).
If Glubble worming meens mor hot chix, I am all 4 it, hell yeah!
The decline in solar irradiance would predict a decrease in heating of the tropical ocean. In contrast rising CO2 would predict increased heating. Is NOAA’s observation “a side-by-side comparison with 1997 reveals there is still not as much heat fueling this El Niño as there was 18 years ago” evidence of natural ocean heating and a contradiction of hypothesized CO2 warming?
Not when a decline in solar irradiance increases the frequency of weak trade winds.
“Monthly sea surface temperature in the Niño 3.4 region of the tropical Pacific compared to the long-term average for all moderate-to-strong El Niño years since 1950 …”.
============================
It’s ridiculous to describe 65 years of climate data as “long-term”.
This gives a better perspective of the short-term history of La Niña and El Niño episodes which shows no apparent trend (if such a short-term record is of any value anyway):
http://www.climate4you.com/images/NOAA%20CPC%20OceanicNinoIndexMonthly1979%20With37monthRunningAverage.gif
O/T but Anthony’s presentation made the news –
http://cnsnews.com/news/article/barbara-hollingsworth/study-surface-temps-lower-weather-stations-minimal-artificial
Way to go Anthony! I can only imagine how they will attempt to SPIN actual evidence that covers 30 years.
Good, well done.
Really.
Mr. Kummer, you are FAR too generous to NOAA (as an organization).
April, 2015
(Source: http://wattsupwiththat.com/2015/04/10/noaa-enso-model-now-forecasting-a-supercalifragilistic-el-nino-for-201516-season/ )
July, 2015
(Source: http://wattsupwiththat.com/2015/07/23/the-2015-el-nino-is-shaping-up-to-be-a-big-one/ )
September, 2015
(Source: http://wattsupwiththat.com/2015/09/10/forecast-approximately-95-chance-that-el-nino-will-continue-through-northern-hemisphere-winter-2015-16/ )
This is only an unimpressive attempt to save face. They had to run away from the “El Nino Alerts/Advisories” (and the like) propaganda because, as others noted, they found that, after all, they could not adjust and twist enough to plausibly make human CO2 its cause.
{all bolding above, mine}
Would it be fair to say that we simply don’t understand the physics of El Niño? There is talk about Walker Circulation, which Wikipedia defines as a conceptual model of the air flow in the tropics in the lower atmosphere. It seems to handle a two-dimensional atmosphere well – the air is never allowed to leave the equator. Do we have enough data to confirm that Walker Circulation is real, and not just a mathematical abstraction?
Janice,
I do not understand your point. Those forecasts look correct so far. NOAA defines an El Nino as an ONI of 0.5°C+,and a “strong El Niño” as a peak ONI greater than or equal to 1.5°C.
https://www.climate.gov/news-features/blogs/enso/united-states-el-ni%C3%B1o-impacts-0
The ONI was 1.5°C in July-Sept, 1.8°C in Aug-Oct, and 2.0°C in Sept – Nov. The models forecast that the El Nino will continue through Spring 2016, or even into early summer.
See page 22.
http://www.cpc.ncep.noaa.gov/products/analysis_monitoring/lanina/enso_evolution-status-fcsts-web.pdf
O Defender of NOAA (a.k.a. FM),
My point was that their pronouncements (based on their model projections), accompanied by their “El Nino alert” type language, were inaccurate, at times grossly (see April, for instance — discussed in Bob Tisdale post above), and designed, in my opinion, to create a false impression about El Nino’s cause (and to use the over-blown projections to push the “extreme weather” AGW meme). That is, when NOAA could not find a way to possibly tie human CO2 to the El Nino effects (nor use the relatively mild effects that ended up materializing for “extreme weather”), they climbed back down from “alert” status, etc… .
Bob Tisdale calls them out repeatedly for not using the correct data/data analysis.
My point may be mistaken. I will leave that discussion for those better informed than I.
I have a feeling, nevertheless…, that you have an emotional loyalty (why?) to NOAA which is bathing that known-corrupt agency in a rosy glow.
Janice
Janice,
The fact remains that the quotes you gave from NOAA have proved correct so far. I don’t understand why you believe otherwise. I don’t believe Bob has written anything that casts doubt on these cites.
“I have a feeling, nevertheless…, that you have an emotional loyalty (why?) to NOAA which is bathing that known-corrupt agency in a rosy glow.”
I suggest you that not try psychoanalysis based on these kinds of essays.
Having honest reporting from NOAA is a new development. It must be that NOAA sees El Nino as a non-CO2 related event and therefore a good chance to appear honest and independent and scientific. Given the need to advance the CO2 lie, NOAA will again in the future, lie to serve its noble crusade to the Earth. This report is a one-off event. Since El Nino is increasingly seen as an entirely natural phenomenon, it can safely be dealt with honestly, and spin can be reserved for giving people the idea that humans can change the climate using their CO2 knob.
Can anyone describe in clear semi-quantitative language the origin of the energy that shows up as higher temperatures in the Nino regions?
Is there a repeating phenomenon around tropical Indonesia that concentrates energy in some manner?
When you use the flicker images in this essay it is easy to get an impression that some deeper waters are increasing in both size and temperature. Is this so? If it is how do deeper waters heat without shallow waters showing a heat flow path?
Thank you. Geoff.
The energy comes from the Sun. It gets stored in the “Pacific Warm Pool.” Then moves east.
https://www.climate.gov/news-features/featured-images/slow-slosh-warm-water-across-pacific-hints-el-ni%C3%B1o-brewing
Where, and how intense is the warm “Blob” as this El Nino progresses?
“… If you average the September – November low-level winds over the central Pacific, you get about 8 miles per hour, trailing 1982 (1.5 mph) and 1997 (-2.5 mph) pretty substantially (positive numbers means the wind is blowing from east to west, and negative means west to east). The average wind speed of the trade winds this time of year is about 16 miles per hour.”
The above is a very substantive statement.
To answer the question ” Why don’t we listen?”
Because they’ve lost all credibility & we cant trust what they say.
As my old granny used to say ‘You can trust a thief but never trust a liar’
“As my old granny used to say ‘You can trust a thief but never trust a liar’”
Your granny sounds nuts….why would anyone trust a thief either?
Because you know exactly where you are with a thief …but never with a liar. A bit obvious really !!
“Because you know exactly where you are with a thief …but never with a liar. A bit obvious really !!”
Is it? You stated that your granny said- “You can trust a thief but never trust a liar’”
First, logic would indicate that if I call someone a thief, it is because I know they stole something prior. And I don’t trust people who steal.
Second, if I call someone a liar, it is because I know they’ve lied in the past. And I don’t trust people who lie.
According to your granny, you CAN trust a thief, and my question was why would any rational person trust either one?
2 things…
1) Has anyone noticed how La Nina-like this current El Nino is so far with regards to the Pacific coastal weather patterns? So far, the vast majority of the rain/snow has been focused from Northern California north to Washington/BC, Canada. Central/Southern California has stayed fairly dry.
2) “…While we’ve seen consistently more clouds than normal over the tropical Pacific this year (evidence of increased convection due to the warm water)”.
This, IMO, is incorrect – warm water is not the main driving force with tropical convection. Upper-air dynamics is (ref. http://www.cpc.ncep.noaa.gov/products/analysis_monitoring/lanina/enso_evolution-status-fcsts-web.ppt). With typical El Nino patterns, yes, the equatorial water east of the Date-Line does warm and, yes, there is an increase in convection…*BUT* (notice on pp.13 of the presentation in the link provided), there are anomalous anti-cyclones evident in the subtropics of both hemispheres straddling the enhanced convection and between the anti-cyclones is…divergent air, which causes mass lifting of the atmosphere, which weakens the Tradewind Inversion which allows convection to fire both day & night. Now, in contrast, observe the suppressed convection over Indonesia, the Philippines, and Papua New Guinea. The water temperatures are still very warm but there is suppressed convection…why? According to this author as well as Willis Eschenbach & others, when the atmosphere & water warms up, there is more convection…period. However, (pp.13 again), convection over the West pacific is suppressed because there is upper-level convergence, which causes sinking air, which strengthens the Tradewind Inversion, which caps the atmosphere, which suppresses deep convection. In these situations, the water cannot get hot enough to overcome the atmospheric cap/inversion and become absolutely unstable to release deep convection.
This is similar dynamics associated with MJO (Madden-Julian Oscillation) events as well as other atmospheric events which regulate (enhance/suppress) tropical deep convection…even if the water is ‘warm enough’
The blob outside the west coast of the US has now gone. Only a little residue is left outside Baja California. http://www.ospo.noaa.gov/data/sst/anomaly/2015/anomnight.12.17.2015.gif.
I’m soon going to present evidence how ENSO is primarily driven by lunar tidal and electromagnetic solar influence.
Per your link to noaa above, note the cold blob in the NW Pacific. A couple/few years ago there was a warm blob in the same position that rotated clockwise around to Alaska and down the CA coast. I will be watching for the same rotation of this cold blob over the next couple/few years.
Nino 3.4 peaked in mid-November and will slowly decline from here.
And all we have is November temperatures to witness so far. The lag means the temperature impacts are still coming later, January February and March 2016.
Some of the measures such as those from the NCEP branch of the NOAA have this as the second largest El Nino on record.
http://www.cpc.ncep.noaa.gov/data/indices/sstoi.indices
http://www.cpc.ncep.noaa.gov/data/indices/wksst8110.for
http://s21.postimg.org/gbr75yjfb/Nino_3_4_lag3_UAH_RSS_temps_Nov2015.png
Just did major posting on Weatherbell. OLR is much more like 1957,1965,1987,2006,1986 blend then the aforementioned ones. This should lead to a huge mid and late winter flip like those years over the southern and eastern US with the NE a battle ground between what will turn into a hyper southern storm track and high pressures to the north. Unlike 82/83 the soi is no where near as strong. The centering of the warm water in relative terms of OLR is FURTHER WEST and this is crucial. In addition Scripps is spot on about the reverse coming so a La Nina develops. JAMSTEC ( which also says this winter will flip Dramatically, Also develops la nina by fall.
Major strat warm should evolve Jan 10-20, and if we are right, people will see the idea.
What to the models say about the evolution of this El Nino?
The mid-December IRI-CPC Plume of models predicts that it has or is peaking (Nino3.4 SST for Dec-Jan below Nov’s), fading fast but will remain a “strong El Nino” through Spring 2016.
http://iri.columbia.edu/wp-content/uploads/2015/12/figure42.gif
As Joe mentions, we might get a La Nina in 2016. They give odds of 24% for a La Nino in June-August, 37% for July – Sept, and 46% for August – October.
http://iri.columbia.edu/our-expertise/climate/forecasts/enso/current/
I forgot to add: model predictions for ENSO are unreliable this far out. They get much better in early summer — once past the “Spring barrier”.
I thought the folks at NOAA WERE the activists.
vlparker,
That’s why posts like this are valuable. Showing what NOAA actually says cuts through the urban legends. Only for those who wish to see clearly, of course.
Dear,
I think I’ve found the thing you were looking for, just take a look here http://reussirauxusa.blog/gain.php?5958
My Best, gerjaison