(Featured Image Borrowed from The Guardian)
Guest post by David Middleton,
Eric Worrall’s recent essay on the Prime Minister of Tuvalu and his reticence to providing some evidence that his island nation is being inundated by rising sea level inspired me to devise a simple test to see if an island is sinking, vanishing or being washed away:
Planimeter a recent map of the island and compare it to an older map of the island.
Since the USGS has a large historical inventory of topographic maps, this should be relatively easy for any islands in these United States.
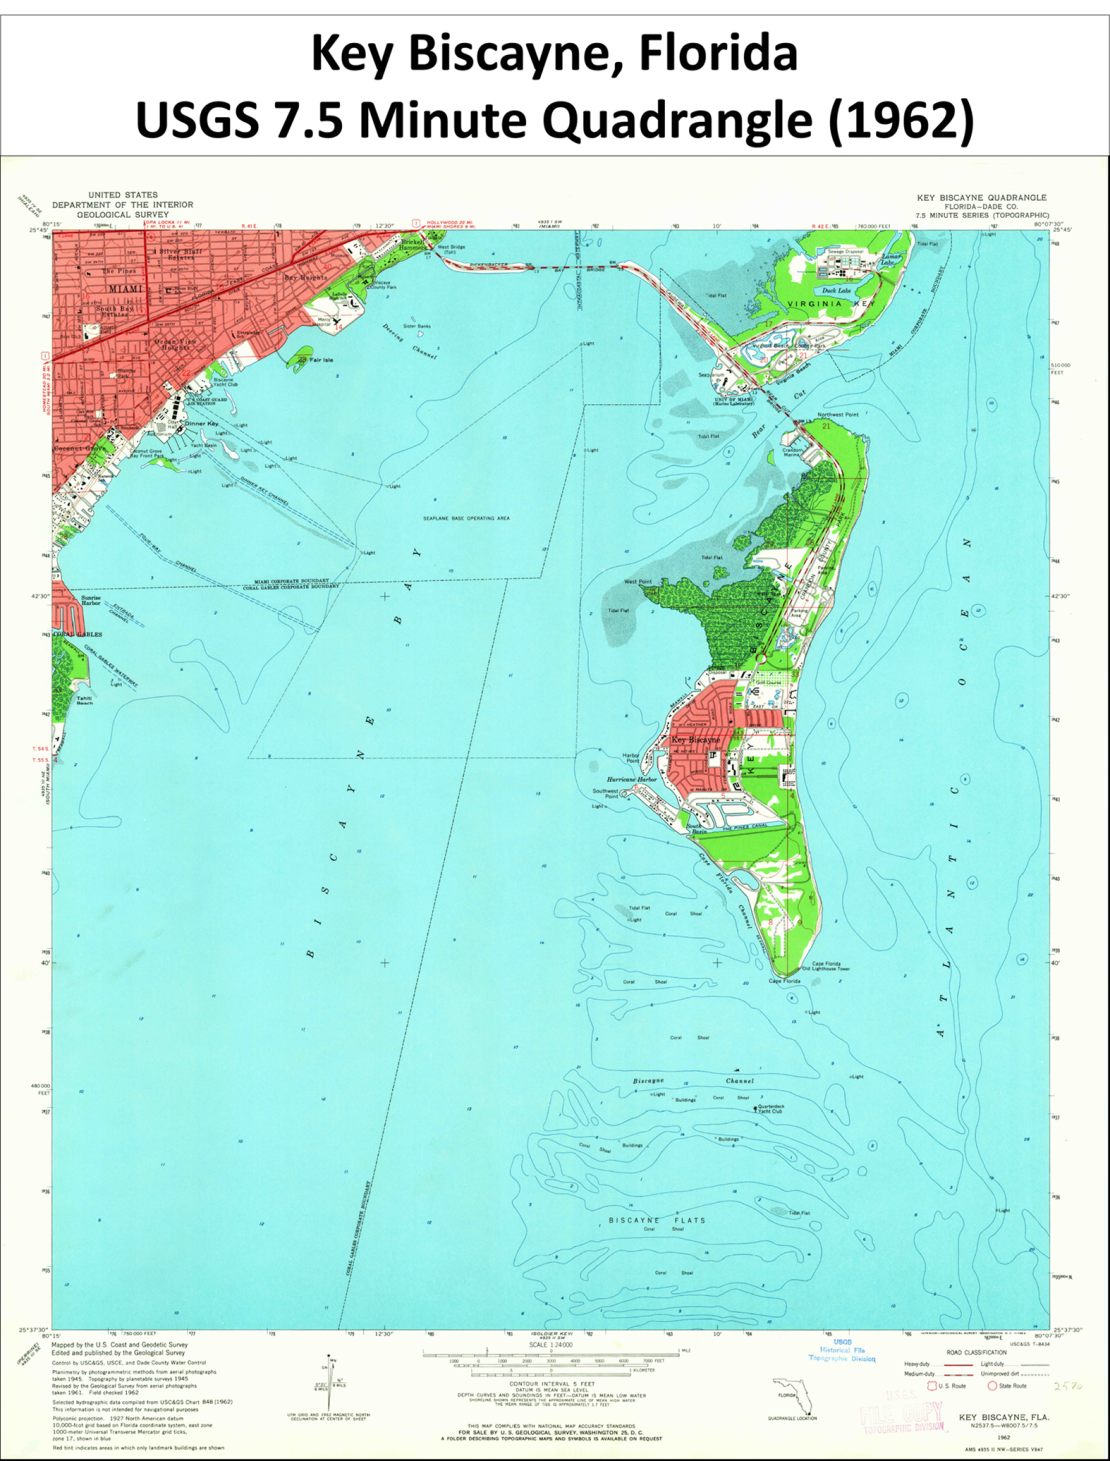
For my test case, I chose Key Biscayne, Florida. It’s just south of the perennially sinking Miami Beach, has a maximum elevation of about 5′, is relatively small and the USGS had several vintages of 7.5 minute quadrangles available.
Then…
And Now…
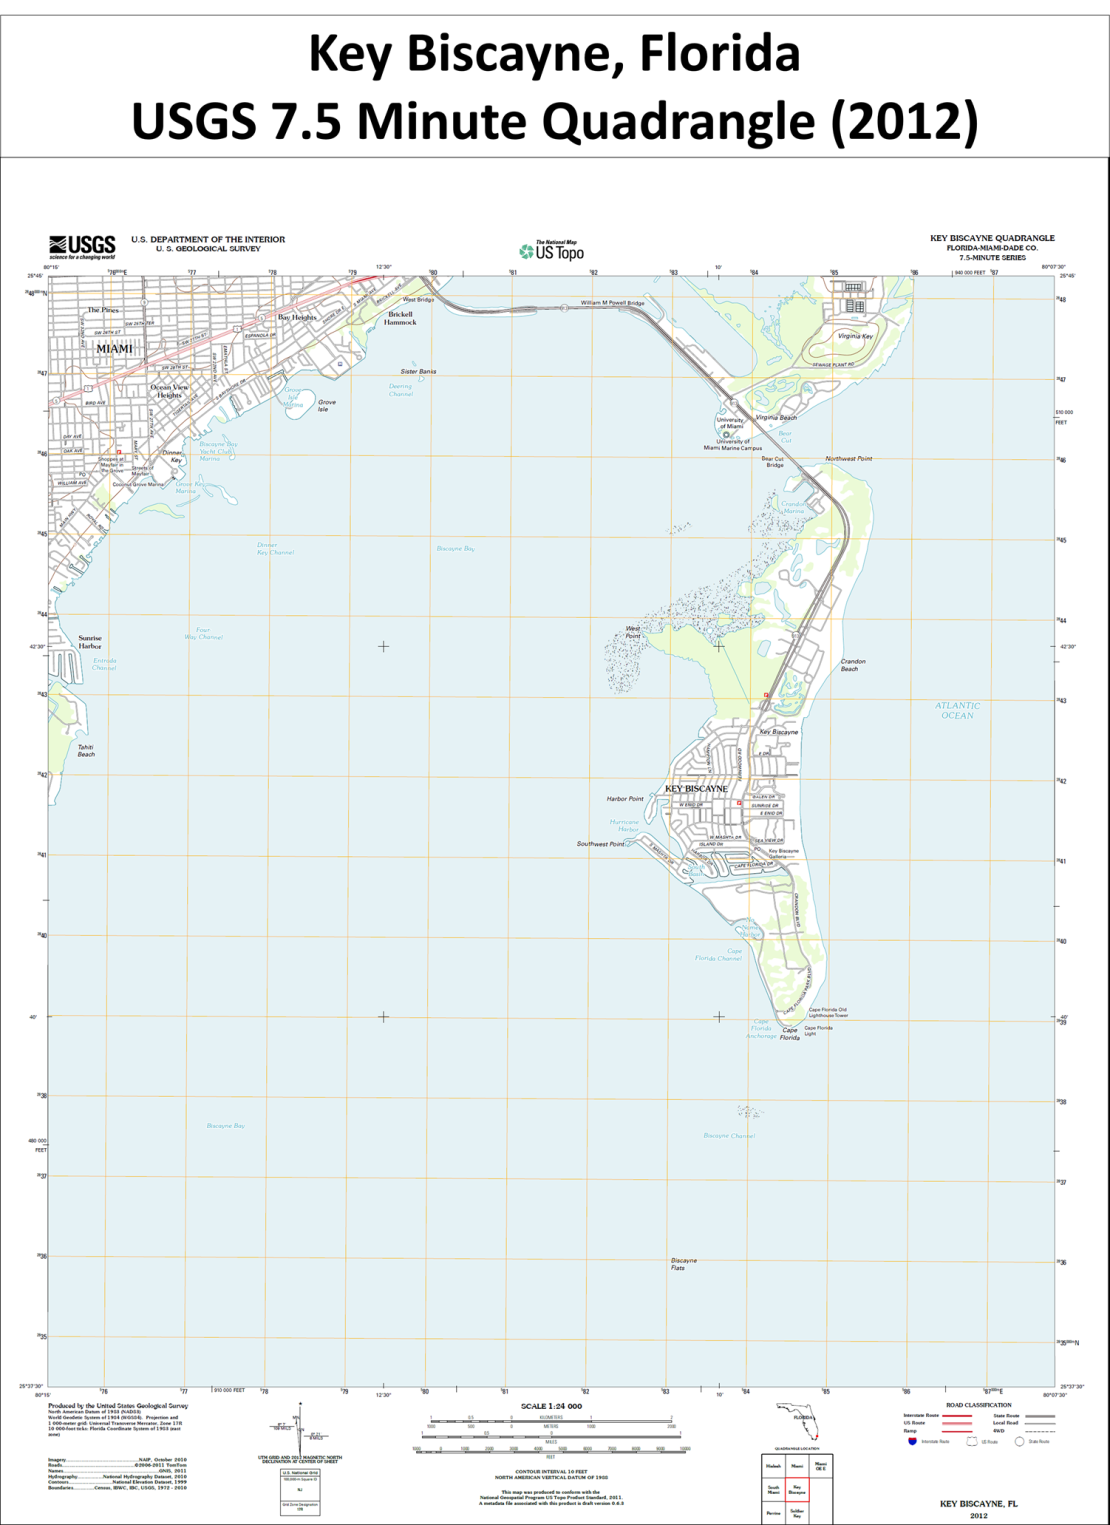
I planimetered the coast lines of each map and found no significant changes over the 51 years from 1962-2012…

I guess I’m going to have to deny climate change or at least doubt the climate, because I can’t see any effect of sea level rise on this puny, flat, little island. (/sarc).
This is just weather, not climate. /sarc
So did the bonefish flats areas increase or decrease; that’s what is important to the survival of Key Biscayne.
g
However non-hurricane Sandy hitting at high tide – and the 10mm/year subsidence of New Orleans + dyke failure leading to flooding, etc etc – that was climate change and not just a series of unfortunate events.
Katrina?
Rising sea levels: climate change. No rising sea level: climate change. More tornados :climate change. Less tornadoes : climate change. Severe hurricanes : climate change. No hurricanes : climate change. Hot weather :climate change. Cold weathet: climate change.
Aint that the truth… good one
People who live at sea level like me, know that this sea level rising is total B.S.
I am living next to the Mediterranean Sea and my sail boat is moored in the same place since 1975, 40 years until today continuously. I couldn’t notice any level rise though that region is said to be subject to a very weak tectonic sinking.
Check Portsmouth, Gosport, Exeter, Emsworth, Poole etc etc all coastal towns and have been for hundreds of years seemingly unaffected by sea level rise.
Wow, the same boat? I can imagine the ceaseless maintenance necessary to keep a boat seaworthy for 40 years.
I live just down the road from Brighton, the Green capital of the UK.
There are people there who walk their dogs on the beach every morning. And *still* believe the sea level has risen about twenty feet!
In Finland we have Opposite, Land is rising 3-9mm/y (Sea level decreasing) and in some places shore line is moving 1-10meters/y https://en.wikipedia.org/wiki/Post-glacial_rebound First writter notes are from 14th Century in Nordic when citisens of a town argument that Sea shore has moved too far away and the port and town needs to be rebuild.
I agree; I live in Queensland Australia and I live on the edge of the water….no rise in 15 years! And it hasen’t got any warmer……
That method is no good, Mikey can’t “adjust” the data !! LOL
Bulletin: The USGS has just announced a project to adjust it’s historical coastline maps to reflect the fact that early surveying methods systematically underestimated the land area at mean sea level. Modern GPS methods show that the the baselines use in optical surveying methods tend to systematically overestimate sea area relative to land since the baselines avoid terminating in the sea. This tends to hide any recent increases in sea area relative to land. The adjusted maps will be used to assess the threat of sea-level rise due to climate change.
Sounds reasonable to me.
(/sarc)
Actually, the USGS established a project long ago for “determining the physical response of the coastline to sea-level rise.” There’s bound to be promotion and pay in this raise for the scientist who shows evidence of a sea-level rise — they could already see that in 2001.
http://pubs.usgs.gov/dds/dds68/htmldocs/project.htm
Obviously they haven’t found anything that passes the smell test over the past fifteen years or you would have read about it by now.
Topographic engineering variables a side, point well taken.
British Admiralty Nautical Charts from the Age of Discovery are drawn to the nearest 1 foot of depth, and show no significant change over 200-300 years. While modern versions of these charts do have datum corrections for GPS (WGS-84), if sea level rise is real, why do the charts not have a datum correction for global sea level rise?
Ferd, here is also one from 1775.
Looking at the effect sea levels have had over the past 230 years, what has been the result.
See – An Accurate Map of North and South Carolina With Their Indian Frontiers, Shewing in a distinct manner all the Mountains, Rivers, Swamps, Marshes, Bays, Creeks, Harbours, Sandbanks and Soundings on the Coasts, ’1775′
– http://dc.lib.unc.edu/cdm4/item_viewer.php?CISOROOT=/ncmaps&CISOPTR=125&CISOBOX=1&REC=15
from NC Map
Compare with a side by side google map and most of the features are still there. A side note that 1775 was at the end of the Little Ice Age and a whole lot of ice was on shore and not in the ocean. – See Glacier Bay NP.
Glacier Bay was first surveyed in detail in 1794 by a team from the H.M.S. Discovery, captained by George Vancouver. At the time the survey produced showed a mere indentation in the shoreline. That massive glacier was more than 4,000 feet thick in places, up to 20 miles wide, and extended more than 100 miles to the St. Elias mountain range
That’s 1 watershed valley.
Now we know where the sea level rise in tuvalu comes from: The water flows from Florida to tuvalu.
LOL!
David, I also live out of a rock in the ocean…..our sea level has not changed in over 50 years that I’ve lived here.
Well, David, if you’re going to ‘cherry pick’ data like that you’ll be able to prove anything! But, this method is obviously invalid as it hasn’t applied any of the required adjustments or smoothings and flies in the face of consensus, so therefore it’s wrong. My model shows that the island in fact disappeared beneath the sea in 2012. Now, stop bothering me with these ‘facts’ as you call them and let’s get on with proper science. You’ll never get a grant if you persist in this attempt to confuse the issue!
But were the actual maps peer reviewed?
Yes, piers were viewed and viewed again and again
“In 1841, a mark was cut into the rocks of the Isle of the Dead at Port Arthur, in an attempt to record the height of the sea in the area, and to provide a benchmark for future studies of the movements of the Earth’s crust, relative to sea-level. It was made at the instigation of Captain Sir James Clark Ross, with the support of Thomas Lempriere (Deputy Assistant Commissary General at the Port Arthur penal settlement). Records indicate Lempriere had studied the tidal levels in the area for several years before the mark was made.
“The mark at Port Arthur is among the earliest benchmarks in the world against which to scientifically measure changes in sea-level. Until recently, a lack of actual data from the time prevented a proper understanding of the site. However, some of the original data has been found, and together with some recent detailed monitoring at Port Arthur, a clearer understanding of sea-level changes in the area are now possible. It also aids in the understanding of global sea-level changes, as there are very few good long-term benchmarks in the southern hemisphere.”
http://soer.justice.tas.gov.au/2003/casestudy/4/
It is a good read.
How many islands are being eroded away ? http://www.brisbanetimes.com.au/content/dam/images/g/i/5/e/6/c/image.related.articleLeadwide.620×349.gi5cz2.png/1441608379050.jpg
A more energized atmosphere = more intensity and not necessarily more frequent storms.
Erosion of sand banks has entirely different effects than erosion on coral reefs. Sand banks are continuously formed and reformed by ocean action. New ones are formed, old ones are washed away or built up. The Outer Banks off the North Carolina coast are a good example. Much of Florida is mostly sand banks barely 10m above sea level formed by wind, waves, and currents.
Coral reefs on the other hand are a fairly complete biome produced by coral growing in the ocean. They regularly grow if the sea level rises, as long as it doesn’t suddenly flood them with meters of water. Faster growing corals do best in water less than ~18m.
The picture of the Gold Coast in southeast Australia is simply storm erosion. Stupid place the build hundreds of hotels and houses, especially right on the ocean’s edge.
Google “Hog Island”.
It was located on the south shore of Long Island, NY, and washed away during a hurricane around the late 1800’s-early 1900’s.
As for sea level rise. think about how much land has been filled in. why do you think engineers had to build a “bathtub” when constructing the twin towers of the original World Trade Center; Battery Park City was “created” using the material excavated for the WTC; thinkabout the artificial islands created in Dubai, and those the Chinese are building or expanding in the Pacific.
Hey, the water’s going to go somewhere!
Oh wow….now that you have pointed out this, expect the USGS to start re-arranging the map data to fit the IPCC scenarios…..
David: Your timing on this is excellent. Grist has something on the 3rd world lining up for reparations for damage that have not happened. I quote you here: https://ukuleledave.wordpress.com/2015/12/08/the-third-world-wants-money-to-offset-the-cost-of-going-green-and/
??? So global warming is causing the waters around Key Biscayne to evaporate faster uncovering more island? OMG, its so much worse than we thought! 🙂
O, the humidity!
That’s pretty funny!
clever
My god, you’re right! Look at Battery Park! And San Francisco! We must stop this urgent threat from runaway evaporation!
The size of the projected seal level rise is very small compared to lateral movement along tectonic plates. Los Angeles has moved north by about 25 centimeters since I have been living here.
If LA becomes more like northern California, would that be bad? 😎
anything that makes L.A. closer to NorCal is bad… ; sarc>
There has been no change in the number or mass of seals there.
Feel any cooler, now that you’ve moved up North?
Perhaps they meant sea level weirding – not change as such… 🙂
Obviously the 24 acres gained must have come from Tuvalu.
(Maybe all the genuine “Climate Refugees” should be settled there? Plenty of room left for the next 100 years worth.)
Maybe the island tipped over and we are now seeing the underside.
See also work by Paul Kench et al discussed here http://www.telegraph.co.uk/news/worldnews/australiaandthepacific/tuvalu/7799503/Pacific-islands-growing-not-shrinking-due-to-climate-change.html
Area of Pacific islands not changing much, if anything increasing.
Today, I received my copy of the National Geographic “Rising Seas” edition from Sept 2013.
Anyone interested in the promulgated of alarmist propaganda should buy themselves a copy.
So far, all I can see is – Hurricane Sandy = 14ft storm surge, 19billion damages, 43 dead + alrming photos.
Then some text containing “A profoundly altered planet is what our fossil-fuel-driven civilization is creating, a planet where Sandy-scale flooding will become more common”.
Then, a nice big hockey stick showing no sea level rise historically followed by the current glacial isostatic adjusted ramp – AND THEN – 6.6 feet by 2100 according to NOAA scary as hell scenario.
THEN – “How the uiltimate sea-vele catastrophe would reshape our world”.
A nice big fold-out feature showing the shape of the world’s coastline IF ALL THE ICE MELTED.
And to think that I used to read this shit – with no access to genuine scientific information.
Apologies; “alarming” not “alrming” and “sea level” not “sea vele” – I really should remember to proof read.
And it should be “Bu11$hit” not just “shit”.
Yeah, sorry for all the typos.
I was typing in the dark in order to simulate the effects of living without fossil-fuel-driven civilization.
Of course, I also turned the screen off!!
Like Scientific American, Nat Geo used to be a pretty good read with little or no propagada. What a waste .
yes indeed–last three issues–cover story on the new pope, an entire issue dedicated to the CAGW cult, and cover story on Virgin Mary. Could the recent sell out to Rupert Murdock have anything to do with it’s seemingly terminal demise???
Here, here! I’m waiting for the Scientific American article on Justin Beiber. Any month now.
For this reason I cancelled my Nat Geo subscription years ago and no longer buy SciAm.
Both are just part of the “Ministry of Information” that Orwell warned us about.
The American Association for the Advancement of Socialism is rapidly degrading. Ever more space given over to climate stories and now protesting the Congressional Inquiry. http://www.aaas.org/news/aaas-leads-coalition-protest-climate-science-inquiry
Tropical Storm Sandy, plus two other storms.
They of course conveniently forgot about the Long Island Hurricane in 1938 which killed over 700 people, produced a 17ft storm surge and wreaked havoc across the NE from New Jersey to Maine devastating the area. Experts estimate that a similar Hurricane would cause damage in excess of $39 billion today.
Yeah, well thank crap that our leaders are finally about to strike an agreement to spend all our money on stopping climate change and extreme weather.
We’ve all quite frankly put up with dangerous weather extremes for far too long. It’s about time that somebody did something. 🙂
(sarc)
I hate to disappoint – but this “Novel Way to Test the Impact of Rising Sea Levels” is not very novel.
Here is basically the same exercise being conducted in relation to coral atolls.
“We analyzed six time slices of shoreline position over the past 118 yr at 29 islands of Funafuti Atoll to determine their physical response to recent sea-level rise. Despite the magnitude of this rise, no islands have been lost, the majority have enlarged, and there has been a 7.3% increase in net island area over the past century”
From this blog: http://wattsupwiththat.com/2015/05/12/told-ya-so-new-paper-proves-that-coral-atolls-keep-up-with-sea-level-rise/
In fact, it seems to be the simplest and most obvious way to test the effect of sea level rise. I was under the impression that the “Novel” description was thoroughly tongue in cheek.
Well, I count 24 additional acres (2012-1962 acreage), perhaps the fish swimming in the streets are responsible ???
Cheers, KevinK
I just tried to find a current satellite photo of the Sierra Nevada Mountains in Caliornia.Can’t find anything more recent than 2004. WTF??
“Onshore winds will pile up water onto a coastline, and offshore winds will do the opposite. Changes in atmospheric pressure also produce changes in sea level (lower atmospheric pressure leading to higher sea levels), so the effect of a severe storm (very low atmospheric pressure) with strong onshore winds can lead to very high coastal sea levels (Storm Surges) with, at times, severe coastal damage, especially when the large waves produced by the strong winds are added!”
http://www.cmar.csiro.au/sealevel/sl_drives_short.html
A electrified atmosphere is in constant contact with ground state.
Understanding Man Made Climate Change — A simple demonstration of the scientific principle which you can do at home and use to educate your children.
If you take pot of water and put it on the stove it will boil. If you take the same pot of water and put it in the freezer it will turn to ice. That is a demonstration of man made climate change.
It really is that simple.
Eugene WR Gallun
Key Biscayne seems to have grown over 50 years from 2179 to 2203 acres, probably due to building activity of some sort. In Sydney the Tide Gauge carved into the sandstone rock at Lady MacQuarie’s Chair is still showing the same level of water as in 1810. That’s 205 years. At Lempriere at Port Arthur, Tasmania, there is a tide gauge from 1841, telling the same story. The sea rise is all in the computer models..
I think the “growth” is more likely a function of my manual dexterity.
And the heat will expand the water, but freezing will expand it more. Go figure!
Those two little charts side by side totally destroy the whole global warming hoax
They may not “destroy” it… but they clearly demonstrate the insignificance of 3 mm/yr changes in sea level.
Islands can grow larger during sea level rise, y’know. Becoming larger around is no guarantee they are also becoming taller. But enough about my first wife. Seriously, it is entirely possible for an island grow in diameter while heading under the waves.
The island would have to have started out with some “height” to do that or have an up- current source of sediment. Key Biscayne doesn’t fit either of these scenarios. There are no interior uplands from which to source sedimentary accretion. Barrier islands can rapidly move and shape-shift with longshore currents. While USACE can work miracles in retaining beaches and shorelines, these efforts are generally easy to spot in topographic map revisions.
3 mm/yr * 51 yr = 153 mm ~ 6 inches. This should be detectable on an island with a maximum elevation of 5′.
Sandy island?
Sand moves if not protected.
Key Biscayne is sediment-starved due to USACE efforts in the Miami area…
http://serc.carleton.edu/integrate/workshops/risk_resilience/case/82140.html
6 inches of sea level rise should be even more detectable on Key Biscayne than barrier islands to the north.
Reply to oppti ==> Sand subject to wave action moves if not protected is true…but it does not always move off the beach. Wave action brings sand to the beach — that’s how it got there in the first place (in many cases).
I lived near a little beach in Sousa, Dominican Republic for a year, and the beach would have sand added or subtracted from the beach up to five feet in thickness by a single storm, Some days we would have to leap down a five foot cliff off the rocks to the beach — other days just step onto the sand (from the same rocks!). This beach was very unusual in this sense, the speed of removal and replacement of sand, but this is true of all beaches in a general sense.
The sea brings sand and the sea takes away sand. The sea moves sand up and down a beach as well. The sea builds barrier islands and removes them again. The sea fills in inlets along the Carolina shores and cuts barrier islands in pieces, destroying Federal hiways, and creating new inlets.
For Pacific tropical reef-based islands, the creatures of the reef make, create, coral sand which is washed up and accumulates on the island. Waves move it around. Changes to the shoreline can have unpredictable results. Changes to the reef (killing parrot fish) can doom an island altogether. Pumping the fresh water lens out from under a tropical island can sink it.
This is not an easy subject.
Tide gauge data for thousands of sites throughout the world are shown in http://www.psmsl.org/. Some go back over 100 years. Funafuti B is the Tuvulu tide gauge. It goes back only to about 1990, but shows no change since then.
While a tidal record going back only 25 years is not very long, there should still be a 3″ change if the 3mm/y number is correct. 3″ shouldn’t be that hard to detect, even with waves and tides etc. Is Tuvulu a coral island?
The cost of a basket of raw materials has been used in the past to gauge their availability and whether peak supply has been reached. Could a similar method be used to gauge sea level rise? If sea level is rising, then wouldn’t prices of property, currently next to the shore, start to fall in relation to property further inland?
The price of “oceanfront properating in Arizona” would be an excellent metric… /sarc
In the swedish village Ratan, there is a sea level mark hewn in the rock, dated 1741.
That mark is now 2 m above the sea, 7 feet.
That’s due to Post Glacial Rebound.
They argue in millimeters while claiming meters.
Can you overlay the maps and do a blink comparison?
This post is cute, but hardly scientific in any way. Key Biscayne, Florida, is not an example of low-lying tropical Pacific reef-and-sand based islands. Not created or maintained by the same physical mechanisms. It is, in many places, protected by concrete seawalls. Beaches have been “replenished” .
The quesstimate Absolute Sea Level Rise (averaged, worldwide) for the last 100 years is about 8 inches. Daily tides at Key Biscayne run about just under 2.5 feet above MLLW (Mean low low water). Absolute Sea Level Rise does not appear in all places in the local Relative Sea Level Rise. (see my essays on the situation at the Battery in NYC, here and here.)
The important issue is Relative Sea Level Rise — where, at what altitude, does the sea meet the land here?
NOAA CORS (Continously operating gps recorders) shows the land mass in the area of the Florida Keys steady over the short term, no long term data is available. So we don’t know if the land itself is rising or falling (relative to the center of the Earth). NOAA Tides and Currents has Relative Sea Level rise varying from 0-3 Key West) to 3-6 (Marathon Key) back to 0-3 mm/yr (Miami) in the region. This shows that even locally, over ythe length of the Florida Keys, Relative Sea Level trends are variable by 100%, twice in some areas (Marathon) than at either end, and may be essentially ZERO. Note that “zero” to “zero to 3 mm” is a huge divide. 1.7/1.8 mm/year makes up the 8 inches per century figure, so it is a huge (“all of it” huge) difference.
We don’t know how much, if any, the sea is rising relative to the land at Key Biscayne. It has not been measured. We don’t know of whatever sea level rise we see there is caused by the sea coming up or the land going down, or a combination of land up or down, sea up or down.
The land area of Key Biscayne, however, has been demonstrated not to have changed since 1962 — though we are aware of massive human influence on that metric — influence to maintain it at its present size.
Bottom Line: The thing measured “Land Area of Key Biscayne” does not inform us of the facts regarding if Key Biscayne as “an island is sinking, vanishing or being washed away” due to Sea Level Rise. It only informs us of short-term historic land area of Key Biscayne == there is no discernible change in land area in the period 1962-2012 from any cause.
Current sea level rise does not register as eustatic sea level rise in geologic terms. You allude to this with questions of subsidence/uplift. If regional sea levels around the planet are dependent on regional subsidence/uplift and a universal eustatic sea level is not apparent everywhere, then there is said to be no global sea level change.
The oft mentioned 8 inches in 100 years has been masked by sedimentation and there is no major increased accommodation space or landward transgression of coast line with onlap of depositional sequences that I’m aware of. It’s been this way since the Younger Dryas ended, despite humans decreasing sediment supplies to coastlines.
If a measurable eustatic sea level rise were occurring then it wouldn’t matter how many truck loads of sand you brought in, the island would become inundated. Since 1962, if eustatic sea level rise were occurring like it was at the end of the last glacial period, sea level would have risen by 10 meters.
http://www.bioone.org/doi/abs/10.2112/JCOASTRES-D-12-00172.1?journalCode=coas
http://gradworks.umi.com/35/91/3591094.html
http://www.sciencedirect.com/science/article/pii/S0025322715000031
Reply to RWTurner ==> The recent long-term rise, as the single digit mm/yr rates (<5) is not likely to inundate tropical reef-based islands, unless they sink themselves through shoreline destructive shoreline modification, fresh water removal and reef destruction, or a combination of the three.
ONLY if water currently stored on land as ice is massively, rapidly returned to the seas will we see islands disappear due to sea level rise. The physics of doing that in the next century or two ?? Not likely.
Bottom of the Bottom Line…
“It only informs us of short-term historic land area of Key Biscayne == there is no discernible change in land area (or shape) in the period 1962-2012 from any cause.”
Therefore the Impact of Rising Sea Levels is not significant enough to be discernible on Key Biscayne.
Thanks, Kip Hansen. As a resident of Key Biscayne (since 1971), I care about this.
From Station 8723170: Miami Beach, FL (Mean Sea Level Trends, 1931 to 1981):
“The mean sea level trend is 2.39 millimeters/year with a 95% confidence interval of +/- 0.43 mm/yr based on monthly mean sea level data from 1931 to 1981 which is equivalent to a change of 0.78 feet in 100 years.” (0.3 meters = 1 foot)
See http://tidesandcurrents.noaa.gov/sltrends/sltrends_station.shtml?stnid=8723170
From Station 8724580: Key West, FL (Mean Sea Level Trends, since 1913):
“The mean sea level trend is 2.33 millimeters/year with a 95% confidence interval of +/- 0.15 mm/yr based on monthly mean sea level data from 1913 to 2014 which is equivalent to a change of 0.77 feet in 100 years.” (0.3 meters = 1 foot)
See http://tidesandcurrents.noaa.gov/sltrends/sltrends_station.shtml?stnid=8724580
We have a ground level garage that has always partially flooded something less than 1/2 inch during king tides.
Reply to Andres Valencia ==> As there is no official tide station at Key Biscayne, you are left to hoping that the measurements north and south of you can be “averaged”. Did you notice that this WOULD NOT WORK for Marathon? Marathon on the Tides and Currents map shows a 3-6 mm/yr rise. That is HIGHER than the rise south and north.
Anyway, it is not surprising that your garage floods at King Tide — given the average altitude of the island.
As David Middleton has pointed out, despite whatever relative sea level rise has been experienced, Key Biscayne hasn’t been inundated, or lost any land area, at least in the last 50 years.
As Kip Hansen pointed out, with a maximum elevation of ~5′ ASL, flooding during seasonal high tides isn’t surprising.
A photo of King Tide flooding in Miami was the sum total of AGW “evidence” presented by Sen. Bill Nelson at the recent Senate hearing.
The porous nature of the limestone bedrock coupled with a few inches of sea level rise certainly could accentuate King Tide flooding a bit.
Anyway, all this talk of territory lost to the waves is irrelevant.
Because, according to the pull-out feature in my copy of National Geographic we should all be able to move to a new verdant paradise on the shores of Antarctica and Greenland.
At least it looks green on the map that they provide of “if all the ice melted”.
Next month’s issue may like to consider the scenario – “if the ocean boiled off into space”.
Then, “if squid had evolved to become the dominant intelligent species on planet earth”.
What the crap are they going to come up with next?!!
Here it is. Here is the internet version.
What shall we call the newly formed rolling plains of East Antartica?
I would suggest that a good name would be, “la la land”.
The idiots at Nat Geo have already moved there. It seems:
http://ngm.nationalgeographic.com/2013/09/rising-seas/if-ice-melted-map
Although the text overlays my home here in Southern California, I don’t discern much change in the coastline. So, I guess we’re safe. My wife and I have been going down to the same beach regularly for the last 20 or so years. The high-tide line hasn’t moved, that I can tell, relative to the beach-front buildings. But my eyes probably wouldn’t discern a 20 – 30 mm rise in sea level over that time period.
Reply to Retired Engineer Jim ==> See the NOAA Tides and Currents Sea Level Trends map. For the most part, relative sea level in Southern California is trending, rising, at 0-3 mm/yr. Except for a single spot in Northern California, rising at 3-6 mm/yr, the NW US coast is either rising slightly at 0-3 mm/yr or SINKING at -6 to 0 mm/yr.
Now, just the fact that Relative Sea Level Rise (the important measure of sea level) can be negative in an entire US coastal region (NW US Pacific Coast) , while the worldwide Absolute Average Sea Level is rising (8 inches over the last century, and at 3.2 mm/yr the last decade or two) has to tell us something.
I think it tells us that there is a lot we don’t understand about sea levels and implications of this long slow rise over the last centuries.
“… a lot we don’t know …” covers it I believe. Taking historic geology we ran into the problem of how to interpret coastal changes and the process is as ugly as politics or making sausage. There are eustatic changes caused by volumetric changes in the amount of liquid on the planet (the end of the last ice age resulted in an eustatic rise of 100 meters or so). Then there are isostatic changes due to rebounding continental masses as they recover from the disappearance of immense amounts of ice, and other longer term processes such as continental drift and related changes in the surface topography of the planet which change the volumes and geometry of the major basins. There are also thermal changes that can lead to eustatic changes in volume.
Then there is simply what I think of as the “fog of research,” which is similar to the fog of war but with fewer bullets in the air. For instance, there is excellent geological evidence of a marine high stand of ca. 1.5 meters above the present mean sea level during the early Holocene global thermal maximum. Good evidence of this comes from such widely dispersed regions as Australia, Tasmanian, Micronesia, Brazil and Texas. But … there is no reported evidence of such a high stand along the west coast of North America. I’ve looked. There are a number of possibilities including a tectonic regime that is more active than we believe, or much greater coastal erosion. But the commonest response I have had is “it didn’t happen here.” Personally I believe we do have west coast evidence in the interior of Central California around the Sacramento – San Joaquin delta, but it will be nearly impossible to prove without some astonishing luck.
Well, obviously, you have not been standing perfectly still at high tide.
Most of the alarmist scenarios require that you stand perfectly still for several hundred years.
Then finally when the water is up to your knees, you will say “enough, I’m tired of this, already”.
And then you will become a displaced climate vagrant.
(erm… I mean migrant).
http://www.bc.edu/bc_org/avp/cas/fnart/fa267/boston/sequ_ani.gif
My home is just shy of 1200 feet elevation and the the land has not been turned to plow because of the underlying limestone, which is ancient seabed. How dense does one have to be to not grasp that there are forces at work on this planet much greater than a few ppm CO2?
In fact, the US has run a coastal survey since 1807 when Jefferson established the survey of the coast. There are very high accuracy maps that document most of coast of the continental US. These charts and maps were critical for establishing light houses and creating navigation charts. The United State Lighthouse Service later folded into the Coast Guard employed these maps in determining light house sites. The coastal survey is now administered by NOAA (shipping is critical to commerce.
Another way to test is to offer to buy up low island nations at a distressed rate per acre and see what the reaction is from the inhabitants. Throw in some reduced fee appearances from celebrities as a bonus. One reason they will not take the offer is because they know Richard Branson already bought up an island as a private resort after making appearances with Gore.
You’re children are being educated by socialists. They will “believe” believe me. Indoctrination.
Good idea! Let’s not forget that the oceans are deep and the image only shows the surface layer, to which satellite data contribute at most a fraction, if any useful information about the ocean interior at all. Oceans govern climate, but there’s a long way to understand climate: http://oceansgovernclimate.com/the-long-way-to-understand-climate/.
Or just check the Prices for Sea Front Property.
Ocean Bed Earthquakes making the land rise up out the sea
China has recently built several islands in the South China Sea.
I’m sure if the Micronesians ask nicely the UN will help them do the same thing.
Thanks, David Middleton.
What a surprise, to see “my” island in WUWT.
I found a FEMA flood map at http://msc.fema.gov/portal/search?AddressQuery=Key%20Biscayne%2C%20FL%2033149
Since 1971 there has been less than 1/2 inch of ground floor garage partial flooding during king tides, I can see no change, and I don’t plan to move out.
“The mean sea level trend is 2.39 millimeters/year with a 95% confidence interval of +/- 0.43 mm/yr based on monthly mean sea level data from 1931 to 1981 which is equivalent to a change of 0.78 feet in 100 years.” (0.3 meters = 1 foot)
From Station 8723170: Miami Beach, FL (Mean Sea Level Trends, 1931 to 1981):
http://tidesandcurrents.noaa.gov/sltrends/sltrends_station.shtml?stnid=8723170
“The mean sea level trend is 2.33 millimeters/year with a 95% confidence interval of +/- 0.15 mm/yr based on monthly mean sea level data from 1913 to 2014 which is equivalent to a change of 0.77 feet in 100 years.” (0.3 meters = 1 foot)
From Station 8724580: Key West, FL (Mean Sea Level Trends, since 1913):
http://tidesandcurrents.noaa.gov/sltrends/sltrends_station.shtml?stnid=8724580
2223 vs 2179 acres – that’s 2% *growth* in land area – near the uncertainty of ‘rough-and-ready’ planimery – certainly within the variability due to tides and storms.
With all due respect, I doubt these maps are that accurate.