Guest Post by Bob Tisdale
In this post, we’re going to discuss one of the three adjustments with the greatest impacts on the new NOAA “pause buster” sea surface temperature dataset. That is, I’m going to discuss and illustrate that NOAA based one of their recent adjustments (the adjustment with the greatest impact during the slowdown in global warming) on the outputs of one climate model…clarification: one obsolete earlier-generation climate model…and that if we examine the consensus of the latest generation of climate models, we see that NOAA may have adjusted away a relationship that the consensus of newer models indicates should exist…assuming that yet another of NOAA’s assumptions is correct.
BACKGROUND
NOAA revised their global surface temperature product earlier this year to show more global warming during the post-1998 period. Those data manipulations supposedly ended the slowdown in global warming over that period. The changes to NOAA’s global surface temperature product were presented in three studies. The greatest changes were made to the sea surface temperature portion, and those changes were discussed in the papers Huang et al. (2015) and Liu et al. (2015). Those two studies published in February 2015 slipped by the mainstream media, unnoticed. The alarmists, however, did not miss the Karl et al. (2015) paper Possible Artifacts of Data Biases in the Recent Global Warming Hiatus (paywalled, full paper here). While the revisions included changes to the NOAA global surface temperature product since its start in the 1850s, Karl et al. (2015) focused on the periods of 1998 to 2014 and 2000 to 2014…periods during which NOAA had adjusted the sea surface temperature portion to the extent that they claimed the slowdown in global warming never existed.
The claims were misdirection of course, because, even with NOAA’s changes to the surface temperature record, there is still an ever-growing difference between observations and climate model-based predictions of global warming. In other words, the manipulations of the NOAA global surface temperature records decreased the difference between models and data, but those modifications did not eliminate them.
U.S. Congressperson Lamar Smith is the chairman of the House of Representatives Committee on Science, Space and Technology. Like many persons, Representative Smith questions NOAA’s changes to their surface temperature record. Recently, Representative Smith has been formally requesting NOAA emails regarding the changes to the global surface temperature record, and, as of yet, Dr. Kathryn Sullivan of NOAA has not produced those emails. There are a multitude of news articles about the Smith-NOAA dispute, but they are not the subject of this post.
This post discusses the primary adjustment that had the greatest impact on the “pause busting” nature of the new NOAA global sea surface temperature reconstruction. My finding is that NOAA may have adjusted away a difference between ship-based sea surface temperature measurements and night marine air temperature that should exist according to the consensus of the climate models used in the latest IPCC 5th Assessment Report. Once again, this assumes that yet another of NOAA’s assumptions is correct.
ADDITIONAL BACKGROUND: OCEAN SURFACE TEMPERATURE BIAS CORRECTIONS
Different methods were used to sample sea surface temperatures since the start of the surface temperature record in the mid-1800s: buckets of different materials (wood, canvas, insulated), engine room intakes, and buoys (moored and floating). Additionally, the temperature of the air above ocean surfaces has been recorded aboard ships…a metric called marine air temperature. Each method has its own sampling errors, uncertainties and biases. (For those new to the subject, see Kent et al. (2010) Effects of instrumentation changes on ocean surface temperature measured in situ. It has a detailed and relatively easy-to-understand overview. Also see Kennedy (2014) A review of uncertainty in in situ measurements and data sets of sea-surface temperature. A copy of the submitted paper is here.)
Beginning in the mid-1990s, data suppliers have been accounting for the biases that come from the different types of buckets and from the transition from buckets to ship inlets. Additionally, the ship-buoy bias has also been discussed in papers since the early 2000s. The ocean temperatures sampled from engine-room intakes (ERI) on ships are slightly warmer than the temperatures sampled by buoys. But data suppliers had not attempted to account for the ship-buoy bias until recently because of the large uncertainties of the ship-inlet and buoy temperature measurements and due to the massive uncertainties of the ship-buoy bias. (See Reynolds et al. 2002. Also see Kennedy et al. (2011) Part 1 and Part 2 for documentation of those uncertainties.)
For their new “pause-buster” data, NOAA:
- adjusted the ship data using the UKMO HadNMAT2 night marine air temperature data as a reference. This of course assumes the night marine air temperature data vary at the same rates as sea surface temperatures (both day and night).
- adjusted the buoy data to account for the difference in temperature between ship inlets and buoys where both exist. The effects of this would vary over the past few decades because the ratio of buoy and ship-based measurements changed with time. There has been an increase in buoy samples and a decrease in ship-based measurements.
- weighted the buoy data more than ship data during periods when both ship and buoy data exist. This was done to account for the different accuracies of the ship and buoy temperature measurements…buoy data have been shown to be more accurate than the ship inlet data.
According to Karl et al. (2015) the adjustments to the ship data (based on night marine air temperature data) had the greatest impact on the trends from 2000 to 2014:
Of the 11 improvements in ERSST version 4 (13), the continuation of the ship correction had the largest impact on trends for the 2000-2014 time period, accounting for 0.030°C of the 0.064°C trend difference with version 3b. (The buoy offset correction contributed 0.014°C dec-1 to the difference, and the additional weight given to the buoys because of their greater accuracy contributed 0.012°C dec-1. See supplementary materials for details.)
In this post, we’re going to overlook the ship-buoy bias adjustment and the weighting of buoys and ship inlet data, they’ve been discussed in numerous other blog posts, and we’re going to concentrate on…
NOAA’S ASSUMPTIONS FOR USING NIGHT MARINE AIR TEMPERATURE DATA TO ADJUST SHIP-BASED SEA SURFACE TEMPERATURE MEASUREMENTS
NOAA made numerous assumptions to justify using night marine air temperature data to adjust the ship-based sea surface temperature measurements. They’ve listed them in Huang et al. (2015) paper Extended Reconstructed Sea Surface Temperature Version 4 (ERSST.v4) – Part I: Upgrades and Intercomparisons. There they write on page 919 (where NMAT is night marine air temperature and SST is sea surface temperature):
The bias adjustment for ship SSTs in ERSST.v4 is originally proposed by Smith and Reynolds (2002) and involves using NMAT as a reference. NMAT is selected because the differences from SST are more stable than daytime marine air temperatures, which can have a large range due to solar heating of the ships decks and of the instruments themselves. To formulate the bias adjustment, however, it is necessary to assume that
1) the difference between SST and NMAT is near constant during the climatological period (1971–2000);
2) the climatological difference of SST and NMAT is constant in other periods;
3) the NMAT is less biased (more homogeneous) than the SST data to which it is being compared;
4) the mix of SST measurement methods (bucket or ERI) is invariant across the global oceans, and the spatial pattern of biases follows the climatological difference of SST and NMAT in the modern time (1971–2000); and
5) biases vary relatively slowly and smoothly with time.
We only need to examine the first two of NOAA’s assumptions.
NOAA then went on two describe how they tested their first two assumptions:
To test the first two assumptions, which are assuming broad physical coherence between two highly correlated but physically distinct measurands, the average difference between SST and near-surface air temperature (SAT) of day and night at 2m is calculated by subsampling monthly outputs of the GFDL CM2.1 coupled model with monthly observation masks from 1875 to 2000 (Fig. 4). The model SAT is used since the model bias is assumed to be the same during daytime and nighttime. It is found that the first two assumptions are valid since the model simulations indicate that the difference of SST and SAT is near constant and its linear trend is weak in all four different latitudinal zones (Fig. 4)…
Huang et al. are not very specific about the meaning of “monthly observation masks”. Does it mean that NOAA has masked all grids that do not contain ship data? I suspect that’s the case.
IMPORTANT NOTE: In the following, I have not taken the step of masking the grids without ship data, because I’m attempting to illustrate the global (without polar oceans) climate model-expected relationship between marine air temperature and sea surface temperature. [End note.]
Curiously, NOAA is assuming the modeled relationship between sea surface temperature and marine air temperature (both day and night) is the same as the relationship between night marine air temperature and sea surface temperature, the latter of which includes both day and night measurements. That is, NOAA is using night marine air temperature (not marine air temperature, both day and night) to adjust sea surface temperature, yet they’re presenting modeled sea surface temperatures and marine air temperatures (both day and night) for justification. Is this addressed by “The model SAT is used since the model bias is assumed to be the same during daytime and nighttime”? That seems to be the case.
My Figure 1 is Figure 4 from Huang et al (2015).

Figure 1
First, note that the climate model-based graph in their Figure 1 ends in 2000. That’s odd because we’re very interested in the period of 2000 to 2014. Second, they listed the trends for 1875 to 2000 in the caption for their Figure 4, but they failed to show the trend for their climatological period of 1971 to 2000 (See their assumption 1 above).
Third, and very important, the GFDL CM 2.1 coupled ocean-atmosphere climate model from the NOAA Geophysical Fluid Dynamics Laboratory (GFDL) is a curious choice for use in a study in 2015. On the GFDL webpage about the new and improved GFDL CM3 model, they begin:
GFDL’s successful model, CM2.1 (Delworth et al., 2006), was used as the starting point to develop the next-generation CM3 coupled model.
In other words, the 10-year-old GFDL CM 2.1 climate model could be considered obsolete inasmuch as it has been replaced by the GFDL CM3. The GFDL CM 2.1 was supported by Delworth et al. (2006) GFDL’s CM2 Global Coupled Climate Models. Part I: Formulation and Simulation Characteristics. The abstract notes it was used for the IPCC’s 4th assessment report back in 2007.
We know from past experience that there can be wide ranges in the absolute values of surface temperatures from model to model and wide ranges in their trends. NOAA’s use of one earlier-generation climate model could lead anyone to believe NOAA selected (cherry-picked) that single earlier-generation GFDL CM 2.1 climate model because it provided them with the results they wanted.
So let’s take a look at the multi-model mean of all the new-and-improved climate models used by the IPCC for their 5th Assessment Report in 2013. Those models are stored in the CMIP5 archive, and their multi-model mean (along with the outputs of the individual models) are available at the KNMI Climate Explorer. The multi-model mean (the average of the models) basically represents the consensus (the groupthink) of the climate modeling groups on how sea surface temperatures and marine air temperatures (in this example) respond to the climate forcings used to drive the models. Due to the wide ranges of climate model outputs, using the average of all of the models in the CMIP5 archive (the multi-model mean) assures that we cannot be accused of cherry-picking one climate model that supports an agenda. And, to give you an advanced warning, we only need to examine the climate model outputs for the global oceans, excluding the polar oceans (60S-60N); that is we won’t need to examine the additional subdivisions presented in Figure 4 from Huang et al (2015) (my Figure 1).
We’ll start with period of 1875 to 2000 shown in Huang et al. Figure 4. The top graph in Figure 2 presents the modeled difference between the simulated global (60S-60N) sea surface temperatures and marine air temperatures during NOAA’s selected period of 1875 to 2000, with the marine air temperatures (TAS, with land surfaces masked) subtracted from the sea surface temperatures. Over this period, only the historic climate forcings were used by the modeling groups. For NOAA’s selected period of 1875 to 2000, the consensus of the latest generation of climate models show the modeled difference between the global (60S-60N) sea surface and marine air temperatures declining at a rate of -0.008 deg C/decade…exactly the same as the -0.008 deg C/decade (-0.08 deg C/century) claimed by NOAA for the period of 1875-2000. That would appear at first to confirm the results of Huang et al. (2025) (2015). The bottom graph in Figure 2 illustrates, for the same timeframe, the multi-model mean of the simulated sea surface temperatures and marine air temperatures, which serve as the bases for the top graph. I’ve included the model outputs for 2000 to 2014 (dashed curves) in both graphs as a reference as well.
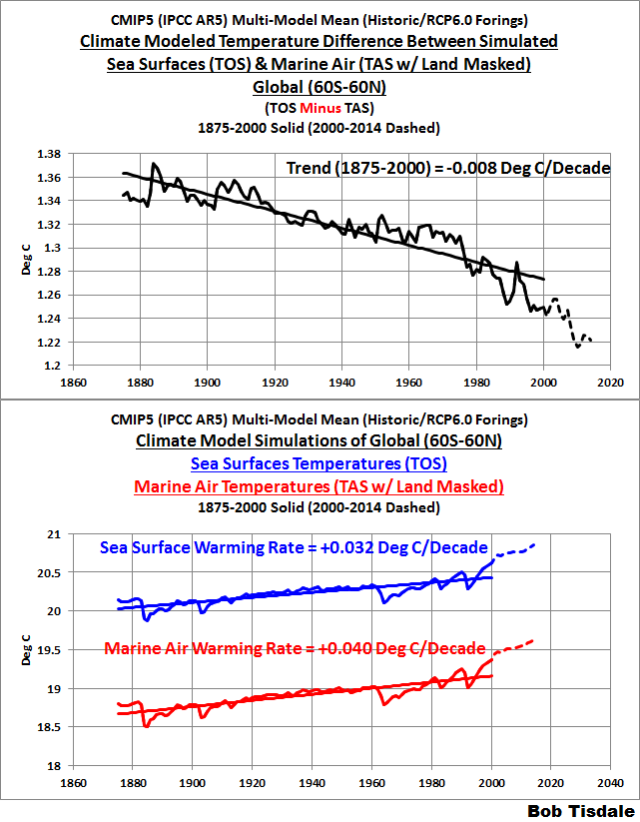
Figure 2
Note, however, in the top graph of Figure 2 there is a noticeable change in trend starting in the mid-1970s, with a sharp decline thereafter.
So let’s examine the trend for NOAA’s climatological period of 1971 to 2000. See Figure 3. For NOAA’s climatological period of 1971 to 2000, the consensus of the latest generation of climate models show the modeled difference between the global (60S-60N) sea surface and marine air temperatures declining at an increased rate of -0.021 deg C/decade…far greater than the -0.008 deg C/decade (-0.08 deg C/century) claimed by NOAA for the period of 1875-2000.
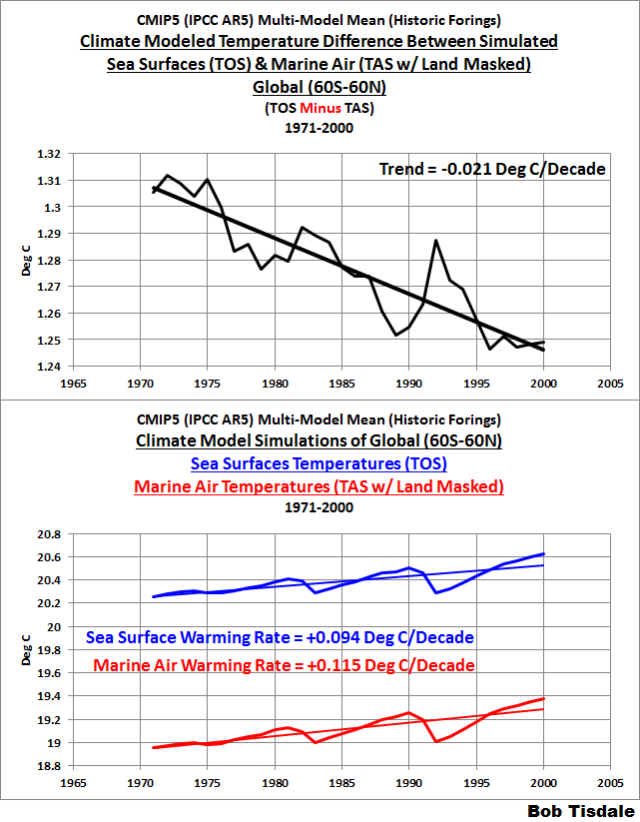
Figure 3
Referring to the bottom graph of Figure 3, the modeled marine air temperatures are warming slightly faster than the modeled sea surface temperatures over NOAA’s climatological period. In other words, the consensus of the new-and-improved climate models contradicts the NOAA (Huang et al. 2015) finding about their first assumption for using marine air temperatures to adjust the biases in sea surface temperatures measured from ships…or any sea surface temperature data.
But we’re really not interested in the period of 1971 to 2000. We’re more interested in the period of 2000 to 2014, because it was the period NOAA (Karl et al. 2015) used for their claim, “the continuation of the ship correction had the largest impact on trends for the 2000-2014 time period, accounting for 0.030°C of the 0.064°C trend difference with version 3b.”
Figure 4 is similar to Figures 2 and 3, but in Figure 4 we’re illustrating the model results for the period of 2000 to 2014. The only difference is, these models now the models also include projected forcings, in addition to historic forcings. The transition from historic to projected forcings occurs at 2005/2006 in most models. (It’s not a feature I selected.) But I did select the RCP6.0 forcing scenario, because I did not want to be accused of cherry-picking the worst-case RCP8.5 scenario.
Not too surprisingly, in the top graph of Figure 4, the multi-model mean (the consensus) of the new-and-improved climate models shows a drop in the temperature difference between the sea surface temperatures and marine air temperatures. In fact, the -0.027 deg C/decade trend of the modeled temperature difference is comparable to the 0.030 deg C/decade adjustment NOAA made (using night marine air temperatures) to the ship data for the period of 2000 to 2014.

Figure 4
That is, using the newer models, the consensus (the groupthink) of the modeling groups expects that marine air would warm faster than the surfaces of the oceans for 2000 to 2014…at a rate that is comparable to the “correction” applied to the ship data using night marine air temperature. This invalidates the second of NOAA’s assumptions that “the climatological difference of SST and NMAT is constant in other periods”. It clearly is not.
Simply put, NOAA appears to have adjusted out a difference between ship temperature measurements and night marine air temperature that should exist according to the consensus of the newer climate models. That assumes that NOAA’s other grand assumption…“The model SAT is used since the model bias is assumed to be the same during daytime and nighttime”…is correct.
Let’s put that into perspective. NOAA appears to have assumed that night marine air temperatures warmed at the same rate as marine air temperature (day and night). They used marine air temperatures in place of night marine air temperatures to verify their first two assumptions. Also consider that the consensus of the latest generation of climate models indicate that marine air temperatures should be warming at a higher rate than sea surface temperatures since about the mid-1970s. Yet, taking those considerations into account, NOAA’s end product, their new “pause-buster” ERSST.v4 data, shows the opposite relationship. Their new sea surface temperature data show a noticeably higher warming rate than the night marine air temperature data (HadNMAT2) they used as a reference. See Figure 5, which is Figure 1 from the post Open Letter to Tom Karl of NOAA/NCEI Regarding “Hiatus Busting” Paper.

Figure 5
Note: That graph ends in 2010 because the HadNMAT2 data end then. That of course raises the question: how does NOAA (unjustifiably) adjust the ship data after 2010? [End note.]
Bottom line: according to the latest generation of climate models, marine air temperature should warm faster than sea surface temperatures, but not in NOAA’s much-tinkered-with world.
CLOSING
Again, my illustrations show the expected global (60S-60N) relationships between marine air temperatures (day and night) and sea surface temperatures because NOAA used them to verify a relationship between night marine air temperatures and sea surface temperatures.
Also, I have not masked the model results so that they only include the grids with ship-based sea surface temperatures, as NOAA appears to have done. But, according to the consensus of the climate models used by the IPCC for their 5th Assessment Report, the expected relationship globally (60S-60N) is that Marine Air Temperature has warmed faster than Sea Surface Temperatures since the mid-1970s.
I suspect, when Congressman Lamar Smith’s whistleblowers are concerned about rushing the Karl et al. (2015) study “before appropriate reviews of the underlying science and new methodologies used”, they’re discussing:
- the uncertainties of the bias adjustments,
- the uncertainties of the data,
- of course the basic methodologies, including how NOAA distributed those adjustments around the oceans, and
- most importantly, for the “underlying science”, how NOAA appears to have adjusted out a difference between ship temperature measurements and night marine air temperature that should exist according to the consensus of the newer climate models—once again assuming that NOAA’s other grand assumption…“The model SAT is used since the model bias is assumed to be the same during daytime and nighttime”…is correct.
Maybe, in time, Dr. Sullivan of NOAA will produce the emails requested by Representative Smith so that we can confirm my suspicions and the suspicions of many others.
Another adjustment has taken place.
https://chiefio.wordpress.com/2015/11/29/maurice-strong-has-died/
If you torture the data long enough it will confess to anything !!!!
So the left hand forget to tell the right hand its thumb was going on the scale?
Their time frames and temperature deviations are still miniscule. Yet they demand this is proof that we’re all going to die unless something is done now…I mean now!…right now!…this very instant!…not tomorrow, today! NOW!
I read through the entire IPCC First Report the other day. I found in interesting that even they gave a “low” confidence rating to their own computer models. Yet here we are.
Good news about Strong, passing. He will be remembered as manipulating, self-enriching, self-promoting, deceiver, at least by me! Of course, defenders of his actions will simply say he was “doing what he thought was right”!
Harsh.
You may not like the guy or what he stands for or what he did.
But he has friends and family. Be respectful.
Some people will be grieving.
Whoops. Just got trolled into joining a thread-jacking.
This post is too important for that.
Harsh but true. Respect is earned, and so is a bad reputation.
Look at this travesty:
Thank-you, Bob, your work is always much appreciated.
Even though, as you have pointed out above, the topic of obstruction (scientific and administrative) is not covered in your remarks, many shadows remain. The discussion of “the greatest problem facing humanity” is impeded by those who were hired to bring clarity to the issues. Once again a massive change is made and justified behind a paywall after those making the changes have collected their taxpayer provided pay checks.
I am now more convinced than ever that all documents relating to the work product of these public servants, Karl, et al. should be made part of the public record. Indeed, the roots of the masking required for the data provided in the studies may only be found in the e-mails between the researchers.
I fully agree that no (American) government funded research (direct or via grants to universities) should ever be pay-walled, and that all science and papers so funded, with their data, supplemental materials and information be made freely available to all citizens. I can’t afford to pay $32 to view articles I’ve helped fund, am interested in, and which may affect public policy. When will Congress act to change this? Now is the time. One baby step towards rolling back leftist tendentious science and leftist domineering over government bureaucratic “science.”
The fact is the journals have to make money to survive. There is an option for the authors to pay to publish in open access journals. Some grants include an extra few thousand dollars to pay for this, so the grant is larger than would otherwise be the case. It depends if you want the Govt. to pay or the readers of the journals to pay. Since most journals are bought by Universities, it probably doesn’t make that much difference.
the biggest problem facing humanity is humanity itself.
FWIW, when I was serving on weather reporting cargo ships the sea surface temperature was never measured. The engine cooling water intake was somewhere between 18 and 30 feet below the suirface of the sea depending on whether the ship was loaded or in ballast.
Is this taken into account when comparing data?
Paul Vaughan over at Tallbloke’s Talkshop has been yammering on about this adjustment since he first looked at it after it was published, and has chastised just about everyone for not understanding him (it).
His take on the adjustment is that it matches closely with the ‘Interdecadal Pacific Oscillation’. As many of us are not so intimately involved with this issue as you and Paul, I’d appreciate it Mr. Tisdale if you could address this at some point, as unfortunately Paul doesn’t communicate much anywhere but TB’s place.
http://s1.postimg.org/thgs72a7j/IPO_BIAS_ERSSTV4_HADNMAT2_ICOADSSST2_5_CLIPART.png
Isn’t one of the reasons that temperature anomalies are used, instead of actual temperatures, so that biases between sensor types don’t come into play?
So how do you find out the anomoly from “something” if you don’t know what “something” is to start with?
As I always say……” If you torture the data long enough it will confess to anything !!!! “
The concept is that by only tracking the differences, then it doesn’t matter which sensor is used.
Maybe it would work, if all of the sensors are the same and only their certified accuracy differed.
But that is not the case.
Even within highly structured and technical organizations that strongly adhere to standards there are substantial difference in sensor types and sensor certifications.
Building a comprehensive sensor capable of accurately measuring all air temperatures between -60°C to +60°C is not easy. Even more difficult is keeping a rational level of accuracy ongoing or even being able to recognize when that accuracy has slipped.
Look at all of the alleged anomaly tracking graphs and then dig into exactly whose anomalies they are and what equipment generated the original temperatures.
What you will find is that everything from old mercury and alcohol thermometers to archaic digital and modern digital thermometers are contributing.
Error bars for several of these measurement methods are in the order of ±1-2°. There are no technical or mathematical methods that eliminate or reduce this error rate as what is, is.
So developing an anomaly temperature first requires that one utilize different equipment and methods. A rough comparison would be comparing or adding and subtracting apples, oranges, horses, moons and penguins.
Anthony’s surface stations project highlights issues just within the United States systems of temperature tracking. One can only imagine the temperature tracking horrors in less civilized places of the world.
Which brings us back to the question why the old thermometer temperature collected data is not relegated to immutable database archives for historical purposes. Why are the satellite temperature tracking methods not exclusive in this day and age?
The satellite measurements of the “lower troposphere” are pretty much of the lowest 8 km of the troposphere, mainly the lowest 5 km. When global temperature changes, especially due to or when accompanied by change in greenhouse gas concentrations, the lapse rate in at least parts of the troposphere changes. This means the surface, or the part of the troposphere within 100 meters of the surface, can change differently from the lower troposphere as a whole, and differently from what the satellites measure as the “lower troposphere”. The radiosonde record indicates this is the case. See Figure 7 of http://www.drroyspencer.com/2015/04/version-6-0-of-the-uah-temperature-dataset-released-new-lt-trend-0-11-cdecade/
It looks like that from the beginning of 1979 to early 2015 the lowest 100-200 meters of the troposphere warmed .02 possibly .03 degree/decade more than the main part of the lower troposphere or the satellite-measured lower troposphere. One reason is that as ice and snow cover is lost in polar and near-polar areas with low lapse rate in the lowest levels of the troposphere, the surface and surface-adjacent troposphere warm more than higher up in the lower troposphere.
As for surface temperature anomaly datasets: The one that had best correlation with the satellite lower troposphere datasets, and that outwarmed them from 1/1/1979 onward by .019-.02 degree/decade, for all its shortcomings, is HadCRUT3 – sadly discontinued.
http://woodfortrees.org/plot/hadcrut3gl/plot/hadcrut3gl/mean:37/plot/hadcrut3gl/from:2012.08/mean:13
Should the surface and surface-adjacent troposphere have warmed since 1979 by closer to .03 degree/decade than .02 degree/decade, then the most accurate global surface temperature anomaly dataset would probably be HadCRUT4.0 (as opposed to versions newer than 4.0 such as 4.2 and 4.3).
The temperature of the ships seawater used to cross exchange with the engine jacket cooing water is 0.10C higher due to the centrifugal pump efficiency. The temperature gain in the piping across the hot engine room is 0.02C giving a total temperature rise of 0.12C going into inlet of the first cross heat exchanger where the thermometers are located. This mechanical arrangement accounts for the 0.12C differences noted, it should be subtracted not added.
A computer model is an assumption. We all know the caveat: When you assume you make an ass out of u and me.
The worst part about this situation is it takes congressional action to get answers, answers that are still not forthcoming. It appears Dr. Sullivan et al are stalling and hoping this will go away before they are held accountable by Congress. I’m concerned about whether we will ever be given good data further down the road. Knowing that they filter and censor out any scientific objections such as that depicted in this post, are they going to wear people down so much that most will just accept whatever they say w/o question?
I think that’s the world they want us to live in- Orwellian.
Thank You Mr. Bob Tisdale. I’m a bit of a fan, I confess. I think your data analysis skills are exceptional, deconvoluting the complex into something more distilled and focused. I tried to engage Mr. Ehak on Judith Curry’s buoy data thread but it’s difficult when the target is moving. His argument style involves invoking invalid syllogisms and straw man constructions. It’s clear to me that something is not right with the “hiatus buster” paper by Karl et al. The Congressional investigation is just sauce for the goose. Anyway, I was wondering as a Veteran of the U.S. Navy, buoys can demonstrate a positive bias at night in calm seas as the structures are heated during the day and radiate into the immediate area at night. This effect is similar to a parking garage rising in temperature at night after a hot day, acting like an oven. I was wondering what your thoughts were on this possibility. I know that water temps have a high heat capacity but a local environment may be constructed around the buoy, enough for a positive bias reading. Maybe there were in-situ experiments performed? Thanks for your expert analysis. Please keep up the good fight.
Regards,
JerryG∞
There they write on page 919 (where NMAT is night marine air temperature and SST is sea surface temperature)
They missed reason #6: It gives the answer we want.
Thanks, Bob. Very good explanations.
Tom Karl seems to have produced a very controversial paper to kill the hiatus, and the killing of the most recent CMIP5 IPCC models is unintended collateral damage.
I see the epicycles are getting more abundant, as they tend to do in failing theory. Like in a theory to make the Earth’s atmosphere control the Earth’s oceans. And never mind the satellite-measured temperatures of the lower troposphere.
Very interesting observations. Many thanks for posting your analysis.
I posted a question on Climate, Etc. a while back concerning precisely what Karl, et al., did with these ship-buoy changes although no one was able to provide any insights to Karl’s exact meaning.
From Karl’s supplementary material (page 2 of 6):
As I understand Karl’s description, uncorrected buoy data (that is, prior to adding 0.12 C) was used to test the validity of their decision to extend the mid-century ship adjustments into more recent years.
If extending pre-1941 ship data adjustments into recent decades by itself produced nearly perfect agreement (-0.002 C/decade) with the uncorrected buoy data trend line — why did they need to add an additional adjustment to the buoy data afterwards?
I can only assume I misunderstood Karl’s description and would welcome a clarification on this point.
Recall that liberals love to scold the rest of us about “sustainability.” Adjusting data for ideological reasons is fraud. The further the adjusted data diverges from reality, the more energy and continual attention will be required to explain away the difference. In the end, fraudulent data is never “sustainable”, no matter how noble the ideological goal. Jesus was right, the truth sets us free, even if being truthful shows us that something we want to be true is not.
As also pointed out by others, Karl’s pause-buster surface temp fudging makes the model-predicted tropical tropospheric hot spot even more unlikely to be found.
NOAA and NASA management should become familiar with the famous old Scottish poetry line:
Tom Karl should put that on his Christmas cards.
Hello Bob
“We only need to examine the first two of NOAA’s assumptions.”
——————–
Probably I have not understood correctly the points and the main technicality, the scientific ones, in the paper in question and also in the analysing of the subject in this Post of yours.
Please do forgive me if that the case, especially when considering that I did not read all your post and the examination you of the subject you are offering.to the detail and up to the end.
But considering the above selected, a statement of yours, from the very start of your argument and examination, I have to try and point the attention at the fourth NOAA’s assumption….one which you imply as one not in need to be examined.
In my opinion and to my understanding the number 4 assumption seems strangely enough to be the longest stated assumptions there and one that also strangely enough seems technically as a statement to hold actually two assumptions, which may or may not have a logical connections to each other..
What actually NOAA is “saying” :
—
“To formulate the bias adjustment, however, it is necessary to assume that;
1) blah blah blah….
2)blah bla blah blah….
3)blah blah…
4) blah blah blah…..and the spatial pattern of biases follows the climatological difference of SST and NMAT in the modern time (1971–2000) ”
—
So what Karl et al. is claiming, is that he is showing “clearly” that the IPCC estimated trend for the period 2000 to 2015 is wrong and his is correct and better estimated by use of better analyses and bias adjustments by taking in account the necessary assumption to formulate the bias adjustments as stated and required by the NOAA, where the period in question, the hiatus period, must be assumed to be the same climatologically as far as SST – NMAT relation considered, the main point of the methodology of the adjustments……… hold on wait for it….. to be the same with the 1971-2000 period, a period clearly in a warming trend, climnatologically.
Forgive me for my shallowness, but what for is actually needed the rest of the Karl et al. paper, the numbers and the models and all that other fuss, if only by directly relying in the assumption that the 1971-2000 period must be assumed as same climatologically as the 2000-2015 or vice versa!
If one period consist clearly of a warming trend so will the result be for the other period (the adjusted to be)….a period resulting as consisting of a warming trend…..as required by the necessary assumption considered and relied to formulate the adjustments….
In my opinion the assumption number 4 nests at its second part the “con”, the logical fallacy, intended to pass through as innocently as possible.
In my opinion also the most heavy impact of that “con” is not the “pause basting” by showing SST temp trend or the all surface including land also temp trend to be seen in a warming angle…..the most heavy impact could and probably will be when hiding the decline for as long as possible by adjustment of the air temps data, marine and land air temp data, by implying and relying in the same assumed necessity for formulating the bias adjustments..
cheers
Let’s assume that 2000-2015 is like 1971-2000… Surprise! The world keeps warming! Nothing wrong with my assumption, right? xDDDDD
It’s not directly relevant to this post, but the (regression?) lines fitted to every plotted series above may be relevant to other features of the Karl adjustments. Specifically, defenders of the ship-buoy offset sometimes use straight lime temperature series to argue that Karl is right. This is true – Karl’s adjustment would be appropriate for very nearly linear (and parallel) ship and buoy series. But the invariable fitting of trend lines to any and every climate time series (especially at low resolution) often obscures the fact that they are typically far from linear. All this line fitting may deceive ‘adjusters’ into thinking of everything as linear and that naïve(?) techniques such as Karl’s offset can be used. Barring a lot of lucky cancelling errors, this is unlikely to be true.
Who cares what the sea surface temperature is doing. Let’s just monitor the land area temperatures and let the sea do what it will.
“That would appear at first to confirm the results of Huang et al. (2025).”
I suspect “2025” is a typo?
Thanks, Bartleby. I’ll correct that.
Stop the presses! Why are sea surface temperatures being mixed with atmospheric temperatures in the first place?? Apples and oranges. It would make more sense to take soil surface temperatures and add them to sea surface temperatures. But even than does not make much sense, since we have no data.. Furthermore, it appears that the oceans are not heated by greenhouse gasses anyway. The only people that say the oceans are heated by GHG’s are the bozos, er, I mean climate scientists, at RealClimate, and all they have for evidence is one non peer-reviewed study by ONE author.
As far as atmospheric temperatures are concerned, we have sparse coverage for the planet, and unfortunately, the surface instrument record keeps getting adjusted as well, cooling the past and warming the present.
Thanks for your excellent work. It appears to me that the actual beginning of the pause in temperature rise should be 2002. This would change the slope of the average temperature line and would show the pause with more clarity. Where am I wrong?
What’s wholly inane is the use of unverified MODEL data to develop adjustments for bona fide, albeit highly inconsistently obtained, empirical measurements
Bingo.
Bob,
I’m always appreciate the thoughtful and detailed work you do. I wish Zeke Hausfather and Kevin Cowtan and others who usually defend any and all adjustments would show up and critique your work, if they can, because I’m not in that league. Like so many others, however, I’m suspicious when almost all adjustments support the alarmist side with the lowering of past temperatures and/or raising of recent temperatures.
Bob, how much time did you spend on the research and presentation of this post. I think we all owe you a tremendous thank you for your ongoing analysis.
As a former naval meteorological sailor I took countless SST readings. On those occasions when direct (with a rubberised canvas “bucket” with a shielded thermometer inside) readings weren’t able to be taken (no buckets left, all broken, ship in action stations, seas too rough) the engine room was phoned for the boiler intake reading. These were written in red pen in the ship’s meteorological logbook. I don’t know how often the engine room thermometers were calibrated, but it strikes me that the difference between bucket and intake SST would vary between ships, considering how much the draught varies. Sea state would be a factor also. As I recall SST was reported in the maritime met obs code- there was no way to differentiate intake or manual readings in the code, so unless researchers actually look at the logbooks, the vast archive of shipboard messages would have many differing means of determining SST. In the light of this, I do wonder how statisticians think they can find changes in SST over time to hundredths of a degree. I would be hesitant the find a mean with precision of more than 0.5C.
on November 30, 2015 at 5:55 pm, Mike T writes:
“I do wonder how statisticians think they can find changes in SST over time to hundredths of a degree.”
I’ll second that Mike, and I’m a statistician frequently tasked with defining metrics for use with industrial process control; I believe you’ve exposed what I consider to be the single most important failure of climate science, which is the lack of precise measurement and the subsequent vast overstatement of confidence.
It goes well beyond simple temperature measurement using instruments, which are by far among the best measures available. The carbon dioxide metrics taken at Mauna Loa appear to be the best since they’re taken from a single location using consistently calibrated instruments. Temperatures recorded in the 1800’s using various types of thermometer that weren’t calibrated are, in my opinion, not much better than WAGs. My favorite image is to imagine an observer in North Dakota reading a thermometer in blowing snow while wearing bifocals and a bathrobe. It doesn’t inspire confidence in the numbers. The idea of using these numbers to calculate “anomalies” in fractions of a degree is frankly absurd since the underlying data can’t possibly have that precision. We can argue the validity of the cAGW theory until the cows come home, but there’s really no point since there’s no data available prior to 1978 that could reasonably be used to test it, and climate scientists argue a minimum of thirty years observation would be needed to characterize “climate” rather than “weather”. So we’re left with nothing but pure conjecture using fabricated (sorry, “adjusted”) data. It’s insane.
When we take a step back and critically review the so called proxy measures used to reconstruct paleo records, the entire thing becomes voodoo. Temperatures reconstructed using tree rings? Seriously, you may as well toss chicken bones.
I truly appreciate the effort Bob Tisdale has put into this and other articles he’s written on the topic of measurement, I always find them both fascinating and well researched.
I was a cadet in 1952-55 on observing ships, and occasionally on observing ships later. I well remember heaving the canvas bucket overside, collecting a ‘fair’ sample of the water, heaving it in and dropping the thermometer into the bucket, waiting a bit for the temperature of the thermometer to adjust to the seawater and then oiking it out and trying to read the scale. Not easy in a howling gale with heavy rain. I did my best to guess to the nearest 0.1 degree – I think it must have been C, but perhaps F – there may have been columns to indicate whether we had C or F thermometers. But I do wonder about others, what did they do?
However, I am interested in “the average difference between SST and near-surface air temperature (SAT) of day and night at 2m”. The Stevenson Screen was on the bridge, occasionally on the Monkey Island, but never anywhere near 2 metres above sea level. I can hardly comprehend the likelihood of sending a seaman down with instructions to hang the thermometer as far overside as he can reach, and lower it to 2 m above sea level. Just plausible in daylight if the ship is not rolling, but at night with the ship rolling even 5 or 10 degrees this is not on. The only way to get a 2 m above water level air temperature is to use a float with the thermometer 2 m up a pole. What sort of ship is going to stop mid ocean to play this sort of game? Just fancy it in the southern ocean, or the Great Australian Bight, with a 600 to 900 ft wavelength swell and a 40 to 60 ft crest to trough height!
In seafaring terms, not on your Nelly. I agree with mike T.
Some ships I sailed on had trouble with the funnel smoke as often the exhaust swirled around and then onto the bridge, where the screen would have been. The only way to make conditions livable in the wheelhouse was to shut the side doors and open the bridge front windows. This pressurized the wheelhouse and kept the exhaust out. Not sure how much the air temperature would have been raised by the funnel exhaust coming round to the screen! It did make it interesting for the Old Man trying to force open the aft door into the chartroom with the wheelhouse and chartroom pressurized!
Dudley, in the RAN we used a brass sheathed thermometer which slid in and out of a slim rubber tube. The line was attached to a guardrail on 4 Deck (aircraft carrier so the first partly open deck above the waterline) and heaved forrard and pulled out as it came level to the observer. This was repeated a few times, the temp read and the remaining water tipped over the side. Scary in big seas and under darkened ship at night. For the latter we used a torch with a red disc inserted. I once had a Petty Officer sneak up on me and attempt to bawl me out for using a light when on an exercise and the ship darkened. I did nearly have a heart attack from the fright…
The information will never be released before the end of COP21. Imagine as Barry tells the world how wonderful he is the headlines of “Agency relied on by President found cooking the books”. Wont happen.
Mods, grammatical error in Bob’s original that I caught on a quick scan:
“NOAA then went on two describe how they tested their first two assumptions:”
Two many toos, to. (to describe, not ‘two describe’).
excellent analysis as usual by bob . i still think when we are talking tenths of a degree richard s courtney is on the money in regard to the accuracy claimed in this type of paper.
SO many peas under SO many moving pods, these infinite temperature games can hide endless stretchings of graphs and gauges, smearing the warm with the lukewarm with the icy cold…. Dying by Degrees – Industrial Disease has come back from the 80s… Dire Straits was right – “Industrial Disease”
Warning lights are flashing down at Quality Control
Somebody threw a spanner and they threw him in the hole
There’s rumors in the loading bay and anger in the town
Somebody blew the whistle and the walls came down
There’s a meeting in the boardroom they’re trying to trace the smell
There’s leaking in the washroom there’s a sneak in personnel
Somewhere in the corridors someone was heard to sneeze
‘goodness me could this be Industrial Disease?
There’s definitely a sneak in personnel… Busting a PAUSE…
Lemme get this straight. They get a huge bunch of measurements taken in totally different ways, adjust them at whim, lump them together, and then calculate shifts in temperature to thousandths of a degree?
That’s impressive science!
To get a really accurate view of the true “state of the art” for measures taken in the 1800’s, I urge you to see:
“Die Verbreitung der Warme auf der Oberflache der Erde, erlautert durch Isothermen, thermische Isanomalen und Temperaturcurven.” Paperback – 1852, H. W. Dove
If you can’t get the complete book, do some Googlizing of H.W. Dove, h was one of the first scientists who attempted to aggregate global temperatures and I think you’ll be astounded by how little data was available and how crude the measurements really were.
And these data are part of the GISS record….