From the WOODS HOLE OCEANOGRAPHIC INSTITUTION and the “worse than we thought” department, comes this breathless press release that doesn’t even mention the name of the study somehow manages to spin model results into a future frenzy worse that if the ice shelves just collapsed.
New study projects that melting of Antarctic ice shelves will intensify
New research published on October 12th projects a doubling of surface melting of Antarctic ice shelves by 2050 and that by 2100 melting may surpass intensities associated with ice shelf collapse, if greenhouse gas emissions from fossil fuel consumption continue at the present rate.
Ice shelves are the floating extensions of the continent’s massive land-based ice sheets. While the melting or breakup of floating ice shelves does not directly raise sea level, ice shelves do have a “door stop” effect: They slow the flow of ice from glaciers and ice sheets into the ocean, where it melts and raises sea levels.
“Our results illustrate just how rapidly melting in Antarctica can intensify in a warming climate,” said Luke Trusel, lead author and postdoctoral scholar at Woods Hole Oceanographic Institution (WHOI). “This has already occurred in places like the Antarctic Peninsula where we’ve observed warming and abrupt ice shelf collapses in the last few decades. Our model projections show that similar levels of melt may occur across coastal Antarctica near the end of this century, raising concerns about future ice shelf stability.”
The study, published Oct. 12, 2015, in Nature Geoscience, was conducted by Trusel, Clark University Associate Professor of Geography Karen Frey, WHOI scientists Sarah Das and Kristopher Karnauskas, Peter Kuipers Munneke and Michiel R. van den Broeke of the Institute for Marine and Atmospheric Research Utrecht University, and Erik van Meijgaard of the Royal Netherlands Meteorological Institute.
To study how melting evolves over time and to predict future ice sheet melting along the entire Antarctic coastline, the scientists combined satellite observations of ice surface melting with climate model simulations under scenarios of intermediate and high levels of greenhouse gas emissions until the year 2100.
The results indicate a strong potential for the doubling of Antarctica-wide ice sheet surface melting by 2050, under either emissions scenario. However, between 2050 and 2100, the models reveal a significant divergence between the two scenarios. Under the high-emissions climate scenario, by 2100 ice sheet surface melting approaches or exceeds intensities associated with ice shelf collapse in the past. Under the reduced-emissions scenario, there is relatively little increase in ice sheet melting after the doubling in 2050.
“The data presented in this study clearly show that climate policy, and therefore the trajectory of greenhouse gas emissions over the coming century, have an enormous control over the future fate of surface melting of Antarctic ice shelves, which we must consider when assessing their long-term stability and potential indirect contributions to sea level rise,” said Frey.
###
Funding for the research was provided by NASA, the Doherty Postdoctoral Scholarship Program at WHOI, the Netherlands Earth System Science Centre, the Polar Program of the Netherlands Organization of Scientific Research, and the Dutch Ministry of Infrastructure and the Environment.
Since these bozos that wrote the press release didn’t provide a link to the study, I will.
http://www.nature.com/ngeo/journal/vaop/ncurrent/full/ngeo2563.html
Divergent trajectories of Antarctic surface melt under two twenty-first-century climate scenarios
Ice shelves modulate Antarctic contributions to sea-level rise1 and thereby represent a critical, climate-sensitive interface between the Antarctic ice sheet and the global ocean. Following rapid atmospheric warming over the past decades2, 3, Antarctic Peninsula ice shelves have progressively retreated4, at times catastrophically5. This decay supports hypotheses of thermal limits of viability for ice shelves via surface melt forcing3, 5, 6. Here we use a polar-adapted regional climate model7 and satellite observations8 to quantify the nonlinear relationship between surface melting and summer air temperature. Combining observations and multimodel simulations, we examine melt evolution and intensification before observed ice shelf collapse on the Antarctic Peninsula. We then assess the twenty-first-century evolution of surface melt across Antarctica under intermediate and high emissions climate scenarios. Our projections reveal a scenario-independent doubling of Antarctic-wide melt by 2050. Between 2050 and 2100, however, significant divergence in melt occurs between the two climate scenarios. Under the high emissions pathway by 2100, melt on several ice shelves approaches or surpasses intensities that have historically been associated with ice shelf collapse, at least on the northeast Antarctic Peninsula.

It is claimed that the Peninsula is one of the fastest warming places on Earth.
The reality is that it stopped warming more than 30 yrs ago (though there was some warming prior to that).
https://notalotofpeopleknowthat.wordpress.com/2015/05/15/antarctic-peninsula-stopped-warming-30-years-ago/
Indeed. The fast warming was due to more stored heat ventilating from the oceans during the winter when the winds suppressed sea ice extent in that region. Rapid warming was not observed in the summer when sea ice is normally absent. The winds will soon be shifting and we will see rapid cooling.
In looking at your data, temperatures at Rothera Point have gone up since the 70’s, Faraday since the 50s,
Odd temperature differences between Rothera and Faraday. In 1980, Rothera, 311 km south of Faraday, recorded an annual mean temperature of -8.7°C, Faraday recorded an annual mean of -6.1°C. In 1987, Rothera -6.2°C, Faraday -5.9°C.
So much for the theory of anomalies. You very obviously cannot use anomalies to fill in missing data in Antarctica.
Billy Liar,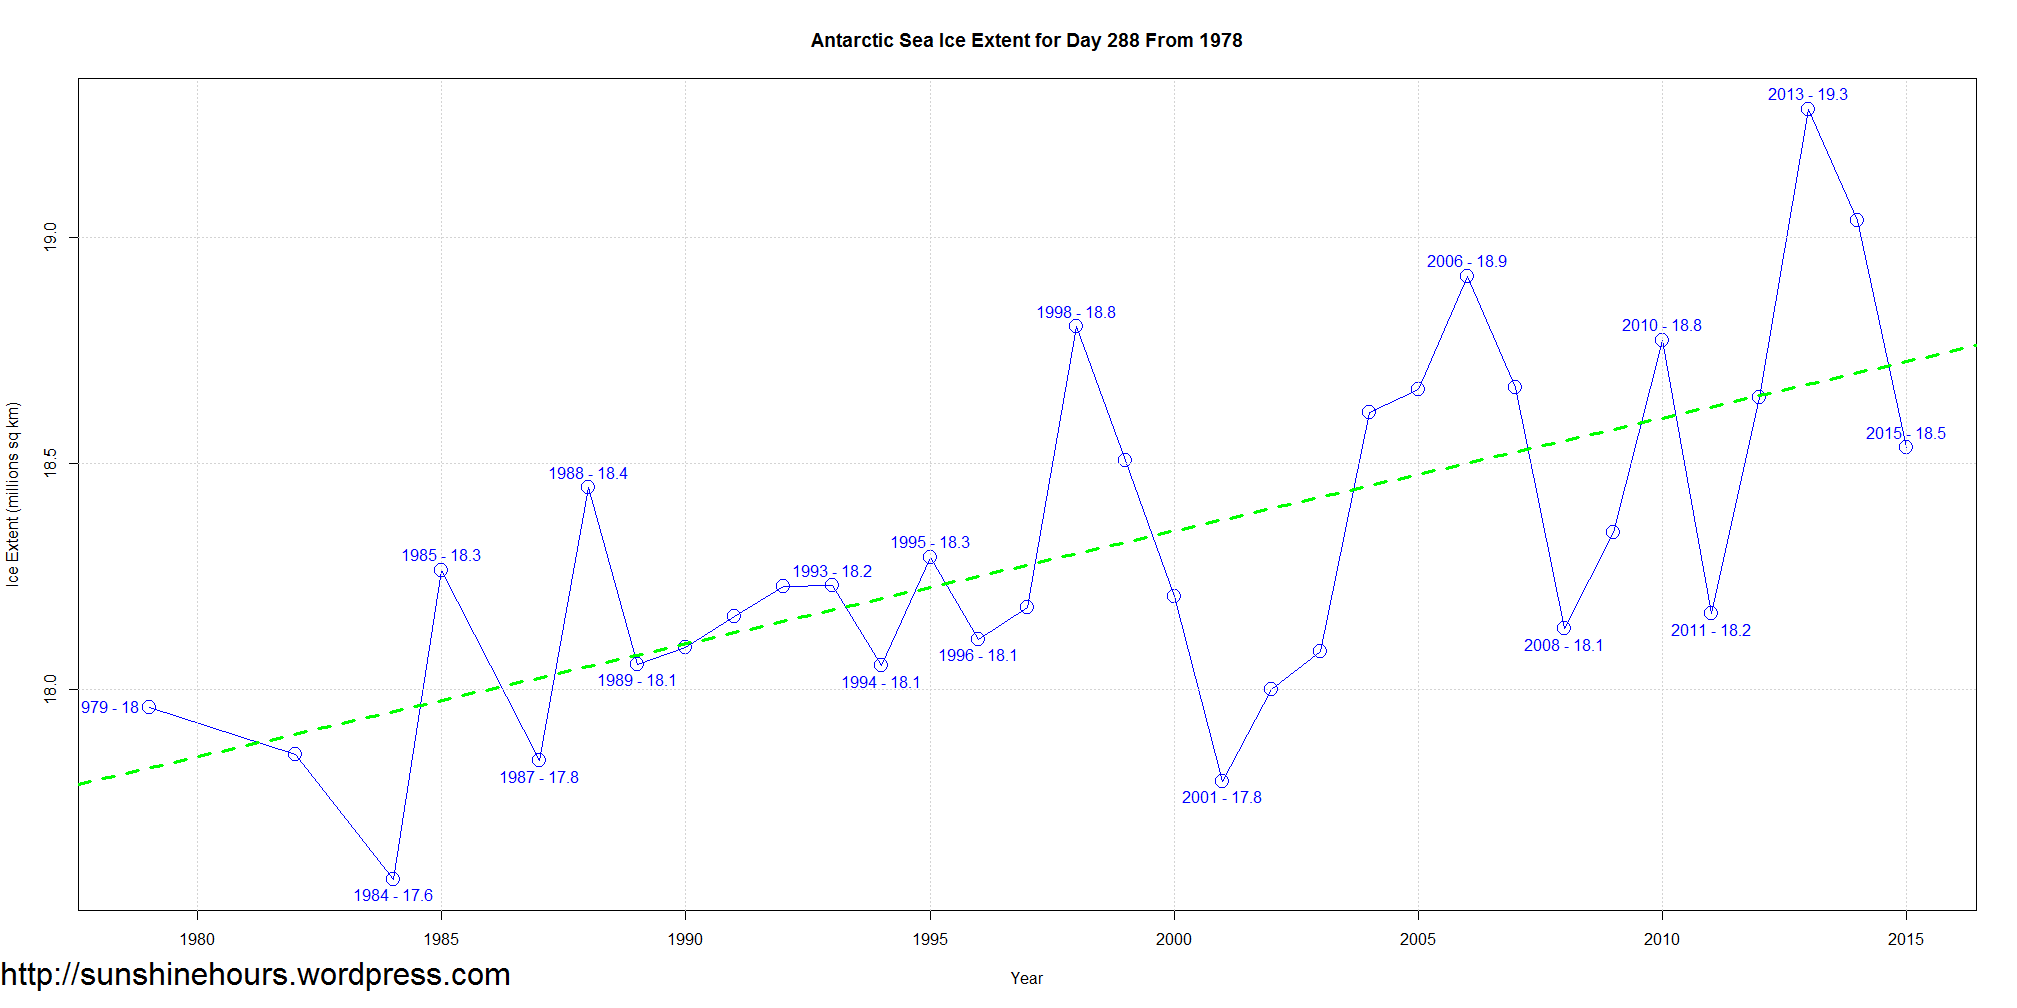
Correct. But tiny locations like Rothera Point are all Chris has.
Here is what ‘s been happening in Antarctica:
[click in chart to embiggen]
Anywhere the warmist interest lands is “warming twice as fast as the average”, apparently. There have been so many places warming at twice the average that there must be a few places getting rapidly colder to keep the average stable.
Paul: Surely you are joking. I went to your site and saw highly variable temperature records that appear to have a long-term warming trend in the longest records. It isn’t clear whether or not the confidence interval includes zero. There appears to be little auto-correlation, so a confidence interval show be straight-forward.
The shorter-term features you discuss – the last decade, the shorter records, the apparent jump in temperature followed by a plateau – can’t be distinguished from the large background variability. A proper statistical analysis is unlikely to produce any significant breaks in the long-term trend.
The phenomena you discuss may be have occurred, but this data is too noisy to demonstrate their existence.
I programmed my puter model to show a given amount of ice-melt for a given temperature rise for a given amount of CO2 in the atmosphere, & it says we’re all goin to hell in a hand cart! QED!
Have any of these people shown how much ice was present north or south during the last four interglacials, which were warmer than today?
@ Alan,The easy way out, it used to be “going to hell in a hand basket”, the wheels make it to easy!
or TOOOOOOOOO easy!
He meant, “making it to the easy area”.
Heck with the previous interglacials, how about the 5 warm periods over the last 5000 years, each of which was 1 to 10C warmer than it is at present.
This is true, but I think warmistas would baulk at accepting so recent warm periods as the Minoan & Roman & MWP periods.
The dictionary called and would like to use this example as an update for confirmation bias…
Alan, did your puter model also use the intermediate and high emissions climate scenarios, like these programmers did?
We then assess the twenty-first-century evolution of surface melt across Antarctica under intermediate and high emissions climate scenarios.
You know the scenarios which the current actual temperatures are below the significance range.
For example, the best estimate for the low scenario (B1) is 1.8°C (likely range is 1.1°C to 2.9°C), and the best estimate for the high scenario (A1FI) is 4.0°C (likely range is 2.4°C to 6.4°C). Although these projections are broadly consistent with the span quoted in the TAR (1.4°C to 5.8°C), they are not directly comparable Climate Change 2007: Working Group I: The Physical Science Basis
https://www.ipcc.ch/publications_and_data/ar4/wg1/en/spmsspm-projections-of.html
DD More, those numbers are I think for GMT. For the polar regions I understand the predictions are higher. Of course emissions are already above their high predictions, and results below their lowest emission scenarios. Of course if you ignore the observations and instead go to the one area in Antarctica where volcanism is known to be very active, and then base your assumptions from there, and the rest from the ever more wrong models, you get these scary numbers and more government money.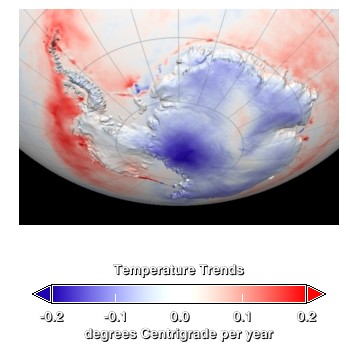
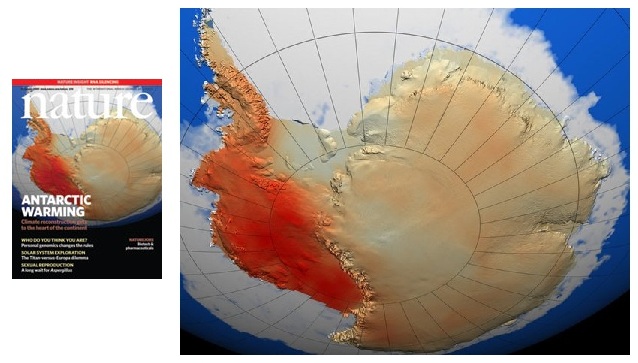
Of course they had to already “adjust” the cooling in Antarctica to atmospheric warming in Antarctica.
“Ten years ago, Gavin reported that Antarctica was cooling had “cooled significantly.”
(Quoting Gavin, “While most of the Earth warmed rapidly during recent decades, surface temperatures decreased SIGNIFICANTLY over most of Antarctica.
“That didn’t fit the needs of the White House, so Eric Steig simply rewrote Antarctica’s history in 2009, and turned “significant cooling” into “warming.”
Above credit to Tony Heller here…https://stevengoddard.wordpress.com/2015/04/04/rewriting-antarcticas-past/
Sooner or later even CAGW proponents that visit here will feel to dirty to continue supporting this scam.
Fabricated again and satellites disagree with the changes so no credibility in them whats so ever.
Now that’s good climate science.
It can’t begin to be tested until 2050 – after the authors retire.
Prof Peter Wadhams should look and learn.
Is it my imagination, or are the alarmists ramping up their screeching leading up to COP21? Seems every five minutes there’s another young “scientist” hurling a hastily-conjured scare story into the fray? There is NOTHING of substance in any of this. Just bizarre conjecture. Press release fodder.
It is not your imagination.
It is a carefully orchestrated ‘climate of fear’ campaign.
The Left wants control of energy, because he who controls energy, controls the Western world…
That is an excellent thought; “Climate Change” is more aptly titled “Climate Fear”.
Or maybe even more aptly titled “Climate Fear due to Lack of Common Sense”.
How about “State of Fear?”
https://www.google.com/search?q=state+of+fear&ie=utf-8&oe=utf-8
How about Cape Fear (in California, no less!)?
@ Mike Bromley.
Bulls eye.
To Alx: the book State of Fear, precisely agrees with your premis.
I don’t take this kind of crap seriously unless they put it into units of Hiroshima bomb equivalents.
Of course they are pushing out propaganda in the run up to COP. They are trying to stir the public into putting pressure on their representatives to sign the document to close down western economies. Unfortunately (or maybe not) the public are generally not interested as they have more important concerns. And China and India will not sign so it will just be so much hot air, carbon footprint and fossil fuel use for nothing.
Regarding the final quote in the press release – is there any field of science, other than climate studies, that calls model output “data”?
+1
+1
“…is there any field of science, other than climate studies, that calls model output “data”?”
Nope.
Most real scientists know what words mean.
It’s quite demonstrable that the ability to predict future weather has an enormous error rate at even 72 hours out, let alone 85 years. The common man, who reads The New York Post as opposed to “peer-reviewed” BS, understands this well. These gooneybirds are now preaching only to the fellow members of their increasingly shrill and unbelievable choir.
Weather =/= climate.
I believe that climate “science” is also the only field that believes that the plural of anecdote is data.
Doesn’t the temperature need to be above zero for ice to melt?
Not in the sea
But the paper talked about “surface melting,” didn’t it? (The only place that occurs is the peninsula.)
Rogerknights, you are correct about the surface thing. This melting occurs mostly in December and January, during Antarctic summer. However, it does not only occur on the peninsular but all around the continent to some extent.
http://lgge.osug.fr/~picard/melting/
Obviously not in Antarctica…..
Remember: As for the CO2 hypothesis in particular, the IPCC’s Laws of Nature are not supposed to act similarly on the North and South poles: While ice in the Arctic will melt above zero (so far/until it starts freezing again; then it will start freezing at 4 above zero according to adjusted IPCC model assumptions), in Antarctica the ice will melt from 4C below zero (according to properly and correctly adjusted assumptions applied in the same models)
Best regards,
dr. Chronos Y. Brainwater, D.o.W. (Doctor of the World)
Now that you ask, not really. The ice sheet can loose mass even if the air temperature is below 0 centigrade.
Ice may flow and melt elsewhere; or it may melt from below, or it may dry up into air. You know what happens to wet underwear on wire in -30C? It dries up, even if it first freezes.
“You know what happens to wet underwear on wire in -30C? It dries up, even if it first freezes.”
Oh, haha, silly me.
I thought you were going to say “It freezes solid and becomes a permanent part of your body if you undress to take it off”. Then you have the tongue-frozen-to-light-post dilemma, times umpteen bajillion.
Oops!
If you think pulling that tongue off a frozen lamp post hurts…just wait until you have underwear frozen onto your gentles!
And as you work your way around to the back…well…
Ice losing mass below freezing is due to sublimation and/or ablation not melting. Sublimation is however an endothermic reaction which requires a heat input. Sublimation at very much below zero C is a pretty slow process at normal atmospheric pressure., freeze drying processes usually happen at reduced pressure because of this.
Do the things you mention change depending on how far below freezing it is? That’s the key thing!
I understand that apart from the peninsula, Antarctic never gets above freezing. Has anyone got data to the contrary?
Cheers
Roger
http://www.rogerfromnewzealand.wordpress.com
I can melt ice at a specific frequency, if the air warms it is only because of heat transfer from the melting ice. And or water vapor that is in the air… depending on temperature and sometimes pressure.
OMG – I never even knew that bristlecone pines grew in Antarctica /sarc
Bristlecone pines were pushed out of the Antarctic by palm trees about 20 years ago. Didn’t you see the pictures? LOL!
“climate model simulations” Did they use the current set of CIMP models that are wildly inacurrate or did they cook up their own?
oooh, I like homebrew…
+1.0001
Shouldn’t that be ” Chimp ” models ???? Probably more accurate !!!!
“Our results illustrate just how rapidly melting in Antarctica can intensify in a warming climate,”
How can you have “results” 85 years from now? Results are tangible, models are not!
add this: http://onlinelibrary.wiley.com/doi/10.1029/2011GL050207/abstract
is this a cotradiction?
contradiction, sorry
You beauty – just in time for Paris.
We will be inundated with the doomsday stuff for the next 6 weeks.
How many times in the past, especially with a run up to some earth saving rendezvous of bureaucrats, have we seen this increasing crescendo of doom? As the day approaches the publications go from it could be bad to it’s really, really bad end of times stuff.
When do the last chance to save the planet and we are working very hard (over a fine dinner) to do so choruses start?
As Paris approaches, I wonder if Antony could be persuaded to run a sweepstake on ‘how many days we have to save the planet?’ Would be fun!
. . . and HOW many hits has WUWT gotten, again? 😉 People are reading skeptical POV and most have figured this political football out. The only ones I’ve seen still wringing their hands about it are the BoBo’s (ref: David Brooks), educated beyond their intelligence, who believe everything wholesale that NPR feeds into their heads, which they’ve flattened by standing on them at yoga class.
Intensity? Ahh … excellent choice of wording. It will be pretty intense when the ice shelf collapses, but the melting of land ice will have far greater intensity. I can hardly wait!
Perhaps this should be the tag line for climate predictions, err speculations.
“I can’t wait”
They can even have a theme song:
Those are the modelling scenarios that have been completely trashed by reality, I recall. The only one that tracks reality with any accuracy is that one which assumes all CO2 emissions stopped 20 years ago and. Shame they didn’t bother doing a quick literature review before choosing which scenario to use. In any other science that would have been picked up in peer review, but this is Nature, apparently the has-been of scientific journals.
We’re doomed – unless. Climate policy can save us. COP21 to the rescue!
Qu’elle coincidence.
What a disgrace to a once venerable institution.
At the moment Nature valued simulation above observation, Nature became a SciFi comic
Can these models be trusted? Especially given their rather poor track record on:
Arctic sea ice:
“In this study we show that IPCC climate models underestimate the observed thinning trend by a factor of almost 4 on average and fail to capture the associated accelerated motion.”
http://onlinelibrary.wiley.com/doi/10.1029/2011JC007110/full
Sea level rise:
“Since the beginning of satellite measurements, sea level has risen about 80 per cent faster, at 3.4 millimetres per year, than the average IPCC model projection of 1.9 millimetres per year”
http://www.nature.com/climate/2010/1004/full/climate.2010.29.html?-session=user_pref:42F949BC0f43105923ONnS2F9B04
Mr. Idiot,
Surely you can’t be serious?
Don’t you have any self-respect?
Was that a rhetorical question?
Yup!
Good catch 🙂
I agree …….you’re an idiot !!!!
Sea levels have been rising at around 1.8 mm per year for at least the last 100 years and show no sign of acceleration. This is well documented in the IPCC Climate Change Working Group I report published in 2007
The piece in Nature you reference is speculative not fact based and seems to follow the illogical viewpoint that model outputs are better than actual measurements.
“Sea levels have been rising at around 1.8 mm per year for at least the last 100 years and show no sign of acceleration.”
Ooops! Your assertion becomes no more real by repitition:
I’ve explained before that the Church and White paper has been debunked. But trying to teach an idiot something is like trying to teach a dog algebra. Can’t be done. Anyone who believes that sea level rise is accelerating is an idiot.
Only an idiot would accept model alarmists Church and White.
http://realclimatescience.com/wp-content/uploads/2015/10/ScreenHunter_10774-Oct.-11-05.18.gif
Even the journal Nature shows the raw data (Left bar graph) versus the “adjusted” nonsense (R.):
http://www.nature.com/nclimate/journal/v4/n5/carousel/nclimate2159-f1.jpg
Furthermore, this peer reviewed paper shows that sea level rise is actually decelerating.
Finally, NASA has “adjusted” its old sea level graph. Now it shows a scary rise:
http://realclimatescience.com/wp-content/uploads/2015/10/ScreenHunter_3444-Oct.-12-11.56.gif
But idiots will still believe whatever they want to believe, no matter how much it’s been ‘adjusted’.
Dbstealey says: “Furthermore, this peer reviewed paper shows that sea level rise is actually decelerating.”
…
Unfortunately dbstealey did not read the conclusions of that paper.
On page 416, in the “Conclusions” of that paper, it says:
“Our analyses do not indicate acceleration in sea level in U.S.
tide gauge records during the 20th century”
Note: in U.S tide gauge records”
..
It says nothing about global sea levels. Although dbstealey is correct in his statement, the paper he cites does not apply to global sea levels
Steve Jones,
Thanx for your assertion. But multiple tide gauges are more accurate than GRACE for measureing MSL. Satellite sea level measurements have been heavily criticized because the error bars are far wider than the small changes claimed.
Next, Steve Jones says:
It says nothing about global sea levels.
From the paper’s conclusion:
Our analyses do not indicate acceleration in sea level in U.S. tide gauge records during the 20th century. Instead, for each time period we consider, the records show small decelerations that are consistent with a number of earlier studies of worldwide-gauge records… It is essential that investigations continue to address why this worldwide-temperature increase has not produced acceleration of global sea level over the past 100 years, and indeed why global sea level has possibly decelerated for at least the last 80 years.
“De-celeration” in global sea level rise. If you don’t like it, go argue with the authors.
Now that the Arctic ice scare has been debunked, the alarmist crowd is trying to shift the scare to ‘accelerating’ sea level rises. But as posted repeatedly here by others, there are MSL markers carved into rock 174 years ago that show no rise in SL, and two century old Royal Navy charts from around the world that are still in use, because they show a fathom (6 feet) depth still remains six feet deep after 2 centuries; no more and no less.
Real world, empirical evidence, versus assertions. No contest.
“in U.S. tide gauge records ”
…
“in U.S. tide gauge records ”
…
The paper does not make any conclusion with regard to global sea levels.
…
Please do not mistake U.S. time gauge records as measuring global sea levels.
Wake up, Steve. Try to read it without your desperate hope for a “gotcha!” That explicit point was in the paper’s conclusions. I bolded the relevant words: “Global” sea levels. So your ‘gotcha’ turned around and bit you.
The satellite error bars were also addressed. Try reading carefully, you won’t be so embarrassed.
PS there are other satellites besides GRACE that use both radar and laser altimeters to measure sea levels.
I notice you forgot to bold the word “possibly” in … “indeed why global sea level has possibly decelerated “
Why not do as I suggested, and contact the authors? Go argue with them, because it’s clear you’re fixated on me, bird-dogging my comments like you’ve been doing for the past several days. You always start arguments you have no hope of winning.
It’s a sad thing when you keep digging your alarmist hole deeper, especially on this subject. Global sea levels are notoriously difficult to measure. That’s why the authors wrote “possibly decelerating”. But note that they did not write that sea levels are “possibly accelerating”. All the evidence cited shows deceleration of the sea level rise. So go tell them they’re wrong, maybe they’ll agree. I don’t.
I don’t have a problem with the authors, the problem is that you did not carefully read the exact nature of the conclusions of the study, You need to find a better study , one that studies global tide gauges rather than simply studying U.S. tide gauges. The problem you have is that you are quoting misleading studies, whose real conclusions do not support what you think they support.
@Steve Jones:
In fact, I quoted the authors’ conclusions verbatim — which flatly contradict what you claimed. And I don’t have to “find a better study”, which of course means to try and find something you agree with. Do your own homework.
Finally, go tell the authors of the paper that they wrote a “misleading study”. Like me, they will laugh at you, if they respond at all.
What you’re impotently attempting is to claim that the global MSL rise is accelerating. But instead of posting verifiable, testable facts and evidence like the authors’ tide gauges, all you do is make baseless assertions and argue your beliefs as fact. I do not agree with your beliefs. And from the looks of other comments here, those readers disagree too.
There are blogs for folks like you. Astrology, religion, and Scientology come to mind. But this is the internet’s “Best Science” site; the one you’ve recently been denigrating. Here, we need convincing facts and evidence. So your assertions and your nitpicking words out of context just doesn’t cut it. That’s why you lose these arguments.
The authors did not claim that global sea levels were decelerating. They said, “and indeed why global sea level has possibly decelerated for at least the last 80 years.”
…
POSSIBLY.
I posted: “The paper does not make any conclusion with regard to global sea levels.”
…
My claim stands.
…
The authors did not write a misleading study. They looked at U.S. tide gauges.
…
However, your post “Furthermore, this peer reviewed paper shows that sea level rise is actually decelerating.” is misleading because it fails to mention that the paper does not make a claim to global sea levels.
Idiot…
U.S. tide gauge records can be from anywhere the U.S. has established a station to measure tides. Any territory, island, outpost, almost anywhere in the world.
Ooops…I meant that for Steve Jones
I placed this previously in a different thread.
No scientist on Earth knows how much extra igneous rocks in the oceans are raising sea levels, but likely more than GIA increases the basins. Volcanic eruptions under the oceans use up some space available for sea water by creating new islands and increasing the level of sea beds. If the planet stayed the same temperature for 10,000 years sea levels would still rise.
Why do they use satellite data recently compared with surface tide gauges for sea levels?
Only because it is showing higher sea level rate with a false GIA calculation, not taking the above into account. The tide gauge records are now not used recently in data because they don’t show a rise in sea levels for almost half of the data. Plenty regions showing a decline in sea levels and plenty are showing an increase, but overall not so much.
Example from tidal gauge at tuvalu, no sea level rise noticed there.
http://www.john-daly.com/press/tuvalu.gif
“The correction for glacial isostatic adjustment (GIA) accounts for the fact that the ocean basins are getting slightly larger since the end of the last glacial cycle. GIA is not caused by current glacier melt, but by the rebound of the Earth from the several kilometer thick ice sheets that covered much of North America and Europe around 20,000 years ago. Mantle material is still moving from under the oceans into previously glaciated regions on land. The effect is that currently some land surfaces are rising and some ocean bottoms are falling relative to the center of the Earth (the center of the reference frame of the satellite altimeter). Averaged over the global ocean surface, the mean rate of sea level change due to GIA is independently estimated from models at -0.3 mm/yr (Peltier, 2001, 2002, 2009; Peltier & Luthcke, 2009). The magnitude of this correction is small (smaller than the ±0.4 mm/yr uncertainty of the estimated GMSL rate), but the GIA uncertainty is at least 50 percent.”
The uncertainly is at least 100 percent because magma going into the oceans are slightly filling in the ocean basins.
Maybe I should keep it as “Idiot”.
Dahlquist
…
Look at Table 1 on page 412 of the study.
Here is a list of U.S. NOAA tide gauge stations globally.
Anomaly Count/Year
Search US Stations
Pacific Ocean
Johnston Atoll
Midway Atoll
Apra Harbor, Guam
Pago Pago, American Samoa
Kwajalein
Chuuk
Wake Island
West Coast
Alaska
Washington
Oregon
California
Hawaii
Gulf Coast
Texas
Louisiana
Mississippi
Alabama
Florida
East Coast
Maine
Massachusetts
Rhode Island
Connecticut
New York
New Jersey
Delaware
Pennsylvania
Maryland
District of Columbia
Virginia
North Carolina
South Carolina
Georgia
Florida
Atlantic Ocean
Bermuda, Atlantic Ocean
Guantanamo Bay, Cuba
Lime Tree Bay
Charlotte Amalie
San Juan
Magueyes Island
Thank you for that information Dahlquist, but again, I refer you to Table 1, page 412 of http://www.jcronline.org/doi/pdf/10.2112/JCOASTRES-D-10-00157.1
…
It lists the gauges they used for the study.
Steve,
What exactly are you trying to point out? Please re state your position and what the argument is about/ Maybe that will clear things up.
[Snip. Sockpuppetry. ~mod.]
Steve Jones keeps digging his hole:
…You need a sample of tide gauges from around the entire planet
The paper specifically references global tide gauges. This is the third time I’ve pointed that out, but some folks are just too closed-minded to get it.
***
Dahlquist,
Thanks for that list. Tide gauges are more accurate when taken globally en masse than satellite SL measurements. With enough gauges providing data from around the globe, land rising and subsidence averages out (if either of those changes went in one direction or the other, the globe would have an expanding or contracting diameter).
Before his untimely passing, the late, great John Daly posted an article on global sea levels. Well worth rerading:
http://www.john-daly.com/deadisle/index.htm
Part 2:
http://www.john-daly.com/deadisle/index.htm
And:
http://www.john-daly.com/tar-2000/ch-5.htm
And:
http://www.john-daly.com/deadisle/hobart-msl.htm
Deconstructing satellite SL measurements:
http://www.john-daly.com/altimetry/topex.htm
More:
http://www.john-daly.com/ges/msl-rept.htm
An article on the 1841 MSL benchmark:
http://www.john-daly.com/ges/appendix.htm
More on sea levels:
http://www.john-daly.com/refugees
http://www.john-daly.com/press/press-00a.htm#Rollercoaster
http://www.john-daly.com/peerrev1.htm
More here:
https://www.google.com/search?num=100&as_sitesearch=john-daly.com&as_q=sea+level&btn=Go&gws_rd=ssl
John Daly was well ahead of the curve. His articles have yet to be refuted, even after 15 years they have stood the test of time. It’s a lot to read at one time, but a very handy reference. And there’s more; these are just the sea level articles.
http://i.dailymail.co.uk/i/pix/2010/07/15/article-0-0A73BAE6000005DC-625_468x286.jpg
[Snip. Sockpuppetry; one of many fake names. ~mod.]
Steve Jones
Here is a study abstract by some supporters of CAGW who concur that there has been a decrease in sea level rise since 2004. Other than that, I don’t know the issue well enough to make a good argument about it because there is a lot of conflicting information. But I do not think the Earth is warming outside of natural variability. Arguing about the sea level is a muddled area and at this point, with all the various inconsistent info, is not worth it.
Thanks..
Dahlquist
The rate of sea-level rise
Anny Cazenave, Habib-Boubacar Dieng, Benoit Meyssignac, Karina von Schuckmann, Bertrand Decharme & Etienne Berthier
Nature Climate Change (2014) Doi:10.1038/Nclimate2159 3 March 2014
[note bolding, italics, and comments added] Abstract: Present-day sea-level rise is a major indicator of climate change1. Since the early 1990s, sea level rose at a mean rate of ~3.1 mm yr−1 (refs 2, 3). However, over the last decade a slowdown of this rate, of about 30%, has been recorded4, 5, 6, 7, 8. It coincides with a plateau in Earth’s mean surface temperature evolution, known as the recent pause in warming1, 9, 10, 11, 12. Here we present an analysis based on sea-level data from the altimetry record of the past ~20 years that separates interannual natural variability in sea level from the longer-term change probably related to anthropogenic global warming. The most prominent signature in the global mean sea level interannual variability is caused by El Niño–Southern Oscillation, through its impact on the global water cycle13, 14,15, 16. We find that when correcting [using the magic of models and unwarranted assumptions] for interannual variability, the past decade’s slowdown of the global mean sea level disappears, leading to a similar rate of sea-level rise (of 3.3 ± 0.4 mm yr−1) during the first and second decade of the altimetry era. Our results confirm the need for quantifying and further removing from the climate records the short-term natural climate variability if one wants to extract the global warming signal10
• Methods• References• Acknowledgements• Author information• Supplementary information
Precisely estimating present-day sea-level rise caused by anthropogenic global warming is a major issue that allows assessment of the process-based models developed for projecting future sea level1. Sea-level rise is indeed one of the most threatening consequences of ongoing global warming, in particular for low-lying coastal areas that are expected to become more vulnerable to flooding and land loss. As these areas often have dense populations, important infrastructures and high-value agricultural and bio-diverse land, significant impacts such as increasingly costly flooding or loss of freshwater supply are expected, posing a risk to stability and security17, 18. However, sea level also responds to natural climate variability, producing noise in the record that hampers detection of the global warming signal. Trends of the satellite altimetry-based global mean sea level (GMSL) are computed over two periods: the period 1994–2002 and the period 2003–2011 of the observed slowdown (Fig. 1a). GMSL time series from five prominent groups processing satellite altimetry data for the global ocean are considered (Methods). During recent years (2003–2011), the GMSL rate was significantly lower than during the 1990s (average of 2.4 mm yr−1 versus 3.5 mm yr−1). This is observed by all processing groups (Fig. 1a). The temporal evolution of the GMSL rate (computed over five-year-long moving windows, starting in 1994 and shifted by one year) was nearly constant during the 1990s, whereas the rate clearly decreased by ~30% after ~2003 (Fig. 2a). This decreasing GMSL rate coincides with the pause observed over the last decade in the rate of Earth’s global mean surface temperature increase9, 10, an observation exploited [very unscientific choice of words] by climate sceptics to refute global warming and its attribution to a steadily rising rate of greenhouse gases in the atmosphere. It has been suggested that this so-called global warming hiatus11 results from El Niño–Southern Oscillation- (ENSO-) related natural variability of the climate system10 and is tied to La Niña-related cooling of the equatorial Pacific surface11, 12. In effect, following the major El Niño of 1997/1998, the past decade has favoured La Niña episodes (that is, ENSO cold phases, reported as sometimes more frequent and more intensive than the warm El Niño events, a sign of ENSO asymmetry19). The interannual (that is, detrended) GMSL record of the altimetry era seems to be closely related to ENSO, with positive/negative sea-level anomalies observed during El Niño/La Niña events2. Recent studies have shown that the short-term fluctuations in the altimetry-based GMSL are mainly due to variations in global land water storage (mostly in the tropics), with a tendency for land water deficit (and temporary increase of the GMSL) during El Niño events13, 14and the opposite during La Niña15, 16. This directly results from rainfall excess over tropical oceans (mostly the Pacific Ocean) and rainfall deficit over land (mostly the tropics) during an El Niño20event. The opposite situation prevails during La Niña. The succession of La Niña episodes during recent years has led to temporary negative anomalies of several millimetres in the GMSL (ref. 15), possibly causing the apparent reduction of the GMSL rate of the past decade. This reduction has motivated the present study. From seasonal to centennial time scales, the two main contributions to GMSL variability and change come from ocean thermal expansion and ocean mass. Owing to water mass conservation in the climate system, sources of global ocean mass variations are land ice masses, land water storage and atmospheric water vapour content. Studies have shown that ENSO-driven interannual variability in the global water cycle strongly impacts land water storage12, 13, 14,15 and atmospheric water vapour21, hence ocean mass and GMSL.
Figure 1: GMSL trends during the 1994–2002 and 2003–2011 periods.
a, GMSL trends computed over two time spans (January 1994–December 2002 and January 2003–December 2011) using satellite altimetry data from five processing groups (see Methods for data sources). The mean GMSL trend (average of the five data sets) is also shown. b, Same as a but after correcting the GMSL for the mass and thermosteric interannual variability (nominal case). Corrected means that the interannual variability due to the water cycle and thermal expansion are quantitatively removed from each original GMSL time series using data as described in the text. Black vertical bars represent the 0.4 mm yr−1 uncertainty (ref. 2).
Full size image (98 KB)
Figures index
Next
Figure 2: GMSL rate over five-year-long moving windows.
a, Temporal evolution of the GMSL rate computed over five-year-long moving windows shifted by one year (start date: 1994). b, Temporal evolution of the corrected GMSL rate (nominal case) computed over five-year-long moving windows shifted by one year (start date: 1994). GMSL data from each of the five processing groups are shown.
Full size image (162 KB)
Previous
Figures index
Next
Here, we quantitatively estimate these interannual water mass contributions and remove them from the altimetry-based GMSL record, to isolate the longer-term signal caused by global warming (here, interannual refers to a temporal window in the range of one to five years, mainly ENSO-related, but not exclusively). To do this, two approaches are possible: estimate interannual land water storage plus atmospheric water vapour contributions; or directly estimate the interannual variability in global ocean mass. The Gravity Recovery and Climate Experiment (GRACE) space mission directly measures ocean mass and land water storage variations but only since ~2003. Before GRACE, neither ocean mass nor land water storage variations can be directly computed from observations. However, the use of hydrological models developed for climate studies and water resource monitoring22 allows us to estimate the land water contribution since the beginning of the high-precision altimetry record. Both approaches are considered here. As a nominal case, we estimate the interannual land water contribution from a hydrological model (accounting for the atmospheric water vapour component) over the whole analysis time span (1994–2011). We also present as Supplementary Information three hybrid cases where the mass component is estimated as in the nominal case over 1994–2002 but replaced by GRACE data as of 2003. Data and models used to obtain the mass component are presented in the Methods and Supplementary Information. Detrended altimetry-based GMSL records and interannual mass components over the January 1994–December 2011 time span are shown in Fig. 3 (nominal case) and Supplementary Fig. 3(hybrid case 1; in the following, figures shown as Supplementary Information correspond to hybrid case 1). As illustrated in Fig. 3 and Supplementary Fig. 3, the interannual GMSL signal mainly (but not exclusively) results from ENSO-driven water mass redistributions among the climate system reservoirs, with strong positive and negative GMSL anomalies during the 1997/1998 El Niño and 2011 La Niña, respectively. This raises two questions: what is the impact of ENSO-related (or, more generally, interannual) variability on the estimation of the GMSL trend; and can we separate the interannual natural variability from the longer-term global warming trend in the GMSL record?
Figure 3: Detrended GMSL, interannual mass and ‘mass plus thermosteric’ components.
Black curve: mean detrended GMSL time series (average of the five satellite altimetry data sets) from January 1994–December 2011 and associated uncertainty (in grey; based on the dispersion of each time series around the mean). Light blue curve: interannual mass component based on the ISBA/TRIP hydrological model for land water storage plus atmospheric water vapour component over January 1994–December 2011. The red curve is the sum of the interannual mass and thermosteric components. This is the signal removed from the original GMSL time series (nominal case). Vertical bars represent the uncertainty of the monthly mass estimate (of 1.5 mm; refs 22, 30; light blue bar) and monthly total contribution (mass plus thermosteric components; of 2.2 mm; refs 22, 28, 29, 30; red bar).
Full size image (247 KB)
Previous
Figures index
To answer these questions we subtracted the interannual mass and thermosteric components from the GMSL record. Although the short-term GMSL fluctuations are mostly related to the global water cycle (Fig. 3 and Supplementary Fig. 3), thermal expansion also slightly contributes. Thus we also removed short-term variations in thermal expansion from the GMSL record (see Methods for information about the ocean temperature data used to compute thermal expansion and procedure applied to extract the corresponding interannual signal). Note that land ice also displays interannual mass variability1. However, adequate data to quantify it globally and for the whole altimetry period are presently lacking. The sum of interannual mass plus thermosteric components is also shown in Fig. 3 and Supplementary Fig. 3, for both nominal and hybrid case 1. It is this signal that is removed from the GMSL record over the altimetry period. We recomputed the rate of the corrected GMSL time series over the same five-year-long moving windows (shifted by one year) as done previously. The temporal evolution of the corrected GMSL rate is shown in Fig. 2b and Supplementary Fig. 2b. The decreasing rate seen initially over the past decade has disappeared [it’s magic!]: the rate is now almost constant with time. Fig. 1b and Supplementary Fig. 1b show the corrected GMSL rates for the same two nine-year-long time spans as above, for each of the five altimetry data sets. The mean rate is also shown. The corrected mean rate now amounts to 3.3 ± 0.1 mm yr−1 over the two time intervals. The 0.1 mm yr−1 uncertainty is the formal error deduced from the dispersion around the mean. A more realistic uncertainty representing systematic errors affecting the altimetry-based GMSL rate (for example, owing to geophysical corrections applied to the altimetry data, and instrumental bias and drifts) would be rather closer to 0.4 mm yr−1 (ref. 2). However, this would not change our finding.
The result reported here shows that when removing from the GMSL time series the interannual variability mostly due to exchange of water between oceans, atmosphere and continents, with a smaller contribution from thermal expansion, there is no rate difference between the 1990s and the 2000s: the GMSL has almost linearly increased during the past 20 years. Although no GMSL acceleration is observed over this short time span, our result clearly advocates for no recent slowdown in global warming.[bogus conclusion]
Although it has been suggested that several decades of satellite altimetry-based GMSL would be needed to isolate the long-term global warming signal6, our result also shows that this may be already achievable by removing the (mainly ENSO-driven) interannual variability, a procedure that enhances the signal-to-noise ratio, as previously shown for the Earth’s global mean surface temperature evolution10. At present, a persistent positive energy imbalance between the amount of sunlight absorbed by Earth and the thermal radiation back to space is observed1, 8, 9, 12, 23. [No outgoing longwave IR radiation to space has increased over the past 62 years] The term missing energy9 is related to an apparent inconsistency between interannual variations in the net radiation imbalance inferred from satellite measurements and upper-ocean heating rate from in situ measurements9. Although progress has been achieved and inconsistencies reduced24, the puzzle of the missing energy remains12, raising the question of where the extra heat absorbed by the Earth is going9, 12. The results presented here will further encourage this debate as they underline the enigma between the observed plateau in Earth’s mean surface temperature and continued rise in the GMSL. The larger GMSL rate calculated during the past decade than previously believed would be compatible with a significant warming contribution from the deep ocean. Such a possibility was raised by recent studies on the ocean heat content, suggesting that ~30% of the ocean warming has occurred below 700 m (ref. 25). This heat may be sequestered into the deep ocean during decades of large ocean–atmosphere natural variability26, highlighting once more, as shown here, the role of short-term natural variability on longer-term change, probably associated with global warming.
Ps. I need to cite Skeptical science website and hope they don’t mind my use of it to show how muddled the science of SLR is currently.
Thanks Skeptical science.
db,
Thanks for the John Daly references. I’ll look into then.
I threw in a SLR abstract from Skeptical Science by an AGW group which supports a decrease in SLR but shows how muddy the issues are around it. I threw the Sh*t at the fan. Maybe the smell will lead him off your tracks ; ) . Single minded arguers always lose sight of the bigger picture.
Dahlquist
Dahlquist, I started reading your post but stopped when I noticed “[note bolding, italics, and comments added] ”
…
I did this since what you posted is not verbatim from the original publication.
Steve,
Yes, i noted that it came from a post from Skeptical Science. Guess they picked it over, but it shows that the issue is muddy. I still don’t understand the point you are trying to make here. Please state your stance on AGW, the specifics of the point you are trying to make and where you think db is wrong and why this matters so much to you.
I do not understand it either. Maybe we are looking into it too far when you are simply stating that the study you are referring to is not complete because the study didn’t use data except from U.S. Data?
Steve
Also, as I stated, this issue and the science, to me, and my understanding of it so far, has not concluded anything about SLR to date. I have simply tried to provide some info for the issue here and to help you answer your question, since it hasn’t been answered to your satisfaction yet. I find that most all people here on WUWT will happily try to answer peoples questions, but that some people cannot accept the answers given, they don’t want to hear what they don’t agree with or oppose and some just enjoy arguing for the sake of arguing…and this usually comes with a poorly asked question without trying to help the askee with a better asked better stated question.
If you are serious, then ask your question in a better way or stop bothering.
Thanks
Dahlquist
Dahlquist,


You were right unthread when you noted that there are two idiots here.
One is fixated on anything I post. As you noted,
Idiot… U.S. tide gauge records can be from anywhere the U.S. has established a station to measure tides. Any territory, island, outpost, almost anywhere in the world.
If I had posted what you did, he would start arguing in his “say anything” mode. Such as:
I don’t have a problem with the authors,
Except…
the quoted study does not address global sea levels
But…
The paper does not make any conclusion with regard to global sea levels.
But…
the study used only U.S. tide gauges.
Wrong on all counts, as I referenced, chapter and verse. The paper specifically references global tide gauges. This is the fourth time I’ve pointed that out, but some folks are just too closed-minded to get it. That study compared U.S. tide gauges (which as you note are located worldwide) with other gauges worldwide. They all show the same thing: sea levels are decelerating. That is their conclusion, not mine. I simply question the narrative that SL rise is accelerating. If it is, show me solid evidence. But instead, much of the evidence shows this…
http://farm4.static.flickr.com/3206/3144596227_545227fbae_b.jpg
[click in chart to embiggen]
And recently Willis Eschenbach posted this satellite-based chart:
Holgate et al. shows that sometimes the SL rise is positive, sometimes it’s negative:
More satellite data, this from Envisat:
http://4.bp.blogspot.com/-TJRV2_iLHUg/TrZDLi9qcEI/AAAAAAAAB_0/eog1N-_P_gk/s1600/Searise.gif
Another Holgate graph, showing long term deceleration of SL rise:
http://icecap.us/images/uploads/Sea_Level_Holgate.jpg
And from the “Best Science” site:
Here we have another published, peer reviewed paper that concludes:
While we find that sea levels are rising in about a third of tide gauges, SLR is not a global phenomenon.
The authors’ conclusion is that two-thirds of global tide gauges show no SL rise, and that MSL is rising only about 1 mm per year, far below current numbers found in the media. Further, there has been no acceleration in the rise.
Next, this article in Nature shows that about 42% of the rise in SL is due to water use. They don’t attribute SL rise to emissions.
Finally, here is a good long term chart of the rise in sea levels:
http://3.bp.blogspot.com/_nOY5jaKJXHM/TGbHwwJPxhI/AAAAAAAABPs/GM0nE65s-Sg/s1600/past+mean+temp+co2+sea+level+variations.jpg
Conclusion: there is nothing either unusual or unprecedented happening WRT global sea levels. That is what the scientific evidence shows. Any fool can ‘say anything’, and argue by nitpicking, but the science is what interests most of us here. The climate alarmists’ narrative of ‘accelerating sea level rise’ has been debunked, just like their ‘disappearing Arctic ice’ scare. None of their predictions have come true, leaving the rest of us to wonder why they keep insisting there’s any ‘dangerous man-made global warming’ at all.
Finally, The paper specifically references global tide gauges. This is the fifth time I’ve pointed that out. But steve just keeps digging his hole deeper.
[Snip. Sockpuppetry. ~mod.]
Sorry Steve.
Not my argument and not my area of interest to the extent that I want to get into arguing with you.
O.K. so assume that 3.4mm/year is the current level of rise.
The figure 3.2mm/yr or 3.4mm/yr has formed the basis of many alarmist headlines such as “Sea level rise 80% faster than previously thought”, along with scary pictures of houses adrift on huge waves.
But this rate is a concern, because of what?
This higher figure of 3.4mm/yr is 3.4cm per decade or 34cm per century. A little more than the length of a 12″ ruler. Meanwhile in some regions of the world the land is sinking or rising faster than that.
And even assuming that you were to stand in some hypothetical fixed location and the sea was a static flat pond, then it would take a century of such a rise to come up to the top of a pair of wellies.
I genuinely can not figure out why anyone would be in the slightest bit concerned.
Thank you for reminding us why sea level rise is not having any noticeable impact on anything.
I like how the local idiot Steve has to go 4 and 5 years back to find something that agrees with his position.
Let’s completely forget the fact that recent years have completely refuted his religion.
This can happen. This might happen. Look at the words can and might. They are used as qualifiers. Passive verbs instead of action verbs. When one stretches the truth, the imperfections are apparent, to me and others.
With the Arctic ice growing again, doomsdayers have to move their attention to the Antarctic. After the record Antarctic ice coverage in 2013/2014, I’m sure they will start their graphs at 2014 to show the horrendous loss of ice due to global warming in the southern oceans. It’s like Whack-a-Mole.
WHACK-A-MOLE ….brilliant, best analogy so far IMO
dbstealey: I did not say it was impossible to extract a recovery signal from the data if you really wanted to – only that it would be difficult and would reveal a desire to do so. Despite the sea ice minimum being the second lowest in recent history and the current anomaly being -1.5 million sq kilometers you still manage to see that as a recovery since it is larger that the exceptional 2012 minumum.
Arctic ice is not growing again (unless you mean the normal winter ice increase). 2015 figures were lower than those for 2014 and 2013. http://nsidc.org/arcticseaicenews/
Wow, it’s looking really bad in the Arctic (lol). Prof. Wadhams – call your office!
http://nsidc.org/data/seaice_index/images/daily_images/N_timeseries.png
But it is higher than those from 2012, 2011, 2009, 2008, 2007 so overall Arctic Ice is ‘growing’ with respect to the levels of the last decade. The amount of multiyear ice is also increasing as well.
Here’s another plot showing the “Arctic death spiral”. Mark Serreze, call your office!
http://ocean.dmi.dk/arctic/plots/icecover/icecover_current.png
A blast from the past!
BBC News
Wednesday, 12 December 2007
By Jonathan Amos
Science reporter, BBC News, San Francisco
Arctic summers ice-free ‘by 2013’
Scientists in the US have presented one of the most dramatic forecasts yet for the disappearance of Arctic sea ice.
Their latest modelling studies indicate northern polar waters could be ice-free in summers within just 5-6 years.
Professor Wieslaw Maslowski told an American Geophysical Union meeting that previous projections had underestimated the processes now driving ice loss.
…
Chris,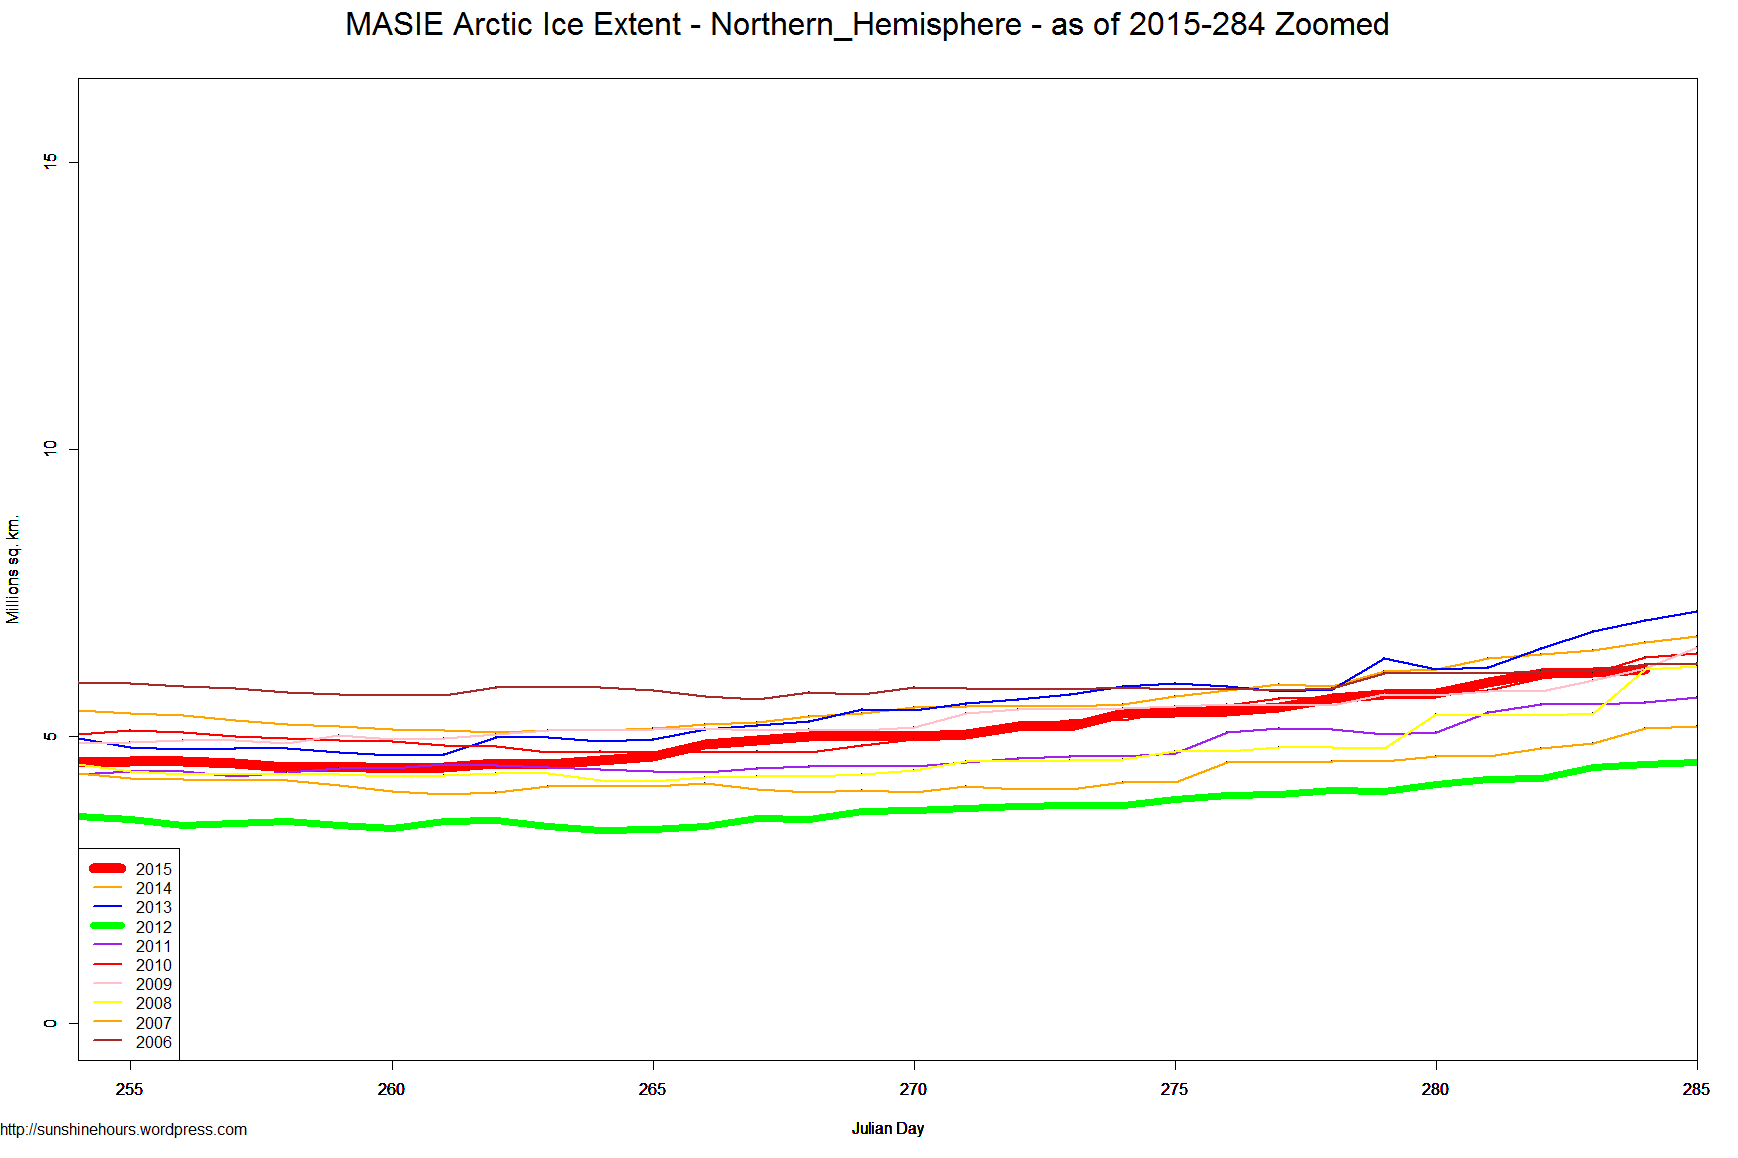
Arctic ice, same day of the year compared with previous years:
[click in chart to embiggen]
Where’s the problem? All we are observing is natural variability.
And the Antarctic (which contains ≈10X the volume of Arctic ice) is above average:
http://nsidc.org/data/seaice_index/images/daily_images/S_stddev_timeseries.png
Those are all natural cycles. Every alarmist prediction that Arctic ice would disappear has been wrong. When your side is 100.0% wrong, Chris, why are you still trying to promote the “ice” scare? You are hardly being honest about it.
And it is still way above the lows of 2015. Are you dumb enough to believe everything moves in steady curves?
If you look at the data on the sea ice page it would be very hard to conclude that Arctic sea ice was growing unless you really wanted to believe that. The trend is clearly down, the chart shown here shows it is frequenly below 2 sd of the 1981- 2010 mean. I see no evidence of growing. You need to be very selective to extract a growth signal from that data.
Now, the arguments about global sea levels look different – there seems to be evidence that the rates of increase levels are not rising, and some that they are. Point this out by all means. But to suggest recovery of Arctic sea ice in the face of evidence makes you appear to be selecting the data you use to fit your prefered theory.
Looks to me like sea ice is growing: ?w=640
http://36.media.tumblr.com/b835c0fc2b0a25b008f736419e545cf6/tumblr_inline_nnty350Cn51qij8k6_500.png
Arctic sea ice is growing year-over-year:
http://news.bbcimg.co.uk/media/images/79721000/jpg/_79721234_cryosatmap1.jpg
Arctic ice thickness is steadily increasing, too:
And despite the wild-eyed scare stories, Arctic ice only dipped for a few years. It is recovering now:
Run along back to SkS, ‘seaice’. I’m sure they have more misinformation for you to parrot here.
“Every alarmist prediction that Arctic ice would disappear has been wrong.” That is odd, because most of them predict ice loss in the future, so they can’t have been wrong yet. Only the most extreme predictions included 2015, and then as an early point in a range.
From Wikipedia, “A 2006 paper predicted “near ice-free September conditions by 2040″.[14] Overland & Wang (2009) predicted that there would be an ice-free Arctic in the summer by 2037.[15] The same year Boé et al. found that the Arctic will probably be ice-free in September before the end of the 21st century.[16] A follow-up study concluded with the possibility of major sea ice loss within a decade or two.[17] The IPCC AR5 (for at least one scenario) estimates an ice-free summer might occur around 2050.[2] The Third U.S. National Climate Assessment (NCA), released May 6, 2014, reports that the Arctic Ocean is expected to be ice free in summer before mid-century.” These are all quite a way in the future. There is no way that the claim “every alarmist predictions has been proved wrong” can be substantiated, unless you want to define alarmist as only those claims that predict ice-free arctic by 2015. That would leave all those others in the non-alarmist camp, so you might not want to do that.
Bill Marsh said “But it is higher than those from 2012, 2011, 2009, 2008, 2007 so overall Arctic Ice is ‘growing’ with respect to the levels of the last decade.”
From the NSIDC web site: “the seasonal daily minimum of 4.41 million square kilometers (1.70 million square miles) that was set on September 11, which was the fourth lowest in the satellite record”
So no, there are not 5 years that were lower than 2015, there were 3. NSIDC also says “The nine lowest September ice extents over the satellite record have all occurred in the last nine years.”
That is not a recovery. When the 9 lowest levels in the last 35 years have all occurred in the last 9 years, that is not a recovery.
dbstealey said: “Those are all natural cycles. Every alarmist prediction that Arctic ice would disappear has been wrong. When your side is 100.0% wrong, Chris, why are you still trying to promote the “ice” scare? You are hardly being honest about it.”
Except that isn’t true. Even the skeptic statement that Al Gore said the Arctic ice would be gone by 2013 is not true. Here’s exactly what he said: “Last September 21 (2007), as the Northern Hemisphere tilted away from the sun, scientists reported with unprecedented distress that the North Polar ice cap is “falling off a cliff.” One study estimated that it could be completely gone during summer in less than 22 years. Another new study, to be presented by U.S. Navy researchers later this week, warns it could happen in as little as 7 years.”
Al Gore quoted the conclusions of two papers, not 1. But skeptics always leave out the one that mentions 22 years. Why? Because that would prevent them from fully demonizing Al Gore – and we can’t have that! Here is another paper that states that summer ice will be gone by sometime between 2025 and 2050: http://www.livescience.com/28691-arctic-summer-ice-disappearing.html
So your statement that my side is 100% wrong on Arctic ice is false, db. Why are you not being honest?
Chris,
That’s a perfect example of a strawman argument. You brought up Algore, then started arguing about him. I never mentioned Algore, I said that the predictions that Arctic ice would disappear were wrong. All of them.
Here are just a few examples of disappearing Arctic ice predictions. There are lots more, and you know what, Chris? They were all wrong. Arctic ice has never come close to disappearing since the LIA. Deal with it.
You might also deal with the fact that you’re making your claims based on future events. You can predict the future now, huh? Quit wasting your time here, I recommend the stock market for someone as smart as you.
dbstealey, You continue to use the phrase “deal with it” as if your points are absolute and final. But you can’t even defend your position properly. You send me to a Steve Goddard link. He lists some projections from the past, and some future ones. One says the Arctic could be ice free by 2030. You really should work on your reading comprehension, db – that paper has not been disprover. Another says Arctic ice could be gone by 2016 +/- 3 years, which means some time between 2013 and 2019. Another oops for you.
And of course, your base position is 100% false. You said “Every alarmist prediction that Arctic ice would disappear has been wrong.” I gave you a prediction that Arctic summer ice will disappear. It’s an Arctic ice prediction, no different than one that said 2013.
Now, if you meant to say “the predictions that Arctic ice would be completely gone by now have been proven false”, that is correct (although many say things like “could be gone by 2013” – skeptics conveniently remove the could be phrasing so they can attack the prediction. But that is a completely different statement. So, once again, your base position is false. Deal with it.
Chris,
And this goes for ‘seaice’, too:
If the best you can do is argue that in the indefinite future every alarmist prediction hasn’t yet been disproven, then that’s pretty lame.
Any rational reader would understand that so far all scary predictions have failed to happen. They have been wrong. All of them. Except for you, no one here is talking about predictions being validated far into the future. Global warming stopped almost twenty years ago, throwing the alarmist crowd into total consternation. So now you play word games. If you were a stand-up guy you would admit that the “dangerous man-made global warming” scare was wrong. How do we know? Because Planet Earth is saying so!
For the slow learners here: None of the alarming predictions have happened. Sure, they could happen. And the cow could jump over the moon. But up to now, none of those scary predictions have happened.
All you’re doing is nitpicking. If you could show that Arctic ice has disappeared as endlessly predicted, or that the rise in CO2 is causing runaway global warming, or that Polar bears are starving because they don’t have enough ice to hunt on, or that the ‘missing heat’ at the bottom of the oceans has finally been found, or that there are more droughts, and more severe weather, and more hurricanes, and more tornadoes, or that the sea level rise is accelerating, or that children won’t know what snow looks like… or that any of the other failed alarmist predictions have happened, then you wouldn’t need to argue “but what if” some of those things happen in another twenty or thirty or fifty years. That’s just a cop-out.
You give this example of an alarmist prediction: “…Arctic ice could be gone by 2016 +/- 3 years, which means some time between 2013 and 2019. Another oops for you.”
Well then, I’ll give you a chance to take advantage of what you pompously label an “oops”. I’ve got $5000 to your $1000 that says Arctic ice will not be gone by 12/31/2019. That’s 5 – 1 odds, Chris. Easy money — if you’re right. So as they say, put up or shut up. The ball is in your court. Fish or cut bait. Shi… well, you get the idea. ☺
db, most of the predictions about Arctic sea ice are post 2015. There were a couple papers they said it MAY be gone by 2013. Skeptics repeat those over and over, ignoring the vast majority of papers that point to a future date. So your statement that ALL Arctic projections have been proven wrong is very misleading.
You mention that ALL AGW projections about droughts, etc have not come to pass. That is false. On 3 different occasions, I have posted a paper about the Australian heat wave of 2013. You have never refuted this paper, you just continue to ignore it. Here it is again: http://www.abc.net.au/news/2015-02-07/record-heat-virtually-impossible-without-climate-change-report/6077634
Lastly, regarding your proposed bet. Let’s look at the Arctic data, shall we? Here’s the plot: http://nsidc.org/arcticseaicenews/files/2015/10/monthly_ice_09_NH.png Looking at the slope, the Arctic ice extent is declining by 1M km2 per 12 years. The lowest extent for 2015 was 4.63M km2. Therefore, continuing the plot yields a crossover in 55 years, or 2060. I’ll round down to 2050 to make it a nice even number and to give you the better odds. Shall we finalize our bet? The Arctic will be ice free by 12/31/49 is our bet. Deal?
Chris,
So you’re chickening out, and re-framing things that can’t be verified until 2060.
Pathetic.
dbstealey, “all scary predictions have failed to happen.” From this you do not find it scary that the Arctic may be ice free by 2016, since that has not yet failed to happen. From your earlier comments you clearly do not consider IPCC and U.S. National Climate Assessment predictions alarmist, since all alarmist predictions have been proved wrong (you say).
You accuse Chris of raising straw man arguments, but your argument is simply a massive straw man. The fallacy is described as “giving the impression of refuting an opponent’s argument, while actually refuting an argument which was not advanced by that opponent.”
You argue that the most extreme predictions are the argument, then knock down that argument. Since the argument is not that ice free conditions will be existing by 2015, you have knocked down a straw man.
To prove me wrong, you could simply state the argument that you think has been shot down by the failure of the ice to melt entirely so far and so demonstrate that my characterisation of your position of presenting a straw man is wrong.
seaice sez:
To prove me wrong,…
You’re wrong about who has the onus. See, it’s your job to show that I was wrong.
So far, you’ve failed.
You and Chris together have nothing more than baseless assertions. That’s why you fail.
Whenever someone escapes from the ‘skeptical science’ bubble, they come here to spread Cook’s misinformation. That’s what you get for believing that blog’s neo-Nazi propagandist.
Chris: 2015 plus 55 is 2070, not 2060. Your proposed bet of ice-free by 2050 is therefore a very good one for dbstealey to take.
seaice,
Go away until you understand.
seaice, thanks for the correction, I dashed my reply off in the middle of my work day here in Asia and didn’t catch that. You’re right, I’m now giving him a great offer – let’s see what he says. I predict deafening silence or a decline.
Well, Chris, how about it? Where’s your “great offer”?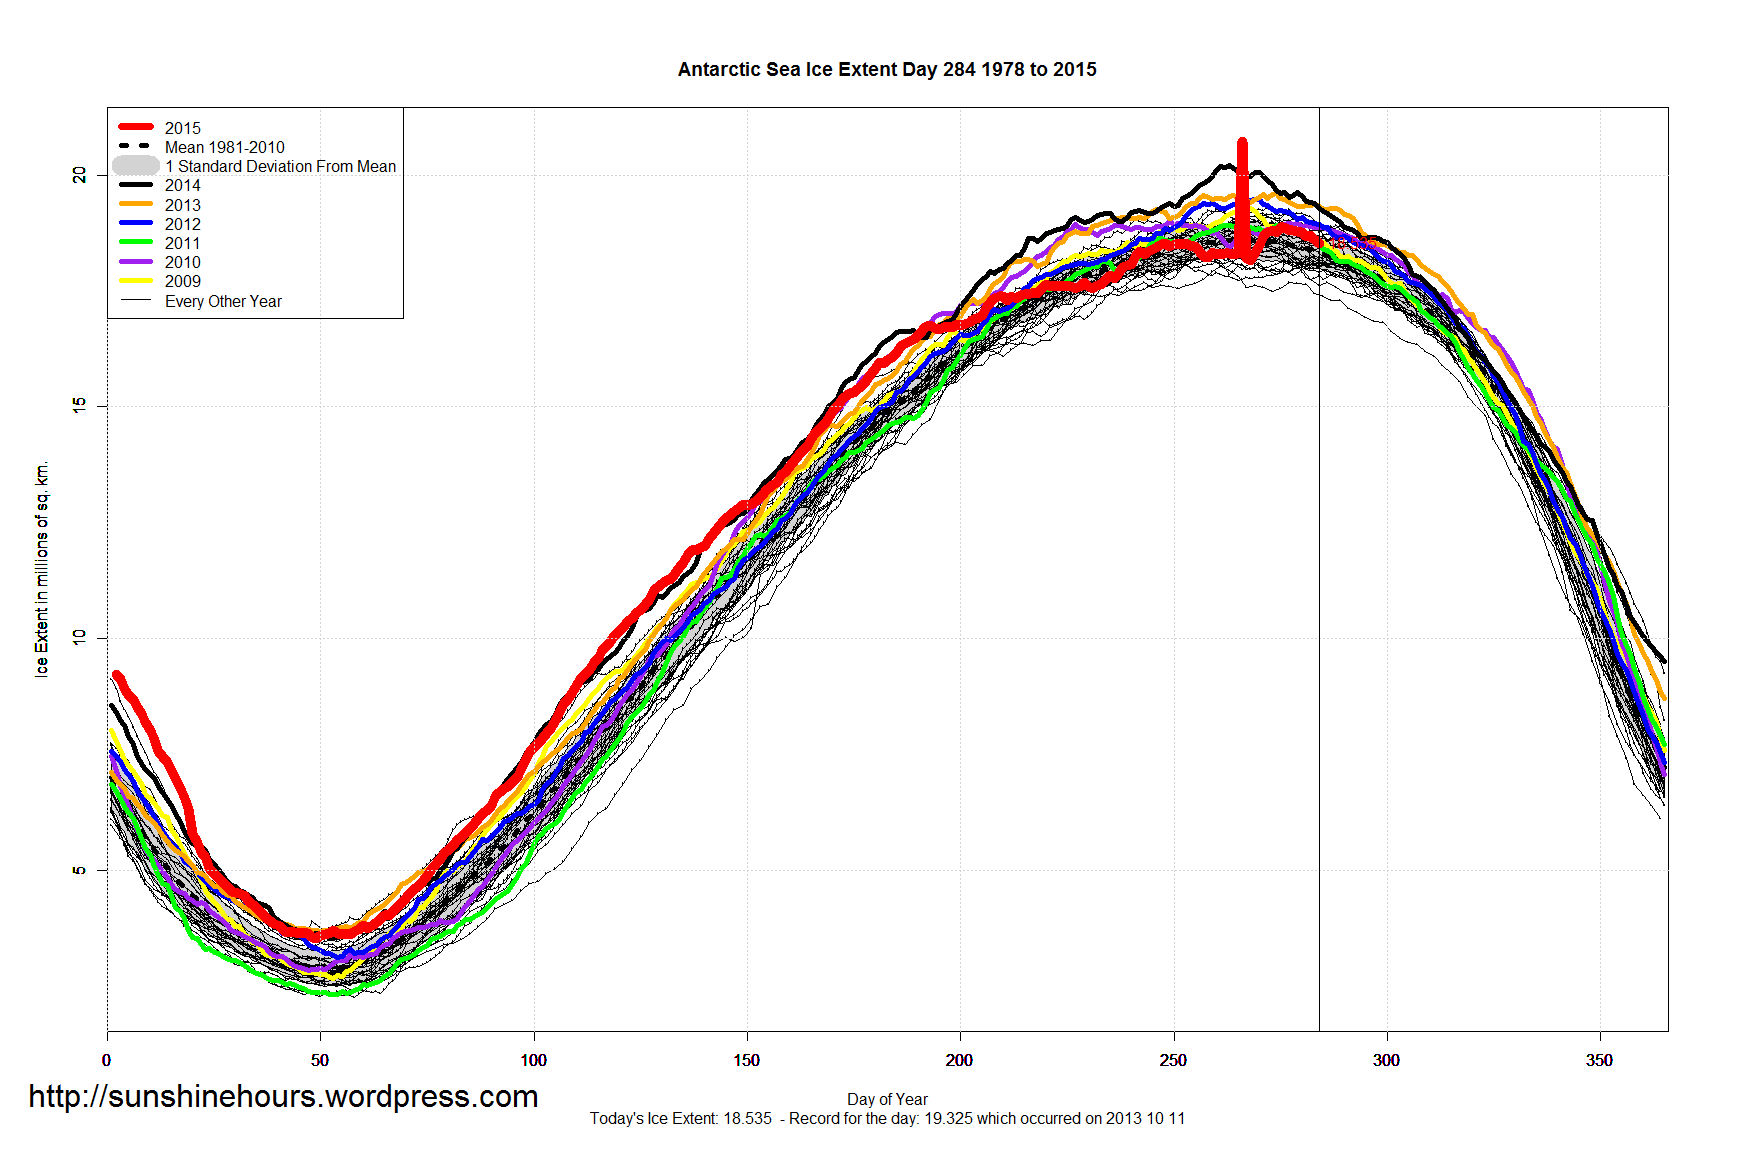

You cited the 2019 prediction. So I made you an offer, and at 5 – 1 odds! I can make it 10 – 1, if 5 – 1 scares you.
But it looks like you’re tucking tail and running away.
I guess I’ll have to ‘deal with it’.
*****
@seaice,
Thanx for pointing out that Chris is tucking tail until 2070 now! That way, he can’t possibly lose the argument.
Next, here is today’s Antarctic ice extent:
Right on its ten year average. How will the alarmist clique explain that?
And here is today’s Arctic ice compared with the past ten years:
Recovering nicely. No wonder Chris chickened out from my generous 5 – 1 offer. ☺
dbstealey said: “Chris,
So you’re chickening out, and re-framing things that can’t be verified until 2060.
Pathetic.”
DB, you’re attempts at flipping the argument are laughable. I gave you EXAMPLES of papers that conclude that the Arctic will be ice free beyond 2015. One EXAMPLE stated first ice free could occur between 2016 and 2019, another stated around 2050. These are papers I found by doing a quick search, there are others that state 2035, others 2070, others 2100. You then assume that I believe the 2019 figure. Why? Who knows, you just made it up. There is no re-framing going on, except your ineffective attempt to link me to the conclusions of the 2019 paper.
You’ve stated earlier that Arctic ice is recovering. Therefore, you should be happy to take ANY bet on an ice free Arctic. In fact, I’ll give you 10-1 odds on that 2050 date, which is the date that I believe. Do we have a deal?
Interestingly, below you state that with a date of 2070 I am sure to win the be, which implies you think we will have an ice free Arctic in the future. So what do you believe about Arctic ice, db? Do you have any concrete position about Arctic ice, or just flip flopping ones?
Bye bye, Chris…
http://online-english-lessons.eu/wordpress/wp-content/uploads/2013/02/chicken.jpg
Sorry my wager scared you away.
PS to db – I’m still waiting for your reply about the Australia heat wave paper. That’s now 4 times I’ve posted it for you without any reply.
db, thanks for showing your true colors. When painted into a corner, you run away or try to change the topic. I’ve seen it happen many, many times here on WUWT. A recent one was you flapping your wings pathetically when challenged about your claiming global significance of US temperature data. You don’t fool anyone, db, except perhaps yourself.
Chris, this is you:
http://treasure.diylol.com/uploads/post/image/440656/resized_anti-joke-chicken-meme-generator-you-re-a-chicken-you-chicken-e52ec1.jpg
I offered you a very generous wager at 5 – 1 odds.
Your bluster shows nothing more than psychological projection.
[Snip. Sockpuppet commenter. ~mod.]
Mr Chihuahua,
I look at that graph every day. So what?
There is nothing either unusual or unprecedented happening.
Your turn now: look at the article’s title. You are being led by an invisible ring in your nose by this MANUFATURED PANIC.
You don’t see it. We do.
[Snip. Sockpuppetry. ~mod.]
Chris,
In your deluded and fevered imagination, everyone who disagrees with you is wrong. That means about 95% of the readers here are wrong. What, you don’t believe in the consensus? ☺
Wake me when global sea ice keeps dropping. And you might question that chart anyway. They have a vested interest — an agenda — in exaggerating things.
Here is the most accurate global sea ice data:
http://www.climate4you.com/images/NSIDC%20GlobalArcticAntarctic%20SeaIceArea.gif
No doubt you will reject it because it doesn’t feed your confirmation bias. But it is the most accurate, and if you like I’ll give you the CV of the person who produced the chart. Just ask.
Also, you assert that:
ALL AGW projections about droughts, etc have not come to pass. That is false.
Again, only in your deluded, fevered imagination. When someone makes a prediction like that, it is wrong until it comes true. And none of those alarmning predictions have ever come true. You’re just looking for a way to hide your climbdown.
For many years the climate alarmist contingent has been predicting that Arctic ice would disappear. But in fact, the very mild, natural dip from about 2006 – 2012 is well withing historical norms, and it is fully offset by the rise in Antarctic ice. Last year the Antarctic produced an all time record high for adding south polar ice.
You’re running around in circles, flapping your wings and clucking that the sky is falling, when what we’re observing is nothing more than natural variability. It’s very easy to make you look as foolish as Chicken Little, but I remind you again that I have never commented on one of your posts, unless and until you began your attacks. You bring the ridicule on yourself.
Finally, I am a scientific skeptic, like most readers here. We can be convinced very easily. All it takes is for you to produce veriifiable, empirical, testable and replicable measurements that support your arguments. But so far, your arguments are almost all simple assertions. Thus, you lose the argument. Just like you would lose the wager — if you weren’t too chicken to take it.
So keep trying to argue your climate alarmism. I could refute you in my sleep if I wanted to, your arguments are truly that lame.
Chris:
Seven months of the year, the southern edge of the Arctic sea ice has virtually no sunlight shining upon its surface. When sea ice area is below its normal area for the date during those seven months, the losses from the uncovered open Arctic waters LOSE HEAT to space and the planet has a net COOLING EFFECT due increased evaporation, convection, long wave radiation and reduced conduction losses.
Thus, under today’s conditions, from September 1 – including that dreaded sea ice “minimum” you so fear – until the end of March, “Less Arctic Sea Ice = More Cooling.”
Now, April-August, the Arctic Ocean DOES gain some heat energy from the increased solar exposure of darker ocean water. But these Arctic leads and melt ponds begin re-freezing 12 August, when the heat losses over each 24 hour day = the small amount gained from the sun.
But, the Antarctic has been setting RECORD-HIGH sea ice extents for most of the past 12 years. Including an “excess Antarctic sea ice area” just last June that was just a bit larger than Greenland.
And, unlike the very high latitudes of a very little bit of Arctic sea ice in September (latitude 80-81 degrees), the Antarctic sea ice IS at latitudes where the increased sea ice reflects more energy back into space 10-1/2 months of the year. (The northern edge of Antarctic sea ice is in the dark 30-40 days a year.) Making it worse (for your fears) this ever-increasing Antarctic sea ice is 1.65 to 1.7 TIMES as effective in reflecting solar energy than the Arctic sea ice is. So, each “extra” million square kilometers of Antarctic sea ice needs to be offset (over a year’s time) by 1.7 million square kilometers of Arctic sea ice.
Losing all Arctic sea ice? (Even at the stupidly simplified – “Well that would be during the September minimum extents.”) Well, losing that sea ice in September will only serve to cool the planet more.
Is the extra Antarctic sea and the missing Arctic sea ice the past 20 years the cause for the “pause” ? Well, all that extra reflected heat down South, and all that “assumed” absorbed heat up north (which has been lost to the Arctic Ocean at ever-increasing rates) is no longer on earth.
db,
As usual, you avoid a logical defense of your statements by trying to distract and attack. It fools no one, it really doesn’t – it just makes you look like more of a fool than everyone already knows you are. I think it’s time to give you an additional middle name, db. Henceforth, rather than dbstealey, you shall be known as dbostealey, o for obfuscation. It’s your standard technique for trying to avoid direct questions.
Once again, you didn’t ask me when I thought the Arctic would be free of ice. YOU cherry picked a date from several i quoted to you from papers written by other people. I did not say which of those I agreed with, YOU chose one. I then offered a 10-1 bet to you based on the date when I think it will occur. Since you, in the past, have said that Arctic ice is increasing, you should have jumped at this bet. But you didn’t, because, as the saying goes, you are all hat and no cattle, you don’t stand behind what you believe.
Chris,
It’s not polite to ignore someone who has taken the time to try and school you. Of course, it’s no easier trying to teach you anything about this subject than it is to teach a dog trigonometry. But you could at least acknowledge it when Robert Cook tries to help you understand, istead of ignoring him.
You either attack folks who know more than you, or you ignore them. I understand that. Because those two tactics are really all you’ve got.
When you write something like:
…it just makes you look like more of a fool than everyone already knows you are.
That clearly shows your insecurity. If “everybody knows” I’m a fool, then you wouldn’t be the only one saying that. Would you? But after more than 10,000 comments, you’re the first one to write that everyone knows I’m a fool. What’s the matter, Chris, got no girlfriend? No boyfriend?
So when you accuse me of ‘distracting’ and ‘attacking’, you should read your own deflecting comment above. I understand why you’re so frustrated. Who wouldn’t be, when Planet Earth herself is making fun of you? This article is called “Manufactured PANIC”, and it’s referring to you. You are trying to manufacture a panic over something that is neither unusual, nor unprecedented. What we’re observing has happened repeatedly, and to a much greater degree in the past. Naturally, you want to distract from the fact that all we are observing is natural regional variability. There is no evidence for anything else.
Next, I made a generous offer based on the prediction you posted, because it’s the only prediction that can be resolved within a reasonable time frame. Claiming that we need to wait until 2060 or 2070 is nothing more than a desperate tactic; moving the goal posts to somewhere much more comfortable. The fact is, no scary alarmist predictions have ever come true — and those failed predictions have been made for decades.
Your conjecture has been falsified. There’s nothing you can do about it, except to provide a testable prediction. But as we see, you tuck tail and run when anyone holds your feet to the fire. Your whole comment above is an attempt to distract from the fact that although you asserted that a prediction could be resolved, you won’t stand behind it even with 5 – 1 odds in your favor. All you’re doing is deflecting, Chris. When it comes to standing behind your assertions, you run and hide, or you move the goal posts so far out that you can never be held to account.
You’re insulting and name-calling now, trying to wiggle out of your predicament. If anyone needs proof that you’re on the losing end of the ‘dangerous man-made global warming’ (MMGW) debate, that’s proof positive. You lost that argument. Because if you could point to any scary climate predictions that have come true you would be posting those, instead of childishly trying to claim that “everyone knows” I’m a fool. Funny about that, you’re the only one who seems to “know” that. And if I’m a fool, you’re sure spending a lot of time arguing with me. Who’s the fool, Chris?
Finally, if you review my comments here and elsewhere, you will see that I regularly post numerous links with facts, evidence, and most importantly, data-based measurements to support my position. You don’t. Instead, you argue by assertion, and by ad hominem insults, and by deflecting from anything where you have to put up. You state that various scary things will happen, but you are afraid to accept my generous offer.
So you don’t really believe any of it, do you? Now you’re stuck, because you’ve bought into your losing argument. You have too much misplaced ego, but insufficient grace to admit what everyone can clearly see: there are no measurements quantifying your MMGW scare. Not a single one. It’s all assertions, and they’re baseless. Chris, you’re just not smart enough to carry that kind of argument. You’re winging it, and it’s easy to see when someone’s bluffing here: you don’t have quantifiable measurements. All you have are your baseless assertions, your bluster, and your juvenile insults — while I have facts, evidence, and verifiable measurements.
No contest.
db, there is a thing called work. I’m at it, and therefore will reply to RA’s comments later. Likewise for yours. I live in Asia so am basically 12 hours off from folks in the US.
db,
You post pictures of chickens and call me one, then say I am insecure for calling you names. So I guess that makes you insecure.
As far as the fool comment, when I google your name and fool, I get a number of hits. So nope, others have used the same word. 10,000 comments? Wow, you live on these sites – which is pretty pathetic. And you ask me if I have a girlfriend or other partner? Funny stuff…..
As far as the bet, you continue to dodge and obfuscate – which of course is your middle name. You think Arctic ice is recovering, so therefore ANY future date for an ice free Arctic should be acceptable to you. But you won’t take that 10-1 bet, which means you don’t back your words. Again, pathetic. I don’t think the ice will be gone by 2019, so why should I take that bet? I told you the date when I think it will, which is not hedging, or safe, it’s the number I believe. And, once again, if you think Arctic ice is recovering, then there is no chance it will be gone by 2050, so you should jump on that bet. But you don’t.
And, for the 6th time, you’ve declined to post a refutation of the study I posted on the link between AGW and heat waves in Australia in 2013. You said there were no links between CO2 and climate incidents, I have shown there are.
dbstealy and Chris – this wager could be resolved. dbstealy reasonaby does not want to wait until 2050 to resolve the bet, and Chris obviously does not want to bet on a position that he does not hold. However, there is a way out. Chris says the ice is shrinking, dbstealy says it is growing. There must be some terms that would distinguish between these two positions that would be resolved in a much shorter time than waiting until all th eice has gone.
How about the average of the next three years will be either lower or higher than the last three years? That is if the average sea ice minumum (15% coverage) of 2016, 2017 and 2018 are lower than 2013, 2014 and 2015, Chris wins. If it is higher, dbstealy wins.
It is a bit reckless to gamble on such short term periods, when the true signal can easily be hidden by normal fluctuations. However, the underlying trend must give an advantage to the correct predictor. If both parties are preparedto wait a little longer, then the outcome should be more certain.
If these terms are not satisfactory, perhaps you could suggest more agreeable terms, and why.
seaice, you wrote:
…you do not find it scary that the Arctic may be ice free by 2016, since that has not yet failed to happen.
I find it thoroughly un-scary. I could not be less worried. But if you wish to be frightened, don’t forget to pack your Depends. ☺
Also, Chris seems to believe that Arctic ice will be gone by 2019. Not, as you misrepresent, that it might be “shrinking”. As you said, “ice free”. And as I offered to Chris:
I’ve got $5000 to your $1000 that says Arctic ice will not be gone by 12/31/2019.
The endless predictions that Chris seems intent on defending said that Arctic ice would disappear by X date. (Chris says we have to wait until 2019 to be sure). OK then, he can make 5X his money by fading my wager.
As for you, Pff-f-f-f-ft. You’re trying to get others to wager what you lack the cojones to bet yourself. Go away, Chicken Little.
dbstealy. You have failed to understand Chris’s position, and are now running away. Chris has stated his position clearly – ice is reducing and will probably be gone (in summer) by 2050. You have stated your position – ice is growing, not shrinking. If you want to see who is chicken, see who is not prepared to bet to back up their position.
You introduced a straw man that ice will be gone by 2019. No-one here holds that position, so not taking that bet is proof of nothing.
I will bet on the terms I stated previously. So how about it? If you think ice is growing, why not take the terms of my bet? We can resolve it in 3 years. I am prepared to wait that long. We can use the longbets .org platform to ensure fair play.
Serious offer, with mechanism to undertake it. How about it? Do you have the cojones, or are you chicken?
seaice sez:
You have failed to understand Chris’s position…
No, pal, you are misrepresenting what Chris said. And who are you to be speaking for him, his big brother? Chris tried to move the goal posts out to 2060, which would completely let him off the hook, as I pointed out:
…you’re chickening out, by re-framing the argument to something that can’t be verified until 2060.
Even you acknowledged that:
…you do not find it scary that the Arctic may be ice free by 2016, since that has not yet failed to happen.
Then Chris moved the goal posts even farther out, from 2060 to 2070!
And you tucked tail along with Chris, avoiding my very generous 5 – 1 offer (assuming Chris is right about Arctic ice disappearing by 2019), by deviously trying to insert a different wager. That’s what losers do when they’re cornered. Either fade me or go away.
What you’re doing is plain to see: you’re replacing my kind and generous 5 to 1 offer with impotent bluster by trying to make a bet that can’t be resolved until at least 2060. How convenient, eh?
Sorry, seaice, Chris is tap-dancing because he made a statement that he is afraid to back up because he knows he would lose. And you try to defend him by misrepresenting just about everything.
Face the fact that the stoopid “ice” argument is the last, desperate hope of the alarmist crowd. You have been flat wrong about every scary prediction ever made, and now that the hook is set, you’re trying to get away.
That isn’t happening. Chris brought up the ‘2019’ argument, and now he’s stuck with it. His only respoinse has been name-calling. But really, who’s the “fool” here? Either one of you can take my offer. But if you’re chicken, don’t try to replace it with your own fake offers that can’t be settled for another half century. Just admit it and move on.
db: Forget Chris, how about my bet with you? You claim ice is growing, I think it is shrinking. My bet is resolved in three years, not in 2050. I proposed a third party that oversees the bet to ensure fair play. What are you afraid of? Are you chicken perhaps? Not too sure of your ground?
You cannot win this one by distractions – put up or shut up and accept you have lost the argument.
seaice says: Taking candy from a baby” comes to mind…
Forget Chris…
So now that I’ve deconstructed his nonsense and your lame attempt to support it, I need to ‘forget’ it ever happened.
Chris — and in fact numerous climate alarmists — have predicted that Arctic ice would “disappear” by now. But Chris didn’t like that because it didn’t happen, so he picked 2019. I accepted that, and made him a very generous offer (‘generous’ if he was right; that Arctic ice would disappear by 2019).
Now you come along and deviously try to move the goal posts to “shrinking” Arctic ice — which could even mean growing ice, depending on who you want to believe. Even Elmer Gantry would laugh at your devious attempt to re-frame the alarmist predictions. In fact, you’re lucky I’m laughing off your stupid bet. “<a href
And:
Forget Chris, how about my bet with you?
I made an honest offer. You ignored it, and made a dishonest offer of a wager you could never be pinned down on. Only a fool bets with dishonest folks like you. One of the hallmarks of the climate alarmist crowd is their lack of honesty. You fit right in.
The fact is, you have no measurements of something you insist must exist. Really, you belong on an astrology blog, not here. In science, data is absolutely essential. Measurements are data. But you have none! All you have is your belief. That automaticvally loses the argument when you’re trying to debate with a skeptic. With no measurements, you’ve got nothin’. And you’ve got no measurements.
You’re not nearly smart enought to compete here, ‘seaice’. Why not trot on back to Hotwhopper, where they will buy your lack of probity? This is a science site, not a religious blog, or a Scientology blog, or an astrology blog. Those have the same ‘faith’ requirements as your green eco-religion. What you post here certainly isn’t science.
dbstealy. Whatever your bluster and distractions you are not prepared to back up your assertion that the Arctic sea ice is recovering. I offered clear terms and a mechanism for organising the bet. My position is the ice is shrinking. We will decide the wimnner based on the minimum sea ice area averaged over the next three years and simpoly see if it is bigger than the same averaged over the last three years. All you do is talk about other things and avoid the proposed bet. From this I take it that you in fact do believe that the sea ice is shrinking, since you will not bet against that position.
You criticised me for arguing Chris’s position (“And who are you to be speaking for him, his big brother?” you said). So leave Chris and your conversation with him out of this. Is the Arctic ice shrinking or growing? That is my disagreement with you. Simple: I say shrinking, if you don’t agree then make yourself some easy money. If you do agree, then don’t take the bet. Your call.
seaice,

You call holding your feet to the fire “bluster”. OK then, I’ll watch you squirm trying to get away from my “bluster”.
Then you preposterously whine:
So leave Chris and your conversation with him out of this.
YOU brought him up, chump. Now that you’ve lost that round, you want everyone to forget about him. Fine, he was clueless anyway, just like you.
Next, you keep deflecting with this:
Is the Arctic ice shrinking or growing?
I’m not a chump like you, I know a con when I see one. My offer was based on your alarmist cult’s incessant predictions that Arctic ice would disappear. It hasn’t, so now you want to move the goal posts to “shrinking”. I’ve pointed this out before: you are not nearly smart enough to argue here. All you’ve got are you deflections, your misinformation, your tap-dancing around my offer, and your typical alarmist dishonesty. And I provide facts, while all you’ve got is your worthless opinion.
Because no matter how many links I provide like this…
…your response is always the same.
All you have are your baseless assertions; your beliefs. You don’t know science from Scientology.
Arctic ice cover took a small, natural dip for a few years. It is recovering nicely:
http://36.media.tumblr.com/b835c0fc2b0a25b008f736419e545cf6/tumblr_inline_nnty350Cn51qij8k6_500.png
But no matter how many links I post, you keep pretending that Arctic ice is gonna disappear. It’s not:
Your comments are nothing but rambling nonsense and deflection. Trot on back to SkS, or Hotwhopper, or wherever you get your misinformation. This is a science site, so obviously you’re in the wrong place.
And learn to spell! Sheesh, I’m dealing with an illiterate.
dbstealy. Please stop using distractions and bluster. Do you agree that Arctic sea ice is shrinking? If not, then take the bet. If you agree with me, just say so and we can move on. I say the minimum Arctic sea ice extent averaged over the next 3 years will be less than the average of the last 3 years.
You said “Looks to me like sea ice is growing” and “Arctic sea ice is growing year-over-year” and “despite the wild-eyed scare stories, Arctic ice only dipped for a few years. It is recovering now.” Why not back up these assertions?
You offered Chris a bet that would be resolved in 2019, so it can’t be that you are not prepared to wait that long.
You said “You… have nothing more than baseless assertions. That’s why you fail.”
You said “Easy money — if you’re right. So as they say, put up or shut up. The ball is in your court. Fish or cut bait. Shi… well, you get the idea. ☺”
OK – then win some easy money if all I have are baseless assertions. If you don’t, it really, really looks like you think the Arctic sea ice is shrinking, despite your baseless assertions that it is growing.
seaice, get a clue, boy. You say:
Why not back up these assertions?
*facepalm* How many data-based links have I posted on this?? A dozen? Two dozen? Twelve dozen, over the past couple of years? At least. Now your only response is your own psychological ‘projection’: you answer with “distractions and bluster”. And I’ll add: deflection and misinformation. Your entire argument is based on your own eco-religious opinion. What’s that worth, besides nothing?
You inserted yourself into this discussion when Chris skedaddled. But instead of taking my wager — which you know you would lose — you chickened out and fabricated your own dishonest nonsense.
See, sea, skeptics have nothing to prove. The onus is completely on you and your alarmist greenie pals. It is you who have made the endless claims that the Arctic will be ice free. But instead of manning up and standing behind your falsified beliefs, all you do is prevaricate.
Honesty is not in you. See, I made the offer, chump. Take it or leave it. That’s how it works. You don’t get to invent something else in its place. That won’t fly, it’s just your way of tap-dancing around the fact that you’ve got nothin’.
Posts are vanishing, so apologies if this appears more than once.
dbstealy. Why not stand by your position? If you think Arctic sea ice is growing, simply take my bet and win yourself some money.
You said “Honesty is not in you. See, I made the offer, chump. Take it or leave it. That’s how it works. You don’t get to invent something else in its place. That won’t fly, it’s just your way of tap-dancing around the fact that you’ve got nothin’.”
There is nothing dishonest about my offer. You offered some other bet to someone else. I am not interested in that. Arctic sea ice, shrinking or growing? I didn’t pluck this out of the air – I quoted you saying it was growing several times in this discussion. Why not stand by you claims? If your evidence is so strong then you will win. Take the bet. If you don’t, it looks like you are tap dancing around the fact that you got nothin’.
seaice,
As I’ve pointed out before, you are not nearly smart enough to corner skeptics here. I note that your pal Chris skedaddled when I made my very generous 5 – 1 offer. I also note that you won’t offer 5 – 1 odds on your own bogus offer.
I am happy to make or take wagers, but yours assumes that you know what temporary fluctuations will do in future. I don’t know that. Neither do you. Personally, I think you’re stupid to try and make any bets based on temporary ice fluctuations. I am not stupid. Yes, Arctic ice has been recently rising since about 2012, as I showed with several links. But all you have are your baseless assertions, which you are foolishly trying to wager on. I’ll save you from yourself, generous guy that I am. And you presume that the natural dip between 2006 – 2012 will temporarily return. A wager like that is like betting on a coin flip. Only a fool would do that. But you want to, eh?
You can take the offer I made, based on the silly belief that Arctic ice will disappear. Take it or leave it. That is my offer to you, or to anyone. The endless claims of the alarmist cult of which you are a charter member are that Arctic ice will disappear. Your pal says by 2019. I’ve posted quotes from your fellow alarmist fools to that effect. But you don’t have the cojones to take me up on it. Instead, you offer what amounts to a coin flip. You may be that stupid, but skeptics aren’t. The alarmist cult has a monopoly on stupid.
You believe that Arctic ice is disappearing. Then take my offer. But if you believe that the natural cycle of the Polar see-saw may in future go one way or another, then find someone credulous to bet with. I’m not at your rather low level of intelligence, and I’m laughing at you for presuming that you can corner me or any other skeptic here. You’re just not smart enough to do that.
Let’s see, the ice sheets are going to go from -30C all the way up to -20C. The melting, it will be unbearable.
Exactly. “Antarctica-wide ice sheet surface melting by 2050”. Ice still have a melting point of 0 celcius.
When they are begging you to take the money, many will think it foolish not to.
In the interest of science, I think Trusel et al should say what how much were they paid for this “scientific” report.
MODELS ARE NOT EMPIRICAL EVIDENCE OF ANYTHING BUT FANTASY!
Empirical evidence says this is not happening.. WOHI is now part of the propaganda wing of the UN and the Obama Administration?
Odd how those calories released when the sea ice freezes migrate southward to melt the continental ice. Very odd.
Is THAT how they landed on my thighs? 😉
Hey, not surprising that they seemed to have packed all of the CAGW climate scaremongering keywords in.
Projects, may, surpass, if, doubling, suggests, strong potential, scenario…
But the true genius appears to be the master stroke of devising two separate sets of made up numbers, in which one corresponds to reckless steady-as-she-goes policies in which humans continue to attempt to live and thrive, while the other relates to what will happen if we shut down our industrial society and turn off our energy infrastructure, and basically tell poor people “sorry, you are sh!t out of luck”, and every one else that they will just have to freeze in winter, swelter in summer, junk your cars for scrap, and say goodbye to plentiful food.
And, lo and behold, in the first case something really and truly bad and awful just may happen, while is the second case, the southern polar portions of our planet will stay just as much of a frozen wasteland as it is now, and we will all be saved from the catastrophe of some ice melting. Starving but happy, because HEY…the ice is intact!
I will say the graphic is awesome.
I would not be in such a hurry to condemn this study until we have read the full details. Unfortunately they want $32 from the public to see it. This is not the ideal way to tell the public about an upcoming threat and get their co-operation.( You cry wolf but you charge $32 to hear the cry ?)
Projecting 35 and 85 years into the future using a science and models that are still unproven and unsettled has some major risks and uncertainties associated with it. But continued warming of the Antarctic is a possibility and more melting can happen (as we saw in the Arctic) if the background temperature of the globe continue to warm . How many of us can say with certainty that more significant Antarctic melting will not happen during the next 100 years from now .? Perhaps the greenhouse gases have a greater effect on the poles than the rest of the planet.( polar amplification}
The threat from melting ice is a bigger threat than any warming of the global climate which may be more regional ( as is happening today )
You can read the article by using the link at the Guardian’s write-up of the study.
http://www.theguardian.com/environment/2015/oct/12/antarctic-ice-melting-so-fast-whole-continent-may-be-at-risk-by-2100?CMP=share_btn_fb
https://notalotofpeopleknowthat.wordpress.com/2014/05/24/antarctic-temperature-trends-2/
The facts which do not lend support to this study which is wishful thinking if you believe in AGW theory.
Why would one need a model to tell you that Antarctica melts around the edges and accumulates in the center? If it didn’t it would cover the earth with ice.
Antarctica didn’t melt away 10 thousand years ago when conditions were much warmer. Why would it melt away today?
Hey now…this be climate science.
Don’t be trying to get all logic-ey or nuthin’!
http://www.ospo.noaa.gov/data/sst/anomaly/2015/anomnight.10.12.2015.gif
More data which does not support AGW and what this article is predicting.
It is not happening nor will it happen. The trends in Antarctica have been toward cold not warmth and I expect this trend to continue moving forward.
There is some recent unusual very significant cooling around southern Greenland by to 5 c.
Does anybody have a recent assessment of the likelihood of the IPCC’s RCP8.5 scenario? Even these authors do not think that it is likely! On reading the article, I also wondered whether the GCM models they used have factored in the recent changes in sensitivity? My immediate reaction to the article is that the headline bears little relationship to the concluding paragraphs where all the caveats are listed.
Another source for past Antarctic temperatures
http://berkeleyearth.lbl.gov/auto/Regional/TAVG/Figures/antarctica-TAVG-Trend.png
How can any ice melt at minus 35ºC?
On the front page of the NY Times, ice can melt at any temperature you may desire – and the science on this is settled.
The satellite that cover far more area of Antarctic don’t agree with recent near 40 years and show no warming or cooling more recently.
No warming since 1979.
http://i772.photobucket.com/albums/yy8/SciMattG/UAH_AntarcticTemps1978_zpsd4yjaujj.png
Cooling from at least 1995.
http://i772.photobucket.com/albums/yy8/SciMattG/UAH_AntarcticTemps1995_zpsffvqdzf5.png
Hey, I just created a computer model that shows the Sun revolves around the Earth , thus, proving that the Sun has no effect on the Earth’s climate !!!! Wow, I could get Noble prize for this !!!! . . . What ???? No you can’t look at the data , you just want to prove me wrong !!!!!!
Just think of how many Mars missions we could have funded what for the useless exercise of Global Warmism!
We should feel lucky that the Warmists have seized upon CO2 as their excuse to foment their movement against modern life. They might have, or will next, decide that the reason that the North is warm while the South is getting colder is the mere presence of humans. Then they will no longer try to rid the world of fuel use, will decide that energy from any source is the culprit, and demand that the factor we need to change is to rid the planet of a few billion humans.
Oh wait – many are already advocating for this….
At the current rate (over the past 25 years) it may take 380’000 years for the Antarctic Ice sheet to be fully melted. This linear extrapolation is as silly as any other else.
(based on Surveys in Geophysics 201132:9137 DOI: 10.1007/s10712-011-9137-z
Ice Sheets and Sea Level: Thinking Outside the Box, Michiel R. Van den Broeke et al)
If the rate doubles, then we’ll have to be caught by surprise in 190’000 years.
How I wish I were around by year 2050 – ’cause then it will be possible to conduct a proper scientific study of the value of computer studies and computer projections of climate events. My guess is that all climate computers will be quietly retired as it will be abundantly clear that they are useles (worse that useless, in fact, as bias will be proveable).
AndyE
October 13, 2015 at 7:59 am
Not useless. They can be used as boat anchors or man made reefs after all the precious metals and hazardous materials are removed.
In the methods section of the study they state
“. The ability of CMIP5-based GCMs to accurately reproduce Antarctic mean summer (DJF) near-surface (2-m)air temperature (T2m) was examined to select the most ideal GCMs to simulate the
evolution of Antarctic air temperature and derive meltwater production. ”
My recollection of the results CMIP5-based GMCs noted on previous blogs on WUWT showed that their projections were consistently high when compared to observable data ( overstating the impact of CO2?).
They used a bad model to create an even worse model…..just in time for Paris !!!!
There is now ample model output to enable development of a model of models.
I might become a modeller of models. It would be fun making models of models. Then you would have a real fair dinkum model.
Apparently there was a memo that went around that stated hereafter and forthwith projections/forecasts/predictions/sheer speculation is hereby deemed as proven data input.
So in today’s world of science if I project the Sun will shine an average of 1 hour less a day, then I can use that as input to an algorithm that demonstrates the effect on agriculture, then use that as input to an algorithm that projects increasing famine. Global famine then becomes an issue we must address immediately.
Lets all meet in Paris and party.
Our projections reveal a scenario-independent doubling of Antarctic-wide melt by 2050.
If the rest of the earth were on fire I doubt whether there would be ‘Antarctic-wide melt’. The mean annual temperature of the interior of the continent is -57°C.
Do these people ever read the gibberish they publish and consider how foolish it appears.
The paper authors also said
“We considered two distinct future emissions trajectories under which to assess the evolution of
Antarctic surface melting, namely Representative Concentration
Pathways RCP4.5 and RCP8.5, representing intermediate and high
(∼4.5 and ∼8.5 W m−2) energy imbalances by the end of the twenty-first century.
By mid-century under RCP4.5, the total annual volume of surface
meltwater produced across Antarctica doubles from recent levels
(88± 26 Gt yr−1) to 177 ± 52 Gt yr−1, yet undergoes relatively little
increase afterwards (Fig. 3a). Under RCP8.5, the Antarctic melt volume increases similarly by 2050 (199± 60 Gt yr), but then exhibits significant divergence from the RCP4.5 simulations beyond mid-
century. Moreover, owing to the nonlinearity described above, by
2090–2100 the multimodel mean meltwater volume projected under
RCP8.5 accelerates to 613 ± 258 Gt yr”
So we have again business as usual option( intermediate ) with little change and a worst case( high) option . What we lack is information about what co2 impacts were included in the model to make the Antarctic temperatures rise dramatically during the Antarctic summers (DEC/JAN/FEB) after 2050 to cause such an increase in the melt rate for RCP 8.5. I suspect the impact of the co2 were overstated as they have noted in the past.
The probable answer is closer to the lower melt rate
“∼4.5 and ∼8.5 W m−2 energy imbalances by the end of the twenty-first century.”
These values are laughable and require at least one doubling of CO2 (888 ppm) or latter, two and half doublings of CO2. (1840 ppm)
∼4.5 W m-2 would result in around warming 1.22 c at most and ~8.5 W m-2 would result in around warming 2.3 c at most.
Can any really believe on a continent way below zero c in summer will melt at all with those modest temperature rises?
The answer is it won’t and surprising how awful this so called science publication is. (actually not surprising anymore)
The low melt rate wouldn’t even occur with the high energy imbalances by the end of the twenty-first century.
When I read nonsense like this I feel like I’m grading a Geology 101 paper—these authors may know about computer models, but they clearly don’t know much about glaciers and real data about Antarctic climate. There is so much unequivocally wrong with this paper that it would take a full length article (which I don’t have time for right now) to respond to all the misconceptions, but here are just a few examples.
“Ice shelves are the floating extensions of the continent’s massive land-based ice sheets. While the melting or breakup of floating ice shelves does not directly raise sea level, ice shelves do have a “door stop” effect: They slow the flow of ice from glaciers and ice sheets into the ocean, where it melts and raises sea levels.”
The idea that glaciers are controlled by ‘door stops’ at their terminus is paramount in all of the model studies of the Antarctic ice sheets and assumes that if you remove the ‘door stop,’ the glacier will slide into the sea. Every glacial geologist knows that this is total nonsense—glacier behavior is controlled by the relationship between snow accumulation and ablation (melting, calving, sublimation), regardless of whether or not there is an ice shelf at the terminus.
“Our results illustrate just how rapidly melting in Antarctica can intensify in a warming climate,”
‘Rapid melting’ in Antarctica? You’ve got to be kidding! The average annual temperature in Antarctica is about –58F, so to get any melting at all, you have to raise the temperature to the melting point (58 + 32=90F), then add several degrees more to get any significant melting.
“To study how melting evolves over time and to predict future ice sheet melting along the entire Antarctic coastline, the scientists combined satellite observations of ice surface melting with climate model simulations under scenarios of intermediate and high levels of greenhouse gas emissions until the year 2100.”
Basing ice sheet ‘melting’ on computer models of greenhouse gas emissions doesn’t work for a lot of reasons, including the fact that there has been only 0.008% change in the CO2 content of the atmosphere since recent warming began (1978-2000) and CO2 contributes only 3.6% of greenhouse gases. Aside from that, Antarctica is ‘protected’ from the rest of the world by constantly encircling winds that prevents interaction with climate elsewhere and to get ice sheet melting, you would have to raise the temperature 100F (58 + 32 + 10).
“The results indicate a strong potential for the doubling of Antarctica-wide ice sheet surface melting by 2050, under either emissions scenario.”
This is absurd! The East Antarctic Ice Sheet (which contains 90%+ of total Antarctic ice) is not melting! Temperature records from the South Pole and Vostock show no warming at all since 1957.
What this paper proves is that, like all computer models, garbage in, garbage out. And this is definitely garbage!
But Don…this paper was “peer reviewed”! You know, so that the lay public could be assured of its quality, thoroughness, and veracity. And I’m sure the reviewers and authors didn’t know each other at all…nope, never.
Don Easterbrook says “The idea that glaciers are controlled by ‘door stops’ at their terminus is paramount in all of the model studies of the Antarctic ice sheets and assumes that if you remove the ‘door stop,’ the glacier will slide into the sea. Every glacial geologist knows that this is total nonsense—glacier behavior is controlled by the relationship between snow accumulation and ablation (melting, calving, sublimation), regardless of whether or not there is an ice shelf at the terminus.”
I would have thought that the presence of ice shelf at the terminus of a glacier would slow down the flow. But I have been wrong before, and Don seems so sure. Apparently every glaciologist knows this to be the case. So I looked it up. From antarcticglaciers.org it says “However, ice shelves are important because they hold back the glaciers on land. When they abruptly collapse, as several have done around the Antarctic Peninsula, the glaciers flow faster and transmit more ice to the sea, resulting in sea level rise.”
There is even a name for this: ice shelf buttressing. There is section with several references “Glaciers that feed into ice shelves are held back by the ice shelf in front of them[14, 15]. Even small ice shelves play an important role in regulating flow from ice streams that feed into them[14]. This has been observed in several cases, most notably following the Larsen Ice Shelf [16-19] and Prince Gustav Ice Shelf collapses[20, 21].”
Refs 14 and 15 are
14. Dupont, T.K. and Alley, R.B., 2006. Role of small ice shelves in sea-level rise. Geophys. Res. Lett., 2006. 33(9): p. L09503.
15. Dupont, T.K. and Alley, R.B., 2005. Assessment of the importance of ice-shelf buttressing to ice-sheet flow. Geophys. Res. Lett., 2005. 32(4): p. L04503.
16. Scambos, T.A., Bohlander, J.A., Shuman, C.A., and Skvarca, P., 2004. Glacier acceleration and thinning after ice shelf collapse in the Larsen B embayment, Antarctica. Geophysical Research Letters, 2004. 31: p. L18402.
20. Glasser, N.F., Scambos, T.A., Bohlander, J., Truffer, M., Pettit, E., & Davies, B.J., 2011. From ice-shelf tributary to tidewater glacier: continued glacier recession, acceleration and thinning following the 1995 collapse of the Prince Gustav Ice Shelf on the Antarctic Peninsula. Journal of Glaciology 57, 397-406.
From that last one: “After the ice shelf collapsed, Röhss Glacier retreated rapidly, becoming a tidewater glacier in 2002 and receding a total of ~15 km between January 2001 and March 2009, losing >70% of its area. Topographic profiles of Röhss Glacier from ASTER-derived digital elevation models show a thinning of up to ~150 m, and surface speeds increased up to ninefold (0.1–0.9 m d–1) over the same period.”
It looks to me that Don has just got this totally wrong. The rate of glacier flow is affected by the ice shelf – even small ones – and removal of the shelf will result in faster galcier flow. Far from every glacial geologist knowing this is total nonsense, it seems to be a well recognised and uncontroversial part of glaciologists understanding of glacier flow.
This does not inspire confidence for the other claims he is making. Why say things that are so easily refuted as it weakens your case so much?
The West Antarctic sheet is losing 150 km3 of ice per year. http://geoid.colorado.edu/grace/docs/SC-VelicognaWahr-2006.pdf
But only after you apply “corrections” to the data. The East Antarctic ice cap is gaining ice; it is only the far small EAIS that is losing a little ice, and that in limited area on the magma-heated, very small Antarctic Peninsula.
The sea ice around Antarctica set new record high extents in 2014. An excess area larger than Greenland. And Antarctic sea ice has been steadily increasing since 1992. Of all areas of land-based Antarctica, only the WAIS is warming. A little bit.
Now, how many millions of innocents are YOU willing to kill by artificially raising energy prices so bankers, governments, and government-paid academics can get their hands on 31 trillion dollars a year in ENRON-invented carbon trading schemes?
If 25,000.00 paid one time buys an entire conservative “oil-funded” think tank forever, how many government-paid “scientists” can I buy for 92 billions in CAGW funding?
“Worse than we thought department?” Also from the “vary narrow perspective ignoring reality what if department” and the “if I squint between my thumb and forefinger held close enough to my eye, I’m crushing your head department.”
“Ice shelves are the floating extensions of the continent’s massive land-based ice sheets. While the melting or breakup of floating ice shelves does not directly raise sea level, ice shelves do have a “door stop” effect: They slow the flow of ice from glaciers and ice sheets into the ocean, where it melts and raises sea levels.”
Melting floating ice keeps ice sheets forming right up to South America and has always happened with this continent positioned here. Do we really expect this to not happen any century because it has never happened before, even during the depths of an ice age?
The door stop effect keeps occurring all the time because it is replaced immediately by ice pushing towards the ocean, that caused the collapses in the first place. It has nothing to do with melting ice on the continent just the ‘door stop’ effect and models are garbage years ahead and everyone to do with climate so far has proved this. While scientists (not always they fault) have the same mind set for securing grants the science will never advance.
Why hasn’t the collapses over recent decades increased the flow of ice from glaciers before?
That’s right the void has been filled again and made no difference.
The nonsense from this report is rather disgraceful and all about $$$$$$ and involves everything that I can’t stand in awful climate pseudoscience.
Exaggerating whole continent on a very small region not representative – check
No observations supporting scare – check
Blaming historic events that have no affect now – check
Alarming scare – check
Blaming collapses on melting when there is more than one cause – check
Blaming the ‘door stop’ effect that has always occurred – check
Hiding behind a model for alarm-ism – check
Why not show observations now that back up this concern?
Oh we can’t because there aren’t any, we won’t get a grant and temperatures have been declining with increasing sea ice over recent decades.
I don’t know if it’s all that unusual this time of year, but snow has covered massive areas of northern Canada/Alaska & Siberia:
http://www.natice.noaa.gov/pub/ims/ims_gif/DATA/cursnow_asiaeurope.gif
And its only just begun .
Why not hold the next “World Conference” of “World Leaders” in Antarctica say next June 6 that way it would coincide with the celebration for the beginning of the liberation of Europe from totalitarian fascists! Send all the Mike Manns of the world too to deliver their latest papers on global warming. I suggest they hold a street dance to demonstrate to all us morons how stupid we are in a colorful multicultural display of unity that we could capture as though it was frozen in time.
ice shelves do have a “door stop” effect
===============
utter nonsense. ice shelves are the result of the flow. in effect the author is arguing that ice shelves slow the formation of ice shelves, and if the ice shelves melt, this will speed the formation of new ice shelves.
You should know by now alarmists love picking the effect for the cause.
The only ‘door stop’ effect ice shelves have is when ice advances towards it from advancing glaciers, due to increasing mass. This would happen whether or not the ice shelve was in water and makes no difference.
If magically raise temperatures 40 c and melt surrounding area’s near the ocean. No ice would be collapsing near the coast after a bit and melting in the ocean because instead it would had receded many miles away from the coast and collapsed there instead. Scientists involving ice are always spinning the warm side to collapses, not the too much mass cause forcing into warmer waters.
Below is a recycled comment I made from a post a week ago about ‘unstoppable sea level rise’:
The problem for the Antarctic scaremongers is that there hasn’t been a decent sized iceberg (>1,000 km²) break off the continent since 2002 (C-19 which broke off the Ross Ice Shelf). Two years before that, in 2000, the biggest recorded iceberg, B-15 (11,000 km²), also broke off the Ross Ice Shelf. The last one to break off the Filchner-Ronne Ice Shelf was A-38 in 1998. Before A-38 the only recorded big one was the Mertz Glacier tongue (B-9) which broke off in 1987. Recent icebergs from Antarctica (only two) have been tiny in comparison (310 & 660 km²).
It’s difficult to whip up alarmism when nothing of real note has happened in the way of big icebergs drifting off Antarctica for 13 years.
https://en.wikipedia.org/wiki/List_of_recorded_icebergs_by_area
I like data. My mother taught me “no news is good news” Cryosphere Today instead acts out ” good news is no news” Maybe if the ice all melts they will update their charts!
As a Dutchman by birth ( now Canadian) I am totally embarrassed by this junk and what is the “Ministry of Infrastructure and Environment? I sure hope they aren’t in charge of building dikes and de-watering projects ( I’d be moving to Eastern Holland if they were!).
New study projects that melting of Antarctic ice shelves will
intensifyeventually be measurable by some, as yet, unknown technology.Thar – fixed it.
They’re beyond bonkers.
The continent of ice is not listening.
re: dbstealey October 13, 2015 at 1:57 pm
I couldn’t find the reply button for your comment but in regards to your photo praising John Daly, you are aware aren’t you that those signs are referring to John Daly the American golfer and were taken at a British Open.
Tom,
Yes, and I should have put my usual smiley face next to it. Sorry. ☹
db,
You threw some BS at me with those photos? I hope the citations are good. I don’t want to be the third “idiot” in that idiotic exchange you and steve jones started…
Dahlquist,
It was an attempt at humor. I should have put my usual smiley face under it. My misteak.
I’ve posted that ‘John Daly’ pic several times now, with a humorous comment. My apologies for assuming everyone had read those posts. It was intended to lighten up the comment, that’s all.
Again, I’m sorry I didn’t make it more clear. It wasn’t aimed at you personally, so please don’t take it that way.
db
Just joshing with you back. Any relation to the famous db… The parachutist?
Yes, it does seem as if you have gained a devoted follower in mr. Jones. AKA Smith and Jones. Seems as if it started on the 6th oct when I read an older article that I had let pass. His style seems familiar, but I can’t put my finger on who just yet.
You never need apologize to a fellow joker.
So… it’s going to double, from zero to zero? Last I checked there was no Antarctica-wide ice sheet surface melting. Any surface melting is on the peninsula, and any other melting is from below, whether geothermal or from warmish currents. Sublimation, yes, but not “surface melting.”
They could have said “quadrupled” – 2×0 = 4×0. Still zero.
“Last I checked there was no Antarctica-wide ice sheet surface melting.”
Did you actually check? There seems to be lots of references to Arctic ice-sheet surface melting – from all round the continent. Here is one http://lgge.osug.fr/~picard/melting/
One paper talks about an index of time (days) multiplied by area where melting occured (km2). The mean over 9 years was 24 million d.km2, the maximum year in their study was 1986. This is not zero. I do not know what you had in mind when you commented. Needless to say the authors of this paper were not talking nonesense, but were describing an actual thing.
Did you even look at the data presented at your linked site? Virtually all of the melt shown was ice SHELF melt, not ice SHEET melt. My point was, and still is, that the SHEET is not subject to surface melting. Sublimation, yes, but the combination of air temperature and non-reflected sunlight has to exceed the freezing point for there to be surface melt. Most of the surface melt they show is at the Ross Ice SHELF, the Ronne-Filchner ice SHELF, the Amery ice SHELF, the Shackleton ice SHELF, the West ice SHELF, the Fimbul ice SHELF, Larsen C ice SHELF, Riiser-Larsen ice SHELF, Wilkins ice SHELF and George VI ice SHELF, with occasional minor detection of “melt” in other coastal areas – in the “ablation zone” at the edge of the SHEET. The ablation zone is not always where melt occurs either – part of the ablation of the sheet in the ablation zone includes calving.
While temperatures in mid-Austral summer can sometimes exceed 0C in the ablation zone, even in mid-summer the coastal temps are usually below freezing, and it’s an extremely rare event for anywhere on the ice SHEET to exceed the freezing point.
The Antarctic Peninsula doesn’t have ice sheet. It has some glaciers but not sheet, until you get to Marie Byrd Land, which isn’t on the peninsula – and that’s melting from below.
And let’s not forget that parts of Antarctica, including the tip of the peninsula, are outside the Antarctic Circle. “Melt” or “warm temperatures” in zones outside the Antarctic circle are not representative of Antarctica, which remains the “coldest place on Earth.” no matter how much warming NOAA wants to manufacture.
Correction: Ellsworth Land has some ice sheet too, and some of Palmer Land might be considered covered with ice sheet, even though it’s mostly mountainous, implying glacier… but all still subject to the dynamic of West Antarctica.
Oh yes – you may have picked up a minor linguistic slip in the press release that is not in the original paper. The authors say “antarctic-wide surface meltiing” and refer frequently to “ice-shelf”. It does look as though the press release has added “ice-sheet” into that phrase without realising the significance. It makes no differrence to the science, of course. Just another example of why we should be suspicious of press releases and always checkl the original. The paper is clearly not talking about melting that does not occur.
jstalewski,
They say: Antarctica-wide ice sheet surface melting.
That implies that the Antarctic is losing ice. It’s not.
The Antarctic is adding ice year over year. How could it not? The temperature is far below the freezing point of water.
And thanks for correcting the misinformation posted here by a couple of alarmist parrots. You’re forcing them to trot back to their alarmist blogs for more talking points. But nothing takes the place of measurements, and the fact is that polar ice is completely normal. They’ll have to find something else to panic about.
dbstealy – ” Antarctica-wide ice sheet surface melting. That implies that the Antarctic is losing ice. It’s not.”
Surface melting during some periods of the year does not imply net ice loss. You would need to balance losses and gains, and the melting is only a loss.
You are welcome.
@seaice sez:
You would need to balance losses and gains, and the melting is only a loss.
Antarctic ice gains exceed losses, and by quite a lot:
You are welcome.
All interesting stuff. However, to a contributor including the author all ignore the simple geological fact that ice has been continuously and more importantly in an extraordinarily regular fashion for well nigh on 1,000,000 years. The oldest ice recorded is about 840,000 years BP at Dome C and not yet on bottom. In fact the ice accumulation on continental Antarctica has been removing water from the system since accumulation began. Sea level studies covering the same time show that the sea level was up to 16 metres higher and as much as 150 m lower on a cyclical basis but this sea level movement is at odds with the constant accumulation of ice as indicated by all of the Antarctic ice cores. All weather/climate measurements pale into insignificance when aligned against the actual ice accumulation rates which are remarkably consistent over a long period of time. There is no episodic melting except amongst the most recent but peripheral glaciers hence the confusion by Woods Hole.
Oh look scary model based speculation that falls down flat when reality is introduction , that would be climate ‘science’ in action.
Easy life , push out any old BS and kickback and to count grant cash , no actual effort nor scientific integrated required.
Although to be fair most in climate ‘science’ simply lack the ability to work in any other way .
Has there been any modeling done on if this trend continues on if the ice and snow continues to accumulate at pole that is land bases rather than ocean? For instance could the weight destabilize the rotation of the earth? The wobble would be pronounced. Then of course, if it did melt, would that make the oceans more or less salty, or would it make them less acidic, from the co2? So many questions, so little time on the supercomputer. What would the heat uptake be with all that newly released water and increased co2 levels combined with a warm climate? What would happen to plant life under under those conditions?
The increased frequency and range of these panic releases has an element of desperation about them.
Its as if the Human GW lobby is trying to bury any doubts with an autumnal litter of press releases, none of any great substance.
Exactly. And I can understand the motive of people like Obama, who fans the flames of this stupid “ice” false alarm in order to push his carbon tax. But what I don’t understand is the dwindling clique of lemmings who get nothing out of the “ice” scare. They are no more than unpaid parrots.
Every natural event is twisted by them to try and convince rational folks that Arctic ice is vanishing, or the Polar bears are starving because they don’t have enough ice to hunt from, or any of the other truly wacko, swivel-eyed false alarms they constantly flog like a dead horse. What do they get out of it, except well-deserved ridicule?
Here is a chart showing Arctic ice, Antarctic ice, and global ice areas:
http://www.climate4you.com/images/NSIDC%20GlobalArcticAntarctic%20SeaIceArea.gif
We see that Arctic ice has taken a dip, while at the same time Antarctic ice is rising. Since the Antarctic contains ≈10X the volume of Arctic ice, why should anyone worry about these natural fluctuations?
And look at global ice. It is right on its long term average. There is as much polar ice on the planet as there has been since satellite measurements began. Try telling that to the eco-religionists who cherry-pick only the factoids that support their confirmation bias. But they won’t listen, because their beliefs trump scientific measurements. No wonder their numbers are dwindling.