From the UNIVERSITY OF MISSOURI-COLUMBIA:
Paleoclimate researchers find connection between carbon cycles, climate trends
Carbon cycling research can help scientists predict global warming and cooling trends
COLUMBIA, Mo. – Making predictions about climate variability often means looking to the past to find trends. Now paleoclimate researchers from the University of Missouri have found clues in exposed bedrock alongside an Alabama highway that could help forecast climate variability. In their study, the researchers verified evidence suggesting carbon dioxide decreased significantly at the end of the Ordovician Period, 450 million years ago, preceding an ice age and eventual mass extinction. These results will help climatologists better predict future environmental changes.
![A comparison of δ13Ccarb trends and the GICE from Iowa (Ludvigson et al., 2000), Missouri (Metzger and Fike, 2013), Oklahoma (Young et al., 2005), Alabama (this study), West Virginia (Young et al., 2005), and Pennsylvania (Patzkowsky et al., 1997) [note: carbon isotopic trends from Iowa, Missouri, and Alabama are plotted on the same vertical scale while δ13Ccarb trends from Oklahoma, West Virginia, and Pennsylvania are plotted on a different vertical scale]. The Deicke and Millbrig K-bentonite beds are identified in the sections from Iowa (Ludvigson et al., 2000), West Virginia (Sell et al., 2015), and Pennsylvania (Sell et al., 2015) and tentatively identified in the Oklahoma section (Bergström et al., 2010). A map of the eastern United States indicates study locations and lithofacies distribution during deposition of the Deicke and Millbrig K-bentonites (modified from Holmden et al., 1998 and Panchuk et al., 2006). Red dashed lines indicate boundaries between the three aquafacies identified by Holmden et al. (1998). Bulk carbonate δ13Ccarb values for the Midcontinent aquafacies, Taconic aquafacies, and Southern aquafacies range from -2‰ to + 1.5‰, 0‰ to + 3‰, and 0‰ to + 3‰ respectively (Holmden et al., 1998 and Panchuk et al., 2006). (For interpretation of the references to color in this figure legend, the reader is referred to the web version of this article.)](https://wattsupwiththat.files.wordpress.com/2015/10/figure7.png?resize=613%2C505)
“Climate is not a simple science; many small factors determine what exactly leads to global warming and cooling trends,” MacLeod said. “By understanding the deep past, we have better information about historic trends that lead to better predictions. Understanding carbon cycles adds value to our knowledge base of climate change.”
During the Late Ordovician period, most of North America was covered in a shallow tropical sea. What is now Alabama was on the margin of that sea where local environmental effects likely did significantly impact carbon cycling. Page Quinton, a doctoral student in MU’s geological sciences program, led a field research team in northeastern Alabama that collected rock samples from rock formations exposed when workers cut highways through hills in the region. Using the samples, Quinton analyzed them for chemical clues that can be related to CO2 levels at specific time periods.
“After examining rocks 450 million years old or older, we believe the drop was caused by a massive burial of organic carbon during the time period,” Quinton said. “We’re trying to determine whether or not there was an increase in plant productivity, or huge algae blooms in the ocean, that died and fell to the sea floor, basically burying CO2. This burial, coupled with the mountain building event that created the Appalachian Mountains, could have contributed to the resulting ice age.”
A drop in CO2 due to the burial of organic carbon in the Late Ordovician is the exact opposite of what is happening now as massive amounts of CO2 are being released; yet, understanding how the historic events occurred can help with future models and predictions, Macleod said.
###
The study “Carbon Cycling across the Southern Margin of Laurentia during the Late Ordovician,” recently was published in Palaeogeography, Palaeoclimatology, Palaepoecology.
http://www.sciencedirect.com/science/article/pii/S0031018215004563
Abstract
The Guttenberg Isotope Carbon Excursion (GICE), a positive carbon isotope excursion that occurs near the base of the Katian Stage, is thought to be a global event possibly related to Late Ordovician cooling. Documenting how much regional and global variability exists in carbon isotopic trends prior to and during the GICE is a critical aspect in understanding the implications of the excursion for interpreting changes in the global carbon cycle, paleoclimate, and chemostratigraphic correlation during the Ordovician. To investigate carbon isotopic trends along the southern margin of the Laurentian carbonate platform during the Late Ordovician, we measured bulk carbonate δ13Ccarb and δ18Ocarbas well as organic carbon δ13Corg values from four locations in Alabama. These sections are excellent study sites because they are well exposed, contain the regionally well-correlated Deicke and Millbrig K-bentonites, and are in a region where δ13C trends have not been studied.
Full paper: http://www.sciencedirect.com/science/article/pii/S0031018215004563/pdfft?md5=c327a0e7bbfb57b6da08f34570359bd7&pid=1-s2.0-S0031018215004563-main.pdf
Carbonate δ13Ccarb results from one section (i.e. Fort Payne) in northeastern Alabama record a 1.5‰ positive excursion above the Millbrig K-bentonite. We interpret the 1.5‰ positive excursion as a primary feature and identify it as the GICE. The characteristic GICE excursion is absent in the other study sections and we attribute this absence to the presence of unconformities (either non-depositional or erosional) in these sections. We find neither evidence for sea level control on δ13C trends nor conclusive evidence for δ13CDIC gradients along the southeast margin of Laurentia’s epeiric sea. Combined with the proximity to the Iapetus Ocean, these results suggest that carbon isotopic trends in Alabama are a reliable proxy for open ocean conditions. Therefore, despite the absence of GICE excursion in all but one of our study sections, increasing δ13C values in Alabama prior to the GICE provides evidence for a steady 13C enrichment of the global surficial carbon reservoir consistent with a drawdown of atmospheric CO2 during the early Late Ordovician
The work was supported in part by NSF grants (1323444, 1324577 and 1324954). The content is the solely the responsibility of the authors and does not necessarily represent the official views of the funding agencies.
Everytime I hear some nutjob politician or climate pseudo-scientist refer to “carbon pollution,” I just want to slap them for offending my intelligence. That’s like saying a life-giving springtime rainfall is “water pollution.”
So anytime you hear someone today seriously employing the term “carbon pollution” in their climate lexicon, you can be sure you have identified a moron.
CO2 is mostly oxygen so we should call it oxygen pollution. We all have an oxygen budget, must not emit more than our right share, yadda yadda yadda.
Perfectly true.
Then I could burn twice as much carbon by only emitting CO. I am not sure that is such a good idea.
In arguments with warmistas or the just-plain-duped. I push back on the “carbon pollution” phrase by stating firmly, and not allowing interruption, that we are talking a bout CO2, a colorless, odorless trace atmospheric gas that is essential for life and that “carbon pollution” is just a political propaganda term..
I do the same when the fraudster or fool uses “climate change”. I state, again firmly and without interruption, that they are talking about “global warming” which isn’t occurring, even though CO2 levels are rising.
Good stuff Robert of Ottawa.
Mind if I borrow your phraseology?
Joel
I can’t find any mention of pollution in the above article…Or were you just venting about something else.
Joel didn’t say “carbon pollution” was in the article.
And EPA has expressly defined carbon dioxide as a pollutant.
Yeah Eustace, that’s why I asked if he was referring to something else. Make sense to you now?
Dahlquist,
Yes, and No. The article above is about how the ancient carbon cycle is an equivalent proxy for the ancient life cycle on Earth. Carbon is life on this planet, at every epoch, no matter what molecular form it has taken. Long before free atmospheric and seawater O2 evolved from “oxygen polluting” photosynthetic organisms, the myriad branches of carbon cycles and its abundance somehow allowed early life to evolve into complex forms.
But we now regularly hear the ignoranti press, climate criminal politicians, and pseudo-scientists refer to “carbon pollution” as the new catch-all phrase that includes CO2, CH4, etc. Some are merely parroting a phrase they heard from other morons on climate. But “carbon pollution” in reference to a climate change agenda is used by someone with any biological science training, they become climate criminals IMO. (h/t to Tony Heller for that phrase). It’s all part of a totally bogus, intellectually dishonest attempt to brainwash a naive public into accepting carbon tax schemes from “carbon polluters”.
Joel,
I also really wish the media idiots would begin to do what they are supposed to do rather than continually trying to fan the flames on climate and just about anything else. Whether it be biased or just for money making purposes, I blame them for much of the mess we’re in. Even though they are protected by the First Amendment should not allow for obviously fake and distorted reporting of the facts. Or not covering things they should be reporting about because of their biases.
Ask any school boy or girl indoctrinated with false science in our false schools what carbon dioxide is and they will reply that it’s a pollutant that gonna kill us all.
Any, in your opinion, what is CO2, if I may ask??
Dahlquist,
This is what we’re up against:
http://americandigest.org/school%20brainwashing.jpg
alb_x
Are you asking me what co2 is?
db
I have been wondering what kind of indoctrination about climate the kids are getting exposed to in schools these days. I’m sure they could probably use those “Cult” deprogramming experts when they graduate college. Or high school
“I have been wondering what kind of indoctrination about climate the kids are getting exposed to in schools these days. I’m sure they could probably use those “Cult” deprogramming experts when they graduate college. Or high school”
Dahlquist
I found this on my governments education website. I think its worse than you think!
https://thedemiseofchristchurch.files.wordpress.com/2013/03/exemplar-3-20=
08-exam.pdf
This is just one of many listed at http://www.nzqa.govt.nz/ncea/assessment/view-detailed.do?standardNumber=90812
Although they are now listed as “expired” I’m sure the “updated ones” will be even more contemporary.
Cheers
Roger
http://www.thedemiseofchristchurch.com
Sorry, update of link.
http://thedemiseofchristchurch.files.wordpress.com/2013/03/exemplar-3-2008-exam.pdf
Cheers
Roger
My god Roger… the world really is getting insanely Orwellian!
I was shocked by the level of blatant indoctrination!
“I have been wondering what kind of indoctrination about climate the kids are getting exposed to in schools these days. I’m sure they could probably use those “Cult” deprogramming experts when they graduate college. Or high school”
They sure need something-
http://www.smh.com.au/national/health/groundbreaking-australian-study-finds-thousands-of-children-and-teenagers-suffer-mental-illness-20150806-gisz45.html
and perhaps Cookup and Loondosky, et al need to have a good hard look at themselves and why-
even Youtube warns the viewer about the byproduct of these disgusting Green cretins
+ 1
Shockingly Dr. James Hansen says co2 is a fertilizer. Not all warmists call co2 pollution as they still remember some of what their primary school biology lessons taught them.
Hear Hear!
“So anytime you hear someone today seriously employing the term “carbon pollution” in their climate lexicon, you can be sure you have identified a moron.”
It would be more accurate to say you have identified a liar. Or we could be kind and call them a deluded climate fear stooge.
Aren’t CO2 levels controlled mostly by Temperature? (Henry s law) Isn’t that why CO2 levels lag temp. ?
(just learning)
Does the last word in this sentence need to be corrected?
The study “Carbon Cycling across the Southern Margin of Laurentia during the Late Ordovician,” recently was published in Palaeogeography, Palaeoclimatology, Palaepoecology.
Thanks. Good article.
“””””…..
Study: “warm average temperature and flourishing life” equated to high CO2 levels; low average temperatures “preceding an ice age and eventual mass extinction”, to low CO2.
I think extinction, is the eco fascist preferred outcome!
@george E. Smith
October 11, 2015 at 10:20 am :
In rationalising that statement, I came to the conclusion that the long period of oceanic cooling as the ice sheets grew saw Boyle’s Law dissolving CO2 down to lower atmospheric levels. Is that it?
Lower available CO2 equates to lower primary productivity, and thus ultimately lower plant and animal biomass. Profoundly lower CO2 – such as now and during the Permian – implies a potentially unstable situation prone to sensitive “corrections” – e.g. extinction events – when the system is disturbed. Permian, Permian, Permian. Look at the Permian climate, and the end of the Permian. Compare it to the present. Note the present positive response to large regions around the globe to even minor changes in atmospheric CO2 and then consider reducing it. Again, look at the end of the Permian. The current threat is that a cascade of plant community failures could be initiated by lowered CO2. That would indeed lead to the 6th extinction. AGW proposals to reduce CO2 are proposals to commit global suicide.
George E. Smith says:
Right, it really reads gawd awful bad when the emphasis is put on the CO2 via the wording “equated to”.
A miseducated mind will automatically assume that the CO2 is controlling the temperature. Thus the correct wording would have, should have been …. “resulting in”.
Here is a reminder about high co2 and ‘mass extinction’. In short life thrived, rapid turnover and all that. See these abstracts on the PETM.
Extracts
These idiots/scam artists cannot predict the weather 12 hours from now, let alone a hundred years. Are there that many LIV’s out there who believe them? (guess so).
*** Albedo regulation of Ice Ages, with no CO2 feedbacks ***
My analysis of Ice Age initiation and propagation is now up on the Warwick Hughes site. It speculates that the primary feedback for Ice Ages was actually albedo, not CO2. The overwhelming power of albedo was only overcome when CO2 dropped to dangerously low levels, resulting in widespread plant dieback and several millenia of dust storms. These dust storms reduced the albedo of the ice sheets, and allowed the Interglacial warming periods.
But Interglacial warming only happened when the precessional Great Year’s summer season increased insolation in the northern hemisphere. So several components are necessary for an Interglacial — very low Co2, plant dieback, dust storms, low ice albedo, and a Great Year summer season. So CO2 does falicitate Interglacial warming, but only by getting so low that all the plants die !!
http://www.warwickhughes.com/blog/?p=4019
http://www.warwickhughes.com/agri15/ralph_ellis_oct15.html
Ralph
Very interesting. About dust storms: ice fields produce copious amounts of dust underneath and at the leading edge, referred to as “glacial flour” http://www.sevenwondersofwashingtonstate.com/the-palouse.html . This finely ground rock, at the glacier location, after the glacier melts, or deposited and carried away by drainage rivers, can be picked up in the wind and blown for many miles to another location, including on top of other glaciers. In high mountain lakes, you can still see the initial impacts of this fine ground rock, changing the color of lakes to turquoise or brown, depending on the rock it was ground from.
The lakes in Switzerland that are fed with glacial melt are a beautiful turquoise – particular Lake Brienz.
This finely ground rock, at the glacier location, after the glacier melts, or deposited and carried away by drainage rivers, can be picked up in the wind and blown for many miles to another location, including on top of other glaciers.
_______________________________________
This is what climatologists say. But the dust storms in the ice record all occur BEFORE the interglacial and therefore BEFORE the glacial retreat. In which case you need another reason for the dust storms. And since CO2 hits a minimum before the dst storms start, the obvious candidate is plant-life dieback through a lack of CO2.
Cheers,
Ralph
Understood. Wherever this dust lands, if winds pick up again dust erossian of this extremely fine particulate matter will get picked up and moved again. With it being meters thick, it makes sense to me that a good deal of this material will be in your dust storms, mixed with finer decayed material. It should be easy to determine. What is in the dust you speak of? Organic material or rock material? If mostly rock, I am betting it came from loess soils, once again picked up and moved.
Oops: erosion.
>>What is in the dust you speak of? Organic material or rock material?
It is the dust storms in my figure 8, in the article on the warwickhughes site (above). The material is described as being dust from barren lands in Asia, so I presume a fine loes material. I will have to investigate that aspect further.
But the important fact that seems to have been lost in the papers I read, is that this dust was deposited before the Interglacial, and thus the resulting reduction in albedo could well be a critical factor in Interglacial initiation and feedbacks.
Ralph
Would this not be preserved in the ice core records? Earth-wide dust storms should be easy to detect.
Is there evidence for this?
Wind-blown dust can come from glaciers as well as from fine-grained soil and decayed flora. Winds depend on pressure differences, so no, layers of dust would not be global. In the Scablands of Montana and Washington there are several sites that show dust deposits layered with lake deposits. The deposit pattern of dust (loess soil) often points to its origin thus also telling a story about paleowinds.
Menicholas, yes there is plenty of evidence of massive amounts of dust from polar ice cores. Below is an example from Vostok.
https://upload.wikimedia.org/wikipedia/commons/b/b8/Vostok_Petit_data.svg
>>Would this not be preserved in the ice core records?
>>Earth-wide dust storms should be easy to detect.
They are. If you follow the link to the article, one of the last graphs shows the dust storms in the ice-core record. And they all occur just before an Interglacial warming, which strongly indicates that they are one component in the forcing or trigger that allows an Interglacial.
Ralph
Because they are in ice cores, does not mean they are global. There is plenty of evidence for uneven deposition, or even absence of evidence, in other ice cores in the opposite hemisphere for events that occur in the other (for example volcanic ash). Loess soils are a very good example of this. They are unevenly distributed across the upper latitudes, with a deposition pattern that points to the edge of northern hemisphere ice caps, but not at every point. Dust is one of those things that, if in ice cores, the particulate matter is quite small, not even visible with the naked eye. But at its source, where it lands and builds will be variable, with larger matter close to the source and finer matter further away. It even has a direction pattern that tells us which way the wind was blowing and how hard it was blowing. That is not to say it could not have added to some small degree of glacial melt. But I doubt it was a trigger to an interglacial, or even a significant factor. In my opinion, it is more likely a symptom pointing to another reason for a glacial age moving into an interglacial age. What does it point us to is the interesting question.
>>Because they are in ice cores, does not mean they are global.
The paper I read on this said these dust layers were of Asian origin (not sure how they know that), while the ice core in my fig 8 is the Vostok core in Antarctica. So I am guessing these were worldwide dust storms. Don’t quote me on that, as I shall have to look it up again.
Likewise, the fact that each Interglacial was preceeded by at least 10,000 years of dust storms, is prima face evidence that dust storms are a vital component in Interglacial initiation and encouragement. And if this is so, then this is another indication that these dust storms were worldwide. And if this is so, then we have the likely last factor required for Ice Age initiation. So the Interglacial requires:
Not enough CO2 (below 180 ppm)
Plants are starved of CO2 and die.
Barren lands are exposed.
Dust storms cover the ice sheets.
Ice albedo is greatly reduced.
And now a Seasonal Great Year’s summer season can warm the NH.
Thus CO2 IS a primary controller of Interglacial warmings, but only through getting so low that all the plants die. And this is not exactly the message that the Warmists are trying to broadcast to the world. It means that the primary danger is not enough CO2, rather than too much of it.
ralfellis, if you look on graph showing dust in ice cores you will see that amount of dust in atmosphere is around1 – 1.6 ppm at maximum. This amount is too small to have effect. It is minuscule amount even comparing with CO2…
On the other side it clearly inversely corresponds with Earth temperature. From this is clear that not dust is causing temperature change, but temperature change is causing dust.
And my opinion is that lowering CO2 is causing extinction of plants and turning green land to dusty desert. Thus increasing dust content in atmosphere.
Peter
if you look on graph showing dust in ice cores you will see that amount of dust in atmosphere is around1 – 1.6 ppm at maximum. This amount is too small to have effect. It is minuscule amount even comparing with CO2…
____________________________________
But as I pointed out in my article, the dust concentrates during the Great Year summer season.
http://www.warwickhughes.com/agri15/ralph_ellis_oct15.html
The dust is built up in the ice sheets over at least 10,000 years. And as the ice melts most of the dust stays on the surface, as the thread argument below has demonstrated. If we assume that a Great Year summer season can melt 10,000 years of ice in 100 years, and 10% of each year’s dust stays on the surface, then after a century of warming the dust will have concentrated to 160 ppm.
In addition, this is the Vostok ice core – as far from the ice sheet termini as you could possibly get. If we conservatively say that the temperate latitude ice sheets had 1000 times as much dust on them, then the dust there will concentrate to 160,000 ppm on the surface. So a full 16% of the surface layer is comprised of dust. Now that is a super-low albedo layer, which will very quickly melt any ice sheet, when subjected to the increased Great Year summer season insolation.
Ralph
>>Because they are in ice cores, does not mean they are global.
This paper traces the source of Antarctic aeolian dust. And after all their convoluted bluster, the important strapline is:
Quote:
However, despite the clear evidence for a change in dust characteristics and provenance with climate, there is still no consensus on the assessment of dust origin in central Antarctica during the Holocene.
http://www.taldice.org/pub/taldice/2010_Delmonte_JQS.pdf
But it was not the Holocene we were looking for, so I will continue looking….
R
Ralfellis:
actually I think you can be onto something here. Amount of dust is small, but it can add up and accelerate melt. I see 2 states here:
1. Ice is growing, small amount of dust is always covered with fresh new snow, albedo is high.
2. Ice is retreating, new snow is melted away together with some amount of old ice and dust is concentrating on surface.
But this is only positive feedback, it can not work without first trigger and change of conditions.
And I think in this case precipitation is more important than temperature. There is no way from snowball state if temperature is low and you have loads of fresh new snow on ice. Precipitation must be cut off and you slip from state 1. to state 2. And this is in line with theory I wrote above, about plants die due to decreasing CO2 level, drying out of continents.
>>But this is only positive feedback, it can not work without
>>first trigger and change of conditions.
The trigger is the Great Year summer season. It could be assisted by forest fires, like the Ice Age D-O warming events. But the start of each Interglacial is coincident with Great Year summer season, suggesting that that is the only trigger necessary.
>>lowering CO2 is causing extinction of plants and turning green
>>land to dusty desert. Thus increasing dust content in atmosphere
As I said in my article. 😉
Doesn’t a very low CO2 —> Plant dieback —> lead to high CO2? That organic carbon in the dead plants must either be buried in coals and organic rich shales, carbonates, or it forms CO2.
Furthermore, Plant dieback should lead to a drop in albedo plus dust storms that should, by your argument, prevent the formation of an Ice cap in the first place.
It is interesting that the slide into an ice age is slow after the initial hit. But the rise from the bottom is fast. I wonder why that is.
Plant dieback would lead to a temporary increase in albedo in the tropical and temperate regions, that is true. But the whole thrust of this theory is that the tropics are irrelevant in Interglacial initiation and promotion. This is the problem with every scientific paper I have seen, for they smear the Milankovitch forcing and albedo feedbacks out across the whole globe. And that is an erroneous methodology.
In a normal year, the melting of Canadian snows is caused primarily by increased insolation and warming in Canada, during the spring and summer, not by the temperature in Brazil. The same goes for the Great Year (the precessional year of the Milankovitch cycle). The melting of the northern ice sheets is caused by the Great Year ‘summer’ in the high latitudes of the northern hemisphere (a 5,200-year summer), not by some artificial average temperature across the entire globe.
Ralph
It is interesting that the slide into an ice age is slow after the initial hit. But the rise from the bottom is fast. I wonder why that is.
_______________________________________
Probably because of the differing albedo response to warming and cooling.
Descent into an Ice Age.
Each year a new layer of snow is deposited, that makes the ice sheets extend incrementally. So the reduction in albedo is also incremental and equally proportioned.
Rise into into an Interglacial.
All of the ice-sheets have layers of dust in and on them, deposited by the great 10,000-year dust storms that preceded each Interglacial warming period. So as the Interglacial proceeds to melt the surface ice, the surface dust will combine with earlier dust lower down, thus creating a dirtier and dirtier surface with less and less albedo each and every year. So the Interglacial melting is not incremental and proportional, it accelerates until all the 10,000 years of dust layers now reside on the surface of the ice sheets.
Also there is a double albedo effect during the Interglacial. There is the reduced albedo of the land being exposed, and also the reduced albedo of the dirty ice sheets. When ice sheets are accumulating, the only difference each year is the reduced open land area.
R
We can extrapolate what may happen with dust with what does happen with carbon layers. The surface does not get dirtier and dirtier. The carbon ends up at the bottom of surface melt pools. I still say that the dust is pointing to another reason for moving from a glacial age to an interglacial age (which I also indicated in another comment that apparently was sent into bit heaven).
There is something else with regard to widespread distribution of fine dust – nucleation for the cyclogenesis of rain in diverse areas altering albedo, character of the local biosphere and hence its fauna. Lots of potential for a cascade of chaotic events.
I wonder if, when so much ice accumulates, the higher salinity of the oceans could have something to do with the recovery from the ice ages.
>>The surface ice does not get dirtier and dirtier,
>>it end up at the bottom of melt pools.
That is not quite true, is it. There is plenty of evidence that layers of dust and soot remain on the surface of the snow. Think of the piles of snow at the side of the road, after a heavy winter snow. Or look at this image of an ice sheet. There are plenty more like it.
http://3.bp.blogspot.com/-nfHJuAHwieI/VBiZOK9xEaI/AAAAAAAANTw/uiuOk04rLUs/s1600/greenland2.jpg
ralfellis
The actual Arctic (and Antarctic) sea ice albedo changes have been measured over the full year by Dr Curry during her year-long Arctic “winter-over” with the icebreaker during the SHEBA expedition in 1997-1998 as the ship drifted between latitude 75 and latitude 81.
The sea ice albedo is likely to be a bit “dirtier” (darker) now in mid-summer IF Chinese coal and polution is the cause of the darkening every summer. But if surface water pnds are the biggest darkening factor (which is a very, very important factor for the average Arctic sea ice albedo change!) then the change may be very little from 1998 to 2015.
See the graphs at the bottom of these Dr Curry papers:
http://www.ral.ucar.edu/projects/GCSS/WG5/sheba_albedo/
http://curry.eas.gatech.edu/SHEBA/papers/Tschudi/
But Perovich has better pictures:
http://onlinelibrary.wiley.com/doi/10.1029/2000JC000438/pdf
Anyway, on 1 April, Arctic sea ice albedo is 0.83, then it gets darker on a semi-sine wave curve down to about 0.43 on July 5, then goes back to 0.83 by mid-October as each night’s freeze over stays frozen longer and longer to accumulate a more and more permanent snow cover of fresh snow.
Each year, fresh snowfall buries the dust from the previous year.
>>Mark
>>Each year, fresh snowfall buries the dust from the previous year.
But during an Interglacial warming period, each year’s melt uncovers dust laid down in previous centuries and milennia. So during an Interglacial, the ice sheets get progressively dirtier as the years roll on. And since the dirt and dust cannot go anywhere it builds up on the surface, and the ice-albedo gets progressively lower in successive centuries and milennia.
Some dirt and dust may get flushed into a melt ponds, but my simple experience from looking at annual melts, is that not much would. The dirty ice on our pavements in the spring stays dirty – it does not magically clean itself
Ralph
>>On 1 April, Arctic sea ice albedo is 0.83, then it gets darker
>>on a semi-sine wave curve down to about 0.43 on July 5,
>>then goes back to 0.83 by mid-October.
But during an Interglacial warming period, it might go more like this:
Century 1
April …….. 0.83
July ……… 0.40
October .. 0.80
Century 2
April …….. 0.78
July ……… 0.32
October .. 0.76
Century 3
April …….. 0.72
July ……… 0.26
October .. 0.68
R
Pamela, my theory why is onset of ice age so slow is that temperature reflects volume of biosphere and thus atmospheric level of CO2. Simply biosphere is not balanced in CO2 cycle, it is consumer of CO2 on the end.
So biosphere is slowly consuming available CO2, sequestrating it as carbonates and coal. Plants are slowly dying out. Disappearing from higher altitude to lower with higher partial CO2 pressure. And from colder areas to warmer, turning higher and colder areas to deserts.
Northern forests are retreating south, changing land to tundra. This is also changing albedo of land, because forest is still dark after 3 meters of the snow, but grassland is white after 10cm…
This is probably main reason of onset of ice age, energy gained/not gained by albedo difference between snowy forest and grassland. As it is all about energy balance, it is obvious that it works somehow in harmony with Milankovitch cycles…
I think it is oceanic/atmospheric teleconnections combined with Milankovitch cycles and continental positions wut done it. Dust is primarily a symptom. Oceanic heat release would be relatively fast as the ocean layers finally send all heat to the surface which also ride on the currents to a central location (kind of like now) under regularly occurring primarily stuck in El Nino like conditions with the occasional Neutral/La Nina (this results in cloud covered, moist air, growing conditions) to produce a slight jaggedness to the sudden rise. El Nino is the odd NOT normal thing that happens.
What are the conditions that lead to lack of growth? Easterlies that wax and wane between normal and La Nina are the NORMAL slow oceanic heat re-charging actions that occurs at depth as well as on the surface, which also leads to colder dryer air and would be jaggedly sending land into more and more freezing conditions. The Milankovitch Cycles may be the trigger between stuck in El Nino warmer conditions that happens relatively quickly but short-lived, interspersed with a slow move downward in temperature as La Nina’s set in. The Land would get cold because the heat is going into the oceans, not coming out of them, as would be the case with El Nino conditions.
Peter
my theory why is onset of ice age so slow is that temperature reflects volume of biosphere and thus atmospheric level of CO2.
__________________________________
But the whole point of my paper is that CO2 is insignificant, and plays little or no role in climate regulation:
http://www.warwickhughes.com/agri15/ralph_ellis_oct15.html
If you look at my fig1, the standard CO2 vs Ice Age temperature graph, you will see that CO2 is NOT a primary regulator of temperature. When CO2 hits a minimum (minimum greenhouse) the world warms. When CO2 hits a maximum (max greenhouse) the world cools. If CO2 were the primary feedback for global temperature, that would not happen.
In addition, Interglacial temperatures always peak at the same temperature, when CO2 is 300 ppm, but still has plenty of forcing capability left (if it were a primary feedback). Why does the climate stop warming at this standard temperature? Because the primary feedback is albedo, and the albedo forcing-feedback stops when the ice sheets hit a minimum – ie, at the temperature we have now.
So CO2 is NOT the primary regulator of climate, not then and not now. And so the entire CO2 bandwagon is built upon a false premise. The IPCC should be setting a tax on albedo, not CO2…… 😉
Ralph
Pamela
I think it is oceanic/atmospheric teleconnections combined with Milankovitch cycles and continental positions wut done it. Dust is primarily a symptom.
___________________________________
Wrong tree and dogs barking.
Plate tectonics is far to slow to be involved in the 88k to 110k Ice Age cycle. And the decadal El Nino cycle is far too short. You need something that operates on millennial cycles …. errr …. something like the Great Year summer season. 😉
And dust is hardly a ‘symptom’. The fact that each and every Interglacial warming is preceded by a dust-storm era is prima face evidence that dust eras are causal to that warming. And since a dust era can be directly correlated with ice sheet albedo, we have a likely mechanism too.
http://www.warwickhughes.com/agri15/ralph_ellis_oct15.html
Why look for anything else?
Ralph
I actually think the things that jaggedly warm or cool the planet on short term scales is the same mechanism at millennial time scales. The Milenkovitch-induced Solar insolation cycles stretches out and pulses these short term mechanisms setting up the glacial-interglacial pattern recorded in proxies. Because we have only a tiny snippet of these measured oceanic-atmospheric processes, we fail to see what is right in front of our noses by making the assumption that what we see can only be as long as what we see.
If I were a scientist, I would be attempting to model ENSO processes combining a discharge-recharge wind-driven mechanism, with a cyclic change in insolation brought about by the cyclic change in solar inclination in the equatorial band.
Ralfellis, I read your document and I can only agree. It all fits together. I knew that onset of ice age was caused by plants dieback due co2 getting low, but I didn’t know the trigger needed to get back from this situation. Your explanation with dust concentrating and finally getting Earth from ice age is absolutely logical.
I only want to point you to another feedback which can be very important in start/end of ice age. It is albedo of forests. I was flying few times over Eurasia and North America in winter and I was closely looking on landscape. One thing which surprised me was the color of Siberian or Canadian forest. It was dark, almost black. there was a lot of snow on the ground, it was clearly visible on riverbeds, creeks, banks were nicely smooth by amount of snow. But in forests this snow was under the trees. So here is the difference:
Siberian and Canadian forest has in winter albedo I guess around 0.4, in summer around 0.3, 0.35 average. But arctic tundra has albedo in winter 0.85, summer around 0.3, 0.57 average.
This forest is located exactly around 60 – 65 degrees north, area most affected by Milankovitch cycles. So simply when atmospheric CO2 is getting lower and tree line is continuously moving further south, average albedo of former forest land is dramatically increasing from ~0.35 to ~0.57. If the average solar irradiance in this area is 440W/m2, This is lowering energy gain from 286W/m2 to 233W/m2, around 53W/m2 difference. So this is clearly positive feedback, the lower is temperature the less energy gain.
>>Another feedback which can be very important in
>>start/end of ice age. It is albedo of forests.
And possibly the burning of forests. All of the Dansgaard–Oeschger warming events during the last Ice Age were caused by forest fires, and they had a considerable effect in the NH (not so much in the SH).
And this again proves that albedo is the primary driver of Ice Ages. CO2 from forest fires is simply too weak to have any effect on climate, perhaps 0.5 wm2 at most. But if the soot lowers the ice-albedo across the NH ice sheets from 0.6 to 0.4, that represents a temporary 60 wm2 increase, in the NH summer. Now that would get things melting.
Ralph
>>I actually think the things that jaggedly warm or cool the planet
>>on short term scales is the same mechanism at millennial time scales.
But that is not so, is it? As mentioned above, the jagged saw-tooth Dansgaard–Oeschger warming events are caused by forest fires.
http://www.pages-igbp.org/download/docs/newsletter/2010-2/Special%20Section/Daniau_2010-2%2861-63%29.pdf
CO2 is much too weak to cause this D-O warming, it has to be albedo. And it has to be an albedo change on a substantially frozen and high albedo planet (soot deposition on dark earth or vegetation would make no change). So we know that albedo reductions can have a dramatic effect on NH temperatures during an Ice Age, because some of these D-O excursions were of 10ºc. So why does anyone think that CO2 is the primary driver of world temperature, when a simple continent-wide forest fire can change NH temperature by 10ºc?
The Earth is a bi-stable climate, and will happily flip from one extreme to the other. And although the Ice Age regime is very stable, and could last indefinitely, it is highly susceptible to one key ingredient – changes in albedo. A NH ice sheet albedo change from 0.7 to 0.4 during the Great Years’ summer season can produce a massive 150 wm2. That’s two orders of magnitude greater than anything CO2 can do. And albedo will make the change immediately, not over a few thousand years.
Assumptions:
380 wm2 surface insolation, after cloud albedo.
Absorption increasing from 114 wm2 to 228 wm2.
60 wm2 increase insolation die GY summer, 36 wm2 net.
Ralfellis, I just read this document:
http://sciencearchive.uwaterloo.ca/~twdedwar/reprints-pdf/2000-qr-macdonald-et-al.pdf
It is very interesting, investigating history of northern tree line in Russia. What is most important is result of this, maximum north reach of tree line was 9000 – 3000 years ago. From this time we are going downhill.
And the really interesting thing there is Figure 4. first and last picture showing and comparing July insolation 70 North with Russian tree macrofossils for last 10,000 years. Graphs are practically identical. It is clearly showing that boreal forest northern extent is directly dependent on NH insolation and Milankovitch cycles.
It is clearly showing that boreal forest northern extent is directly dependent on NH insolation and Milankovitch cycles.
_______________________________
Indeed, most of the indices point towards the same conclusion.
The only saving grace is we have reached about the lowest that the current Milankovitch Great Year will go. We are entering a period of no orbital eccentricity, and without eccentricity all the Great Year seasons are the same (in a neutral position).
So as long as there is not a huge time lag to temperatures, we should no get too much cooler than now. Although our current temperature still seems a bit too high, for the reduction of insolation that has already taken place.
Ralph
Ralph, yes we reached bottom of current Milankovitch cycle, but your whole theory is that those cycles are not main driver, but more like possible trigger. And it then depends on secondary things like amount of world snow precipitation and amount of dust remaining on ice sheets.
In case of world snow it looks like amount is increasing, we remember last two winters in east US and Canada, same on Siberia. This year started with shortest season without snow in Maine, there was first snow in Europe at least month early.
In case of dust only one thing is important, did we already reached interglacial minimum area of ice sheets? If yes, from this point dust doesn’t matter. It needs to collect for 70,000 years for effect. And from all data it looks that ice sheets minimum was 8000 years ago.
So from now on it depends only on amount of new snow and current setup with El Nino and warm ocean is ideal prerequisite for high amount of precipitation.
This article has it wrong in that they are trying to say that co2 changes somehow led the climate change and that the ice age of the Ordovician period did not occur not only when co2 concentrations were not high but not until after co2 concentrations fell.
Conventional studies do not see it this way . The up shot being this is another article to twist data in order to support to AGW theory.
Their money phrase: “Understanding carbon cycles adds value to our knowledge base of climate change.”
These are simply paleogeologists hoping to cash-in at the next grant submission by using the right PC phrase-ology. I can’t blame them for wanting to keep the grant funding alive in an era of declining grants.
It is the climate criminal pseudo-sceintists today who use terms like “carbon pollution” and participate in tampering with and adulterating the historical temperature records to give license to dishonest politicians seeking more tax revenues to redistribute that I despise.
+ 1 (again).
Hmmm…only thing is, at this point the truth is so obviously contrary to what they are saying, and the negative results of CAGW alarmism on our economy and otherwise so plainly evident, that continuing on with the charade is like continuing on with a career as a bank robber or con artist.
It is well beyond an academic disagreement, well beyond justifiable differences of opinion.
It can not be excused, IMO.
“When an honest person finds out they are wrong, they either stop being wrong, or they stop being honest.”
Menicholas
Bread crumbs perhaps?
“The work was supported in part by NSF grants (1323444, 1324577 and 1324954). The content is the solely the responsibility of the authors and does not necessarily represent the official views of the funding agencies.”
being dishonest to the NKVD is A-OKAY. Its just who are they leading on that is the question.
michael
I would like to see someone develop a website that comes right out and blatantly advertises to make up or massage any data to fit whatever hypothesis the client wishes to “support” thereby. Then keep track of all the areas of study that utilize that site. Would climate data be foremost in requests for such?
If you look at the chart of temp and co2 over the last 500 million years, co2 only drops from about 4500 ppm to 1500 ppm before, during and after the Ordovician ice age, and it wasn’t an abrupt drop. See chart on the page below.
http://www.geocraft.com/WVFossils/Carboniferous_climate.html
The article makes it seem as if co2 just fell to the bottom off the chart but doesn’t even mention a number they think it fell to, so how can they make the claim that low co2 is what caused the Ordovician ice age or even come close to being able to point to it as being a possible factor. As I stated above, from a graph of past co2 levels, the lowest percentage of co2 in the atmosphere before and through the Ice age was 1500 ppm. From what the AGWers believe today, we should be cooking alive at 1500 ppm.
There has been a concerted effort the past 15 years or so so to rewrite our understanding paleohistory in order to blame all things on CO2.
Salvatore, CO2 is driver of climate. But not its abundance but lack of it. Above 260ppm it has no effect, but decrease from 260ppm to 160ppm is directly driving temperature down through effect on biosphere and plants die out.
Ummm…. “forecast [] variability”? Riiiiigt. Perhaps forecast a primary quantity before you tackle the moments.
‘A drop in CO2 due to the burial of organic carbon in the Late Ordovician is the exact opposite of what is happening now as massive amounts of CO2 are being released’
CO2 during the Late Ordovician period is thought to be some 4,000 parts per million. CO2 has increased by a minute 150 ppmv during the past 150 years, reaching the frightening run for the hills level of 400ppm. Stop reading right there.
So they find 3 samples don’t show the “excusion” and one that does. They conclude that the three sample must be in error due to erosion or something … and retain the sample that fits thier preconcieved idea that CO2 changes climate.
Par for the course climatology.
I agree, Mike. Language so obtuse by design can lead to only one interpretation:
“We found one study section that supports our hypothesis, but were unable to replicate the finding in three other study sections.”
I am sympathetic with the hypothesis. I support publication of a weak, unconfirmed finding; else how are other people to know what to look for? But that twisted verbiage doesn’t help their case with me.
“I am sympathetic with the hypothesis. I support publication of a weak, unconfirmed finding; else how are other people to know what to look for? But that twisted verbiage doesn’t help their case with me.”
Well do you or don’t you support publication? Why has it become that any Paper is the word of GOD? Why can’t people be allowed to go out on a limb? These people seem to be doing research, Say thank you, now prove it.
michael
I do support publication. But I can have a negative reaction to flim-flam. What’s wrong with being up front about weakly supported data instead of hiding behind the use of triple negatives in your conclusion?
The Ordovician Ice Age was cause by semi-super-continent Gondwana transiting the South Pole. Think Antarctica times 7. Think of global Albedo from all that ice at the South Pole rising to 35% versus today’s 29.8%. It is about a clear-cut of a case as it can get.
http://www.ncdc.noaa.gov/paleo/ctl/images/figure05_10.jpg
All of the CO2 estimates around this time-period are about 4500 ppm, or what should have led to +12.0C world compared to today. Instead we find it cooled off starting at 460 Mya and reached the coldest point right at the Ordovician Extinction at 443 Mya to about -7.0C and never really recovered back above 0.0C compared to today until 430 Mya. The ice age lasted 30 million years.
http://s14.postimg.org/7keqi3mwx/Ordovician_Extinction_Temp_CO2_Zoom_In.png
best explanation i have ever heard, thanks Bill.
So where was all the rest of the land; Eurasia, when this big thing was running over the south pole, and just how was earth’s axis sitting relative to its orbital plane ??
There is plenty of evidence for pulses of colder climate persisting into the Silurian, so this wasn’t, as often presented, a one ice advance-retreat event. This graph also suggests a short sharp cooling prior to the big one.
Nice graph Bill. Source please.
Ciao
John
Gondwana or parts of it persisted at the South Pole for another 140 million years. It takes a long time for a semi-super-continent to drift 10,000 kms.
Gondwana at the South Pole was also responsible for the Carboniferous ice age from 360 Mya to 300 Mya.
In the Silurian, when Africa/South America were centred over the Pole, there were periods when then was little glaciation (and as you noted periods when there was). Although there is little discussion about this anywhere, I think what happened is that the land of Gondwana got pushed below sea level from all that ice that built up in the periods of glaciation. We see this today where large parts of the Arctic Ocean basin is really continental shelf that was above sea level prior to the period of recent glaciations over the last 2.7 Mys. Hudson Bay as well. For the most part, when land get pushed below sea level, glaciers cannot build up, only sea ice, unless there is land near-by that build up the glaciers first and push their way in as in what happens in Hudson Bay. It can then be the central spreading region, but the glaciers do not start here.
I think that explains most of the climate from 460 Mya to 300 Mya. Then after this period, what do we have. Super-continent Pangea at the equator now instead of one of the poles. Now we have a +10C world versus the -7.0C world of the Ordovician in which the newly evolved complex life-forms were not capable of adapting to. Extinction.
I contest the claim that CO2 levels of 4500ppm should result in a world that 12C warmer than today. More likely 1 to 3C range.
Note that they carefully avoid any comment or study on the relative phase of the CO2 in relation to the on coming glaciation but think that avoiding questions of causation will help us understand climate change in the future.
sociology is starting to look like a hard science !!
Was it ever a science? It’s an -ology!
Mike, If they can’t explain the warming pause, they can’t explain the warming cause.
(H/T to the hockey schtick)
I knew it. It’s that CO2 that done it, the great extinction. It’s the lack of CO2. CO2 is always to blame, either because of too much of it, or because of the lack of it. Let’s keep it exactly at 350ppm +/-0.000%
Seems to me it was warming faster at 350 ppm than it is at 400.
Hopefully the “sample prep” people who “drilled the cores” remembered to saw off the end of the core that had been exposed to diesel engine exhaust (surface exchange reactions) from the time when the interstate road system (Eisenhower Military Road System) to present. On travel so I can’t get the paper.
Oklahoma Fittstown (Fig. 7 above) claim to fame is U.S. Route 377, connecting east of Oklahoma City, Stroud, to the Mexico US border in southwest Texas, Del Rio.
The oil truckers must be slushing gallons out of their rigs (or the sample spot is a notorious place where “accidents” tend to happen)!
Ha ha
They’re doing the “Look! A squirrel!” routine.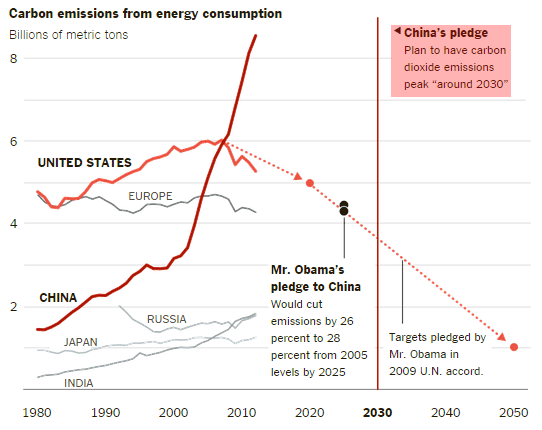

China is the big CO2 emitter, not the West:
http://realclimatescience.com/wp-content/uploads/2015/09/ScreenHunter_10514-Sep.-24-01.15.gif
But China gets a free pass:
Demonizing “carbon” is all politics, and a 180º flip-flop from Science a century ago.
Reality: the rise in CO2 has been a net benefit, with no observed downside:
http://www.co2science.org/education/reports/co2benefits/figures/Figure8.gif
[^That^ interesting chart shows that ∆CO2 follows ∆temperature]
[click in chart to embiggen. See the “Note” in the chart.]
But there is no correlation between the rise in CO2 and subsequent temperature changes:
http://jonova.s3.amazonaws.com/guest/de/temp-emissions-1850-web.jpg
However, there is a very strong correlation between rising CO2 and global wealth:
http://climate.mr-int.ch/images/graphs/gdp_vs_carbon.png
Draw your own conclusions…
Case dismissed!
Next on the docket?
So where did you hide the graph of all the carbon dioxide take up by US agriculture including forestry farms that results in the USA being a net carbon sink; the largest land based one on earth, and just about the only one.
g
George,
Is this the map you wanted?
http://www.drroyspencer.com/wp-content/uploads/co2_growth.jpg
Db, (pardon my skull density) I can’t figure out what the map is measuring.
Dawtgtomis,
My apologies. I grabbed that chart thinking it showed CO2 sinks, but it’s actually a chart of the increase in agricultural productivity and the biosphere due to the rise in CO2. I’m still looking for a chart of sources/sinks. I have several thousand charts saved, so it may take some time. It may also be that I don’t have it.
OK, maybe this is a better OCO2 map:
http://www.earthmagazine.org/sites/earthmagazine.org/files/2014-12/PIA18934_0.jpg
It’s not a map of sinks, but I’m still looking…
Ag productivity increase- thanks, it’s a keeper then. Do you have a timespan parameter for it?
It might seem odd that anyone would tolerate the situation illustrated in your graph of Chinese vs American emissions and emissions pledges.
Imagine that you are Apple…
So, you have noticed that Americans are have access to huge amounts of cash.
You intend to take much of that cash from them.
You would like to sell them expensive products and then also to invest in schemes which profit by jacking up the cost of the power provided to Americans.
However you have no concern about the rising cost of power in America, because you primarily manufacture your products cheaply in Asia.
Ideally, then, Chinese energy (and labour) should be plentiful and cheap, and yet American energy should be made as expensive as conceivably possible. A win win.
It may be wise then, to employ the world’s number one alarmist inconvenient truther, and then send him off on a mission to convert all Americans into a nation of willfully self-defeatist polar bear hugging doom-obsessed loonies.
In that sense, this should be seen as a simple marketing complain intended to turn energy into a “luxury brand”.
And clearly Apple isn’t the only one who is happy to see this plan bear fruit.
China is happy. Putin is very happy. The Arabs are happy. And all the Macbook sporting leftist’s sitting in Starbucks blogging about extreme weather and abuse of corporate influence in politics, are happy. John Cook and Stephan Lewandowsky are happy.
Basically, everybody is very happy about all this total bullcrap.
Everyone except us.
If India hasn’t passed the US in terms of CO2 production, it will do so any day now.
I am Canadian , so my opinion may be a little biased BUT…..I WANT more Glo.Bull warming !!!! I am tired of freezing my nuts off every 6 months !!!! PERIOD !!
I would think the rest of humanity would be wanting to count on CO2 to keep us off that nasty looking slide into a regularly occurring deep freeze. But alas, it did not do that in the past when it was even higher than today. The freeze/shirtsleeve yoyo continued.
Really Pamela, when was the time in the past when CO2 was higher than now during the Quaternary glaciation (last 2.6 My)?
Here ya go Phil. Note the Quaternary glaciation period proxy. Note the error bars. Note the lack of year to year precision (warning: extreme understatement) compared to the snippet of time that we have not only year to year but day to day.
http://droyer.web.wesleyan.edu/Franks_et_al_2014_GRL_new_stomatal-CO2_proxy.pdf
Marcus, I’m from Connecticut, USA then Arizona (1985) then Oregon (1995), Now, as of this year, back to Arizona.( I’m Retired.)
It’s nice outside, I’m wearing short sleeves and cut-offs, I’m southeast of Las Vegas.
There’s room for one more.
michael
Why the title? The abstract never demonstrates that the glacial period was the result from the decrease of CO2, more likely, based on all other glaciations, the reverse is true. If the researcher (student) has this interpretation, they’re completely incapable of making such a claim from one outcrop, particularly a colder climate period that stretched over multiple million of years. How do such incompetence and spunk come from a very basic study and then to make such grandiose claim? The idea that one can assume a particular global climate for a period that stretches 20-30 million years from a thin minor rock sample or paleosol layer is ridiculous. Her/his degree should be rejected…..
I sat down and did the Greenhouse math. Using the temperatures and Co2 levels from the EPICA Ice Dome core sample of 1950, here’s the results:
18376 years ago, at the last coldest point of the last glaciation, temperature was -10.35C below the 1950 baseline and Co2 was 187ppm. Temperature began to climb consistently following that low.
11825 years ago, at the first time that the temperature reached the 1950 baseline, it was +0.07C and Co2 was 251ppm.
So we have a change of 10.28C in 6,551 years, all when mankind was still in the late Stone Age level of technology, just begining the transition from the Mesolithic to the Neolithic Age, and there was no use of fossil feuls. So the greatest level of global warming occurred when mankind could have made NO impact on Co2 levels. The Co2 level changed by only 64 ppm, which equals a ratio of 6.2 ppm per 1 degree of change
The current Co2 level is 398 ppm. If the AGW/Greenhouse Effect theory is true and Co2 is the only true engine of global warming, then the formula of 6.2ppm per 1 degree of change would mean the current temperature should be +23.7C above the 1950 baseline, according to the following calculation:
If 251 ppm is required to meet the baseline and the current level is 398ppm, that’s a difference of 147ppm.
Given the historic ratio of 6.2ppm per 1C degree of change, divide 147 by 6.2 to get the number of degrees that it should theoretically be above the baseline.
398ppm – 251ppm = 147 ppm/6.2 ppm = +23.7 degrees
The current world temp is….drum roll please….+0.85C above the 1950 baseline. Not +23.7C. Not even +1C over baseline.
Conclusion: C02 levels show NO quantifiable effect on world temperatures. AGW/Greenhouse Effect has no basis in reality.
Data sources:
https://www.ncdc.noaa.gov/paleo/metadata/noaa-icecore-6080.html
http://co2now.org/
http://earthobservatory.nasa.gov/Features/WorldOfChange/decadaltemp.php
“Making predictions about climate variability often means looking to the past to find trends.”
Translation: “We are on a fishing trip, looking for “clues” for how increased CO2 “causes” warming and how a drop in CO2 “causes” cooling. We will studiously ignore inconvenient facts like the earth’s climate system 450 million years ago being nothing like the more recent system of the past 2 million years, with alternating ice ages and interglacials. Because that is how climate science is done.”
“These results will help climatologists better predict future environmental changes.”
Translation: “These results will hopefully keep us on the Big Climate gravy train, and keep the train itself chugging along for at least a little while longer”.
According to your logic, then I should abandon my proposition that an increase in anthropogenic CO2 will recreate conditions in which huge lumbering lizards will repopulate the surface of the planet.
D’oh!!
“Huge lumbering lizard meat”… The new “white Meat”. Tastes just like chicken and feeds on bugs and…Other things. Lizard milk is especially good in coffee and tea.
If it’s anything like alligator, no thanks. Tastes like swamp with a slight rubbery texture. Yuck. I much prefer the gamey taste of buck.
Bruce – “We will studiously ignore inconvenient facts like the earth’s climate system 450 million years ago being nothing like the more recent system of the past 2 million years,”
Or the current thinking [Institute for Geophysics] that their study area was at the time at the equator.
460 mya – http://www.ig.utexas.edu/research/projects/plates/460.htm
450 mya – http://www.ig.utexas.edu/research/projects/plates/450.htm
400 mya – http://www.ig.utexas.edu/research/projects/plates/400.htm
Wonder what the ocean currents were doing then?
As AndyJ points out, CO2 as a cause of ice ages is largely a non event.
Whats key to major cooling in the NH is changes to the climate in North America. Because what really stands out about the last ice age. ls just how much colder the climate in North America became, and l think that this is a key factor about understanding climate change in the NH. Because if the weather allows the Arctic to extend south over this large land mass. Not only does it affect North America but it also leads to having a major impact on the northern Atlantic and the jet stream. Which can end up dragging the whole of the Atlantic side of the NH into climate cooling.
If you look at the past, the Artic was ice free until only 3 million years ago. The only major event that occurred at that time elsewhere that correlates is the connection of the North and South American continents and the end of the Panama Current that had flowed between them. Only 400,000 years later, the Quaternary Ice Age began. Coincidence?
If we look at the Antartic, it too was ice free until 34 million years ago, when South America and Africa had moved north sufficiently to allow the Deep Ocean Conveyor to move cold water along the entire coast of the Antartic continent without a land mass to interrupt or restrict it.
North America has been moving ever farther from Europe, making the North Atlantic and the Greenland Sea, the only access for a major current into the Artic, wider.
It’s continental drift and the way it affects ocean currents and the redistribution of heat around the oceans, not the Co2.
Good series of maps showing continental changes and drift:
http://www.theatlantic.com/technology/archive/2013/09/what-did-the-continents-look-like-millions-of-years-ago/279892/
AndyJ
The issue l have with the claims that the recent ice ages are down to the changes in the ocean current. ls if that is the case then “why are we not still in the ice age” and “why has the climate flipped between warming and cooling while this current has still been in place?.
So if the current has not changed to cause these swings in climate change then what has?.
My answer it that its the weather that has changed.
Today’s study brought to you by: Captain Obvious
Alan if you are replying to my post, then the only thing that is obvious is that the last ice age was largely weather driven. Because it needs the weather allows the Arctic to extend over North America for such event to happen.
Sorry that should be “Because it needs the weather to allow the Arctic to extend over the North America”
The GICE is positive PDB in all examples shown. A positive excursion means the light Carbon (12C) is somewhere else besides where you are measuring. It says nothing about the total abundance of CO2. Even the supplementary materials are paywalled and little effort seems to be made to correlate the excursion with the glaciation except that it was “before”.
A positive excursion usually means that the 12C is locked up in the biosphere which prefers it and means good times for living things.
Using typical carbonated logic they are trying to interpret the prevalence of 13C in their samples as evidence of CO2 “burial” and reduction in the atmosphere leading to the glaciation. Wrong. The burial of organic Carbon would result in a negative excursion.
They also suggest the silicate “weathering” from the collisional orogeny. This would reduce atmospheric CO2 and might cause a positive excursion as relatively unfractionated DIC, but by the late Ordovician land plants were crawling up the waterways and beginning to slow erosion. Rugose and Tabulate corals and other calcifying critters dominated ocean sedimentation (the rocks they were measuring). Surely some carbonate weathering would be also be a part of this orogeny.
For perspective chemical weathering at our current level of vegetation coverage is .03% of the Carbon cycle.
After I read the whole article including the meaty phrase: “Understanding carbon cycles adds value to our knowledge base of climate change”, I came to the conclusion that they were just a group of paleogeologists in search of a large grant. The age of reduced grants is coming and they want to be positioned to pick up some of the last crumbs before the trough is exhausted.
Forget about CO2, when it comes to understanding climate change you need to understand weather.
Because the main event about the last ice age is the fact that the weather kept sending cold Polar air down across North America. So with this cold pool sitting next to the North Atlantic, it lead to a large increase in cold air flowing over the northern Atlantic and a large increase in the power of the jet stream over the northern Atlantic. And its this what lead to the cooling of the northern Atlantic.
everybody stop breathing.
l think its more of a case that climate science has stopped thinking,
So why was there there little in the way of ice sheets over the eastern side of Russia ?.
Was it because climate was to dry?
Maybe, but l think it was largely because the climate got too warm during the summer and again this was likely due to the weather patterns. Because if there were a increase in low pressure sitting over northern Russia and with high pressure sitting over northern europe. Then you would have cold air pushing down across NW Russia but warmer air moving up from the south across the NE side of Russia. This is the reason l believe is the reason why much of the ice sheets were over NW Russia.
Likely too dry across Eastern parts of Russia over Siberia because too far from any ocean. (remember the entire Arctic ocean would be frozen over during summer and autumn) The example below shows glaciers in the same region to the far east, that are there due to being closer to oceans.
Problem is to get North America much colder relies on the Arctic north of there getting much colder first and the main world energy distribution to cause the Arctic to get much colder is for the AMOC to collapse.
Thanks for the post Matt.
The real issue l have with the answer that the climate was just to dry over NE Russia for the ice sheets to form. ls the fact that there is much more high ground in NE Russia then there is in NW Russia. So even if there was a dryer climate you would have still expected there to have be more ice sheet cover over NE Russia compared to NW Russia. lts this that leads me to think it was more due to the lack of cold during the summer months rather then just due to the lack of snow.
About North America getting colder, it does not really need the Arctic to get colder. Just a case of a Arctic type like climate been pushed further down to the south across North America. Due to the increase in blasts of Polar air pushing down across N America. Because the increase in snow cover across N America would in its self lead to climate cooling.
True. There are many major and minor seas in the north of North America and Europe. Since glaciation is by snowfall not melting but continually accumulating, the drier areas have less chance of accumulation.
“The real issue l have with the answer that the climate was just to dry over NE Russia for the ice sheets to form. ls the fact that there is much more high ground in NE Russia then there is in NW Russia.”
If the land is dry over mountains it won’t form glaciers or be very limited locally.
“About North America getting colder, it does not really need the Arctic to get colder. Just a case of a Arctic type like climate been pushed further down to the south across North America. Due to the increase in blasts of Polar air pushing down across N America. Because the increase in snow cover across N America would in its self lead to climate cooling.”
Something for you do this winter is observe how very cold air over Canada has very little effect on cooling the North Atlantic Ocean more than about 100 hundred miles away. All the snow cover across Canada easily melts in summer currently and any amount of northerly winds currently prevents it. The energy moving north in the ocean current is far too great for extremely cold air over Canada having any influence away from the Labrador current. Summer temperatures in Canada are far too warm currently with northerly winds keeping glaciers at sea level. This all points down to the Arctic air needs to be much colder, especially the key part in keeping summer temperatures down. When the warm ocean current stops moving North, Canadian air moving across the North Atlantic ocean cools it significantly and has a big effect unlike now.
@taxed, re “weather patterns”:
Mild and moist spring and summer would be necessary for woolly mammoths and rhinos to have foraged in northern Siberia. A big haul of mammoth ivory is now coming from the New Siberian Islands at 75°N. These islands were connected to the mainland when sea level was at a minimum.
http://ngm.nationalgeographic.com/2013/04/125-mammoth-tusks/siberia-map
Before, during and after the Younger Dryas temperatures were swinging often very wildly, making areas like Siberia even relatively pleasant during the summer at times for mammoths away from melting glaciers. (only around 3/4 c cooler than today) With low sea levels and these changes it would be expected for mammoths to move North towards uncharted territory. When the climate suddenly become much colder again (around 10 c cooler) they would have moved further south and increased there chances of coming in contact with human hunters.
Very interesting but it does not agree with my geologic map. They have low CO2 arrive before the Ordovician ice age starts but mine shows it starting after the ice age and then take most of the Silurian that follows to complete. Who is right? The theory that Gondwana passed over the South Pole is far superior to the persistent idea that carbon dioxide has anything to do with ice ages. And what, if anything, is the connection between mass extinctions and CO2 they imply?
The little error that the Church of Co2 does not or refuses to acknowledge is that Co2 gets trapped in ice during glaciations. So when a large glaciation occurs, atmospheric Co2 will naturally go down because it’s now inside the ice. What’s ironic is that it’s this frozen Co2 that they use to make their claims with when they use data from ice cores. They have the cart before the horse.
The connection with mass extinctions is that large amounts of light Carbon (12C) which have been tied up in biomass because photosynthesis which is the bottom of the food chain fractionates more than 20 per mil (prefers) the lighter isotope, is released back into the earth system when everything dies. Furthermore, when large plant assemblages die they are not actively filtering out the 12C any more. This produces another shot of 12C to the system.
Each of the five glacial periods we know about has produced an extinction. It was the cold that caused the extinctions, not CO2. There was less atmospheric CO2 during these cold periods because the oceans sucked it up per Henry’s law.
Interestingly, as Leif has shown for solar and earth magnetic oscillations, Christopher Scotese’s work and others appears to show a hard rock bottom for planetary temperature with all the variation and trend on the upside.
Fun fact:
It appears Anthony ain’t got that much game.
Cus “Anthonysgotgame” only managed to come in second, about 5 minutes ago at Santa Anita.
Oh well, it still paid $ 6.00 to place.
Should have had the exacta box with “Temps-A-Risin”
Could “they” be Chasing Imaginary CO2 – with Numbers such as …1323444, 1324577 and 1324954 ?
I read WUWT with great interest. It gives me “hope” and we all must have hope or should surely be “all at sea”.
I’ve just read umpteen “replies” on this thread alone and what strikes me is that many of us really detest certain “expressions” which are used and abused by the CAGW alarmists.
I read the mountain of bunkum, false facts, twisted beliefs, and flagrant nonsense mainly coming from the so-called universities and it just gets my goat.
They misuse our language in so many perverse ways and it’s all done in order to feed the so-called main-stream-media with “headline nonsense” and to keep the big grant money coming to those “scholars” who have sold out to the EPA – bigtime.
So … here goes … and this is just a short list.
biodiversity – there is no such thing.
PS: LMofBr warned us all about this one some years ago: he saw it coming and was spot on, as usual.
carbon pollution
(when actually suggesting unproven carbon-dioxide pollution)
this is probably the most irritating violation of the lot !
Carbon-dioxide is not a pollutant: it never was.
We know all about it and Viv Forbes (Australia) can explain it in depth.
carbon footprint – there is no such thing .
climate change – there is no such thing.
One might aswell say “time change” !
Time, just like patterns of climate, cannot be altered by anyone.
A better expression to use would simply be … “climate”.
tipping point (used as a scare tactic with CO2) – there is no such thing.
world leaders – there is only one world and no-one is its’ leader. A better expression would be “heads of state”.
third-world country(s) – so, where exactly is the first world ? A better expression would be “poor country(s)”.
global temperature – there is no such thing: it is a meaningless statistic.
global warming – it simply isn’t warming at all.
greens – “green-pretenders” may be a better expression.
fossil fuels – Who uses fossils as fuel ?
If one really means … “coal” or … “oil” or … “wood” it would surely make sense to say; coal, oil, wood.
If we are indeed to break through to the general public we cannot do it by “science” alone.
We need the help of PLAIN LANGUAGE, language which is EASY to understand.
We need Josh and his cartoons – brilliant of course, and we need that hard hitting, myth-busting film (can’t wait for it) but here on this website blog and HOPEFULLY relayed eventually across to all the other sites, we could make a start right here and now to construct a list of “good to use” words.
Finally, I should be pleased if the words at the TOP of the website were as follows:-
“The world’s most viewed site on global warming and climate”.
Thank you to AW for another very revealing and interesting article.
I rather fancy that this “reply” will go via the moderation desk: I do hope so.
Regards,
WL
Warren L,
Good deconstruction of the Orwell-style language being used.
Couldn’t agree more! There can be no real debate when language is debased.
“In their study, the researchers verified evidence suggesting carbon dioxide decreased significantly at the end of the Ordovician Period, 450 million years ago, preceding an ice age and eventual mass extinction.”
Proxy data doesn’t suggest this at all and changing positioning of the continents brought cooling before CO2 levels dropped significantly.
From here over 2 years ago and shows the temperature falling before the CO2 levels do.
http://wattsupwiththat.files.wordpress.com/2013/06/co2_temperature_historical.png
A significant fall in CO2 never cause an ice age and especially when CO2 levels are still very high. Global temperatures fall and rise and CO2 responds to the changes in biodiversity it causes and solubility equilibrium between the oceans. These are greatly affected by continental land masses movement over the planets surface, when especially continents cover either or both poles leading to ice ages independent of the CO2 atmospheric content. These change the albedo of the planet significantly and energy distribution around the planet with changing ocean circulation configurations.
When I first started to read this post, and about the growth of plant life that eventually sequesters carbon by locking it up as what we now call fossil fuel reserves a silly thought came into my mind.
Is it possible , I wondered, that the world could run out of carbon dioxide , replenished only by occasional volcanic activity , and belatedly by relatively feeble human activities.
The end game , quite literally , would be a CO2 level to low to sustain plant life and as that withers so do we (“all flesh is grass ” and so on ) .
Your plot above shows a discontinuous but definite drop in CO2 from the halcyon days of the Cambrian era. Bit worrying that.
Hi Mike Waite.
Regarding your worrying – I’ve been pondering this point for a while.
Hope I’m wrong about this,
Best, Allan
http://wattsupwiththat.com/2015/03/14/matt-ridley-fossil-fuels-will-save-the-world-really/#comment-1883937
WHL
I have no time to run the numbers, but I do not think we have millions of years left for carbon-based life on Earth.
Over time, CO2 is ~permanently sequestered in carbonate rocks, so concentrations get lower and lower. During an Ice Age, atmospheric CO2 concentrations drop to very low levels due to solution in cold oceans, etc. Below a certain atmospheric CO2 concentration, terrestrial photosynthesis slows and shuts down. I suppose life in the oceans can carry on but terrestrial life is done.
So when will this happen – in the next Ice Age a few thousands years hence, or the one after that ~100,000 years later, or the one after that?
In geologic time, we are talking the blink of an eye before terrestrial life on Earth ceases due to CO2 starvation.
________________________
I wrote the following on this subject, posted on Icecap.us:
On Climate Science, Global Cooling, Ice Ages and Geo-Engineering:
[excerpt]
Furthermore, increased atmospheric CO2 from whatever cause is clearly beneficial to humanity and the environment. Earth’s atmosphere is clearly CO2 deficient and continues to decline over geological time. In fact, atmospheric CO2 at this time is too low, dangerously low for the longer term survival of carbon-based life on Earth.
More Ice Ages, which are inevitable unless geo-engineering can prevent them, will cause atmospheric CO2 concentrations on Earth to decline to the point where photosynthesis slows and ultimately ceases. This would devastate the descendants of most current [terrestrial] life on Earth, which is carbon-based and to which, I suggest, we have a significant moral obligation.
Atmospheric and dissolved oceanic CO2 is the feedstock for all carbon-based life on Earth. More CO2 is better. Within reasonable limits, a lot more CO2 is a lot better.
As a devoted fan of carbon-based life on Earth, I feel it is my duty to advocate on our behalf. To be clear, I am not prejudiced against non-carbon-based life forms, but I really do not know any of them well enough to form an opinion. They could be very nice. 🙂
Yes Mike I was writing that too in comment around 10 months ago. CO2 is sequestrated and is continually getting low. Biosphere is dependent on amount of CO2 produced by volcanism. But normally biosphere is pure consumer of CO2 until it starve itself to death.
I share you concern, the ocean easily takes carbon, but is reluctant to give it the atmosphere. We know about the huge relative carbon amounts in the atmosphere previously, but it seem from billions of years ago levels have always been in a decline. What could cause carbon amounts to be greatly restored from the oceans again naturally? The only thing I can think off are huge super volcanoes on a level never seen before, especially during humans presence on Earth. Almost tropical oceans like all over the planet would contribute a bit too.
Agree Matt G.
CO2 lags temperature at all measured time scales.
A few more thoughts below: Climate heresy now, but conventional wisdom in 10-20 years..
Regards, Allan 🙂
http://wattsupwiththat.com/2015/06/13/presentation-of-evidence-suggesting-temperature-drives-atmospheric-co2-more-than-co2-drives-temperature/
Observations and Conclusions:
1. Temperature, among other factors, drives atmospheric CO2 much more than CO2 drives temperature. The rate of change dCO2/dt is closely correlated with temperature and thus atmospheric CO2 LAGS temperature by ~9 months in the modern data record
2. CO2 also lags temperature by ~~800 years in the ice core record, on a longer time scale.
3. Atmospheric CO2 lags temperature at all measured time scales.
4. CO2 is the feedstock for carbon-based life on Earth, and Earth’s atmosphere and oceans are clearly CO2-deficient. CO2 abatement and sequestration schemes are nonsense.
5. Based on the evidence, Earth’s climate is insensitive to increased atmospheric CO2 – there is no global warming crisis.
6. Recent global warming was natural and irregularly cyclical – the next climate phase following the ~20 year pause will probably be global cooling, starting by ~2020 or sooner.
7. Adaptation is clearly the best approach to deal with the moderate global warming and cooling experienced in recent centuries.
8. Cool and cold weather kills many more people than warm or hot weather, even in warm climates. There are about 100,000 Excess Winter Deaths every year in the USA and about 10,000 in Canada.
9. Green energy schemes have needlessly driven up energy costs, reduced electrical grid reliability and contributed to increased winter mortality, which especially targets the elderly and the poor.
10. Cheap, abundant, reliable energy is the lifeblood of modern society. When politicians fool with energy systems, real people suffer and die. That is the tragic legacy of false global warming alarmism.
Allan MacRae, Calgary, June 12, 2015
Dear Allan,
Ten excellent points. With you all the way. Marvelous stuff !
Latest score …
Heretics United – ONE
Methane Dodgers – NIL
Regards and thanks,
WL
Thank you Warren for your kind comments.
Above are the Observations and Conclusions for my full paper, located at the above wattsup address. The readers’ comments are generally worthwhile.
I wrote the paper that proves point 1 above in 2008 and it is located at
http://icecap.us/images/uploads/CO2vsTMacRae.pdf
and the Excel spreadsheet at
http://icecap.us/images/uploads/CO2vsTMacRaeFig5b.xls
Later work by Salby and Humlum et al draws similar conclusions, although I allow that there are other possible drivers of atmospheric CO2 as well as temperature.
I said the new CO2 satellite data will help sort this question, and that is already becoming apparent.
Regards, Allan
Did it occur that we should forbid anybody from engaging in manipulation of the climate until there is an actual consensus of engineers that this will work and result in a predictable out come?
Ummm.. so that’s about half a billion years ago. Basic chemistry and physics probably remain the same, but carbon based life forms almost certainly do not. Nor does their effect on the environment.
ummmm…’Probably’?? Physics and chemistry have been the same since a few micro-seconds after the Big Bang.
Anyone seen this paper by Esper?
https://www.blogs.uni-mainz.de/fb09climatology/files/2012/03/Esper_2015_Geochron.pdf
from Conclusions:
“As a consequence, earlier warm periods during the late 14th and 15th centuries appear warmer, though not statistically significant, compared to the late 20th century.”
Well the Ordovician Earth was probably as different from Earth Today and Pluto is to Earth Today.
After all, there is no geologic evidence of plant-life on land. Evidence does not occur until the Silurian Period!
Did the “intrepid environmental researchers” fail to notice that the limestone sample they had taken from the road-cuts were Silurian and not Ordovician!
That is the problem with “Earth Science” majors from the 1970s and on respective to Geology Majors; Geology Majors know how to identify the rocks at road-cuts in their correct Geologic Period, whereas “Earth Science” Majors are all confused and befuddled even by the gasoline and oil stains on the road-cut outcrops!
Ha ha
No. Spores clearly on land middle Ordovician. By late Ordovician (what we are talking about) green stuff was crawling up the banks of the freshwater riparian corridors. Arthropods had crawled out to start chewing on the green stuff on land by the Silurian.
I seem to have lost a post.
“Post” HERE IT IS! 😉
They found the actual post but your comment made me laugh.
And now for the battle of the century – the underdog – Carbon Dioxide, will face off with the mighty tag team of Solar radiance, Cosmic Rays, Magnetic effects, Pacific and Atlantic oscillations and even (gasp) volcanoes to see who is the champion at changing the temperature of planet Earth. Round after round of head to head battle to see who will control the economy of the Earth in the near future. (Long term – mother nature will decide for political justifications, the judges will still be biased towards the contender) Imagine – after 4 billion years of being the supreme master of all life on Earth, the Sun is in danger of losing it’s title to the mighty little CO2 molecule. Look at the stats. CO2 molecules vs the Mighty Sun which outweighs the molecules by huge orders of magnitude. Stay Tuned – the decision will be made in December. Place your bets now. 😉
anyone else note this?
The work was supported in part by NSF grants (1323444, 1324577 and 1324954). The content is the solely the responsibility of the authors and does not necessarily represent the official views of the funding agencies.
hmm?
I dont remember seeing that before???
because its honest and doesnt reach the :correct: conclusions?
Plants die if co2 levels drop to aroun 175 ppmv, I’ve read. The IPCC would like to halve the present – 400 ppmv to 200 ppmv. How would you like it if they decided to cut the oxygen you breathe by 1/2? Oxygen is to man as CO2 is to plants. No plants (near extinction from lack of air to breathe) means – eventually – no humans or plants. Now we know that there are folks who would love to reduce the population of the planet – by any means necessary. What about this scenario? They cut plant life to near extinction, resulting in a global famine. Until the chaos is over, the very wealthy – and the government leaders will all survive in controlled atmospheres and they would emerge afterwards to fix things – presumably burning more fuel to increase CO2 and plant life. So, in order to cure mother “Gaia” of humans, they will use a form of “chemotherapy” to rid the Earth of it’s cancerous humans? Does anybody doubt that there are people in the background who are actively working on such a scenario? (Madness has many forms, I’ve been told)
Good guess Pat,
This post is from 2012 – I made similar earlier posts in 2009.
Regards, Allan
http://wattsupwiththat.com/2012/06/24/weekly-climate-and-energy-news-roundup-53/#comment-1017397
Instead of arguing about the science of global warming, we should just listen to what these enviro radicals are actually SAYING and DOING.
Maybe they know their global warming science is bogus, but it suits their purpose to use global warming hysteria as a smokescreen to mask their true intentions.
The radical warmists have done everything in their power to starve the world of fossil fuel energy that is required for continued global prosperity.
They have squandered a trillion dollars of scarce global resources on catastrophic humanmade global warming (CAGW) nonsense.
Investing these squandered resources in clean drinking water and sanitation alone would have saved the ~50 million kids who died from drinking contaminated water in the past 25+ years of CAGW hysteria.
Intelligent use of these scarce global resources could have easily saved as many people as were killed in the atrocities of Hitler, Stalin, or Mao.
50 million people died in Hitler’s WW2. Josef Stalin killed another 50 million of his own people in internal purges. Leftist hero Mao gets the prize, killing as many as 80 million Chinese during his Great Leap Backward.
The radical environmental movement has done equally well, rivaling Mao for fatalities caused by the banning of DDT and the misallocation of scarce global resources on the fraud of catastrophic humanmade global warming.
Since many of these enviro radicals are latter-day Malthusians, Club of Rome types, etc., it is reasonable to assume that THIS WAS THEIR INTENTION.
Is this too radical a proposal? Well, NO it is not: In addition to what the radical enviros DO, let’s EXAMINE what they SAY (h/t to Wayne):
”My three goals would be to reduce human population to about 100 million worldwide, destroy the industrial infrastructure and see wilderness, with its full complement of species, returning throughout the world.”
David Foreman,
co-founder of Earth First!
”A total population of 250-300 million people, a 95% decline from present levels, would be ideal.”
Ted Turner,
Founder of CNN and major UN donor
”The prospect of cheap fusion energy is the worst thing that could happen to the planet.”
Jeremy Rifkin,
Greenhouse Crisis Foundation
”Giving society cheap, abundant energy would be the equivalent of giving an idiot child a machine gun.”
Paul Ehrlich,
Professor of Population Studies,
Author: “Population Bomb”, “Ecoscience”
”The big threat to the planet is people: there are too many, doing too well economically and burning too much oil.”
Sir James Lovelock,
BBC Interview
”We need to get some broad based support, to capture the public’s imagination… So we have to offer up scary scenarios, make simplified, dramatic statements and make little mention of any doubts… Each of us has to decide what the right balance is between being effective and being honest.”
Stephen Schneider,
Stanford Professor of Climatology,
Lead author of many IPCC reports
”Unless we announce disasters no one will listen.”
Sir John Houghton,
First chairman of the IPCC
”It doesn’t matter what is true, it only matters what people believe is true.”
Paul Watson,
Co-founder of Greenpeace
”Childbearing should be a punishable crime against society, unless the parents hold a government license. All potential parents should be required to use contraceptive chemicals, the government issuing antidotes to citizens chosen for childbearing.”
David Brower,
First Executive Director of the Sierra Club
”We’ve got to ride this global warming issue. Even if the theory of global warming is wrong, we will be doing the right thing in terms of economic and environmental policy.”
Timothy Wirth,
President of the UN Foundation
”No matter if the science of global warming is all phony… climate change provides the greatest opportunity to bring about justice and equality in the world.”
Christine Stewart,
former Canadian Minister of the Environment
”The only way to get our society to truly change is to frighten people with the possibility of a catastrophe.”
Emeritus Professor Daniel Botkin
”Isn’t the only hope for the planet that the industrialized civilizations collapse? Isn’t it our responsibility to bring that about?”
Maurice Strong,
Founder of the UN Environmental Program
”A massive campaign must be launched to de-develop the United States. De-Development means bringing our economic system into line with the realities of ecology and the world resource situation.”
Paul Ehrlich,
Professor of Population Studies,
Author: “Population Bomb”, “Ecoscience”
”
If I were reincarnated I would wish to return to earth as a killer virus to lower human population levels.”
Prince Phillip, Duke of Edinburgh,
husband of Queen Elizabeth II,
Patron of the Patron of the World Wildlife Foundation
”The only hope for the world is to make sure there is not another United States. We can’t let other countries have the same number of cars, the amount of industrialization we have in the US. We have to stop these third World countries right where they are.”
Michael Oppenheimer
Environmental Defense Fund
”Global Sustainability requires the deliberate quest of poverty, reduced resource consumption and set levels of mortality control.”
Professor Maurice King
”Current lifestyles and consumption patterns of the affluent middle class – involving high meat intake, use of fossil fuels, appliances, air-conditioning, and suburban housing – are not sustainable.”
Maurice Strong,
Rio Earth Summit
”Complex technology of any sort is an assault on the human dignity. It would be little short of disastrous for us to discover a source of clean, cheap, abundant energy, because of what we might do with it.”
Amory Lovins,
Rocky Mountain Institute
”I suspect that eradicating small pox was wrong. it played an important part in balancing ecosystems.”
John Davis,
Editor of Earth First! Journal
**********************************
Excerpts above from
http://www.green-agenda.com/
My opinion: The mistake most scientists make regarding glacial and interglacial age drivers is not focusing on:
1. the winds driven by the Coriolis affect and changes to those winds due to atmospheric/oceanic teleconnections,
2. continental positioning and drift that allows or not the piling up of warm waters,
3. ENSO equatorial Solar recharge/discharge mechanisms and imbalances, and
4. Milankovitch cycles whereby Solar inclination changes from one hemisphere to the other in the equatorial band.
Drought versus moisture, CO2 ups and downs, and albedo changes due to dust, ice and snow coverage all follow and are symptoms, not causes.
If there is a mechanism we know that changes weather patterns (IE: ENSO), we should look to that same mechanism impinged upon by orbital changes to explain glacial and interglacial ages.
To boil it down and speak to engineers in the audience, I think all this boils down to changes in short term fluid/gas teleconnected mechanics, and long term changes in orbital mechanics impinging on the short term fluid/gas teleconnected mechanics, on a globe that changes its solid and liquid surface shape, under an ever warming star.
Correction: “…under a relatively steady star.”
One problem that every paleoclimatologist seems to forget, but which can be documented with reasonable clarity even from an extremely poor record is this: that high greenhouse gases and hot climates correlate with soils across the globe being universally too poor for an advanced civilisation. Today, such soils prevail only in Australia and a few parts of Africa, but before the Oligocene a very limited paleopedological record – which I must emphasise is limited precisely because exceedingly little soil formation was happening – suggests that these low-fertility soils prevailed over the globe.
As Gordon Orians and Antoni Milewski (whom I had to inform of the basic results of limited paleopedogical records in Eurasia and the Americas) demonstrate in their 2007 ‘Ecology of Australia: the Effects of Nutrient-Poor soils and Intense Fires’, the effect of having such soils is profound and would have been multiply so on a larger scale before the Oligocene. Most importantly, the heterotrophic biomass under such soils is much smaller in total size and much slower-metabolising and growing, so that protein is exceedingly limited. These limitations – though I have not read up on how strong the relationships between metabolism and encephalisation are – would not allow the development of animals nearly so large-brained as modern humans: there just did not exist the energy to run such brains as Richard Lynn shows to have evolved in Eurasia since humans moved from the poor (though less poor than Australia) soils of Africa to the exceedingly fertile (in geological terms) soils of Asia in and north of the Himalayas.
in fact, homiothermy evolved 200,000,000 years before the Oligocene under the influence of the previous ice age in the Carboniferous around 280,000,000 years ago. However, as the climate warmed and soils deteriorated (so much so that even the less fertile soil types of present-day Eurasia and the Americas are virtually unrepresented in the Mesozoic and early Tertiary paleopedological record) warm-blooded animals became at an intense disadvantage because of their high energy requirements versus very low nutrient availability. This effect was multiplied by exceedingly high wet-bulb temperatures (up to 40 degrees Celsius wet-bulb in the Mesozoic as against no more than 30 degrees in the Quaternary) which would have required even higher energy consumption to remain endothermic. Consequently, the Mesozoic was dominated by exceedingly low-energy reptiles, with mammals remaining entirely heterothermic and very small. Once the “Great Enrichment” began as the Alps, Andes and Himalayas formed and absorbed carbon dioxide to cool the climate, these limitations except in Australia were completely removed. Although extremes of eutrophy as seen in the Southern Cone can limit encephalisation by selecting severely against sociality, there result of these vastly improved soils has been increased brain sizes. This has been most concentrated in two lineages that have managed to avoid the “desocialisation” (change from cooperative to solitary societies) normally found when a taxon moves from poor to rich soils: humans and toothed whales.
Reblogged this on gottadobetterthanthis and commented:
–
I’m not convinced from what is presented here, but note that it is saying a drop in CO2 precedes mass extinction. By implication, CO2 is good. Well, of course CO2 is good. It is one of the absolutely essential ingredients of life!