Guest essay by David Archibald
Introduction
While Solar Cycle 24 is well into its decline in terms of F10.7 flux and sunspot number, several types of solar activity have risen dramatically over 2015. The solar wind flow pressure, for example, is now at a two decade high. That in turn means that the low in neutron count for this cycle may be more than a year out. This also means that the expected, much-awaited solar-driven cooling could be put off for at least year, with the consequence that the earthly temperature plateau will also continue for another year.
It is also possible that Solar Cycle 24 may end up having the odd combination of being both short and weak. The best analogue for Solar Cycle 24 could be the nine-year long Solar Cycle 2. Lastly, the Sun’s magnetic field strength suggests that Solar Cycle 25 will be as weak as expected.

Figure 1: Ap Index 1932 – 2015
The Ap Index is a measure of geomagnetic activity from eight stations around the planet and reflects disturbances in the horizontal component of the Earth’s magnetic field. Activity has taken off from early 2015.

Figure 2: Solar Wind Flow Pressure 1971 – 2015
Similarly, the solar wind flow pressure has also increased dramatically.

Figure 3: Interplanetary Magnetic Field 1966 – 2015
Again, the interplanetary magnetic field has now increased to levels above that of the 1970s cooling period.

Figure 4: Oulu Neutron Count 1964 – 2015
The flux of galactic cosmic rays outside the heliosphere is constant. Inside the heliosphere it is modulated by the magnetic field carried by the solar wind, which varies with the solar cycle. There is a one year delay between the strength of the interplanetary magnetic field and the galactic cosmic ray flux at the Earth’s orbit. Given the strength of the magnetic field in 2015, the low for the Oulu neutron count may not be seen until late 2016. As the neutron shower at low altitudes caused by the galactic cosmic ray flux influences cloud droplet formation, then cooling caused by increased flux as the solar cycle declines may be put off for another year or so.

Figure 4: Heliospheric Current Sheet Tilt Angle
As measured by the heliospheric tilt angle, we are now well past the Solar Cycle 24 maximum.

Figure 5: F10.7 Flux 2014 – 2015
The F10.7 flux is a measure of the Sun’s emissions at 2800 MHz (10.7 cm) and correlates with sunspot number. It is a cleaner measure than sunspot number in that it is not subject to observer bias and the record can’t be adjusted on a whim. It has a floor at 64. Based on the correlation with sea level, a F10.7 flux above 100 is warming and below that is cooling. The F10.7 flux has been in a narrow, declining band of activity over 2015, suggesting that there is some disciplined process operating at some level in the Sun. At its current rate of decline, the lower bound of activity will reach the floor at 64 in January 2016.

Figure 7: Interplanetary Magnetic Field 4000 BC – 2015 AD
This figure shows the data from Figure 3 combined with the reconstruction of the interplanetary magnetic field (IMF) for the last 6000 years by Steinhilber et al (data courtesy of Dr Gargett). This reconstruction indicates that the cause of the current, pleasant Modern Warm Period is most likely the high level of solar activity over the second half of the 20th century.

Figure 8: Solar Cycle 24 superimposed on Solar Cycle2
There are some indications that Solar Cycle 24 may be a short, relatively weak cycle of perhaps eight or nine years long. In that case, the closest analogue from the record is Solar Cycle 2. Figure 8 shows Solar Cycle 24 (in red) to date superimposed on Solar Cycle 2 (in blue).

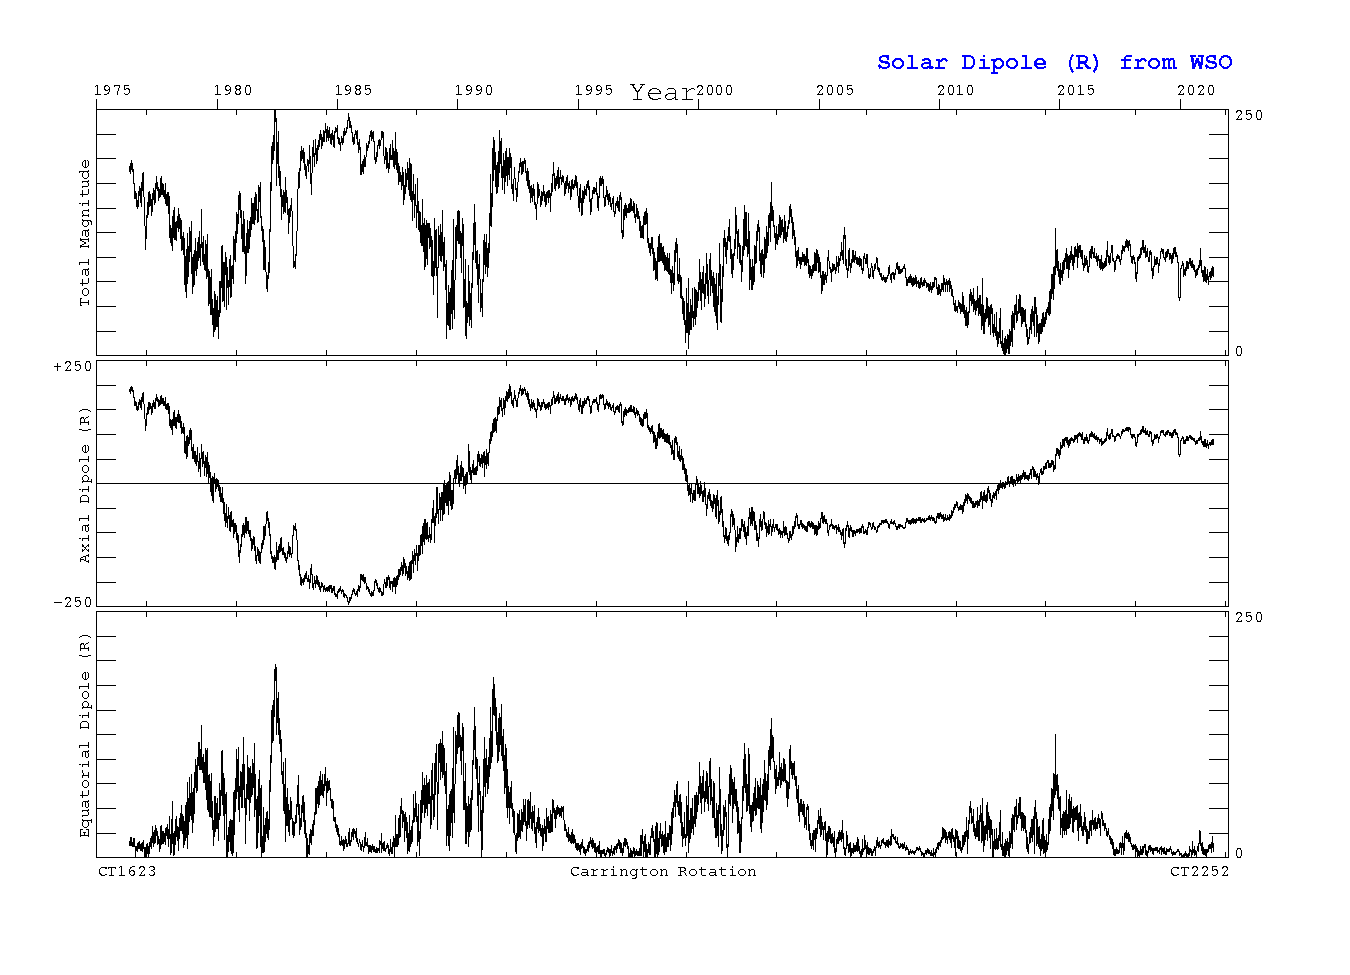
Figure 9: Solar Dipole 1976 – 2015
This figure from the Wilcox Solar Observatory shows that the polar component of the magnetic flux of the Sun has been decling for 30 years. There has been little recovery since Solar Cycle 24 maximum, suggesting that Solar Cycle 25 will be very weak.
David Archibald’s most recent book is Australia’s Defence (Connor Court 2015).
My takeaway is that we are nearing the edge of the plateau? Cliff?
We’ve been waiting for this predicted drop in global temperature for some time now. And while we sure don’t seem to be warming much at all right now, we sure don’t seem to be cooling either….
I propose that it’s difficult to predict the future of global temperatures. Just a thought.
MattN, that depends upon where you look.
If you look at Raw temperature data there have been far more Cold Temperature Records set over the last 3 years than Hot ones. Record breaking Snowfalls both in amounts and in time, ie later in spring and earlier in Autumn than normal. Record breaking Antarctic Sea Ice.
Growth in Glaciers and Snow Persisting right through the summer in Scotland and other European countries.
A cold area in the North Atlantic.
All these things “could” be construed as signs of “cooling”.
AC Osborn,
I think you are right. The hemispheric difference has also been abnormally high through most of ‘the pause’. Typically it was about 0.1˚C a(lthough varying between 0.2 and 0.0˚C) with the SH being cooler than the NH. It has been around 0.3˚C for many years now which to me suggests that the SH will become the planets cooling driver. or maybe it is just the canary in the cage.
What will people be saying if global temperature holds fairly steady for the next 15-20 years?
Well, some will be saying ” Pause? What pause?”
Others will be pulling their hair out at this, and the rest will have stopped caring.
And some will be saying “It’s worse than we thought. Unprecedentedly stable.”
Then some of us would have to say that we were wrong in our outlook, end of story.
If the plateau continues for another decade then the lukewarmers win the debate, which may have serious philosophical implications.
Donald– If global temps stay fairly steady for the next 15-20, scientists will have to say, “the CAGW hypothesis is dead.”
Under the rules of the Scietific Method, if hypothetical projections exceed reality by a statistically significant margin (2+ standard deviations) for a statistically significant duration (15+ years), the hypothesis is effectively disconfirmed.
Since CAGW has, for all intents and purposes, already met the criteria for disconfirmation, it should no longer be taken seriously.
In about 5~7 years, it’s highly likely the disparity between hypothetical projections vs. reality will exceed 3+ standard deviations for almost a quarter century, which is when the CAGW is laughed into oblivion.
The demise of the CAGW hypothesis is getting tantalizing close, which is why CAGW alarmists
are so frantically adding “adjustments” to HADCRUT4 and GISS raw temperature data to keep the disparity within 2 standard deviations of CAGW projections…
The Karl(2015) adjustment was the last straw. CAGW is dead.
Donald,
“What will people be saying if global temperature holds fairly steady for the next 15-20 years?”
I assume you are referring to climate siantists, and they might stick with the wiggle room meaning of ‘warming’ I’ve already seen used several times by the x-perts on high; Global warming continues as long as temps are above what they would otherwise be without human greenhouse gas emissions.
Ice sheets could once again cover half of North America, and there would still be “warming” occurring, you denialist Luddites ; )
Declining F10.7 to hit the floor next year and a La Nina to follow….. nice.
Don’t forget a concurrent negative AMO…
Public policy will be caught blindsided.
Perhaps it will shock the leaders into thinking adaptation, instead of prevention, is the proper proactive measure.
“Lastly, the Sun’s magnetic field strength suggests that Solar Cycle 25 will be as weak as expected.”
The sun seems to fail to meet expectations on a regular basis.
It takes a long time geomagnetic storm.
http://oi59.tinypic.com/33jipmq.jpg
Solar polar fields.
http://www.solen.info/solar/polarfields/polarfields.jpg
Sunspots.
http://www.spaceweatherlive.com/images/SDO/SDO_HMIIF_512.jpg
http://www.spaceweatherlive.com/pl
Colour me Sceptical.
We just don’t know.
Kudos for making testable predictions
Soduk for moving the date of your prediction by a year…
It doesn’t inspire confidence in this solar cooling idea.
“The waiting is the hardest part” (- Tom Petty)
“Mama always told me not to look into the sights of the sun
Whoa, but mama that’s where the fun is” (- Bruce Svalgaard)
Of course even if we freeze over the next 30 years, global warming will eventually return and destroy the planet, though how many people will survive the 30 year freeze and be around to get warmed up? UK death rates in cold winters are around 30k per year.
Suggest we pass a law that all the Warmistas have to put their money where their mouth is by turning off the heat–they can all cluster around their solar panel and their wind mill. Darwin oughta take ’em out quite nicely . . . 😉
David Archibald, while I applaud your continued solar activity reporting, I disagree with your value of the F10.7cm @ 100 sfu as the threshold number for warming and cooling, and of your use of sea level as a proxy for sea surface temperature.
Why didn’t you just use sea surface temperatures and leave out the middleman (sea level)? You didn’t specify either whether the threshold’s effect is based on a daily, a weekly, a monthly, an annual, or a running average, so we have no idea at what point to apply your stated figure even if it was right.
Instead of using sea level, I used SSTs, inspired originally by this diagram from Climate4you below, last summer (2014), to determine the threshold for warming and cooling to be ~120 sfu, not 100.
http://climate4you.com/images/SunspotsMonthlySIDC%20and%20HadSST3%20GlobalMonthlyTempSince1960%20WithSunspotPeriodNumber.gif
The 2015 solar F10.7cm radio flux running average went below 120 sfu yesterday, and I don’t expect it will return to a higher than 120 value for many many years, depending on the rise and strength of SC25. The F10.7 solar cycle 24 running average is only 109.5 sfu/day, and is the cause of the “pause”.
The F10.7cm monthly averages this year:
142.0
129.1
126.4
129.1
120.1
123.1
107.0
106.3
102.1
93.8 – October
Yesterday, the evening F10.7cm value was 80.0, the lowest in over 4.5 years, since early 2011.
Only the El Nino with it’s warm water volume is propping tropical SSTs up now, and that’s about to change.
The accumulated solar energy in the ocean from solar activity having been above 120 sfu runs out in 12-15 months, depending on how fast this solar cycle decline occurs, according to my calculations.
So I can agree with you David that there’s a year or so left of accumulated solar heat in the ocean, and with currently insufficient solar activity to warm the ocean more, it’s all downhill from here after the El Nino peaks.
Solar cooling is here now, as evidenced by recent polar ice increases and recent lower UAH NH & SH temps.
Who can forget that chart of sea level rate of change overlain by the solar cycles? With the negative sea level rise coinciding with the solar minima? So I got that graph, turned it into a scatter plot and lo and behold, there is a line of best fit that crosses the x axis at a sunspot number of 40, which in turn equates to a F10.7 flux of 100. No need to ponder much beyond that.
Furthermore, ENSO itself correlates very highly with GMSL. ENSO spreads warm water across the surface such that it increases SST’s and warms the atmosphere more efficiently, but it does not create warm water. Thus we are looking for a force that drives both sea level and ENSO independently of SST.
DA. Link please. After a long day and my evening glass(es) of wine I’d rather look at pictures than try to work out words.
Perhaps I’ve now had too much wine but DAs invite to ponder beyond made me wonder about the known problems with Milankovich theory / hypothesis. How about sustained 100,000 year or so sustained low flux levels ? Leif will now promptly dismiss that idea.
David Archibald October 8, 2015 at 11:00 pm
That would be me, unless you are talking about the chart I discussed here …
… and if that’s the chart, you should definitely read my post.
On the other hand, if that’s not the chart you’re referring to … how about a link?
w.
Being not too ‘bwryt’ in technical matters, the article is fascinating in it’s deep exposure of ‘uncertainties’ that modelers must simply ignore because what may be known of the consequence of these influences is not known. Hence, the models that claim to know everything, must be certain about nearly nothing. And policy built upon such a foundation is a train wreck waiting to give evidence that it happened.
Another interesting point about uncertainty is made by oceanographer Alan Longhurst [http://judithcurry.com/2015/09/20/new-book-doubt-and-certainty-in-climate-science/] in a book which is freely downloadable. I didn’t download it because the author summarizes in bullet points thus: Air temps unreliable and users of unreliable air temps are incompetent. CO2 effects wrongfully extrapolated from poor understanding of ocean and the sun is the cause. Models are misleading and science doesn’t have a clue because even clouds are not understood. Natural oscillations account for climate variations; melting ice not unique; rising sea levels not understood and ocean ‘acidification’ not a problem. He claims the ‘consensus’ premature and decries the lack of unbiased studies!
I think this solar cycle is going to be 12+ years in length.
Yes. And whatever happened to Archibald’s previous expectations of a long Cycle 24? Those were based on extrapolation of the envelope of the butterfly diagram, and I think 2021 still looks good for that.
Rich.
Butterfly diagram at http://solarscience.msfc.nasa.gov/images/bfly.gif .
What happens is that we do new work. I have a joint paper coming out on the force that dare not speak its name. The model for that says that Solar Cycle 24 will be 8 years long. That closest to that is Solar Cycle 2. The shapes are similar, if that means anything. The alternative is that the model breaks down and the Sun does a reset before starting a new model run period. But, like Luke turning off his targetting computer when attacking the Death Star, sometimes you have to have faith in your model. If borne out, we will know soon enough. The Sun at the moment reminds me of a line from Henry V – how constant and unspotted didth thou seem. The spotlessness may mean that the minimum is not too far off.
See – owe to Rich October 8, 2015 at 11:01 am
David Archibald October 8, 2015 at 11:10 pm
Gosh … call me crazy, but that sounds a lot like the excuses the alarmists give when one of their predictions falls on its face.
Mmmm … and sometimes, you have to discuss why your previous model failed.
w.
Only if you view it while squinting and looking in a mirror over your left shoulder. Using words like “most likely” in a scientific appraisal is usually a bad idea unless backed up in some very specific way by a statistical analysis. Attributing causality to a high statistical correlation, once one has been demonstrated, is also a bad idea unless accompanied by the explicit physical science support for the assertion, as causality is the domain of physical science, not statistical correlation.
Just glancing at the magnetic field index you present, one can see that it is entirely backwards to your hypothesis over Holocene temperature reconstructions:
The general linear trend of the magnetic field is low initially and ascending through at least 0 BCE where the general trend of Holocene temps is initially high and descending across the same time period, from similar proxy reconstructions that (I’m sure) similarly have substantially (likely century scale) coarse graining and averaging of the results. I’d be a lot more justified (which is still pretty much “unjustified”, but there you go) in asserting that the data imply that the “cause” of the general cooling trend of the Holocene has been the increase in the interplanetary magnetic field.
Now, I’m sure that you would like to attribute the general cooling to Milankovitch or other (ignored) causes in a complex multivariate problem, which is fine as far as it goes but then for me to take your assertion even a bit seriously you have to not point at a few anecdotal blips in the record and claim success when the general trend confounds our assertion outright, you have to build at least a two component model for Holocene temperatures — one that includes a physically founded dependence of global average temperature on e.g. orbital/precession/NH insolation state PLUS a modulation of some sort that involves interplanetary field as presumably represented by this proxy reconstruction (which, sigh, is presented without any discussion of error or error bars so the viewer has no idea whether or not to take the graph itself seriously or whether it is as likely to be pure noise and utterly meaningless — the one thing we can be pretty sure of is that the error estimate is not the thickness of the line).
Then you’d have to let us see the result of the best fit. OK, so there are some blips that might line up. Are there equally strong blips that fail to line up? Are there temperature events uncorrelated with magnetic field? Oops, evidence of more complex causality that confounds your assertion.
Look, I’m all in favor of solar state affecting global temperatures in some nonlinear, non-obvious way, through one of the proposed mechanisms (that have yet to be validated in situ, although perhaps we will manage it if the sun’s evolution proceeds along its predicted lines for the next couple of cycles — or not, we might refute it just as easily as such is the nature of science). At least we’ll have superior instrumentation looking while everything happens, and maybe we can build a working model that is well-supported by detailed observational data. But what I “favor” is not relevant to claims of fact. I love the idea of magnetic monopoles and a Lord of the Rings parallel Universe, too, but I don’t assert them as fact or amplify my wife’s inability to find her glasses into evidence that they’ve tunneled into a parallel Universe, proving the existence of the latter. Correlation is not causality, and you have yet to even demonstrate correlation, when the bulk of the data is clearly correlated the opposite way to your assertion.
Otherwise, I find your presentation of the data interesting, although it would be better if you omitted the “we might have to wait until 2016 for cooling to start” stuff. Or at least, preface it with a BIT of scientific humility — “the cooling predicted by the GCR cloud nucleation hypothesis is not likely to manifest itself yet, but by (fill in the date, just make sure it is far enough in the future that you have a chance to resolve signal from things like ENSO and other chaotic sources of noise unless you seek transient embarrassment even if the hypothesis is correct).
It’s just amazing. Reading the pages of WUWT, I can find so very many causal explanations for the evolution of the climate. It’s all due to CO2. Oh, wait, CO2 is just a “trace gas”, warming is due to reduction in volcanic aerosols. Oops, no, that’s not right, warming was due to solar state and GCRs. No, that isn’t quite true because of the variable efficiency of the major oscillations — warming has been due to a surplus of ENSOs that have nothing to do with any of the above, it’s an accident of chaotic dynamics, plus the phases of the PDO/NAO etc. Whoops, let’s not forget variations in albedo. And then there is indeed Milankovitch, which marches inexorably on, switch behavior in thermohaline circulation, and my favorite, dark matter clouds that the Sun invisibly passes through that modulate the gravitational compression of its core so that its behavior (which affects temperatures) are really determined by galactic state of a kind of matter we cannot even see 100,000 years ago. Or your favorite invisible fairy — there are more, I’m sure, even before we are stumped by the simple reality that the climate system is multivariate, highly nonlinear, chaotic, and unpredictable by any computational means with a lot better resources than the linearizing human brain.
So if you want me to take the assertion seriously — which I would be perfectly happy to do, except that the Holocene temperature reconstructions themselves above come with moderately hefty error bars as proxy data from different sources and parts of the world are hardly coherent to start with, perhaps you could do some of the analysis above — at the very least remove the Milankovitch trend and fit the remainder to IMF — and then maybe you’ll have some basis for baldly stating a post hoc ergo propter hoc fallacy that doesn’t even work with the actual data you present against the data you wish to explain.
Sigh.
rgb
the simple reality that the climate system is multivariate, highly nonlinear, chaotic, and unpredictable by any computational means with a lot better resources than the linearizing human brain.
Bravo. This is why I scan every WUWT comment thread for Dr. Brown’s terrific mini-essays.
ROFL. My wife asked me from across the house what was so funny.
Peter
Except we have these periodic things called ‘Ice Ages’ that are pretty much like clockwork and we are at the tail end of the present Interglacial based on past records.
Like clockwork? Let’s take a look at this clock:
Hmm, sort of like an insane clock with a highly variable period, maybe a pendulum clock that is running down while sitting on the floor of a moonshiner truck that is being chased down a country lane at high speed, killing random possums.
Also, to be picky, we are in an interglacial (the Holocene) of an ice age (the Pleistocene) that might or might not have ended. If you talk to your average warmist, many would assert that the CO2 already added will prevent a return to glaciation indefinitely, independent of what our orbit does (and a few, like Hansen, would froth on a bit about 5 meter SLR by 2100 and boiling seas soon after). Most of the participants in this list are less optimistic about this, but are perhaps hopeful that we have blocked a return to glaciation, since even a comparatively short glacial episode like the LIA that doesn’t cross the “turning point” to full glacial albedo feedback cooling could kill a billion people in five or ten years from successive crop failures in the NH breadbasket (much of which was literally under ice in the Wisconsin). A degree C of warming (since 1850) is almost invisible, but a 2 C cooling back to 1650 temperatures would be catastrophic indeed.
rgb
David says
rgb says
Only if you view it while squinting and looking in a mirror over your left shoulder. Using words like “most likely” in a scientific appraisal is usually a bad idea unless backed up in some very specific way by a statistical analysis.
Bob says:
The modern maximum in solar activity DID CAUSE global warming, because there is no evidence for any other increase from other energy sources during the same time, for the same duration, that could possibly have any sustained warming influence, and no one has proven that there is another such source for the additional energy necessary to drive temps higher.
The sun provided all of that energy, and nothing else did or could’ve provided that energy.
The modern maximum in solar activity occurred from 1935.5 to 2004.5, a 70 year period when v2 SSNs averaged 108.5 annually, versus the previous 70 year period annual average of 65.8 from 1865.5 to 1934.5, a 65% increase in sunspot activity. http://www.sidc.be/silso/DATA/SN_y_tot_V2.0.txt
Dr. Brown, you need to come with an energy source other than the sun’s variation in order to even do a comparative statistical analysis, and if you’re going to come back with the supposed retained heat of the magical molecule CO2 from anthropogenic sources as your alternative, I’m going to LMAO at you, again.
I’d advise you to not waste your time trying, as the IPCC has proven it’s a waste of time.
The photons that circulate through atmospheric molecules such as CO2 come only from the sun originally. If you really think CO2 is ‘the’ driver, then you are welcome to write up a long missive about how SSTs and land surface temps declined until 1976 all the while CO2 atmospheric concentrations were going up.
So I would clarify what David Archibald said this way: “….pleasant Modern Warm Period was caused by the high level of solar activity over the second half of the 20th century.”
The modern maximum in solar activity occurred from 1935.5 to 2004.5, a 70 year period when v2 SSNs averaged 108.5 annually, versus the previous 70 year period annual average of 65.8 from 1865.5 to 1934.5, a 65% increase in sunspot activity.
As usual, careful cherry-picking [e.g. by omitting the three high cycles before 1865] can support otherwise unsupportable claims. Realizing there is a ~100 year cycle one should average with that in mind, e.g. as here:
http://www.leif.org/research/Sunspot-Activity-New-Series.png
Where the colored horizontal lines mark 100-year averages. Within the error bars there is no difference between the centuries.
Hi bob, rgb doesn’t need source of extra energy, he has to move a bit more heat from the equatorial to the polar regions, instead radiating it into space. Job for him is done by faster ocean currents and distributed around the globe by the jet stream.
See: http://wattsupwiththat.com/2015/10/08/a-short-summary-of-soon-connolly-and-connolly-2015-re-evaluating-the-role-of-solar-variability-on-northern-hemisphere-temperature-trends-since-the-19th-century/#comment-2044925
Absence of evidence does not imply your favorite cause is correct. You forget that “we don’t know” is an entirely valid scientific outcome. (Albeit unsatisfying).
You have to prove YOUR cause is distinguishable from noise. From my analysis, there is no cause I’ve seen that’s indistinguishable from noise.
Peter
My claims are completely supported. Your comment really doesn’t matter. Why? Because my research going back further than 1865 takes the prior activity levels into account in my solar accumulation model.
We are in discussions today regarding the MODERN period. That is the period that I focus on here today, although my research does go back to the Maunder minimum.
Using the 70 year period of high activity versus the preceding 70 years of low activity is done that way to show the difference between those two same length periods – it’s not cherry-picking. It-s to show how over the two 70 year time periods the average magnitude of the solar activity was significantly different between those two adjacent and equal periods of time of low activity followed by high activity.
If, for instance, I included the higher cycles prior to 1865 as you would like, there would no longer be two equal time periods to discuss and compare, and so, how would know how to compare them?
What you have to answer to is why you think the vast difference in sunspot output between the two 70 year periods is not an issue. Tell us why a 65% increase for 70 years doesn’t matter.
Your comment does not address that, and the comment appears to have been made to smother out the truth, the truth that higher solar activity for 70 years really happened and that that extra energy from the sun caused global warming.
I have a complete case in preparation for posting, with graphics, to describe everything I am talking about.
The Svalgaard Maximum in solar activity caused global warming.
If you don’t like that Leif, then withdraw your new sunspot numbers, and I’ll go back to using the Waldmeier Maximum, where the discrepancy between the same length periods was 89% Your choice.
If you go back in time from 1880-1925 to 1835-1879 solar activity increased from 63 to 96, or 52%. How much did global temperatures increase?
Hunting for periods to support pet views is a popular pass time but does not make much sense. The fact is that solar activity the past three centuries has varied the same [up and down] in each century with no long term trend. Are you claiming the same for global temperatures?
Peter Sable – there is no absence of evidence. What is absent is understanding what the evidence means. “Noise” is not evidence.
Leif, I’ll take your tack to illustrate. Suppose we break the solar record into three sections, 9 whole cycles each:
1712.5-1809.5, 98 years, ave 78.7
1810.5-1913.5, 104 years, ave 71.7
1914.5-2009.5, 96 years, ave 95.1
Which is a greater average? The last section, the MODERN period. The first section was 18.4% less than the last section, and the second section was 22.4% less than the last one.
But is it a completely fair comparison, considering the time periods vary. THAT’s why I use equal time periods.
The modern period had higher solar activity no matter how you slice it. You lost the argument Leif.
You lost the argument Leif.
I don’t consider this to be an argument, but rather a part of continuing education of you. Compare the solar record with the temperature record as far back as you can and learn.
The years 1835-1879 occurred at the end of the Little Ice Age (1300-1850) … which means that there was one hell of a lot of snow and ice to melt …. and cold land and water temperatures to be “warmed up” before the average yearly near surface air temperature began to increase very much.
Just like when a really cold winter is followed by a warm winter, the latter will automatically cause an increase in the average yearly temperature calculation for those two years inclusively.
Bob you are 100% correct the data is the data.
Leif and company can not produce data which shows an overall global temperature rise during a period of prolonged minimum solar conditions and vice versa.
Is there a lack of things to do at Duke? Try battling the Forces of Darkness.
Dear heavens, David. You were doing so well, but now, faced with some opposition from rgbatduke, complete with a graph that clearly shows you to be wrong, you immediately grab for the nearest ad hominem … not impressed.
Gotta say, whenever someone starts throwing mud, it’s a sure sign to me that they are out of scientific ammunition.
w.
Oh Dear, and here I thought I was doing just that.
Darkness consists of making a statement of your opinion as if it is a fact. Silly darkness consists of making a statement of your opinion as if it is a fact that is directly contradicted by the data you are trying to explain over more than 2/3 of the interval you present in the figure above.
The problem is that both sides in this debate are prone to hyperbole, unsupported assertions, presentations of data that “proves” their point without any discussion of error, confounding effects, places where the hypothesis they favor fails to work, and often with a startling naivety regarding statistics and standards of proof. The entire debate is not well served by this, or by a complete unwillingness (on either side) to either take the other fellow’s point of view seriously or consider the vague possibility that your own point of view could be wrong. This leads so quickly to defensive comments when somebody with the best of intentions points out a pretty serious inconsistency in your argument. Would you rather have it pointed out later, perhaps when you are presenting it in a public venue rather than in the warm and friendly WUWT pages?
Do I need to superimpose the two pictures for you to get the picture? Your figure that shows interplanetary magnetic field rising from 4000 BCE right up to the clearly marked “dark ages” plunge; imagine it on top of the figure I posted that shows proxy-derived Holocene temperatures systematically decreasing across that exact interval. Also, if one uses your verbal hypothesis to hindcast the temperature data, one might well expect there to have been a horrific plunge in global temperatures around 3500-3700 BCE completely absent from the proxy reconstruction. The there is also no resolvable difference between the Sporer and Maunder minimum. The general trend and timing doesn’t look quite right. The best you’ve got, maybe, is a coincidence between the Sporer minimum and the LIA that ran from close to the end of the Sporer through the Maunder minimum, but even that would really need to be done quantitatively with a model to be at all convincing.
I repeat, I’d love to be convinced. Convince me. Build an actual model instead of looking at a couple of bumps that look “about right” and asserting that this is proof of your hypothesis. You can start by explaining, quantitatively, why there was no MIA (medium ice age) in mid-Holocene that corresponded with dips in IMF even deeper than the Sporer minimum, why most of the Holocene confounds your assertion, and so on. Gimme an R^2 to be proud of, ideally without using so many parameters that you can make the elephant wiggle his trunk.
Right now conservatively, I’d say R^2 for any direct/linear model on top of smoothed data is what, 0.18? What does 2/3 of the graph moving the wrong way with the opposite of the proposed slope cost you in R^2, anyway?
Look, if you are right, there is nothing to worry about, because even Lief agrees that the next solar cycle or two are likely to be very quiet, possibly even Maunder/Sporer minimal for an extended period of time (whatever/however minimal that might have been). But this time there will be no ambiguity, as we have powerful instrumentation paying close attention. If solar activity drops and global temperatures drop, well, then I guess you — or possibly rather the people who have done the actual work promoting and doing experiments on the GCR hypothesis — will get a lot more attention as most reasonable people would then consider this to be evidence in favor of their hypothesis. If they don’t drop, is that going to be sufficient (as Lief often asks) to convince you that you are wrong, they are wrong, and the comparatively tiny variations in solar activity are NOT enough to have much of an effect on the climate, via GCRs or alterations in polar circulation or what have you?
Or are you so certain you are right that even if it warms all the way through, you’ll cling to the belief? This is almost the precise definition of religious belief, instead of scientific skeptical provisional belief (with evidence against mattering to your degree of belief).
Personally I have no idea. I haven’t found any of the arguments, graphs, fits in favor of solar activity as a primary driver convincing, simply because there just isn’t that good a correlation. Also, I (at least) actually read through Lief’s work on reconstructing solar state in some detail, and I think it is damn fine work. IIRC he has three different measures of solar activity, all fairly accurately recorded all the way back to somewhere in the 19th century, that agree with modern measurements now and that can be used as a reliable yardstick for probable errors in counting sunspots then, and those measures clearly show particular differences associated with particular human counters and instrumentation. So using an uncorrected sunspot record while ignoring the other proxies for solar state just because it appears to agree better with your hypothesis doesn’t seem quite fair.
FWIW, I have absolutely no evidence that Lief is completely convinced by either side of the Great Warming Debate (at least not that I’ve read in these pages). He will hammer — errr — try to “educate” anyone who starts spouting nonsense in any field he has expertise in, but then, so will I and many others. That too is a part of science. Correct known science isn’t a matter of debate, not without powerful and unlikely arguments that will probably have little to do with the subtle matters at hand in climate science. He just reposted the punch line from an astounding poster that made a quantitative claim supported by actual data and statistical fits with pretty good R^2 that CO2 climate sensitivity is around 0.5 C per doubling, one of the lowest values I’ve ever seen. If he were a closet “warmist” or “coolist” I doubt that he would behave like he does. I just think he is interested in figuring out the truth (and maybe he gets a kick out of refereeing an otherwise ill-founded running commentary that badly needs it).
Now, the problem is highly multivariate, so it could be that Mr. Sun’s small fluctuations do have a “strong” effect on the climate but ones that can still be confounded by other strong effects. That would certainly “explain” a lack of perfect correlation between solar activity and climate. I don’t even think that is all that implausible (this is a nonlinear chaotic turbulent non-Markovian etc dynamical system we’re talking about), I just don’t have any good reason yet to think that it is true. Maybe two or three stars have to line up just right and THEN it cools strongly or warms strongly. Not impossible or crazy. However, one of those “other strong effects” could easily be CO2 concentration. Sorry, but that is just a fact. How strong, we just don’t know yet. Lindzen and Choi argue for the “not very” side of things. Hansen argues for “scorchingly strong”. Keen’s fit presented over the last couple of days is downright chilly, making CO2 worth less than 0.3 C of the 0.9 C warming from 1850, if one believes HadCRUT4 and 0.9 C in the first place. The data so far, taken at face value and fit “just” to CO2, favor something in between, but we have such a very short range of halfway reliable data so there is plenty of room for disagreement. Eventually we’ll have enough data to start to settle these and other arguments.
I just wish people would stop asserting opinion as fact, and correlation as causality, in the meantime, especially in the absence of even a pure guess at a quantitative model and with no discussion of error. Feynman would be very sad. How can one assess any assertion when it is made without numbers to back it and obviously contradicts itself within the data?
Sorry my comment annoyed you, time to go back to fighting the forces of ignorance and darkness on a more mundane scale. Solutions to the Laplace equation on a cylinder, the electric field of a dipole next to a large conducting plane, the mysteries of dielectric polarization and the displacement. Damn, I hate grading papers…
rgb
Roll the rock, keep elevating it.
==========
Fixed. You had included a link to the page and not to the image itself.
And thanks for injecting sanity into the discussion.
w.
(grrr … meant for rgbatduke)
Sorry. There is a difference in a click to get to the URL and I probably didn’t make the last one.
As for sanity — I’m trying to teach my undergrads to work in teams on their physics problems in part to audit each other’s beliefs for just that. I find it very interesting to watch my own rate of production of minor errors while lecturing at the board or doing algebra. I will literally say x squared and write x cubed — the part of my brain that is talking and the part that is writing are different, and the part that audits the two to keep them in phase is busy thinking up the next thing to say/do. Teaching my students to audit me and stop me to fix this before it is chiselled into the stone tablets of their notes for eternity, to be puzzled over as inexplicable forever after, is all by itself a challenge.
We have, I have concluded, terribly flawed brains. Different parts of our brains can want to do, and do, different things at the same time. Our interior monologue is just one, and perhaps not the most important, of the many things going on. Some of the things it does are brilliant, some are so wrong that later we cannot understand how we might have done them. If I let my mind wander while driving, I’m likely to find myself driving the road I always drive instead of driving to the store, or the airport, or to pick somebody up. The part of my brain that drives the car isn’t the same part that regulates an intentional destination.
Humans have a strong need to believe in their beliefs, to have the things that they think are right be borne out. Extremes of this tendency lead to religion and gambling and politics. It is the great source of cognitive dissonance and reactions to contrary information. It is all insane from a rational point of view, and yet I can only conclude that it has had some sort of evolutionary value because it goes beyond simple, correctable error to a kind of stubbornness, to keep betting on a horse because sooner or later it HAS to win, to believe in Santa because a world without him wouldn’t be worth living in, to truly think that to be black/gay/female/jewish/muslim/different is to be inferior.
We all need to be audited. Science is the great collective auditing process for the dynamics set of things that it is best to believe about the real, physical Universe. Propositions that cannot be audited may or may not be true, but if we can’t tell in some objective way who cares? Plenty of time to care when the belief can be checked, as long as somebody doesn’t make it a matter of unquestionable dogma and threaten violence if you openly challenge it or even if you just refuse to agree.
It’s a miracle we are as successful (as a species) as we are. There is a little bit of lemming in all of us, just waiting for the day we collectively decide to grab the yoke from the pilot and plunge the whole mess into the sea…
rgb
One of my best lines ever over at ClimateAudit was when someone suggested that I’d wandered into the wrong classroom, and I replied that I was just auditing the class.
=================
It’s not my place to tell you this, but tone it down, write a few posts and have a discussion, you’re just flooding in my opinion, no matter how intelligent you appear to be… I’d hate to read your quip about a quip! 🙂 and that goes for others who have discovered “Copy ‘n Paste”
Sparks October 10, 2015 at 4:28 pm
You are absolutely right. It is not your place to lecture anyone. Your own contribution to the discussions here have been pretty uniformly useless.
For example, you say:
Sparks October 10, 2015 at 9:47 am
That’s not a prediction, that is just egotistical handwaving. A prediction contains NUMBERS. Without them, as I’m sure you’ve counted on, if the global temperature chances to drop by a tenth of a degree for one month, four years after the polar field stops reversing, you’ll be free to count your “prediction” as a success. Ta-da!
If you wish your bogus “prediction” to be taken seriously, let us know HOW MUCH you claim the global temperature will fall, HOW LONG the fall must last in order to be counted, WHICH dataset you will use to measure the fall, and WHEN you say the fall will occur.
Finally, since you haven’t quoted who you are responding to, it’s totally unclear whether you are talking to—kim, rgbatduke, myself, or someone else entirely.
So you are totally correct in your self-evaluation, Sparks. It’s not your place to tell anyone anything.
w.
Willis you’re one of the worst offenders, and you haven’t disappointed without fail as usual. When you, rgbatduke and others give you’re long off topic “I know all about the climate” on a “solar-update post” without anything productive to say, yes I’m going to call you on it. You’re insults, out of order! it’s my “opinion” Wow do you think anything I read from you was anything other than that? don’t flatter yourself!
Get back to the interesting discussion at hand and back off almighty Willis…
Sparks October 10, 2015 at 6:02 pm Edit
So. No numbers to turn your bogus “prediction” into a real prediction.
And no clarification of who you were originally talking to. Just more handwaving. As YOU said, it’s not your place to tell us anything. I agree wholeheartedly.
As to rgbatduke (Dr. Robert Brown at Duke University), I (and many folks here) are overjoyed when he chimes in, because a) he has a PhD in Physics, and b) he teaches physics, and c) he writes very lucidly and clearly, and d) his ideas and insights are almost always very interesting. I disagree with him occasionally … but at my own risk, and it’s bit me a couple times.
You, on the other hand, are a pompous random anonymous internet popup who seems to think that there is no reason for a “prediction” to contain a single number, and who rarely contributes anything even slightly scientific to the discussion.
I know which person I pay attention to, and which one I just laugh at … and so do you.
w.
So basically all the credentials necessary to make a mess, thanks for pointing that out Willis, you know very well I wasn’t getting at rgb, and I was just remarking at his style, his thoughts are worth a post or two, didn’t I say as much?
“Pompous” who me? Anonymous? Well yes to people who don’t know me, I’m very friendly and outgoing to be honest, Oh Noes… I’m a monster!
I do contribute to the discussion here, and enjoy these rare “Solar” posts, you on the other hand like to disrupt the course of debate with your own fantasy opinions…
I find RGB@duke’s contributions to be uniformly useful insightful and on topic, in contrast to yours.
You could learn a bunch by taking your time and reading what he contributes here.
Agree
I do read what he contributes on this site, and how is it in contrast to my opinion? have you ever read a comment of mine?
David, I have a question about this claim:
What is the physical explanation for this? And do you have a link to the data upon which this claim is based?
w.
Although I am not David, I think such a delay would be caused by the propagation of some effects from the sun, such as coronal mass ejections, being slow. CMEs typically take about 3 days to get from the sun to Earth’s orbit, and would take much longer to travel to the edge of the heliosphere.
It tales a year for solar wind to reach the heliopause
Leif once told me that it takes about 9 months for changes in the sun’s magnetic field to reach the heliopause.
Still waiting for David’s answer and link to the data … however, I have gotten three different and unique speculations on the question.
w.
David may not know why, but the explanation is quite simple: Most of the modulation of the cosmic ray flux takes place in the outer regions of the Heliosphere where the magnetic field gets tangled up by collision with the interstellar medium and with itself as solar wind regions with different speed collide. With the speed of the solar wind (400 km/sec or 1 AU in 4 days) is takes about a year for the wind to reach the outer regions of the Heliosphere (100 AU * 4 days).
Thanks, Leif. Why does the tangled magnetic flux affect the cosmic rays but not the regular magnetic nearer to the sun?
All the best,
w.
Not sure what you mean, but the ‘tangledness’ increases with distance from the Sun.
The more true answer is too complicated to explain, but the reason is that the Sun is rotating so that solar wind with different speeds are emitted in the same direction and run into each other and produces shocks that steepen with distance, and such….
Solar wind is ‘organised’ in magnetic flux tubes.
Two or three years ago I saved a paper on the subject; it took me a bit of time to find it. Link to online .pdf
http://onlinelibrary.wiley.com/doi/10.1029/2007JA012684/pdf
from its Abstract:
“It is argued here that the inner heliosphere is filled with a network of entangled
magnetic flux tubes and that the flux tubes are fossil structures that originate at the solar
surface. 65,860 flux tubes are collected from seven years of measurements with the
ACE spacecraft at 1 AU by spotting the flux tube walls with large changes in the magnetic
field direction and the vector flow velocity.”
The article’s text is well above ‘my paygrade’, but good luck if you do have a go.
Leif, you’ve prompted me to look at the data. Here’s what I find:
Interesting. It does point out to me the effect of the slow nature of the changes in both cosmic rays and sunspots. The result is that although the peaks are offset, the no-lag correlation is still quite large at -0.81.
This compares very favorably with the peak correlation of -0.84.
This peak, however, occurs with only four months lag, and visually the lag looks like 4-6 months. By the time you get out to a one-year lag, the correlation is back down again to -0.81.
This would suggest that significant tangling of the magnetic fields (enough to affect cosmic rays) does not just occur out at 100 AU. You say below:
So if my analysis is correct, important amounts of entanglement occurs at distances smaller than 100 AU.
And this shorter lag in part explains the high no-lag correlation. With an ~ 11-year cycle length, a four-month lag is only about a 3% lag.
In any case, I’ve used your new monthly sunspot data from here, and the Oulu cosmic ray data from here.
Your comments always welcome.
w.
Wanting better resolution to see what’s happening, I shifted to daily data for both the Oulu neutron data and the sunspot data. As you might expect, the correlation is lower, but it shows the same shape as the previous graph.
This agrees with the monthly data that the greatest (negative) correlation occurs at around four months.
One thing of interest to me is the spike in correlation at around zero lag in the graph above. It actually occurs at five days after the sunspots, with a value of -0.563. Again, this compares favorably with the peak, which is at 122 days (~ 4 months) with a value of -0.573.
This peak also agrees with the time you give above for the average travel time of the solar wind from the sun to the earth of four days. So it appears that the cosmic rays are affected starting when the change in solar wind sweeps past the earth.
Again, all comments welcome.
w.
Spike at 0 (zero) or 4-5 days is the the hit at the Earth’s magnetosphere. The earth’s magnetic field is by far strongest modulator of the GCR, thus if the GCR’s have an effect on the climate it would be due to changes in the Earth’s magnetic field. However the precipitation’s modulation of the 10Be depositions is just as strong.
One more note:
GCR’s are strongly modulated by Coronal Mass Ejections too, however the CME cycles are not ‘well’ synchronised with the sunspot numbers, their velocity is well above that of the ordinary sunspot’s solar wind. This graph (from appinsys.com) shows only very small proportions of the total, i.e. only those directed towards the earth, those causing disturbances in the earth’s magnetic field.
http://appinsys.com/GlobalWarming/2010080301_kp7.jpg
Most of the CMEs miss the Earth completely, but they still do modulate GCRs from all helio-longitudes.
Further more what we measure here on the Earth, depends on the solar magnetic polarity and the tilt of heliospheric current sheet, hence difference between even and odd numbered cycles.
These are only few problems, but I am sure there are more, why the correlation of the neutron count and SSN is not clear cut as could be expected.
122 days
CMEs typically reach Earth one to five days after leaving the Sun.
Those that reach Earth in one day would reach heliopause in about 100 or perhaps up to120 days, taking into account some deceleration.
if so, the graph would suggest the faster CMEs are more frequent than expected.
I have published plenty of graphs over the years of the Oulu neutron count with the month of solar minimum of each cycle on the chart. It is generally about a year prior to the neutron count peak. Explanations follow in the comments below.
Thanks for the reply, David. Always more for me to learn.
w.
Cycle 24 does seem to be rapidly waning. After watching all of the spotless days between 23 and 24 one has to wonder is this solar minimum will be an extended one…
Cycle 25 only begins after the minimum with reversed polarity (maybe not reverse polarity, but with their positive and negative poles flipped.) spots. Are you expecting Cycle 25 to kick off early, or only after an extended minimum?
Oh, and I’m not convinced that TSI is a primary driver of climate. It is an interesting argument, but… More evidence please.
Nobody claimed that TSI was the primary driver of the climate.
Please try again.
I am skeptical about everything these days. And I’ll be honest, I’m quite skeptical of Dr. Archibald’s claims. To me he seems a bit of an outlier on the other end of the Spectrum. That`s not to say that I ignore him (or even the people claiming the world ‘has a fever’…but I just don’t put a lot of credit in it.
That said, the ongoing solar minimum does give me reason to be concerned. If you only use the minuscule solar forcing numbers used by alarmists, the fact that we’re heading into a deep solar minimum about the time the AMO will be going negative means there will likely be a fall in temperature. And even the IPCC’s (carefully ignored) studies show that every last bit of warming we’ve had so far has been beneficial (and would continue to be until about 2C).
Of course, I’m pretty sure the solar forcing is good for at least .2C of cooling, the full brunt of the cold period of the ocean cycles should be good for another .4C. And that brings us right the heck back to the cold period of the 70s…which is pretty much accepted by everyone as ‘too damn cold’.
NOAA’s spaceweather prediction center (SWPC) updates their solar cycle sunspot number and F10.7 prediction in the first week of every month, here ftp://ftp.swpc.noaa.gov/pub/weekly/Predict.txt, where they give three ranges of forecasts, “LOW”, “Predicted”, and “HIGH” out to 2020.
According to them, we won’t reach an F10.7cm value of under 64 on a monthly basis until April 2018 (using their “LOW” range), August 2019 for the “Predicted” range, and their “HIGH” prediction range doesn’t go below 71.5 at all.
How did you determine a January 2016 date for F10.7 under 64???
Sorry, I glossed over your Fig. 5 extrapolation. If you’re right, it’s one helluva prediction!
Yes, but it’s just as silly to do that extrapolation as to do one of the floor of the values from 2014.1 to 2014.5 when the values were rapidly declining linearly. But then they turned around.
Rich.
Bob, the really interesting thing about that graph is the very disciplined range it has been in all year. Now what is causing that?
More vertical lines in graphs 1 and 5 would be interesting, does the slide down in graph 5 correspond with the move upwards in graph 1?
Any previous examples of this years slide in graph 5 in the prior record of 10.7 flux ? Or is this apparently unique behaviour ?
rgb talks of the Earth perhaps being bistable, a warm interglacial mode and a cold glatial mode. I wonder if the sun may also exhibit similar bistable behaviour with glaciations being a result of or and harmonic between long term solar patterns and Milankovich obliquity in particular.
But with the switch from the 41k world there must be other factors involved, reduced atmospheric density perhaps.
We are observing a once in 6000 to 8000 year solar event. An interruption to the solar cycle as opposed to a slowdown in the solar cycle. The cause of the Heinrich events.
The solar northern large scale magnetic field strength is now oscillating around zero. The solar southern hemisphere is roughly a year behind the solar northern hemisphere.
The solar large scale magnetic field is caused by the residue magnetic flux that is left from the sunspots. As noted below due the continual weakening of the newly formed sunspots and the large number of coronal holes, the coronal holes have stripped of the surface magnetic flux from the sun.
http://wso.stanford.edu/gifs/Polar.gif
http://www.solen.info/solar/
The high solar wind bursts are caused by coronal holes. The solar cycle 24 coronal holes have been anomalous in both number and size. The solar wind bursts create a space charge differential in the ionosphere which in turn causes there to be current flow from high latitude regions of the earth to the equatorial region. This solar wind burst phenomena electroscavenging explains why the planet has not cooled even though GCR is very high for this period in a solar cycle. This is also the explanation for the current El Niño (there is correlation in time with the start of the disturbances of the Ap (changes in the geomagnetic field which are caused by solar wind bursts, and the current and past El Niño events.)
The magnetic field strength of the magnetic flux tubes that rise up to the surface of the sun to form sunspots on the have based on observation continued to decay. The magnetic flux tubes require a magnetic field strength of 20,000 to 30,000 gauss to avoid being torn apart from by turbulence in the solar convection zone. As the magnetic field strength of the magnetic flux tubes has declined the magnetic flux tubes are shredded by turbulence so that what forms on the surface of the sun is group of short lived tiny pores rather than large long lasting sunspots.
The next step in the process as the magnetic field strength of the flux tubes declines further is there is no pore or sunspot only a region on the surface of the sun that has higher magnetic field strength.
It is interesting that the coronal hole rotational speed matches the rotational speed of the solar core rather than the rotational speed of the ‘surface’ of the sun. The solar surface rotational speed slows down by 40% from the equator to the solar polar region. The sun spots float on the surface of the sun and hence have the same rotational speed as the surface of the sun.
The fact the coronal hole rotational speed matches the core of the sun rather than the surface of the sun and does not change with latitude supports the assertion that the cause of the coronal hole (fast moving protons ejected from a region of the sun) is due to something deep within the sun.
http://iopscience.iop.org/article/10.1088/0004-637X/763/2/137/pdf
We are observing a once in 6000 to 8000 year solar event. An interruption to the solar cycle as opposed to a slowdown in the solar cycle. The cause of the Heinrich events.
The solar northern large scale magnetic field strength is now oscillating around zero. The solar southern hemisphere is roughly a year behind the solar northern hemisphere.
As usual, you are off the rail. There is no such thing as ‘interruption’ of the solar cycle. There are large cycles and there are small cycles. What we see now is nothing special: solar activity is low every 100 years or so. The northern polar fields have reversed and are now building as expected. The south is already strong. Cycle 25 looks to be like cycle 24 [if one must extrapolate] based on the rate of increase of the dipole moment:
http://www.leif.org/research/WSO-Polar-Fields-since-2003.png
The fact the coronal hole rotational speed… does not change with latitude supports the assertion that the cause of the coronal hole (fast moving protons ejected from a region of the sun) is due to something deep within the sun.
And the same number of fast moving electrons too [as the solar wind is electrically neutral]. That the coronal holes [and long-lived structures of the corona in general] rotates at a rate independent of latitude [as was discovered by Ester Antonucci and myself way back in 1973 [ http://www.leif.org/research/Rigid-Rotation-Corona.pdf ]] does indeed point to an origin in the interior, but has no baring on your ‘interruption’ notion.
Thanks very much. So the coronal holes are related to something going on in the radiative zone.
“The solar northern large scale magnetic field strength is now oscillating around zero.”
You think? Let’s see what it looks like around the 10th of December when WSO again has a square on view of both poles. North at 15-30 will no longer be oscillating around zero. Gotta watch that tilt when inflections are occurring, note max-tilt readings currently proceeding against the effect …
http://s2.postimg.org/5z2z3gxc7/PFS_2021.png
Or you could wait a couple of years for the filter to catch up.
“This also means that the expected, much-awaited solar-driven cooling could be put off for at least year, with the consequence that the earthly temperature plateau will also continue for another year.”
Reality does not appear to be cooperating with the solar activity slow down. 2015 is likely to be another record warm year. It might be time to consider another hypothesis.
Fascinating how trolls stick to their cooked data when much better data is available.
What I think MarkW is saying is the definition of “cooked data” is the data that he does not like.
Some people can’t live without ” unadjusted ” data !! LOL
Yeah, that’s what religious types do, MarkW! Can’t change them.
The record warm year was built on warmth already deposited in the ocean by the sun during the previous solar cycle, and was added to when solar activity was higher in this cycle. It takes time for that warmed-up water to circulate to the surface at the tropics and beyond. SSTs and OHC are going to drop after this El Nino peaks – which is right around the corner.
Looking at Dr. Spencer’s post chart http://www.drroyspencer.com/2015/10/uah-v6-0-global-temperature-update-for-sept-2015-0-25-deg-c/ we see a 0.03C drop in global temps (UAH), generally in line with my expectations given that we’re just now under my 120 cooling threshold annually.
I think the temperature plateau is heading for a long curve sloping downward.
Bob Weber.
“during the previous solar cycle”
Which solar cycle are you referring to, cycle 23? That was some time ago.
Monthly variations in the TLT synthesized temperature will not tell you much, they are too noisy.
The global stats show the globe to be warming on average. I do not see that process stopping.
For fans of logical fallacies, the non sequitur is always a favorite. An example:
…The global stats show the globe to be warming on average. I do not see that process stopping.
Harry, I was talking about SC23. Even though it was many years ago, the heat the sun deposited in the ocean at depth during those long ago years is still working its way to the surface.
The ocean receives solar energy at depths of hundreds of feet, and that energy warms the water. The amount of time it takes for that solar deposited energy to reach the surface is longer than a single solar cycle. The sea surface temperatures are a combination of the current real-time solar input as modulated by clouds and heat rising up or circulating to the surface that was deposited at earlier times.
The SST varies as OHC rises or falls, and as solar energy rises or falls, and as cloud cover changes.
If you look at HadSST3 http://www.metoffice.gov.uk/hadobs/hadsst3/data/download.html for the last three months (excl Sept – no data yet),
Global, NH, Tropics, SH; OHC
0.58, 0.733, 0.646, 0.407; 0.87
0.636, 0.785, 0.754, 0.463; 0.92
0.664, 0.729, 0.945, 0.374; 0.99
The NH and SH both dropped in August while the tropics and global went up with OHC. Why isn’t the NH and SH warming too if the whole world is supposed to be warming? OHC was 1.05 in April,
Looking at Dr. Spencer’s UAH data http://www.drroyspencer.com/2015/10/uah-v6-0-global-temperature-update-for-sept-2015-0-25-deg-c/
YR MO GLOBE NH SH TROPICS
2015 1 +0.28 +0.40 +0.16 +0.13
2015 2 +0.18 +0.30 +0.05 -0.06
2015 3 +0.17 +0.26 +0.07 +0.05
2015 4 +0.09 +0.18 -0.01 +0.10
2015 5 +0.29 +0.36 +0.21 +0.28
2015 6 +0.33 +0.41 +0.25 +0.46
2015 7 +0.18 +0.33 +0.03 +0.48
2015 8 +0.28 +0.25 +0.30 +0.52
2015 9 +0.25 +0.14 +0.17 +0.55
See that the NH and SH are colder now than earlier, and the globe is 0.03C cooler this year? Arctic sea ice has rebounded tremendously in September too.
The data says the process of warming is coming to an end.
If you look at HadSST3 http://www.metoffice.gov.uk/hadobs/hadsst3/data/download.html for the last three months
Weather is not climate. How about looking at yesterday if you believe it is…
Bob Weber.
“Harry, I was talking about SC23…”
Interesting hypothesis, but you may have difficulty finding evidence that supports it.
You have OHC and the UAH temperature muddled up.
2015 WILL NOT be the hottest ever in any real temperature data set.
Currently the average anomaly for year to data is in 4th place on +0.208ºC.. (September data added)
this is well below the 1998 year to Sept of +0.539ºC
So there’s Mr Twinperson making silly claims yet again.
What is the history of the interplanetary magnetic field based on? I see that the record goes back 6,000 years and I take it we didn’t have sensors then so I expect there is some kind of proxy which always leaves me a little concerned.
All those pretty pics and not a SINGLE ref to any data.
Lots of typically climatological “probably” “likely” stuff. Science content very low.
Disapponting.
Part one is not necessary for this discussion. What I am most concerned with as I read the article by David Archibald as far as my thoughts go is will this prolonged solar minimum meet or at least approach the criteria I feel is necessary in order to see a clear solar/climate connection? My confidence is least high in this area in contrast to the fact my confidence is quite high that if the solar criteria /solar duration of time conditions are meant then the climate should show a response to the change in solar conditions I have outlined.
PART TWO
HOW THE CLIMATE MAY CHANGE
Below I list my low average solar parameters criteria which I think will result in secondary effects being exerted upon the climatic system.
My biggest hurdle I think is not if these low average solar parameters would exert an influence upon the climate but rather will they be reached and if reached for how long a period of time?
I think each of the items I list , both primary and secondary effects due to solar variability if reached are more then enough to bring the global temperatures down by at least .5c in the coming years.
Even a .15 % decrease from just solar irradiance alone is going to bring the average global temperature down by .2c or so all other things being equal. That is 40% of the .5c drop I think can be attained. Never mind the contribution from everything else that is mentioned.
What I am going to do is look into research on sun like stars to try to get some sort of a gage as to how much possible variation might be inherent with the total solar irradiance of the sun. That said we know EUV light varies by much greater amounts, and within the spectrum of total solar irradiance some of it is in anti phase which mask total variability within the spectrum. It makes the total irradiance variation seem less then it is.
I also think the .1% variation that is so acceptable for TSI is on flimsy ground in that measurements for this item are not consistent and the history of measuring this item with instrumentation is just to short to draw these conclusions not to mention I know some sun like stars (which I am going to look into more) have much greater variability of .1%.
I think Milankovich Cycles, the Initial State of the Climate or Mean State of the Climate , State of Earth’s Magnetic Field set the background for long run climate change and how effective given solar variability will be when it changes when combined with those items. Nevertheless I think solar variability within itself will always be able to exert some kind of an influence on the climate regardless if , and that is my hurdle IF the solar variability is great enough in magnitude and duration of time. Sometimes solar variability acting in concert with factors setting the long term climatic trend while at other times acting in opposition.
THE CRITERIA
Solar Flux avg. sub 90
Solar Wind avg. sub 350 km/sec
AP index avg. sub 5.0
Cosmic ray counts north of 6500 counts per minute
Total Solar Irradiance off .15% or more
EUV light average 0-105 nm sub 100 units (or off 100% or more) and longer UV light emissions around 300 nm off by several percent.
IMF around 4.0 nt or lower.
The above solar parameter averages following several years of sub solar activity in general which commenced in year 2005. The key is duration of time because although sunspot activity can diminish it takes a much longer time for coronal holes to dissipate which can keep the solar wind elevated which was the case during the recent solar lull of 2008-2010 ,which in turn keep solar climatic effects more at bay. Duration of time therefore being key.
If , these average solar parameters are the rule going forward for the remainder of this decade expect global average temperatures to fall by -.5C, with the largest global temperature declines occurring over the high latitudes of N.H. land areas.
The decline in temperatures should begin to start to take place within six months after the ending of the maximum of solar cycle 24,if sub- solar conditions have been in place for 10 years + which we have now had. Again the solar wind will be needed to get to an average of below 350km/sec. which takes time because not only do the sunspots have to dissipate but also the coronal holes. In other words a long period of very low sunspots will be need to accomplish this. It will be a gradual wind down..
Secondary Effects With Prolonged Minimum Solar Activity. A Brief Overview. Even if one or two should turn out to be true it would be enough to accomplish the solar /climatic connection.
A Greater Meridional Atmospheric Circulation- due to less UV Light Lower Ozone in Lower Stratosphere.
Increase In Low Clouds- due to an increase in Galactic Cosmic Rays.
Greater Snow-Ice Cover- associated with a Meridional Atmospheric Circulation/an Increase In Clouds.
Greater Snow-Ice Cover probably resulting over time to a more Zonal Atmospheric Circulation. This Circulation increasing the Aridity over the Ice Sheets eventually. Dust probably increasing into the atmosphere over time.
Increase in Volcanic Activity – Since 1600 AD, data shows 85 % approximately of all major Volcanic eruptions have been associated with Prolonged Solar Minimum Conditions. Data from the Space and Science Center headed by Dr. Casey.
Volcanic Activity -acting as a cooling agent for the climate,(SO2) and enhancing Aerosols possibly aiding in greater Cloud formation.
Decrease In Ocean Heat Content/Sea Surface Temperature -due to a decline in Visible Light and Near UV light.
This in turn should diminish the Greenhouse Gas Effect over time, while promoting a slow drying out of the atmosphere over time. This may be part of the reason why Aridity is very common with glacial periods.
In addition sea surface temperature distribution changes should come about ,which probably results in different oceanic current patterns.
http://wattsupwiththat.com/2015/09/01/the-arctic-iris-effect-dansgaard-oeschger-events-and-climate-model-shortcomings-lesson-from-climate-past-part-1/
The above accounts for abrupt climatic changes within a glacial or inter- glacial period. Dr. Curry this is similar to your stadium theory.
[Long, interesting summary. Thank you. .mod]
Even a .15 % decrease from just solar irradiance alone is going to bring the average global temperature down by .2c or so all other things being equal.
No, a 0.15% decrease will bring down temperatures by 0.1 C, and 0.15% is a LARGE change, larger than the solar cycle variation of TSI, so take away all the sunspots [as during the Maunder Minimum] and temps will decrease less than 0.1 C.
But the temperatures during the Maunder Minimum decreased by more then .1c.
But the temperatures during the Maunder Minimum decreased by more then .1c.
So you just acknowledged that the Sun is not the cause of the low temperatures during the Maunder Minimum….
Wrong. I have just acknowledged that the TSI part of solar activity was not the only solar related causes for the low Maunder Minimum temperatures.
TSI part of solar activity was not the only solar related causes
Since all the other ones vary in step with TSI, what are the other [mysterious] causes you have in mind, now that you have eliminated TSI.
Do we have other historical quantitative indicators of a TSI than a sunspot count? For me, a sunspot count is a proxy – probably a good one. Are any exact measurements available before 1920 (Harquahala Observatory)? If I understand Dr. Svalgaard correctly, colder temperatures during Maunder minimum are only an interesting coincidence, waiting for another explanation.
There are no direct measurements of TSI before 1978.
“..Since all the other ones vary in step with TSI..”
No, as you know there can be a minimum in the solar wind speed at sunspot cycle maxima.
And cosmic rays too. The point is that there is a solar cycle variation just like for TSI. The shape of the cycle may be different for different parameters, e.g.
http://www.leif.org/research/Climatological%20Solar%20Wind.png
but the amplitude varies the same: high in high sunspot cycles, low in low cycles.
I just outlined them on my post Oct 08 11:04 am which addresses other possible solar causes. The verdict is still out .
“The point is that there is a solar cycle variation just like for TSI. The shape of the cycle may be different for different parameters..”
But the low in solar wind speed at sunspot maximum is completely out of step with other metrics, and the large regular low in the SW speed is a year or two past sunspot minimum. Two minima in the solar wind per sunspot cycle is rather more than just a different shape. Your idealised graph doesn’t help picture the real behaviour either, the solar wind speed does not look anything like as regular as that.
“but the amplitude varies the same: high in high sunspot cycles, low in low cycles.”
No I don’t buy that, the SW maximum in SC20 was larger (and later) than that of following higher sunspot cycles. Also the years 1836-1845 on CET are virtually as cold as the coldest CET years in Dalton (1807-1817), I don’t believe for a moment that the solar wind was high in that sunspot max to max solar magnetic phase.
http://snag.gy/pHiM2.jpg
Kp index measure of ‘disturbance levels in the horizontal magnetic field’
http://appinsys.com/GlobalWarming/2010080301_kp7.jpg
(credit: appinsys.com)
Salvatore, have you looked at the solar-type stars I mentioned to you on another thread?
Just some ,have not had the time to look in detail yet.
While we’re looking at the sun, consider the disc at http://www.solarham.net/regions/map.htm and ask yourself how anyone can make a sunspot group out at the label 2429? That’s a spotless sun! (Apart from the soon to be numbered one circled on the left.)
Rich.
The circle outlines group 2429.
Leif, I’m not saying you’re wrong, but…
It would be very unusual if that circle referred to 2429. On those pictures I have always seen numbers sitting next to visible groups with no circles, and circles denoting groups on the eastern limb which are expected to be numbered soon. I think it is more likely that 2429 was properly visible but has now disappeared. But at this time I have no evidence to prove that.
Rich.
Rich, you are correct [my bad]. Here is the image of today:
http://spaceweather.com/images2015/08oct15/hmi1898.gif
and yesterday
http://spaceweather.com/images2015/07oct15/hmi1898.gif
Maybe the sun doesn’t really change the overall temperature but the windflow patterns change during solar minimums. Making it colder in some regions and hotter in others. ie LIA weather in Europe and North America.
David, that’s an interesting point. Solar eclipses can create weather variations by slowing the wind down and making it change direction. This effect was demonstrated during the total eclipse in 1999. Wind speeds over the affected region reduced by 0.7 meters per second and the direction of the wind turned counterclockwise by 17 degrees.
Leif questions – when do you think solar cycle 24 will end ? Do you still have the same forecast for solar cycle 25?
I don’t ‘think’ about something like this, I prefer to let the data speak. And so far there is nothing unusual about SC24. It is too early to predict with any confidence. The best we can do is to use climatology, which says that small cycles lasts longer and are most of the time followed by another small cycle.
thanks
“The best we can do is to use climatology, which says that small cycles lasts longer..”
In fact short cycles will inevitably occur in solar minima because of the planetary periods involved in the ordering of the cycles. SC 12 is an example, there were also short ones the late 1600’s.
Dr Svalgaard
Could you please answer a question regarding the construction of your graph :
Solar activity of the past Year
http://www.leif.org/research/TSI-SORCE-Latest.png
I am not sure why the X axis is graduated as you show. I believe it is a decimal fraction of the number of days in a year, for a chosen graduation and year ? Which could convert to a month and day ?
Thanks
Yes, they are simply decimal fractions of the year, plotted 7 days apart, so the vertical lines are 7 days apart. To convert to months, multiply the fractional part by 12. To convert to days, multiply the fractional part of the months by 30.53.
thanks ! this chart provides a good compilation of solar data.
For the whole of cycle 24 see:
http://www.leif.org/research/TSI-SORCE-Cycle-24.png
It will be interesting, now that we have probes both inside and outside the heliosheath, to witness the eventual impacts the heliosheath itself. It must expand and contract in response to changes in solar flux and solar wind.
This process shields us from the stripping the solar wind creates by creating a resistance. http://newscenter.lbl.gov/2011/07/17/kamland-geoneutrinos/
“The best-studied example of a bow shock is that occurring where the Sun’s wind encounters Earth’s magnetopause, although bow shocks occur around all magnetized planets, such as Jupiter[2] or Saturn.[3] Earth’s bow shock is about 17 kilometres (11 mi) thick[4] and located about 90,000 kilometres (56,000 mi) from the planet.” https://en.wikipedia.org/wiki/Bow_shocks_in_astrophysics
[Citation needed]
“The flux of galactic cosmic rays outside the heliosphere is constant.”
Is this correct? Over what timescale?
(I think I’m remembering “The Chilling Stars” which suggested it changed according to the Solar System’s position in space, and the varying flux, modulated by the Sun, affected climate)
“The flux of galactic cosmic rays outside the heliosphere is constant.”
Is this correct? Over what timescale?
Yes, over tens of thousands of years.
“The flux of galactic cosmic rays outside the heliosphere is constant.”
“Is this correct? Over what timescale?”
“Yes, over tens of thousands of years.”
——————
Pardon my stupidity, but how can we know that? We’ve only had a sensor outside the heliosheath since August 25, 2012. I suspect it’s done with proxies. But you’ve got two (or more) unknowns: flux of GCRs at the heliopause, and moderating factors from there to your proxy sensor.
We know this because a map of cosmic rays over the sky is completely uniform with no structure at all:
http://imagine.gsfc.nasa.gov/Images/science/galaxy_cr.gif
The magnetic field of the Galaxy scrambles the cosmic rays and the amount of scrambling [and resulting uniformity] depends on the time scale over which the flux varies. Very high-energy [and thus very rare] cosmic rays are not scrambled and do show some structure, but their flux is so low that they don’t matter.
Oh My GOSH I want to be sooooo snarky here!!!!! Leif, that blank diagram is so good I now have wine spit on my computer screen! An equality calculation comes to mind.
Thank you for your explanation, but it seems to me that the uniformity is spatial, not temporal. It’s uniform, meaning we’re getting the same flux from every direction, but is the flux now the same as the flux 12kyears ago? How do we know?
How do you get spatial uniformness? By diffusion. There is a relationship between time scale of the diffusion and the length scale. All this is well known from the general theory of diffusion that we use here on Earth.
Dear David Archibald, thank you for well explained and relevant info as always!!
Frank, nothing was explained other than wriggle matching.
Yes, thanks, David. Your work is always interesting.
Daily Express strikes again:
Shock as NASA confirms asteroid TWO MILES wide will pass close to Earth in 48 HOURS
http://www.express.co.uk/news/science/610777/NASA-asteroid-warning-86666-near-miss-planet-Earth-48-hours
So, any explanation why solar activity as reconstructed from 14C and 10Be correlates quite well with global temperature variations on the millennial scale? The 2200-2500 yr Hallstatt cycle comes out in any frequency analysis of past solar activity reconstructions, and in general terms its lows are populated by minima and coincide with periods of major glacial advances and many other cooling proxies.
Perhaps it is true that small changes when accumulated over centuries cause a significant difference, or perhaps it is true that solar wind or gravitational changes affect the important “length of day” integrator as other scientists have claimed.
If we lack an explanation for the correlation between reconstructed solar activity and climatology on the millennial scale, we should either look for one or at least keep our minds open, since our knowledge is so limited as we just started looking with some detail a few decades ago.
The tiny variance in solar irradiance measured at the top of the atmosphere pales in comparison to what the Earth can do to incoming solar rays, or bits and pieces of atoms. Indeed, Earth’s highly variable surface and atmosphere affects what the Sun sends to us FAR more than the Sun’s variance affects what the Earth puts out. If you disagree, physics or chemistry, not to mention fluid dynamics and chaos theory, are areas of study beyond you.
http://www.physicalgeography.net/fundamentals/7f.html
As for CO2-believing folks, available anthropogenic column CO2 energy calculations compared to column water vapor energy calculations are apparently beyond you.
http://nov79.com/gbwm/ntyg.html
I understand that. Yet the data is obstinate. How do you explain the following evidence that has been known at least since the 60’s (J. R. BRAY. Glaciation and Solar Activity since the Fifth Century BC and the Solar Cycle. Nature 220, 672 – 674 1968):
The solar cycle activity lows on a millennial scale correlate well with cold periods according to numerous proxies.
That data still holds after 45 years. And still awaits an explanation. Fluid dynamics and chaos theory doesn’t appear to be able to explain it.
If one wishes to refer to data that has been deemed reliable, which tree ring temperature data has not been deemed, I would think one would also avoid the Beryllium 10 concentration data sets (see my first link below related to caveats about the B10 record). In your reference to Raspopov (link to his article is also below), Raspopov seems quite sure of both data sets. He is mistaken. His conclusion skates on thin ice. Literally.
http://onlinelibrary.wiley.com/doi/10.1029/97JC01282/pdf
http://elpub.wdcb.ru/journals/rjes/v09/2007ES000250/2007ES000250.pdf
You are sidetracking, Pamela. My question does not relate neither to tree-ring temperature reconstructions, nor to the 10Be dependence on climate, nor to Raspopov paper, whose figure based on other articles’ data I chose to illustrate my point, that you are carefully ignoring.
Choose your trusted/preferred solar activity proxy reconstruction for the past 8000-9000 years averaged >500 years. Compare it to a few representative climate proxies for the same time. Now observe how all the lows in the ~2,500 years periodicity correlate with significant cold periods.
[Or you can use the figure provided above and compare 14C frequency obtained by wavelet analysis with Sodium salt in GISP2 or glacier advances if you don’t want to bother].
If you don’t want to adventure an explanation for why low solar activity correlates so well with climate cooling on the millennial scale, at least you should acknowledge that such correlation exists. Logic dictates that if there is a link between solar activity and climate it is the solar activity affecting climate, and not the opposite.
Javier October 9, 2015 at 3:29 am
Say what? Your own graph shows glaciers advancing around 4000 years ago when ∂14C was falling … and it also shows advances around 2800 years ago when ∂14C was rising, and also about 5500 years ago when the ∂14C is doing nothing at all.
If you think that supports the solar hypothesis, you need to take another look at your own data.
w.
Come on, Willis,
I expected more from you than thinking that a solar hypothesis must explain every temperature change as if nothing else affected climate. If you had look at the really long solar cycles (~1000 and ~2400 years) you might have found that solar signature that you did not found with the short cycles. Then you would known that the 4200 yr BP event was not of solar origin. It was the 300 year long drought that affected Africa, Middle East and India, probably accompanied by a descent in temperatures. It was pretty important and finished the Akkadian Empire and the Harappan civilization in the Indus valley. It was of regional importance but not global since it does not register in many proxies from other places. Evidence comes from Gulf of Oman sediment cores and Kilimanjaro ice cores. See for example Cullen et al. 2000:
http://www.leilan.yale.edu/pubs/files/cullen2000.pdf
The leading hypothesis for this event is that the Indian monsoon migrated South. The ultimate causes are not known, but they don’t need to be of solar origin for the solar hypothesis to hold.
I have looked at the data with great detail. Not my data. The data obtained and published by many others. The data is obstinate. Periods of low solar activity due to clustering or unusually long grand minima correlate rather well with periods of cooling on a millennial scale over the past 9000 years. Not the other way around, as not every cooling is of solar origin. Look by yourself if you don’t trust me.
I recommend that you use the following global temperature reconstruction, which in my opinion is the best around:
Marcott et al. 2013, A Reconstruction of Regional and Global Temperature for the Past 11,300 Years.
But not the published one that is smoothed by a Montecarlo method, has an artefact due to proxy drop out at the end and has a problem with the dating of some proxies. Use the one averaged by differencing and with the published dates constructed with the same data by Grant Foster shown in the following figure in black:
Then use your favourite solar reconstruction, I used Steinhilber’s. You will be surprised. I was not convinced of a solar variation influence in the climate until I did it myself. The correlation is just too good.
Javier October 9, 2015 at 5:11 pm Edit
I expected more from you than a graph where the times of glacier advance appear to be uncorrelated with the solar cycle … that kind of handwaving from you gets short shrift from me.
w.
Why would you expect more of me if you don’t know me???
I am not handwaving. I am telling you where to look and how to look for a correlation between solar activity variation and climate at the millennial scale in case you are interested in checking by yourself. You are not interested and you have your mind made up that such a relationship doesn’t exist. Fine with me. I am not looking for converts. I was just asking if someone else has looked at this correlation and has an explanation for it. As I have told before there are articles about it since J. Bray’s paper in Nature in 1968, so a lot of people have seen it before.
You have made clear that you only looked at 11 year cycle, and are not interested in what I am saying, so you are not useful to me at this time, thank you.
Javier October 9, 2015 at 7:36 pm
Because I always expect that people making claims on WUWT will back them up with math … which you have not even tried to do, much less succeeded.
Indeed you are. You’ve put up a graph that doesn’t support your claim. You say:
Hogwash. Your own graph shows no correlation.
So now you’ve taken up mind reading along with your other skills …
As to the “correlation between solar activity variation and climate at the millennial scale”, my rule of thumb is that the further back in time someone needs to look in order to find support for their pet theory, the weaker the theory is likely to be.
You see, the problem with going back that far is that there is no way to determine just what the sun was doing then. You THINK you know, but there have been literally dozens of millennial solar reconstructions … and as you point out, they are not all the same, far from it. So you pick the one that fits your theory … handwaving.
Which correlation? The non-existent correlation in your graph? LOOK AT YOUR GRAPH! Glacier advance in your graph occurs when the ∂14C is increasing, when it is decreasing, when it is at the peak, and when it is at the trough. RUN THE NUMBERS AND CALCULATE THE ACTUAL CORRELATION BEFORE PUBLISHING YOUR FOOLISH CLAIMS! Anything else is handwaving.
A link to the actual Bray paper would be nice, because I’m sure not going to guess.
“Useful to you”? Is that how you judge the science of other people, whether they are “useful to you”?
I have no interest in being “useful to you”. I’m interested in the science.
w.
Willis Eschenbach October 10, 2015 at 4:34 pm
But I didn’t make a claim, I asked if anybody seeing a possible correlation had an explanation for it. I see it, John Bray saw it here in 1968:
http://www.nature.com/nature/journal/v220/n5168/abs/220672a0.html
“A combination of geophysical, biological and glaciological information supports the idea of a 2,600 year solar cycle.”
And dozens of people have seen it and published about it in the 47 years since. It is not as if I am claiming something new or unknown. I am asking about something already known and published and thus I don’t need to demonstrate it again.
That’s not my graph. This is my graph:
http://i1039.photobucket.com/albums/a475/Knownuthing/Solar%20cycles2_zps1va5vqbt.png
From top to bottom: Black curve represents Marcott et al. 2013 reconstruction of global temperature from 73 proxies, averaged by differencing and with original published dates as done by Grant Foster. Temperatures are extrapolated from historical measurements. Purple curve shows Earth obliquity. Black boxes represent regional glacier advances according to Mayewski et al., 2004 and references wherein. Blue curve represents solar activity as in Kern et al. 2012, based on Usoskin et al., 2004 sunspot reconstruction. Below is a fragment of this data wavelet analysis from the same reference showing the long cycles (>500 yr) only. Dark grey curve is a 2450 yr frequency sinusoidal and orange curve is a 970 yr frequency sinusoidal. The period of low ~1000 yr frequency in the wavelet analysis between 6000 and 1500 yr BP is shown by reduced amplitude in the orange curve. Grey bars labelled H-1 to H-5 mark minima in the 2450 yr Hallstatt cycle where accumulation or unusually long grand minima are observed. Orange bars mark minima in the millennial cycle for periods 11400-6000 and 1500-0 yr BP where wavelet analysis shows presence of the millennial cycle. Pink bars mark the 8.2 kyr event and the 4.2 kyr event that are proposed not t be of solar origin. The 8.2 kyr event is thought to be due to the lake Agassiz abrupt outflow, and the 4.2 kyr event is thought to be due to a 300 yr long drought in the Indian ocean monsoon area.
It is not my pet theory. I am data driven. Until I performed this analysis while writing an article about the Holocene for my blog, I was convinced that the solar theory had no basis. But seeing is believing. That is why I encourage people to do their own analysis, no need to trust me.
That is a general problem with paleoclimatology. Shouldn’t stop us from looking. I did not pick any reconstruction to fit my theory. I tried Steinhilber’s and it is there, I tried Usoskin’s and it is there. For the figure I used Usoskin’s because is 2000 years longer.
I am not making any foolish claim because I am not making any claim. This is not new and it is published, so I haven’t discovered anything, except that I found it on my own, not because I read it. I just looked for bibliography afterwards and it was there. Everywhere.
See for example:
http://geology.gsapubs.org/content/35/5/387/F4.small.gif
It is figure 4 or the following article (you can see it bigger there):
http://epic.awi.de/16850/1/Kim2007b.pdf
Guess what cycle is that? Yep, Hallstatt cycle. The 7500 yr BP Hallstatt minimum gets climatically shifted to 8200 yr BP due to the huge climate impact of the 8.2 kyr event and a solar millennial cycle minimum also there, but otherwise the minima of all these climate proxies with a 2-3 kyr cycle falls at the Hallstatt minima. So SST correlates with it, NAO-AO correlates with it, sodium in Greenland ice cores correlates with it.
The type of mathematical analysis that is required here is beyond my capabilities. You just cannot run a window through the entire series because the cycles are more intense in certain parts of the data and absent in others and you have to add the effect of two cycles at the same time, and the temperature has to be adjusted to the obliquity, not just detrended. Besides I have no interest in going through such hassle to get a number, when I am already convinced. I really don’t care that much about convincing others about something that is already published.
What science? Science is about wanting to discover and learn new things not about defending a preconceived position. I am very disappointed about my participation in WUWT in this page. I was expecting a little bit of more interest on discussing solar paleoclimatology in a solar page, and instead I am being mostly ignored, misinterpreted or just accused of making claims and handwaving. Perhaps the level in WUWT is going down, I guess I’ll try other climatology blogs to see if people are more open to talk about these questions. Any recommendation?
Javier.
Your overlay of obliquity on temperatures is astounding.
That’s the first time I’ve seen that. Do we have a return to a 41k world ? Or is it that it never really went away, other factors have led to a temporary 100k ish world. Or maybe the two coincide this time.
Perhaps we should be thankful for whatever smal warming effect co2 is having, but sooner or later temperatures will fall to rejoin the obliquity curve. We know from a comment made by rgb that during the Silurian period co2 was 10 times what it is now, yet a glaciation still took place. Given that the atmosphere was likely denser back then it seems clear that co2 won’t save us or rather future generations from the next glaciation.
J Martin, there has never been a 100k world. The time to the last interglacial is 123k which is three 41k cycles. Eccentricity plays very little role, axial tilt is paramount, precession is a secondary driver.
As the planet has cooled down and the oceans have become so incredibly cold (average temperature 3.9°C), despite being sandwiched between a 14°C atmosphere and a crust that radiates heat, the obliquity cycle is no longer capable of glacial termination as it did before mid-Pleistocene transition. Luckily every 2-3 obliquity cycles (100k average) the planet gets cold enough that the sea level gets low enough as to provide a strong positive feedback that pushes the planet briefly out of glacial conditions in the next obliquity cycle up.
The role of obliquity in glacial pacing has been modelled and studied quite convincingly by Peter Huybers. See for example:
Huybers, P. and Wunsch, C. 2005. Obliquity pacing of the late Pleistocene glacial terminations. Nature 434 491-494.
http://ocean.mit.edu/~cwunsch/papersonline/Obliquity_HuybersWunsch.pdf
http://www.nature.com/nature/journal/v434/n7032/images/nature03401-f2.2.jpg
CO2 does not protect from changes in solar irradiation distribution, it just reduces the rate of cooling (see the figure I put in a post below about historical rates of warming), as its effects are maximal in cold dry air (polar regions, high mountains and cold winter conditions). And we are going to run out of CO2 to put in the atmosphere in a few decades.
Since the ~1000 and ~2500 yr solar cycles lows, and the ~1500 non-solar cycle low all coincided between 500 and 300 yr BP (LIA), the next big cooling is not scheduled for about 500 years. Until then we should expect an end to global warming within the next decades and a moderate cooling from then on coming from the continuous reduction in obliquity. But the climate is quite unpredictable.
According to MIS19 analogy 777 kyr BP, glacial inception is scheduled in about 1500-2000 yrs from now (next low in the Hallstatt cycle). Far enough so we don’t care much.
For this you can see the work of Paul Tzedakis:
Tzedakis, P.C. et al. 2012. Determining the natural length of the current interglacial. Nature Geoscience 5 138-141.
https://courses.seas.harvard.edu/climate/seminars/pdfs/Tzedakis_etal_2012.pdf
And Katy Pol:
Pol, K. et al. 2010. New MIS 19 EPICA Dome C high resolution deuterium data: Hints for a problematic preservation of climate variability at sub-millennial scale in the “oldest ice”. Earth & Planet Sci Lett 298 95-103
http://www.researchgate.net/profile/Valerie_Masson-Delmotte2/publication/48416689_New_MIS_19_EPICA_Dome_C_high_resolution_deuterium_data_Hints_for_a_problematic_preservation_of_climate_variability_at_sub-millennial_scale_in_the_oldest_ice/links/0912f50ef2d7d14be2000000.pdf
That’s right, Pam, and the Sun revolves around the earth too…….
Your point?
Pamela, have you actually read this article? In the second paragraph, they assert that doubling CO2 concentration halves the mean free path (which they incorrectly state in the first place). At that point I’m already done. Apparently the relationship between length and volume is beyond them.
Also, if you want to understand the greenhouse effect, I’d strongly suggest reading an actual paper on it. My current favorite recommendation for people who don’t want to slog through Petty only to discover that he doesn’t really get all the way there is Wilson and Gea-Banacloche, AJP 80, p 306 (2012). This is pretty readable if you skim over the worst of the algebra.
Remember, in the end all that matters is the total incoming solar radiation (power) versus the total outgoing radiated power of all sorts, integrated over the full spectrum. An observed spectral “hole” in outgoing radiation in the CO2 band is de facto direct evidence for the GHE, quite independent of what water vapor is doing. All that is at issue is its relative, integrated strength and how it varies with concentration, which is a much more subtle and difficult questions. So I hope you don’t mean “CO2 believing folks” in the sense of suggesting that CO2 in the atmosphere has no significant effect on global temperatures, whether or not climate sensitivity now is particularly high…
rgb
I stated poorly. I do believe that CO2 contributes to the greenhouse effect and I understand how. But I don’t believe that the anthropogenic portion of total CO2 can be the cause of modern warming. Not without an amplification of some kind. Why? Not enough available energy in just that portion to explain the warming. And water vapor increase (the proposed amplification mechanism) outside of what would be expected under El Nino conditions which have been frequent during this modern warming, has not been demonstrated.
Open question to anyone. Where can I find a daily record of the 10.7cm Flux as far back to the beginning as possible? Also can anyone think of the mechanism that causes recessions to virtually never occur on the up side of a solar cycle, but always happen with in 24 months of solar max?
http://www.leif.org/research/F107-All.xls
Thank you Leif
David October 8, 2015 at 9:29 pm
You’ll have to define what exactly defines a recession “occurring” in your world before any answer would be possible.
w.
Hi Willis official starts to recessions by NBER in modern times I don’t know who was the official recession caller in the early 20th century. I am just getting into this but evidently Mental institution admissions, suicides and unemployment rates flucuate around the solar cycles. The only recession to occur in the USA during the up phase of a solar cycle was a brief recession at the end of WW2. There is always one withen 23 months of solar max. Longer lower intensity solar cycles tend to lead to manias and crashes and strong cycles have short brief recessions. If you look at the MCSI world manufacturing PMI by JP Morgan the index peaked and fell in 2012 in sync with the first peak and made a higher peak 1 month before the second peak of SC24 in 4/2014. It has steadily fallen almost in lockstep since the maximum.
David October 9, 2015 at 4:23 pm Edit
LINK! LINK TO THE DATA, PLEASE! Waving your hand and saying the magic word “NBER” is totally inadequate. I don’t go on snipe hunts looking for another man’s data.
w.
Bob Weber October 8, 2015 at 12:49 pm
Thanks, Bob. I fear that the fact that you cannot imagine another mechanism for warming does NOT mean that your mechanism is correct. That is a logical error, and I can prove it.
If you want a mechanism, the variable albedo of the earth averages about 30%. If it changes to 29% (e.g. due to changes in clouds, or wind, or ice and snow), that change would be about 3.5 W/m2.
By comparison, from peak to trough the ~ 11-year change in the TSI is on the order of 0.3 W/m2.
So there is an alternate mechanism to explain the warming, one that is much, much stronger than the change in TSI … which is also conclusive proof that the fact that you can’t think of an alternate explanation doesn’t mean your hypothesis is correct.
Finally, it’s not just you. Even if NOBODY can think of an alternate explanation, so what? The only explanation the ancients could come up with for lightning was that it was an act of the gods. Nobody had an alternate explanation … but that didn’t mean it actually was Thor’s hammerstrikes …
Like I said, the claim that ‘It’s true because I can’t think of any other explanation’ is a logical error.
w.
It would seem to me that the only heat inputs would be energy inputs from space (the Sun, plus other radiation from other sources, plus energy deposits from colliding bodies) and decay heat from the Earth’s core. Everything other variable is a variation in how much of the energy is lost to space (albedo, photosynthesis, cloud cover, GHG).
The biggest problem with the CAGW folks is they and their models treat the inputs as constants, when they truly aren’t. That, alone, skews the results.
Willis– Although I agree with you that post hoc ergo prompter hoc and argumentum ad ignorantium logical fallacies must be avoided, it seems there is sufficient empirical evidence to show a much stronger correlation exists between solar activity (TSI, CME, solar wind strength, UV flux) and global temps than CO2.
The strongest 63-yr string of solar cycles in 11,400 years occurred from 1933~1996. When these strong solar cycles ended in 1996, so did the global warming trend, despite 30% of all manmade CO2 emissions since 1750 being made over just the last 20 years:
http://www.woodfortrees.org/plot/rss/from:1996.6/plot/rss/from:1996.6/trend/plot/esrl-co2/from:1996.6/normalise/trend/plot/esrl-co2/from:1996.6/normalise
Also the Little Ice Age (1280~1850) correlates nicely with the Wolf, Sporer, Maunder and Dalton Grand Solar Minimums (GSMs). When the Wolf GSM started, global temps cooled and when the Dalton GSM ended, global temps started to recover again.
CAGW’s hypothetical projections vs. reality have exceeded 2 standard deviations for almost 20 years, which seems sufficient disparity and duration to toss CAGW in the trash. I think you share my view that further research on CO2 being the climate control knob is a complete waste of time and money.
It seems that earth’s climate is mostly influenced by: solar activity, AMO/PDO 30-yr warm/cool cycles, water vapor’s greenhouse effect, ENSO, vulcanism, the various Milankovitch cycles, earth’s albedo flux through cloud cover flux (which you have so eloquently analyzed and expounded upon) and particulates.
As the sun is entering a very weak phase, it’s important to quickly and clearly understand what effect this may have on climate.
A triage of climate is needed where the most likely variables are analyzed rather than wasting time and money on hypotheses that have already been disconfirmed. I think on that we can both agree.
The strongest 63-yr string of solar cycles in 11,400 years occurred from 1933~1996
No, there is no evidence for that. The past half+ century has not been exceptional.
SAMURAI October 8, 2015 at 11:22 pm
Gotta say, I greatly enjoy people who seriously believe they can tell us all just what the sun did for the last 11,400 years. Not 11,500 years, but 11,400.
w.
The problem Willis is those changes for us who believe in solar think those are associated secondary effects from solar changes.
Many studies have shown changes in clouds ,snow, wind ,ice are associated with long term solar changes.
Of course if you choose not to believe this ,that is fine but many of us choose otherwise.
My earlier post oct.08 at 11:04am shows the possible connections. The verdict is still out.
Savatore, I gotta say, after having read so many of your proclamations, the mere fact that you believe something is reason enough for me to doubt it seriously.
As to whether “the verdict is still out”, that’s always true in science. All we ever get are interim verdicts. And to date, my interim verdict is that after 200 years of looking, and looking hard, nobody has found any solid evidence that the sun’s tiny ~11-year cycles have any effect on the weather down here at the surface of the earth—if they had, the debate would be over.
w.
Willis I am with you with the 11 year sunspot cycles having hardly any climatic effects but differ in that I think PROLONGED periods of either minimum or maximum solar activity IF certain criteria are met as far as degree of magnitude change and duration of time will have a climatic impact.
The fact is we all agree that if the sun’s output were to change enough it would impact the climate. The disagreement is twofold which are what degree of solar variability is needed to change the climate and is this degree of solar variability needed to change the climate attained when the sun enters a period of prolonged minimum solar activity or a period of prolonged solar maximum activity.
I say yes in that the evidence suggest that when the sun is in a prolonged maximum period of activity the global temperatures have ALWAYS trended up and when the sun has entered a prolonged minimum of activity the global temperatures have always trended down.
This is without exception. If one could show data showing otherwise post it.
“I fear that the fact that you cannot imagine another mechanism for warming does NOT mean that your mechanism is correct. That is a logical error, and I can prove it………Like I said, the claim that ‘It’s true because I can’t think of any other explanation’ is a logical error.”
You are the person making the logical errors here Willis. First of all, you haven’t established any facts regarding what I can imagine or did think of or anything else regarding my work, nor have I ever said ‘I can’t think of any other explanation’. So please don’t put words in my mouth.
I’m not trying to start an argument or egg you on into another ugly confrontation either… Are you? I hope not.
Thank you for your comment. I’m very interested in your opinion about my work AFTER you’ve seen it. I did read your albedo article when you posted it and I thought it was very interesting.
My question to you is, have you determined any variability in albedo wrt to solar cycle max versus minimum for example? David Evans is leaning towards albedo but we haven’t heard everything from him on that yet.
My work involves SSN, F10.7, TSI, SST, OHC, and ENSO parameters. I am going to keep you waiting a little while longer to see that work, and I apologize for that.
When you do see it, I expect you will do your level best in analyzing it, along with everyone else.
That’s all for today because it’s movie night in 5 minutes here!
Leif,
I posted this in tips and notes. If you have already commented on this please refer me. Thanks, Jim.
The Nov. Issue of Astronomy Magazine has an interesting column on a postulated second dynamo offset from the first which is hypothesized to cause destructive interference in the normal 11 year sun spot cycle and due to cause a Maunder minimum type event in cycle 26. Would love to see Leif’s comments on the theory and, of course, all of our other solar experts as well that will undoubtedly show up on such a post. The column is called, “Sun’s activity slowing down”.
I have commented on this elsewhere. I do not consider the hypothesis credible, but people believe what they want to believe.
My grandparents parented me. Not much ruffled their feathers. Why? They had seen or heard it all before. Earth Temperature variations have come round and round, again and again. Dress for heat, pack for cold.
Where does that wisdom come from? Great-grandparent traveled on the Oregon Trail and got stuck in a great wet snow storm in the Blues rising out of Union County, so they stayed in the protected Wallowa Valley. Later, my grandparents formed the long line of travelers during the dry, snowless, cold Dust Bowl era, returning to the protected Wallowa County while the Dust Bowl/Depression eviscerated wages.
Both generations pointed to natural weather pattern variations. Today I am very much my grandmother’s child. Dress for warmth, pack for cold. The Sun is the Sun. Quite the regular chap. The Earth? Fickle and fussy, not to mention temperamental. It wobbles this way and that. Blow’s its winds here and there, or doesn’t blow at all. Do you like the weather today, this week, this year, this decade, this century? You won’t like it in your tomorrows. The Bright Regularity rises and sets paying no mind to this fickle, fussy planet. It’s the Earth wut dunnit.
Postscript: Wallowa County was formed by a great glacier advance that melted its icy fingers in place. It will happen again as our wobbly tilting planet changes its face towards the Sun. Indeed, the next door valley I now call home will likely once again be at the lapping edge of a great lake as the surrounding returned glaciers melt once again.
The CO2 vs Solar debate is much about nothing. So I am off to watch our little town’s homecoming football game. Time well spent.
Leif,
Could you please refer me to a link with your comments.
Thanks,
Jim
lsvalgaard
October 8, 2015 at 3:25 pm
“The fact is that solar activity the past three centuries has varied the same [up and down] in each century with no long term trend. Are you claiming the same for global temperatures?”
Global Temperatures have varied over the past three centuries!
But not like solar activity…
That’s true! because Global Temperatures have been manipulated to show a rise in line with CO2.
Thanks for the potted history, Pam. Football, for you, is time well spent.
After a prolonged period of reduced solar activity due to the clustering of several grand minima over a few centuries, solar activity goes back to normal in a very short time, while temperatures take about three centuries to recover to the level determined by Milankovitch variation. We have seen this in 2900-2600 yr BP, 5500-5100 yr BP, 7500-7000 yr BP, 8500-8000 yr BP, in addition to Little Ice Age.
One doesn’t need to match temperature changes to solar activity changes at a decadal scale to defend that sun variability is having an effect on climate. We are still within the temperature rebound period according to paleoclimatology, and thus our recovery can still be due with the sun going back to normal 300 years ago. The relationship between grand minima clusters and lower temperatures is pretty strong for the last 9000 years. If we prolong the Hallstatt cycle (should be called Bray cycle, perhaps you can do something about that), back, we can probably explain Younger Dryas.
It is an interesting little publicised fact that our current global warming is not due to an increase in rate of warming, and thus is compatible with the sun having normal activity, but to a significant decrease in rate of cooling. See figure: rate of cooling went from -0.4 in the 1900’s to -0.2 in the 1960’s to 0.0 now, while rate of warming has stayed between +0.2 to +0.4 all along. This figure is from UK Met through BBC. That sets a clear limit on the effect of CO2 and indicates that things are not going to get out of hand. A quieter sun in the next decades might bring back some cooling despite CO2 levels and that should be fun to watch.
http://ichef.bbci.co.uk/news/624/media/images/70025000/gif/_70025899_pause.gif
I am still waiting for data that shows the global temperature rising during a period of prolonged minimum solar activity. It will not be posted because it does not exist is as evidenced by the Dalton and Maunder solar minimums and all others that proceeded those two most recent ones.
Here’s my prediction! When the sun’s polar field stops reversing, we’ll see a dramatic drop in Global temperatures and this nonsense that the sun has no influence on planetary climates will end! 😉
The modern maximum of solar activity ended in late 2005 , and if this prolonged solar minimum meets expectations global temperatures will be on the decline just like they rose during the recent prolonged maximum.
Sun almost blank today (As far as spots):
http://www.spaceweather.com/images2015/10oct15/hmi1898.gif?PHPSESSID=68s5qr06katk93dp1g31p571c6
When we get our warmth from the sun, which part of the sun does it come from, the corona as that is the hotest part ? Dr Brown produced a global warming model with a 67 year oscillation which he hadn’t identified a source for. However, Google turned up some Russian papers showing that the suns corona has the required 67 year variation.
The decline of our happy Holocene
Our current beneficial, warm Holocene interglacial has been the enabler of mankind’s civilisation for the last 10,000+ years. The congenial climate of the Holocene spans from mankind’s earliest farming to the scientific and technological advances of the last 100 years.
Accepting that the Oxygen isotope method of paleo temperature estimation is as good representation as you can get and that the method gives a reasonable history of past climate especially for the Northern hemisphere when using Greenland ice cores.
Looking at a broader picture in Millennial steps, according to the GISP2 Ice Core data the real decline towards the next glacial age started some 3000 years ago, round about 1000BC.
The GISP2 temperature record shows a distinct ‘Tipping Point’ at 1000BC and temperatures then start their decline at a significantly increased rate. Having been roughly flat for the first 7000+ years including the Holocene Climate Optimum, the Holocene rate of temperature decline escalates from roughly 0.05°C / millennium 8000BC – 1000BC, to about 0.5 °C/ millennium, 1000BC – 2000AD.
The GISP2 ice core records matched by other ice core records from Greenland show.
1 the last millennium of our benign Holocene 1000AD – 2000AD was the coldest of the whole current Holocene interglacial.
2 each of the notable high points in Holocene temperatures, (Holocene: Climate Optimum – Minoan – Roman – Medieval – Modern), has been progressively colder than the previous high point.
3 for its first 7-8000 years the early Holocene, encompassing its high point “climate optimum” had a pretty flat temperatures on average a drop of only ~0.05 °C per millennium.
4 but the recent Holocene for the last 3000 years since 1000BC has seen a temperature diminution at at least 10 times that earlier rate.
5 our happy Holocene interglacial is about 10-11000 years old and judging by earlier Interglacials the epoch is probably drawing to its close, in this century, the next century or this millennium.
6 so any minor warming after at the end of the 20th century to the Modern high point eventually will be seen as noise in the system in the longer term progress of continuing comparatively rapid cooling over the past 3000+ years.
7 other published Greenland Ice Core records (NGRIP1, GRIP) corroborate this finding. They also exhibit the same pattern of a prolonged relatively stable early Holocene period followed by a subsequent much more rapid decline in the more recent past.
Global warming protagonists should accept that the Holocene is in long term decline and that any action taken by man-kind is unlikely to make any difference whatsoever. And were the actions by Man-kind able to avert warming would be simply reinforcing the catastrophic and eventually disastrous cooling that is bound to return in due course.
see
http://www.iceandclimate.nbi.ku.dk/data
https://edmhdotme.wordpress.com/2015/06/01/the-holocene-context-for-anthropogenic-global-warming-2/
Too much looking at a regional graph that has known problems of layer compression and altitude changes, and not enough reading makes your description of the Holocene a fairy tale with little connection with current knowledge. Some salient points:
– The deterioration of the climate starts to have a global impact around 6000 yrs ago, at the beginning of what is called the mid-Holocene transition to the neoglacial period.
– There is no “prolonged relatively stable early Holocene period.” This is a myth that breeds on ignorance. The Holocene has been characterized by a continuously changing climate punctuated by abrupt drastic climate changes like the 8.2 kyr event that was huge and lasted almost a millennium from 8.7 to 7.9 kyrs, or the end of the African Humid Period at 5 kyr ago, or the brutal arid and cold 4.2 kyr event that wiped the old Egyptian kingdom, the Akkadian empire, and the Harappan civilization of the Indus valley.
– Holocene is considered to be around 11,700 years.
– The evidence for a cooling acceleration is simply not there and contradicts evidence from previous interglacials. The cooling is progressive and irregular during the transition from interglacial to glacial.
– Nobody knows if and when glacial inception will take place. Analog comparisons with other interglacials give results that go from tens of thousands of years for the most optimistic based on 65°N insolation levels, to a minimum of 1500 years for the most pessimistic based on MIS19 analogy. Thinking that the Holocene will end within this century qualifies you to start your own doom sect.
I was trying to say:
“Noise” is not evidence.
What is signal? What is noise? – Sometimes the noise is another signal – a measure of temperature in electronic circuits. Hotter circuits are noisier – generally.
One useful addition to the above set of charts would be one on UV and EUV. Has anybody got access to up-to-date data that they could post?
Sure would like to get some reference links on the Astronomy Magazine column I noted above if everyone is done sniping and showng how smart they are.
https://www.ras.org.uk/news-and-press/2680-irregular-heartbeat-of-the-sun-driven-by-double-dynamo
“new model of the Sun’s solar cycle is producing unprecedentedly accurate predictions of irregularities within the Sun’s 11-year heartbeat. The model draws on dynamo effects in two layers of the Sun, one close to the surface and one deep within its convection zone. Predictions from the model suggest that solar activity will fall by 60 per cent during the 2030s to conditions last seen during the ‘mini ice age’ that began in 1645. Results will be presented today by Prof Valentina Zharkova at the National Astronomy Meeting in Llandudno.”
Is all my search has found of any significance. Sounds interesting. Leif says he has commented on it previously elsewhere but I have not found those comments or much else on the topic.
Jim G1
October 9, 2015 at 8:18 am
————————————-
Very interesting article, including its “Solar Cycle Prediction,” of Maunder like solar conditions by Cycle 26 (2030-2040)
They claim to be 97% accurate in their claim (model) too.
Irregular heartbeat of the Sun driven by double dynamo
https://www.ras.org.uk/news-and-press/2680-irregular-heartbeat-of-the-sun-driven-by-double-dynamo
“””….Looking ahead to the next solar cycles, the model predicts that the pair of waves become increasingly offset during Cycle 25, which peaks in 2022. During Cycle 26, which covers the decade from 2030-2040, the two waves will become exactly out of synch and this will cause a significant reduction in solar activity.
“In cycle 26, the two waves exactly mirror each other – peaking at the same time but in opposite hemispheres of the Sun. Their interaction will be disruptive, or they will nearly cancel each other. We predict that this will lead to the properties of a ‘Maunder minimum’,” said Zharkova. “Effectively, when the waves are approximately in phase, they can show strong interaction, or resonance, and we have strong solar activity. When they are out of phase, we have solar minimums. When there is full phase separation, we have the conditions last seen during the Maunder minimum, 370 years ago.”…””””
“””…Many solar physicists have put the cause of the solar cycle down to a dynamo caused by convecting fluid deep within the Sun. Now, Zharkova and her colleagues have found that adding a second dynamo, close to the surface, completes the picture with surprising accuracy.
“We found magnetic wave components appearing in pairs, originating in two different layers in the Sun’s interior. They both have a frequency of approximately 11 years, although this frequency is slightly different, and they are offset in time. Over the cycle, the waves fluctuate between the northern and southern hemispheres of the Sun. Combining both waves together and comparing to real data for the current solar cycle, we found that our predictions showed an accuracy of 97%,” said Zharkova.
Zharkova and her colleagues derived their model using a technique called ‘principal component analysis’ of the magnetic field observations from the Wilcox Solar Observatory in California. They examined three solar cycles-worth of magnetic field activity, covering the period from 1976-2008. In addition, they compared their predictions to average sunspot numbers, another strong marker of solar activity. All the predictions and observations were closely matched. …”””
Reblogged this on Climate Collections and commented:
Interesting post and interesting discussion featuring rgb, Leif, Willis, et al.
If the suns polar field reverses and it takes 9-13 years for it to rotate around the circumference of the sun and when both polarfields interact an increase in solar activity occurs such as sunspot activity, if the suns polar field stops reversing it’s a reasonable assertion that it could be a major cause of planetary cool periods… There is controversy and debate about what drives this polar field reversal not what causes the polar field itself, personaly I’m not a fan of the self-driven dynamo, that type of thing does not occur naturally in nature and it breaks with basic principles in my opinion, the other issue is with planetary temperature whiich does not exist, the ridiculous idea of 0.bla of a degree spread accross a ton of selected instruments divided across the planet is actually very incompetent and when there’s obvious manipulation involved with the instrumental data you know that part of the equation is untouchable.. Individual records do however follow the suns activity…