Guest Post by BobTisdale
As of today’s 5am eastern NOAA forecast, Hurricane Joaquin may impact the east coast of the United States from North Carolina to New England, with it downgrading to a tropical storm by the time it nears New Jersey. See the cone in Figure 1 from NOAA’s National Hurricane Center. If history repeats itself, and it’s very likely to do so, alarmists will be claiming that Hurricane Joaquin is being made worse by oceans warmed by manmade greenhouse gases.

Figure 1
We ran into those nonsensical claims when Sandy wreaked havoc three years ago, and we countered them with presentations of data from NOAA:
- Sea Surface Temperature Anomalies along Sandy’s Track Haven’t Warmed in 70+ Years
- October 2012 Sea Surface Temperatures and Anomalies Along Sandy’s Path Were NOT Unusual
- A Couple of Comments about the Oppenheimer and Trenberth Op-Ed in the Washington Post
NOAA has removed the weekly Reynolds OI.v2 sea surface temperature data from the source I had used 3 years ago, their National Operational Model Archive & Distribution System (NOMADS) web tool. As a result, we won’t be looking at that weekly data in this post. NOAA also removed the outputs of their NCEP-DOE reanalysis from NOMADS, so for Joaquin’s track we can no longer address the unwarranted claims about more moisture in the air due global warming by presenting the Specific Humidity and Precipitable Water outputs of that reanalysis. (See Figures 4 and 5 from the “Oppenheimer and Trenberth” post.)
That leaves us with NOAA’s long-term sea surface temperature data, ERSST.v3b and the new ERSST.v4 (a.k.a. pause buster), both of which are being updated by NOAA. And we’ll present the data starting in 1940 to be consistent with those Sandy posts. In other words, we’re going to confirm that the sea surfaces along Joaquin’s forecasted storm track show no warming (based on the linear trend) for more than 70 years.
Joaquin’s track is a little farther east at this point than Sandy’s, so for now, I’m using the extratropical coordinates of 25N-42N, 80W-70W. See Figure 1. If need be, we can tighten those coordinates in a future post when the September and October data are available.
But first, let’s take a look at the simulations of sea surface temperatures by the models stored in the CMIP5 archive, Figure 2. Those models were used by the IPCC for their 5th Assessment Report (AR5). As usual, we’re looking at the model mean, because it represents the consensus (better said, the groupthink) of the modeling groups for how sea surface temperatures along Joaquin’s track should have warmed if they were warmed by the manmade greenhouse gases used to force the models. (For a further discussion on the use of the model mean, see the post here.)
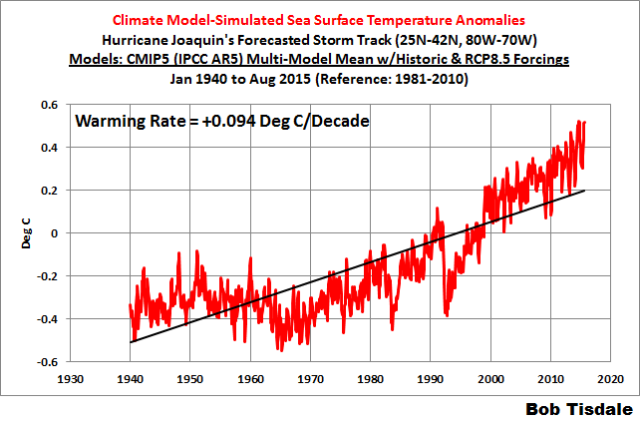
Figure 2
As shown, based on the linear trend of the model mean, the climate models used by the IPCC show that the surfaces of the North Atlantic along the east coast of the U.S. should have warmed roughly 0.7 deg C since 1940, if they were governed by manmade greenhouse gases.
Unfortunately for the models, NOAA’s former sea surface temperature reconstruction (ERSST.v3b) shows no warming since 1940, based on the linear trend. See Figure 3. Same thing for NOAA’s brand-spanking-new pause-busting ERSST.v4 data shown in Figure 4. In fact, the sea surfaces along the storm track were regularly warmer in the 1940s and 50s than they have been recently.

Figure 3
# # #

Figure 4
CLOSING
Even though data contradict the claims, I suspect we’ll be hearing lots of nonsense about the impacts of catastrophic human-induced global warming over the next few months if Hurricane Joaquin makes landfall, regardless of the fact that’s it’s been almost ten years since a Category 3 or stronger hurricane has made landfall on the U.S. [Cue President Obama.]
SOURCE
The climate model output and the sea surface temperature data are available from the KNMI Climate Explorer.
“Even though data contradict the claims, I suspect we’ll be hearing lots of nonsense about the impacts of catastrophic human-induced global warming over the next few months if Hurricane Joaquin makes landfall, regardless of the fact that’s it’s been almost ten years since a Category 3 or stronger hurricane has made landfall on the U.S”
======================================================================
Yes, and you can safely bet that data such as ACE (accumulated cyclone energy) which also shows no increase in hurricane strength, will also be ignored.
Here in the UK, the mass of Guardian readers and BBC watchers have never heard of accumulated cyclone energy. And they have certainly never seen the graph. They will never be shown such a graph.
They have now banned real science from the debate. Only a minute selection of cherry picked massaged data is permitted along with the most alarmist interpretations and the most expensive solutions.
Bob, the model of temperature anomalies shows a sudden drop around 1991-1992. This could be a clue as to why the models don’t work. Any idea why the models suggest a 2 year temperature drop of 0.4 o C when the measured data shows no change?
Mt Pinatubo, June 1991.
Please note that NHC’s Official track is to the east of the preponderance of the GFS and other guidance, but to the west (considerably) of the ECMWF’s forecast. They have used a compromise track between a stark divergence in possible solutions. In other words, their Official track will very probably be wrong, as either one or the other solutions will be more correct. You might want to do you analysis over the GFS track as that is the one with the greater impact on land.
Considering the storm has continued to track southwest, contrary to model guidance, this may be one of those times the models will not forecast this thing correctly until the last minute. Remember Jeanne in 2004?
If you were in South Florida at the time, you will have a hard time forgetting that miserable experience.
Forecasts continued to call for it to pull away out to sea, even as it did a loop de loop right back at us.
Then it stalled just off the coast for a few days, again not forecasted.
No fun, was that one.
Menicholas, you’re right. Loop de loops are not unknown in that area. Just after Eisenhower was inaugurated a very strong storm (not a hurricane) did the same thing, catching my family and me (age 15) in the middle of the Gulf Stream on a heavy 53-foot boat. Wind against water, too. That was no fun either, except for my sister (3 yrs.) and my brother (5 yrs), who thought it was great fun.
I’ve never quite forgiven them for that.
Given the garbage methodology, I would be more interested in the RSS and UAH sea surface data.
The computer modeling on this storm has been an absolute joke so far.
…and you can do better?? Please, feel free to submit your obviously more accurate forecasts for public scrutiny.
No. But that is not the issue.
Poptech is neither claiming to be able to model these things into the future or into the past. Have a closer look JKrob, the model data presented here are not forecasts they are hindcasts. There is no need for anyone to ‘do better’. The rest of us can just look at the historical record.
The real issue here is that the models are simply not fit for purpose. They represent a weird world where science goes to Wall Street and in the spirit of ‘groupthink is good’ ( vs ‘greed is good’) produces sub prime science at best but typically just plain junk science.
Why does he have to do better in order to observe what low quality others are putting out?
I don’t have to be a master mechanic to know a junker when I see one.
I don’t have to be a gourmet chef to know garbage when I see it.
Why do you feel that only those who can do better than you are allowed to criticize your work?
Sure, I can close my eyes and randomly point at a map too.
I believe he did that. The unmodel and its associated no prediction of the path, strength and effect is at least as good as anything presented by the ‘experts’. Perhaps better.
M Seward said:
Maybe *you* need to have a closer look…”The computer modeling on this storm” Poptech is referring to is the dynamic modeling for the future of this storm not the “climate models used by the IPCC” which have nothing to do with this storm. If you can’t understand that, well…
MarkW said:
Low quality…according to who…you? You, Poptech & others are in a position to offer this critique because of…what? You are free to make ignorant statements & make yourself look like a fool anytime you want.
…better than me…criticize my work…what?!?! Do tell – what work do I do?? Please be specific. Irregardless of what I do, I DO understand the extreme complexities of dynamic meteorological modeling, the different physics of the different models, the biases the different models have, the limitations in data sampling and the difficulty of the meteorologists in understanding these issues combined with a very complex & dynamic atmospheric setting when making a forecast that millions of people depend on. No pressure there.
WABI
The modeling looks top notch…
http://media2.s-nbcnews.com/j/newscms/2015_40/1243161/storm_bca6cf8062216fd48f15bad049182c39.nbcnews-ux-2880-1000.jpg
Maybe for a few billion dollars more they could pay someone to throw a dart at a map.
I am totally amazed at the fidelity obtainable in ‘ simulated ‘, ‘ modeled ‘, ‘ anomalies ‘ computer creations as shown in red in Fig 2.
I would never guess that you could make up stuff with such detail in it, to almost make it look real.
It is unfortunate that what the real physical earth ocean sea surface Temperature anomalies actually did over that time since 1940, is not available for comparison with the imagined graph.
I’m equally astonished that anyone would consider a straight line fit to that made up faux data to have any relevance.
A simple straight line drawn from the very first made up data point to the very last made up data point would seem to me to be an equally invalid straight line.
Trying to shoe horn such behavior into some pre-conceived notion, seems on a par with the Papuan aircraft cargo cult behavior.
g
PS: As always Bob, thanx for bringing these things to our enlightenment, or at least entertainment. So East coast is predicting substantial rains over thee.
“I would never guess that you could make up stuff with such detail in it, to almost make it look real.”
Pixar Studios is much better at it than all the so-called “scientists” at NOAA….(c;]
I am reminded of the professor who taught a statistics course I once took: “Statistics is an attempt to provide meaning where there is none!” Still true.
The latest model runs are still all over the place, but there has been a bit of a shift to the east, reducing the risk (slightly) of an East Coast landfall. We can only hope that the trend to the east continues.
Even if there is a landfall along the US East Coast, Joaquin is forecast to weaken by then, so the drought of major hurricanes making a US landfall will likely surpass the 10 year mark.
The models have mostly spread out.
The one model which sees a Florida landfall has brought the storm air further south!
I have not had a chance to review the latest model runs, but I am hoping for more clarity soon.
I am concerned someone ( a lot of someones, really)will be clobbered in a sudden and ill prepared manner.
…the storm ashore further south…
The models have caved to the ECMWF. Joaquin is a fish storm. All that hype for nothing.
Joaquin is not a fish storm for the Bahamas.
And most probably not for the US either.
The cone of uncertainty is all over the map on this one. Not unlike ipcc climate “forecasts”.
Folks in here will be quite surprised at how much the NHC cone shifts east today. The ECMWF has been showing an out to sea solution the past two days. The ECMWF is ranked number 1 in terms of verification. The UKMET and GFS which rank 2 and 3 in terms of verification jumped ship last night and now agree with the ECMWF.
I love these graphs, there’s no need for hunting an hiatus, the real data shows exactly how low the trend is compared to claims. Thanks Bob
Yeah! More rain! It was very dry during much of September here in upstate NY. We got 5 inches yesterday and I have a well for water so all this rain is good for me. And yes, we are watching this approaching storm to see if it will hit, too.
Sandy washed out the bridge that crosses the stream next to my home base.
got 10″ here yesterday (maine) in under 18 hours.
still messy out there
Nice comparison, but OCD/pet-peeve of mine forces me to comment:
Why is the range of Figure 2 (-0.6,0.6) while Figures 3 and 4 are (-1.5, 2.0)?
I am not suggesting any nefarious intention, just that when doing visual comparisons it is nice to have the scales the same.
Forecast is a strong verb, and the past tense is “forecast”
Looking at air flow patterns over North America I’d wager that cool dry air gets pushed into the Ohio Valley and then back at the storm track, by midday Saturday the top comes of this whole system and it becomes a tropical storm with moderate impact on New Jersey. In the meantime every news organization will have a two day window of opportunity for stupid headlines like “Is Another Sandy Looming?”
Disclaimer: I still encourage people to be prepared, you can always use that extra bottled water, batteries, and the jumbo bag of trail mix at a later date …
Please pay attention to the jetstream and air from the north.
http://earth.nullschool.net/#2015/10/03/1200Z/wind/isobaric/500hPa/orthographic=-82.34,37.78,792
So what is pushing it SW, in your opinion, ren?
I see nothing obvious that accounts for this, except momentum perhaps.
Thanks for the facts, Bob.
No extra energy for Joaquin due to CO2 (or for anything else for that matter).
This will be a serious threat to the entire east coast.
http://earth.nullschool.net/#2015/10/05/1200Z/wind/isobaric/500hPa/overlay=total_cloud_water/orthographic=-82.34,37.78,792
Bet it isn’t.
Ok!
NHC continues to push the cone east. They still have a bit of correcting to do as the actual track will be just west of Bermuda.
http://www.nhc.noaa.gov/refresh/graphics_at1+shtml/145823.shtml?5-daynl#contents
I think it is early to predict what Joaquin will do, if only because the forecasting tools are still far away from convergence on any sort of track solution more than 48 hours out. There is a general consensus in the models that it will sit almost still for the next two days, perhaps cranking up to cat 4 on the hapless Bahamas while sitting on them for 36 hours straight, before a blocking ridge weakens and it starts to move. But TWO models call for it to spit out of this and come west to hit (maybe) in the Carolinas, maybe still as a strong storm. All of the rest AND the ensemble models have shifted the 3+ day trajectory “dramatically” east overnight. The official track is still splitting the difference with the two models that like the Carolinas, but the direction of the shift is very much towards offshore, possibly far offshore. If UKMET (for example) is right-est, the US will see pretty much nothing but a weak Sou’easter along the East coast from a hurricane center hundreds of miles offshore, one that weakens rapidly to become a tropical storm or extratropical depression long before it threatens land.
Of course if the two “maverick” models are right, NC could get anything from flooding and maybe eddy tornadoes to a full blown cat 3 hit as the hurricane races ashore anywhere from southern NC to northern SC, likely as at least a category 2 storm.
I personally am not thinking it too likely that it will hit as category 3, if only because temperatures in NC are currently plummeting — 63 and rainy right now, and expected to drop to the mid-50’s, sustained, all day tomorrow (with lots of rain, rain and gloom that has continued here for almost two weeks with no more than hours of respite or a glimpse of the sun). This cooler air is coming down from the Northeast but is slowly getting pushed out over the Gulf Stream offshore as a front slowly moves down from the northwest (due to arrive, maybe, by next week since all is chaos in between as far as forecasts are concerned). The interesting question will be what this cooler but still pretty soggy air will do to the hurricane as our current weather pattern gets sucked into its intake. Cooler dry air would ordinarily poison the heat engine and the front would add shear that also should reduce intensity.
However, this cooler air will be pretty wet already, and will hit warmer, wet, saturated air. This could produce phenomenal rains and lots and lots of vertical shear on the northwest to west side of the hurricane as it entrains saturated air that is 10 to 20 C cooler than its already saturated air, and the whole thing could more or less come apart into disorganized thunderstorms as water rains out and generates huge up and downdrafts in the middle of the rain bands, especially if the cooler-wetter air reaches the eye. OTOH, it could be that the cooler wet air will prevent surface evaporation from the ocean, warm is it is swept in, and superpower the storm by adding huge amounts of water vapor beyond what the SSTs are currently capable of sustaining on their own. With a very strong temperature gradient colliding within the storm and saturated conditions, I’d think a lot of unexpected behaviors are possible, and might even compete with one another in different parts of the same circulation.
It COULD even be that the cooler air we are due to have tomorrow and the next day will cause most of the moisture content to rain out on us before it reaches the ocean so that it WILL be cool drier air that is sucked into the hurricane. If this happens, I expect that it will significantly interfere with the heat engine and reduce the strength of the hurricane in future forecasts quite rapidly, maybe even back to the tropical storm that it was predicted to remain, at first. In that case if the track is out over the ocean, we may not even “notice” it in the US.
It is remarkable to see how poor our ability to predict all of this is even three days out from the present, even with a serious amount of computational power being devoted to it with at least eight to ten distinct tools at different sites, even with direct high-risk internal measurements and satellite observations of the guts of the storm and a fair knowledge of the state of the ocean and general weather patterns all around. Even so close to the event, the track of the storm could be decided by the wings of the proverbial butterfly, one of the smaller possibilities (even ones on a scale too small to show up in the current simulations) suddenly nucleating and growing to dominate the future dynamical trajectory. Not that it isn’t way better to have these predictions, as accurate or inaccurate as they might be, than to live back in the 1900’s where we might have little idea that the hurricane existed or where it might go beyond the fact that hurricanes over the Bahamas can end up “anywhere” within the week. And they will get better over the next 24 hours, as the models will start to converge within their fairly reliable predictive range out to landfall by then.
We’ll see. I’m literally holding off on making a bid on a house at the coast until I see what is likely to happen. A category three or better hitting Cape Lookout directly might leave no house to bid on. At the very least, it will be interesting to see how it weathers whatever weather we have come Monday.
rgb
Geomagnetic storm will accelerate the wind (jetstream).
http://weather.gc.ca/data/analysis/935_100.gif
Rainfall over the Maritimes Provinces of Canada is due now to a narrow depressionary band constrained by the 1039 hPa anticyclone centered over the Great Lakes, Ontario and Quebec and the formidable push by the western Europe anticyclonic agglutination now down to 1028 hPa on the Eastern Seaboard while around 1035 hPa over western Europe but that used to be at 1045 hPa a few days ago. The narrow band of intense precipitation will absorb Joachim in a NE trending trajectory which likely brush Atlantic Canada as a Tropical storm.
“I think it is early to predict what Joaquin will do, if only because the forecasting tools are still far away from convergence on any sort of track solution more than 48 hours out. ”
No,
http://www.nhc.noaa.gov/refresh/graphics_at1+shtml/145823.shtml?hwind120#contents
It’s not too early to predict.
The scientific question is
A) how good have predictions been in the past– this is NOT a 0/1 question
The practical question is
A) GIVEN the past performance, what will a rational creature do with this information.
Its not too early to predict, because, predictions are in fact made.
How much faith you want to put iin these predictions is partly a scientific decision
— how good have the models performed in the past–
— will the future be like the past–
And given your level of belief
what should you do?
Yes, some disbelieving folks die.
yes, some believers take precautions when they dont have to.
Darwin wins
Actually Yes,
It was to early to predict with any confidence Joaquin’s track. Subtle changes in initial conditions led to greatly divergent predictions. This afternoon’s predictions were greatly shifted from this mornings.
rgb was and is correct
Sometimes I think you are nutty Mosher, but now am sure of it. When one says “it is too early to predict” only someone trying to cause trouble or someone totally nutty would take that literally and say “Its not too early to predict, because, predictions are in fact made.” Maybe you are trying to cause trouble, but based on your previous comments on this site, you seem totally nutty to me. I don’t know how else to describe it. If you actually take the words “I think it is too early to predict….” in this case literally. Any non-nutty person would know that he meant it too early to make accurate predictions. I mean come on.
Glad to have rgb’s analysis, since the storm is headed in my direction as well.
Wouldn’t the slow movement of the storm tend to reduce the nearby ocean temperatures and weaken the storm relative to a faster-moving but otherwise similar storm?
The graph references RCP 8.5. This particular model scenario predicts temperatures based on a CO2 RF of 8.5 W/m^2 due to CO2 concentrations on the order of 1,000 ppm. What does that have to do with current realty?
I haven’t checked, but probably all the RCPs are showing the same or nearly the same level of CO2 at present, since so little time has passed since their creation.
Each of the RCPs has a CO2 concentration and an RF W/m^2 to go with that CO2 i.e. 2.6, 4.5, 6.0, 8.5. The RF drives how hot the earth has to get to radiate (S-B black body) the excess heat imbalance due to the RF. Radiation isn’t the only path for that heat imbalance. Radiation is trivial compared to the oceans and clouds that really run the atmospheric heat balance. RCP 8.5 is IPCC AR5’s worst, worst, worst, worst case scenario. How does that apply? Should be RCP 2.6. See IPCC AR6 Chap 6.
You still need to look at the surface temperature.
https://weather.gc.ca/saisons/animation_e.html?id=month&bc=sea
http://www.opc.ncep.noaa.gov/sst/images/midatl/MidAtl_GoesSST.gif
note if Joaquin will become a category 5 then the record of “longest stretch without category 5 hurricane since 1924” won’t be broken.
The longest stretch without category 5 hurricane is between hurricane Allen (official end 9 august 1980) and hurricane gilbert (13 sept 1988) which is 8 years, 1 month and 4 days.
the actual stretch is since hurricane Felix’ end which is september 4 2007
so we’re just 7 days shy of that record. so even with Joaquin reaching category 5 strength it would mark the second longest stretch without category 5 hurricane…
makes one to think about global warming and hurricanes…
Is Joaquin predicted to reach cat 5? The forecasts I’ve seen having it top out as a 3.
Cat 4 status as of 2 pm est.
Expected to be at 140 mph by Friday AM
Still moving SW at 6 mph!
This thing has moved for over 100 miles contrary to forecasts, just since last night.
Anyone anywhere along the coast, or on any river in eastern US should be watching this very carefully, IMO.
I warned all my friends last night not to trust forecasts, based on models performance to date.
Crap like this is why I a house with bought roll up shutters.
By the time one knows where some storms are heading, the stores are mobbed.
BTW I do not expect it, but would not rule out categorically a completely different track than what is now predicted.
You can’t.
Experience shows that some storms will defy prediction.
They make their own steering currents, or something like that.
it’s already far above any intensity forecast and it may reach it it’s a guess from what i see on sattelite loops and IR loops. It already reached category 4 now while the forecast discussion still says it will only be a category 3….
latest bulletin (sorry NHC uses caps)
WTNT31 KNHC 011753
TCPAT1
BULLETIN
HURRICANE JOAQUIN INTERMEDIATE ADVISORY NUMBER 15A
NWS NATIONAL HURRICANE CENTER MIAMI FL AL112015
200 PM EDT THU OCT 01 2015
…JOAQUIN BECOMES AN EXTREMELY DANGEROUS CATEGORY 4 HURRICANE…
…CENTRAL BAHAMAS TO EXPERIENCE HURRICANE FORCE WINDS…STORM
SURGE…AND HEAVY RAIN THROUGH TONIGHT…
Time to prepare. Stock up and get the plywood ready. Good chance we will get high surge in the mid atlantic on Monday. Last time I checked though weak hurricanes and tropical storms hit this region from time to time. Nothing to get hysterical about. Hopefully it will stay offshore bit it’s starting to look less likely for that track.
Pushing my usual complaint – Bob, what are the appropriate margins of error both on the two databases and on the model? My gut instinct is that the margins of error in both the data and in the model swamp the trends you are graphing and that both the model and the data, with appropriate margins of error applied could show positive or negative slopes.
Look at the trend over the last 17 years, tho.
OK, fine. Look at the Atlantic hurricane trend over the last 10 years.
Latest track has Joaquin a little further to the east, and not making landfall until up around NYC.
Here in southwest Florida, banding of the cumulus field is evident, lining up on southeast to northwest orientation.
To me this indicates an expanding wind field, which could mean further strengthening is taking place, or will.
Firstly I trust that all those along the track are not hurt or worse by Joaquin.
As a side thought do hurricanes have a beneficial effect by oxygenating seawater and by stirring the nutrients in the seas, from algae to seaweed? A marine equivalent of a localised forest fire allowing plant sucession? Sorry for my ignorance of marine biology
Again, stay safe
Just want to point out that, as of the 8:00 PM EDT advisory, this storm continues to move in a southwesterly direction !
Model guidance and the cone of uncertainty notwithstanding, the storm is moving in a direction nearly opposite to what has been prognosticated.
If I was still living in the East Coast of Florida, I would be getting very uncomfortable.
I was watching a few hours ago on TWC as a bunch of forecasters and a modeler were congratulating themselves on the models coming into better agreement with forecasts from yesterday, but it seems to me they were all overlooking and seemingly oblivious to the actual storm doing the very opposite of what they continue to predict.
Now, perhaps the thing will do a 180 (or thereabouts) and go back the way it came.
But if it does not, and continues on current heading and only gradually makes a turn to the west and then northwest, it will at some point be on a trajectory to brush Florida with storm force winds and perhaps some surge…surely strong onshore winds at the least.
At this point the center is south of the latitude of Havana, pretty much due north of Guantanamo, is below the Tropic of Cancer, and barometric pressure just hit a new low.
The storm is deepening, heading the wrong way, and I hear no one asking some very pertinent questions…like when will advisories be extended to areas outside of the previous cone?
I have a lot of friends and coworkers over there, and none of them have taken standard preparations for a major hurricane.
I imagine few over there are prepared.
I sure do hope those models prove correct and this thing turns around.
Suppose this is an epic fail, worst case scenario for the models?
Thousands could die.
Two low-pressure centers combine over Florida. Will be a lot of rain.
OK, Finally a slight northern movement as of 2:00 AM.
It will be a blessing if this goes right out to sea, that is for sure.
See where the jetstream drives the clouds. Florida will be calm.
http://www.accuweather.com/en/us/national/satellite-wv
The current temperature of the ocean surface.
http://oi62.tinypic.com/2ibex4i.jpg
Looks like they are now forecasting it to parallel the coast, a few hundred miles offshore.
Well, you were right. Even as the forecasts bend to sea, the alarmists try to wave the CO2 flag:
http://climatenexus.org/us-east-coast-braces-climate-change-fueled-hurricane-joaquin
Let us hope the models are wrong.
Read your history. “Super” storm Sandy was only a Category 2 when it hit land fall. The New England Hurricane of 1938 was a Category 3 and killed more than 600 people. There was also a large hurricane that hit the Northeast in 1869. So it seems pretty routine for the Northeast to be hit by a hurricane every 80 – 100 years. No modification to the cycle by climate change. The only reason Sandy was so destructive was that unlike the Gulf states and Florida, the northerners forgot the past and continued to build their pretty little sea side residences and businesses without proper protection. Even if Joaquin hits, it will probably only be a Cat 2 or less on landfall.
You are drawing a long bow I think. Your analysis includes sea surface that the storm has not passed over yet.
Tropical storms are complicated things.
“Tropical storms are complicated things.”
If your model assumes everything holds steady but one parameter, say SST or S-B back radiation or RH or day of the week, then climate analysis and prediction becomes pie simple. Now where’s that IGES/COLA NSF grant form I can copy?
It’s not the end of the rain in the east.
http://earth.nullschool.net/#2015/10/04/1500Z/wind/isobaric/250hPa/orthographic=-93.58,37.35,690
Well…
Here’s at least one article:
http://www.thedailybeast.com/articles/2015/10/03/hurricane-joaquin-another-word-for-climate-change.html
The meme is alive and well, and just as incorrect as ever.