While ramping up his own invective to fit as much ad hominem as possible into a single sentence:
Mr. Sauer parroted baseless talking points that have their origin in fossil-fuel industry-funded climate change denial propaganda, not honest scientific discourse.
Michael Mann says:
“overall warmth of the globe and northern hemisphere today is substantially greater than during Medieval time”
Except, there’s that pesky ice core proxy temperature data (proxy temperature data is something Mann embraces for his own Hockey Stick) that says otherwise:

And he finishes up with this gem:
Readers interested in the truth behind the science, rather than the falsehoods and smears perpetuated by uninformed individuals like Mr. Sauer, should consult scientist-run websites like skepticalscience.com, or books on the topic like my own “Dire Predictions: Understanding Climate Change”. Let’s get past the fake debate about whether the problem exists, and on to the worthy debate about what to do about it.
Last I heard, skepticalscience.com was run by a cartoonist.
Having the courage to “do nothing” is also worthy of debate.
[Added] Given his quote, Dr. Mann might find the recent change in the AP style book interesting.
Update: Some people had questions about the graph and it’s representivity. For that, we cite the paper by Dr. Richard B. Alley, of Penn State, a colleague of Mann and a vociferous climate change proponent, much like Dr. Mann himself. The bolding in the abstract is mine.
The Younger Dryas cold interval as viewed from central Greenland
Quaternary Science Reviews
Volume 19, Issues 1-5, 1 January 2000, Pages 213-226.
Richard B. Alley
Department of Geosciences and Environment Institute, The Pennsylvania State University, Deike Building, University Park, PA 16802, USA
ABSTRACT:
Greenland ice-core records provide an exceptionally clear picture of many aspects of abrupt climate changes, and particularly of those associated with the Younger Dryas event, as reviewed here. Well-preserved annual layers can be counted confidently, with only ~1% errors for the age of the end of the Younger Dryas ~11,500 years before present. Ice-flow corrections allow reconstruction of snow accumulation rates over tens of thousands of years with little additional uncertainty. Glaciochemical and particulate data record atmospheric-loading changes with little uncertainty introduced by changes in snow accumulation. Confident paleothermometry is provided by site-specific calibrations using ice-isotopic ratios, borehole temperatures, and gas-isotopic ratios. Near-simultaneous changes in ice-core paleoclimatic indicators of local, regional, and more-widespread climate conditions demonstrate that much of the Earth experienced abrupt climate changes synchronous with Greenland within thirty years or less. Post-Younger Dryas changes have not duplicated the size, extent and rapidity of these paleoclimatic changes.
Source: http://www.sciencedirect.com/science/article/pii/S0277379199000621
Source data for the graph: ftp://ftp.ncdc.noaa.gov/pub/data/paleo/icecore/greenland/summit/gisp2/isotopes/gisp2_temp_accum_alley2000.txt
UPDATE2: In pointing out an error I made (in comments) about the end date in the GISP2 graph above (ending 95 years before present) Nick Stokes reminded me of a detailed analysis I did in 2009 showing the scale of Mann’s Hockey stick relative to the GISP2 data.

You can review that post here: http://wattsupwiththat.com/2009/12/12/historical-video-perspective-our-current-unprecedented-global-warming-in-the-context-of-scale/
The graph from that post, shown above, illustrates the last 3000 5000 years, with the 20th century instrumental record splice added (like Mann did in his original hockey stick paper) to show the warming of the last century. Clearly, the medieval warm period around the year 1000 is still warmer than the present
And there is a video, which illustrates the scale of the “hockey stick” compared to the warmer periods of the past:
Mann appears hell-bent on making himself a laughingstock, with or without the help of Mark Steyn.
How can he make himself a laughing stock when he already is one?
Come on, if any sceptic wants to add some human to anything they say we just mann-ufacture humour by referring to mann-made warming, etc. Isn’t this the dictionary definition of a laughing stock?
Ahh.. you mean Laughing…..stick of himself, surely 🙂
OK. Let me quote Mann again and keep an eye on the northern hemisphere. Why does Germany import olives?
From Europe and not to the US. Mann oh Mann!
Now this is what I call a proxy.
[“The stump of an ancient tree is visible at the base of the Mendenhall Glacier in July of 2013. UAS Professor of Geology and Environmental Science Program Coordinator Cathy Connor said she and her team have found the trees to be between 1,400 and 1,200 years old.”]
http://jun-cdn.com/sites/default/files/imagecache/superphoto/superphoto/ice_forest_3w.jpg
TYPO:
“From Europe and not to the US. Mann oh Mann!”
should be:
“From Europe and now to the US. Mann oh Mann!”
Who put that forest under all that I’ve?
Mann seems to be the only one left who actually believes his hockey stick is accurate.
Do you really think Mann believes his hockey stick is accurate? he sought to cover up his fraud in a rising tide of climate alarmism, and if the broad thrust of AGW had been proved to be correct, his manipulations would have been seen as over-enthusiastic misdemeanours.
As the tide turns against him and the AGW theory ebbs faster than a retreating glacier, he is left exposed with his life, career and professional reputation on the line.
Her has no choice but to lie, and hope.
He has nothing to gain from the truth, and everything to fear.
I am convinced that nobody can on his own make himself a laughing stock as quickly or completely as will be achieved with the involvement of Mark Steyn. And this is before I have read Steyn’s latest work, A Disgrace to his Profession which is on order and hopefully arriving soon.
Steyn is a national treasure of all three of his nations.
It is unfair to try and correct Mr. Michael Mann with actual data. Did you not know that he is a Nobel Laureate?
He should know the United States isn’t big enough for two Popes.
OK, I know he’s a complete and utter pontiff.
Which one?
Don’t they already have two Popes? The one they co-opted into the robe for political purposes and the one that stepped down to allow it?
Once again, how can you measure temperature for 800 years, 1000 years, 3000 years from an ice core?
As a layman, I don’t understand. The Vikings didn’t have thermometers…please explain how it is done from an ice core?
Read this:
http://earthobservatory.nasa.gov/Features/Paleoclimatology_OxygenBalance/
I read the link. Would have like to have seen something about error bars (among other things, I assume they are not constant over time; e.g.: error bars increase over time).
Your first hint that scientists are onto something with the ice core data is that time after time receding glaciers show the ancient presence of plants, even forests, as they melt. These occurrences are too widespread in time and general area of occurrence to be a fluke of micro climate. Knowing the kinds of plants and sometimes animal remains tells us about the climate that existed there at a point in time. When you find those remains under a pile of ice you know the climate in that area was much warmer for a span of time.
Error bars can be helpful. But think about this: If we say there is an error of plus or minus two degrees after saying that period was five degrees warmer it was warmer and it also means it may have been even warmer than calculations state. “Error bars” cover the higher as well as the lower side of a measurement.
What? You don’t believe that you can measure the temperature of the entire globe to within a few hundredth’s of a degree using ice cores in Greenland? This is truly revolutionary – we can throw away all the other surface and ocean data.
Who needs ice cores?
The graph shown is not a refutation of Mann’s words, since firstly it concerns local temperatures rather than overall temperatures, but more importantly, it ends at 95 years before present, which would either be 1905 or 1855 depending on who you believe. Either way, it is not valid as an argument in a discussion about temperatures today.
Nor would splicing current temperature records onto a proxy be valid as an argument in a discussion about the MWP.
You’re right that that would be like Mann’s Nature trick.
But it’s not a legitimate technique that would be used by honest or competent scientists.
That’s still no reason to use an invalid argument against him
But where do we come out if we allow that since the end point of this graph, we add the most over adjusted surface record we can find?
Still cooler than today, I think.
Sorry, long day!
Still cooler today than back in the MWP.
Such an approach would be a ballpark guestimate at best, but I’ll give it a go for argument’s sake. Not sure what “the most over adjusted surface record” is, but I do know that most surface records indicate warming in the NH to be around 1 degree C since ca 1900. So than locally there is definitely the possibility for more warming. Since polar amplification has been reported in other places, this makes it at least plausible that temperatures today in Greenland are definitely warmer that during the MWP.
Even if the proxy data to date were at hand, it would be illegitimate to carry a time-series graph with say 200 year smoothing beyond its natural limit (100 years) because to do so would be assuming knowledge of the future trend.
Aran – polar amplification is not living up to its scary “promise”:
Aran…so the geologic record means nothing to you; the prior warming and cooling periods after the end of the Pleistocene mean nothing to you. After the end of the LIA, I would at least expect you to realize that the earth would get warmer via natural processes.
You should then ask yourself, or Mr. Hockey Schtick, how much warmer and for how long, from those natural processes.
“so the geologic record means nothing to you; the prior warming and cooling periods after the end of the Pleistocene mean nothing to you.”
I really don’t know where you get that idea. It is simply, completely off topic. I have been viciously accused of changing the subject on this site, but to bring in the Pleistocene on the subject of comparing the climate today with the MWP seems an enormous stretch.
Aran, it’s included to let people step back and see the “big picture”, which is that today’s so-called “warming” (substantiated by computer model but not measured directly) is miniscule compared to what’s happened in the past. Once your view is extended you can make a more valid comparison and perhaps be satisfied that the fear-mongering crowd haven’t looked at the “big picture” either.
More bone headed cattle in one region of Greenland back in the day. Yet today there are ALLEGEDLY just a few dozen in Greenland, if that.
Phil.,
Qassiarsuk is right next to Narsaq, the sheep “ranch” in far southern Greenland about which we’ve been talking.
We know how much it has warmed since 1905. At least Mann believes he knows… add about 0.8 degrees on the end of that ice core plot… it still isn’t as warm now as the Medieval Warm period. And as far as temperatures for the whole globe… Who the hell has that information? Mann certainly doesn’t. His bull shit hockey stick plot was titled Northern Hemisphere temperatures.
I have just been told that splicing current temperature records onto a proxy is not a legitimate technique that would be used by honest or competent scientists
Scott Scarborough, leaving aside the fact people here have (rightly) criticized Michael Mann for comparing proxy records to the modern temperature record, it is beyond absurd to compare the global temperature record to a single proxy’s record. Greenland is not the entire planet. This proxy was taken from Greenland, and as such, if you’re going to compare it to any temperatures, you should compare it to Greenland’s temperatures.
And if you look up Greenland’s temperatures, you’ll find it has warmed by 2-3 degrees. That means by your own argument, this proxy actually supports Mann’s claim. Now, I’m sure you’ll say this argument isn’t valid, but remember, you were fine with using it when it supported your view.
Brandon, do you mean the actual Greenland temps, or the massively adjusted fraudulent Greenland temps?
It is a plainly verifiable historical fact that during the MWP there were farms and villages on that Island(continent?) , a place that it is far too cold to farm today.
Menicholas:
As a matter of policy, I try not to have discussions with people claiming the surfact temperature record has been fraudulently adjusted. I find it’s a waste of time, and I think it’s disgusting people make these accusation, but mostly, I think it just weakens the case against people who have actually committed fraud like Michael Mann. I’d rather not have real issues clouded by the paranoid sort of nonsense espoused by people like Steven Goddard.
I’m sure you’ll disagree with my view, as is your right, but I don’t intend to respond any further. As a parting gift though, I would like to offer you a bit of useful knowledge: Greenland is not a continent. I just thought you might like to know.
Well, I suppose I can then only aspire to one day achieve your level of virtue, that you might deign to converse with little old me.
Hard to disagree with someone who is hiding under ones desk and will not converse.
BTW, I consider it an island, some have suggested otherwise…i had no way of knowing your view on this.
I shall think pure thoughts against the day that you might grace me anew.
I suppose whatever you say about Tony Heller goes for Paul Homewood, and anyone else who has the gall to tell the truth?
https://notalotofpeopleknowthat.wordpress.com/2014/09/01/temperature-adjustments-in-greenland/
He-ee-eeyy..wait a second!
Are you mad at me because of this comment?
http://wattsupwiththat.com/2015/09/23/when-messaging-collides-with-science-the-hottest-year-ever-inside-a-global-warming-pause/#comment-2033421
I am so solly, I just could not lesist.
@Menicholas, there is farming on Greenland today.
Brandon,
Your generous “parting gift” still has the tag on it and it was cheap!
Many dictionaries,(and Wiki) recognize that the word does not only apply to the noble 7, but is used for other impressive chunks of land, also.
Please forgive me if I misread, as picayune, punctilious and pedantic, a sincere wish on your part to spread the light of knowledge through the darkness of the blogging world.
Brandon,
Greenland didn’t warm that much since 1930/1940.
See: http://www.dmi.dk/klima/klimaet-frem-til-i-dag/groenland/
In the graps you can also see that Kobnhavn and Torshavn shows no significant warming since 1990.
Aran, are you intending to argue that there is farming on the same scale, and with the same or similar crops as during the time of the self sufficient Norse settlements that do so hundreds of years ago?
Or is enough to clarify my earlier remark to say that in particular, they were farming barley, among other crops, and did so without the benefit of modern agricultural methods, seeds, machinery, or greenhouses?
Or 400 PPM of CO2 to speed crop growth!
@Menicholas I am not arguing any such thing. I was replying to your statement that Greenland is “far too cold to farm today”. Which is false.
I am glad have already weakened your earlier claim to it being too cold for farming on the same scale as during the MWP.
To be honest I don’t know on which scale there was farming back then. I even don’t know much about the scale now. I do know that global population underwent some hockey stick like increase since then. But maybe you can tell me a bit more. What scales are we talking about during the MWP? How many people were living in the Viking settlements? I am honestly curious.
I confess I truncated my first remark to the point of it being incorrect.
From ruins of stone buildings that are still there, we might infer it was more than a family or two.
My recollection from when I studied this is that there were several self sufficient villages, and they survived for hundreds of years.
Accounts vary, but it is fairly well established that several thousand people lived there, perhaps as many as 4500-5500 souls. They had their own Bishop.
Archeologists have uncovered the remains of several hundred separate farms.
Barley was grown as far north as the 70th parallel.
Export included rope, cattle hides, and various native animal products, like polar bears and such.
They may have met with an unpleasant fate in the end, as they are said to have disappeared without a trace rather suddenly.
Other accounts have them gradually moving to Scandinavian countries, as the Black Death had left many villages empty, and good land available for the taking.
John Bills
I can’t read whatever language that site is in, so I have no way of knowing what that link is saying or showing. I feel I’d be better off looking at actual data than images on a site I can’t read.
That said, the last point in the image Anthony Watts posted corresponds to 1855, not 1930/1940, so I’m not sure how relevant your claim would be anyway.
Aran,
“Farming” today in Greenland is in greenhouses. During the Medieval Warm Period, it was in open fields which now are still under permafrost. So what is your point?
There are no dairies in Greenland today. In the most favored spots, a few dozen sheep have been introduced.
Clearly, it was still much, much warmer in Greenland during its Norse period than now.
Aran September 23, 2015 at 6:30 pm
@Menicholas, there is farming on Greenland today.
Not disputing but ah what?
In green houses?
I have done gardening in Oregon (I’m now in AZ) Do they export what is the energy cost.
You can grow at ether pole but the cost,
please reply
michael
Brandon Shollenberger
September 23, 2015 at 5:47 pm
Fine, don’t communicate with us heretics who can show for a fact that the so-called “surface” temperature is an artifact so manipulated that its own mother would be disgusted by it.
@Lady Gaiagaia and Mike
Farming in Greenland is definitely not strictly limited to greenhouses, although they obviously use them if it helps to grow food more efficiently. Furthermore Lady G. your statement about “a few dozen” sheep is false. At least if I may believe wikipedia which claims e.g.: “Some 20,000 lambs are slaughtered annually in Narsaq by the state-owned Neqi A/S” with a link to data from the Greenland government.
As for what my point was, I have already mentioned that in an earlier post at 7.05 pm.
@Menicholas
Thank you for that information. I have actually learned some things today and that always makes me happy. Just to check, those ca. 5000 people, is that one settlement or the whole of Greenland? From what google told me your barley argument is valid and an interesting one. It has been grown there recently, but only as a small scale experiment. I am willing to believe Greenland may have been warmer during the MWP. That’s where the main error in Mann’s statement is in my view. The use of the word substantially is really wrong. There is no way he can know with that amount of certainty. The error margins have to be way too big for that. All the data I have seen so far suggests that we are at the very least getting close to the MWP maximum, but whether we are above or below and by how much I don’t think anyone can say “substantially”. And, in my humble opinion, what does it matter anyway?
Yes, they cultivate potatoes in Greenland; under polythene sheeting. Almost 100 tons.
Potatoes need 85 or more frost-free days. Greenland expects around 70, with summer frosts more likely in the south, due to the setting sun.
Grass grows there, too, without the poly, so they can cut hay for sheep.
Call it farming, if you want. At greenlandtoday.com they proudly proclaim the success of banana trees grown indoors.
Aran,
I refer to free range sheep. You can pen up and feed on seaweed larger numbers.
The incontrovertible fact is that the old Norse farmsteads are still under permafrost.
They have very long days in summer. But rather low sun angle. Still, that poly is something, alright.
I used to have a plant nursery, built it myself. 80,000 square feet under shade. Covered it with poly in the fall and winter…incredible how fast it heats up in there.
I also used mostly geothermal to keep from getting frozen out on cold nights…groundwater in central Florid is 72 F year round…chilly on a summer day…steaming during a radiational cooling event.
Where are the “sheep farms”?
Narsaq is in the extreme SE of the southern tip of Greenland, not where the main Norse dairy farms were, much farther to the NW.
Uniquely in Greenland, farming is possible on the plains to the north of Narsaq, with “actively maintained” arable fields. Of the 53 registered sheep farms in Greenland, 31 are located in the Narsaq area. The farms produce meat for domestic consumption, and the local slaughterhouse, a subsidiary of the nationally subsidized system, is the only such facility in the country.
The secondary “sheep farming” area of Tasiusaq is located in former Norse area. It of course relies on modern technology to keep the animals alive.
To compare this pathetic system with the vast Norse dairy farms is ludicrous.
Lady G.,
You seem to know things I don’t know yet. Please tell me more. Where were these vast Norse sheep farms? How big were they? Where did you get your information from? I’m eager to learn more.
Aran,
As for the question of total number, or each village…I would not want to say for sure, since I am not even certain that anyone can put an exact number on how many may have lived there at the peak, but my recollection is that this was the total population. I think the bulk of the habitation was more towards the East.
Recall that back then, and even more recently, if people could not produce grog, the would pull up stakes. Nowadays they can have it shipped in.
But I would venture to guess if a bunch of Vikings and their womenfolk had a crop failure and could not make any beer or mead for the long cold and dark winter, they would have cleared outta that place faster than a Irish Pub what done run out of Guinness.
Aran,
Clearly, I do know a lot more than you. The Norse weren’t sheepmen. They were cattlemen. That’s right. They didn’t just have sheep farms but dairy farms. That is, with cattle. Which as you might know but perhaps don’t, require a lot more forage and hay to be put up for the winter.
I’m really surprised that you don’t know about the huge Norse dairy farms. Their barns, homesteads and churches are still there. Important books have been written about them.
Why do you feel competent to comment on Medieval Greenland, when you are so ignorant of the most basic facts about that world?
http://archive.archaeology.org/online/features/greenland/
http://www1.american.edu/ted/ICE/norse.html
Whatever else he might have gotten wrong, Jared Diamond was right on about the vast cow barns of the Norse.
Sorry, but to compare the productivity of Greenland today with during the Medieval Warm Period is ludicrous.
Hey Mebbe,
I recall too, that back in grade school being taught that some considered Australia an Island.
But there are other interesting examples, besides Greenland…such as India, sometimes referred to as “The Subcontinent” (re Ray Charles in The Blues Brothers).
Prior to running smack into Asia and raising up the Himalayas, India was all by it’s lonesome out there in the Indian Ocean, after it had split off from Antarctica (Or was it Africa? Or was it Gondwanaland? Australia? [It touched all three, but which one last? Lets just call it a subcontinent which is a continent, and it was anywhere but Laurasia. Where it is now. But it is not called that. Why not? uhu uh*shoulder shrug*])
And then there is that dang Madagascar! Doh!
As a geographer since I can remember, I have globes and armillary spheres all over my house and yards, with a plan in the works to make a huge armillary/sundial sculpture out back. I have entire rooms wallpapered with maps.
None of these are real popular decorating choices…with anyone but me that is 🙂
Without globes, you cannot really understand the Earth. Flat maps just do not cut it.
My favorite is this little tiny magnetic levitating dealio, with the globe sitting in the middle of a u-shaped lamp, hanging between some magnetic forces that keep it stuck in midair. If you are careful, you can make it spin slowly.
Very Cool.
http://www.amazon.com/Shape-Magnetic-Levitation-Floating-Inches/dp/B00NF4TTTG/ref=sr_1_4?ie=UTF8&qid=1443072096&sr=8-4&keywords=levitating+globes
I have just been told that splicing current temperature records onto a proxy is not a legitimate technique that would be used by honest or competent scientists
==================
pretty much says it all. now ask the question. has any climate scientist done this? hint: did the IPCC publish just such a graph on the front page of their report? And who were the authors?
http://wattsupwiththat.files.wordpress.com/2013/08/hockey_stick_chart_ipcc_large1.png
Oooooh. I think that was a slapshot!
https://youtu.be/RJnKTtS9t3g
Brandon,
right hand upper corner it says “In English” :-0
ferdberple:
The answer to the second question is: No. There are no spliced temperatures in that graph. I know Mark Steyn says otherwise in his book, and apparently some people seem to think the same thing as he does, but… no. There are no temperatures spliced onto a proxy* displayed in that graph.
And yes, I know what Michael Mann’s “trick” was. It was not just to splice temperatures onto a graph. So please, don’t just come back and say it was. If you’re going to talk about his “trick,” please know what his “trick” actually was.
*That’s even ignoring the fact that reconstruction is not a single proxy, but rather, a reconstruction made up of over a hundred different proxies.
I’ve read that the ice cores measure a well-mixed (globally) ratio of one oxygen isotope to another, and that therefore they are a good proxy for global temperatures.
The so called hockey stick used a single tree to cover the entire planet for a 400 year period.
So obviously it must be a valid technique.
Greenland ice cores are a good proxy for most of the N. Atlantic. That’s a non-trivial section of the globe.
There are other proxies, that have been shown here, as well as other places that cover most of the rest of the globe, and they show pretty much the same thing.
It must really hurt trying to defend a disproven theory.
Lady Gaiagaia September 23, 2015 at 9:23 pm
Aran,
I refer to free range sheep. You can pen up and feed on seaweed larger numbers.
Like these at Ipiutaq:
http://images.huffingtonpost.com/2014-09-15-DSC08104.JPG
Here’s a shot of a sheep roundup at Qassiarsuk:
http://cache3.asset-cache.net/gc/110055941-round-up-of-sheep-at-qassiarsuk-greenland-gettyimages.jpg?v=1&c=IWSAsset&k=2&d=1PtC92%2BH5o94AnKNy7qqtuJlHWwwYE0XgvbdJ4b6aplitFhgfqAEt1L0joubKn5A
I don’t know how much Greenland has warmed since 1975. Here is what I’ve found.
http://beta.dmi.dk/uploads/tx_dmidatastore/webservice/b/m/s/d/e/accumulatedsmb.png
“As a matter of policy, I try not to have discussions with people claiming the surfact temperature record has been fraudulently adjusted. I find it’s a waste of time, and I think it’s disgusting people make these accusation,”
Considering a cursory glance at the facts is going to ensure you lose that discussion every time, that’s probably a wise policy. We had record ice coverage in the Great Lakes last year, NCDC said the year was about average. When you have to repeal basic physics to support your argument, it’s no wonder you’re disgusted.
Here is Michael Mann and what he said in 2002. What has changed since he wrote this?
Lady G.
You might claim to know more than me, but you should not attack me on things I did not say.
You say
If you read back you will see that all of this started with me pointing out that there is farming in Greenland today. Which I am sure you will agree upon, as did Menicholas who adjusted his previous statement that it was far too cold for farming there today. After that, others, including you started making the comparison to medieval Greenland, which I will happily admit I know next to nothing about. I actually said that in an earlier post as well. If you read back you will see that I have asked questions about it, because I don’t know. I really don’t understand where you get the idea that I “feel competent to comment on Medieval Greenland”. Especially since I already said in an earlier post:
So to summarise, in answer to your question why I feel competent to comment on Medieval Greenland, I say: I don’t.
Also you have twice made references to “ludicrous” comparisons:
I really don’t understand why you feel the need to mention this to me twice so strongly, since I never made this comparison. Again, I pointed out that there is farming today, as a factual response to false claim and now I am being sucked into this whole thing where I am accused of making ludicrous comparisons and commenting without knowledge on Medieval Greenland.
Sheep in Greenland. Yep. They make warm coats outta that wool, no surprise. But what about dairy cows? I have just read this from the following website.
So I decided to look into the scientific bases for the claim (ignoring the excavations!)
Still not satisfied I kept looking.
Now here is what Michael Mann said in his paper of 2002.
There were more cows back in the day. It was warmer in the settlements.
Getting back closer to what was the original exchange in this subthread, i note that Brandon has made several statements of a declarative nature that include no details and no attribution…they are merely soe sort of ” I know the truth, and will not talk to you unless you know it too, so go find out the truth and then I will discuss it”…or some such drivel.
What it comes down to is he is presenting arguments and statements in a way that he would himself be completely unwilling to accept if they were made by anyone else.
Also, statements lie this one:
“As a matter of policy, I try not to have discussions with people claiming the surfact temperature record has been fraudulently adjusted. I find it’s a waste of time, and I think it’s disgusting people make these accusation…”
simply have no place in a discussion of this nature.
If you are not willing to state why you have complete faith in every adjustment ever made in every location, and that you know for sure that the individuals doing the adjusting are so completely beyond reproach, and are willing to personally and by name vouch for their integrity and honesty, then it is nothing but some sort of whiney attempt to deflect the conversation, and is thus completely disingenuous, to put it charitably.
And even if one was willing to so vouch for the record and those who are massively adjusting it, there is still the question of what exactly the justifications are. But by impugning the reputation and integrity of those individuals who have brought this obvious chicanery to our attention, Mr. Shollenberger has sought to preempt any examination of the issue at all.
Now, for someone who is engaged in an effort to convince everyone that he is the most fair minded, knowledgeable and virtuous commenter on the board, his refusal to allow for even the possibility of any sort of inappropriate adjusting of the historical temperature data is rather striking, considering he fully acknowledges that people of the stature and standing (within the “climate science” in-crowd, anyway) of Mike Mann can and have been engaging in willful fraud and inappropriate data manipulation.
So we are to believe, sheerly by dint of the outraged protestations of Mr. Shollenberger, that no one else would or did ever do likewise?
That the adjustments and all the amazing coincidences, associated with them, are pristinely perfect and untainted by any chance or hint of imperfection?
That we can just be sure, because Brandon Shollenberger say he is appalled if we are not, that none of the rest of the alarmist warmista throng… who BTW would be out of work if the house of cards they have erected ever collapses, and they know it better than anyone…that none of them could ever be accused of conducting themselves in a similarly impure professional manner?
In other words, by this statement, Brandon Shollenberger is assuring the world that every one of the temperature adjustments is justified and completely accurate, and every other single person in the position of maintaining these records is completely beyond reproach.
And he is disgusted that anyone should suggest otherwise.
Note the caption, it is to the year 2000, the scale is not indicating an endpoint at 95. Note also that the data and graph is from Richard B. Alley, of Penn State, a colleague of Mann.
ABSTRACT:
Greenland ice-core records provide an exceptionally clear picture of many aspects of abrupt climate changes, and particularly of those associated with the Younger Dryas event, as reviewed here. Well-preserved annual layers can be counted confidently, with only ~1% errors for the age of the end of the Younger Dryas ~11,500 years before present. Ice-flow corrections allow reconstruction of snow accumulation rates over tens of thousands of years with little additional uncertainty. Glaciochemical and particulate data record atmospheric-loading changes with little uncertainty introduced by changes in snow accumulation. Confident paleothermometry is provided by site-specific calibrations using ice-isotopic ratios, borehole temperatures, and gas-isotopic ratios. Near-simultaneous changes in ice-core paleoclimatic indicators of local, regional, and more-widespread climate conditions demonstrate that much of the Earth experienced abrupt climate changes synchronous with Greenland within thirty years or less. Post-Younger Dryas changes have not duplicated the size, extent and rapidity of these paleoclimatic changes.
Anthony Watts, do you really feel it necessary to tell a person a graph “is to the year 2000, the scale is not indicating an endpoint at 95” when the person said:
It seems pretty clear when a person is talking about temperatures of 1905/1855, they know the graph isn’t talking about temperatures of 95 AD.
Personally, I doubt what you say is even true. The standard practice in dating many things is to use the time scale Before Present, which scales everything to January 1, 1950. Aran seems to be aware of this, hence his comment indicating the date for that last measurement “would either be 1905 or 1855 depending on who you believe.” The paper your data is taken from even refers to this time scale, saying the ice core’s dating is in reference to “before present.”
No matter what the exact endpoint of the graph is, it can’t say too much about temperatures today. The GISP2 cores were drilled in the early nineties, so 20 years ago. Add to that the time it takes for snow to be compressed to ice to make it suitable for isotope measurements and you know you’re well into the past. 1905 is possible, 1855 more likely imho. As said, either way it will be irrelevant to the topic of discussion.
“Note the caption, it is to the year 2000”
The caption is not from Allen but from Don Easterbrook.
Hereis Willis setting it right back in 2009. Here is JustThe Facts hashing it out in 2013.
The update shows instrumental data attached to the end of GISP data, trying to show that the MWP was still warmer globally. But even setting aside that Greenland is not typical of the globe, it certainly doesn’t represent the global average, which is far less variable than any one site. I don’t think anyone believes that the global temp was 3°C warmer in Roman times than now, as the GISP data shows it.
“As said, either way it will be irrelevant to the topic of discussion.”
Unless some one knows how to, oh…I don’t know…ADD!?
“I don’t think anyone believes that the global temp was 3°C warmer in Roman times than now, as the GISP data shows it.” ?oh=d7cc31a84b398945d55d3ecaf6efca8c&oe=5693BCD8
This is your bias showing, Mr. Stokes.
I do not think anyone who wants to believe the world is hotter than ever want to believe this, as if it were true, it would completely destroy the idea that a world 2 degrees warmer will be a catastrophe for anyone.
As evidence that this may well have ben the case, recall the well known historical example of Hannibal marching an army, consisting of elephants and other animals and a huge number of men in full battle dress, with supply lines one might presume, marched them all right over the ALPS!
Through a place which is completely impassable in recent times, except by a expert mountaineer with specialized equipment.
Since you are polite, I will only smirk at you 😉
Aran,
Which graph are you referencing?
The GISP2 graph in Anthony’s post.
Aran is absolutely right. The Allen GISP data, as has been pointed out endlessly at WUWT, ends in 1855. Here is none other than AW at WUWT in 2009:
“The ice core data from Greenland doesn’t go past the year 1900”
But BP means before 1950.
Thanks Nick for that reminder, but even with Mann’s instrumental record splice it still doesn’t matter, the MWP (around year 1000) is still warmer:

“Except, there’s that pesky ice core proxy temperature data (proxy temperature data is something Mann embraces for his own Hockey Stick) that says otherwise.”
Also the sea level proxies, that is a close match to and supports the Lamb Graph.
Also in that article the data you present only goes up to early 20th century, as can be seen by the first graph from your series:
http://wattsupwiththat.files.wordpress.com/2009/12/wuwt_icecoreanim_image11.png?w=720
Aran says:
The graph shown is not a refutation of Mann’s words… it is not valid as an argument in a discussion about temperatures today.
Would this be a valid argument about temperatures today?
http://oi43.tinypic.com/1zoanbc.jpg
Just prior to our present Holocene, global T fluctuated by TENS of degrees — in less than a decade! That was before any human CO2 emissions except from breathing or fires. But we’ve never seen anything like that recently.
At that time CO2 was under 300 ppm. The climate alarmist argument is that a rise in CO2 will cause runaway global warming.
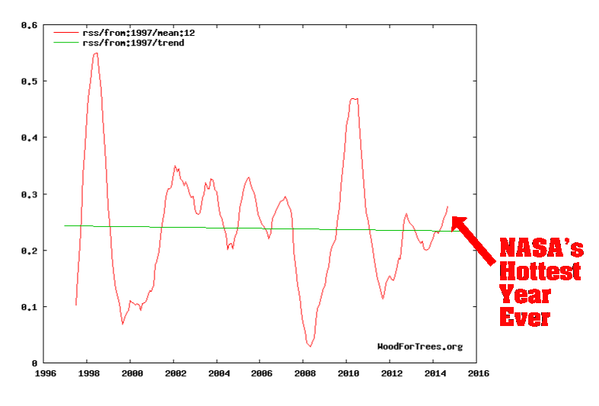
But despite a steady rise in CO2, global T has been flat for many years. There has been no ‘runaway’ global warming. In fact, there has been no global warming at all for a long time now:
http://realclimatescience.com/wp-content/uploads/2015/06/ScreenHunter_9549-Jun.-17-21.12.gif
When you look at the real world situation versus the alarmist crowd’s predictions, what do you think? Do you consider the possibility that their basic premise was wrong? If not, how do you rationalize it?
I have read your post a couple of times and I am still not sure what your argument in the first part is about. The topic was the comparison of the MWP climate with the current climate. The fact that there has been a big change thousands of years earlier, unrelated to human CO2 emissions does not seem very relevant in that discussion. And I also don’t see what your point in general might be. If it wasn’t related to CO2 in the past it can’t be related to CO2 now? I think you’re too smart to make such a claim.
From your second part you seem to focus solely on satellite measurements over the last 15-20 years. I remember from one of your earlier posts that you like to look at the big picture. Accusing people you called “the alarmist contingent” of “confirmation bias cherry-picking”. So let’s expand our view, shall we? Over the last couple of decades we have measured that ice mass at the poles is decreasing and the decrease is accelerating. We have measured that glaciers are also retreating and that this retreat is accelerating. We have measured that the oceans are warming and that sea levels are rising. Land based temperature measurements have also shown an increase with no significant pause by any standard. Satellite measurements of the lower troposphere have been stable.
So, ice is melting, with with increasing speed. Oceans are warming and rising. Surface temperatures are rising and the lower troposphere is stable. It seems to me like overall the earth is still collecting heat. As far as I can see the data do not agree with your statement that global warming has stopped. Your focus on one type of measurement for a limited time span might even be considered “confirmation bias cherry picking” by some people. But don’t worry. I’m not that kind of person.
Ice is not melting with increasing speed. Quite the contrary. Oceans are not warming and are rising at less than the average rate of the past 300 years.
It appears to me that you have nothing, nothing at all, to support the false on its face hypothesis that humans have anything to do with actually observed “climate change” of the past century or 70 years since the end of WWII, after which CO2 increased rapidly.
Please explain how in your universe the earth could have cooled, as it did, from c. 1945 to 1977, while CO2 was rising, then warmed slightly for the next 20 years, as it still grew, then stayed flat to cooled again for the next 19 years and counting, if CO2 is the “control knob” on climate.
I thin the point Aran, is that there is no indication anywhere in the historical records or in Earth history reconstructions, or in any of the ice core data, showing that CO2 controls temperature.
All evidence in the very long term is that they are uncorrelated.
The more recent ice core data shows a correlation, but it is the opposite of what was represented to me true by Al Gore and others. Specifically, CO2 lagged changes in temp. Such that when temps reached a peak and reversed and went down, CO2 was high and getting higher. So temps ignored CO2.
And when temps were at a trough and reversed and began to move higher, CO2 was low and moving lower.
So temps ignored CO2.
And then we have the last twenty years, in which temps have ignored CO2.
And then we have the 1950 to 1978 period, in which temps were going down while CO2 was ramping up.
So temps ignored CO2.
And then there were the prior periods, in which temps rose and fell while CO2 was not really doing much, including the 1930s and 1940s, in which the world got very how, and the Arctic melted on a scale similar to the first decade of this millennium.
So temps ignored CO2.
In fact, there was only one brief period in which both CO2 and temps really did much rising in concert with each other…the very brief 1980 to 1998 period.
And Arno Arrak has amply shown us that this was more of a pause with a step change, related to ENSO events and disguised by some large volcanic eruptions.
Why the hell should anyone have any reason to believe CO2 is the temperature control knob of the atmosphere?
Where is the evidence?
There is a lot of looking, and a lot of people ignoring reality and their lying eyes to push the meme.
But where, exactly where, is the real world evidence?
I mean, you either accept the premise of evidence based science, or you are a man of faith.
Which is not science.
Arghh, sorry about all the typos…again! Dang old laptop, bad keyboard, itchy enter finger.
Lady G,
To try to avoid a yes/no discussion, let’s look at the data. As for ice the measurements by NASA show a very clear picture
http://www.giss.nasa.gov/research/briefs/hansen_15/fig2.gif
Or, if you are one of those people that doesn’t trust NASA, there are many other studies showing the same outcome. For instance this one which was actually brought to my attention by Sturgis Hooper on this very blog.
As for ocean warming I can refer to the ARGO floats, which clearly show the warming, as shown here by none other than Lord Monckton:
http://wattsupwiththat.files.wordpress.com/2015/08/clip_image024_thumb.jpg?w=605&h=430
As far as can see the data do not support your claims.
Lady G,
You seem to make a habit of attacking me on statements I did not make. I was arguing that the earth has gathered heat over the past 20 years. Something that was denied by dbstealey.
But in this case I am happy to go along with your diversion of topic.
Your second paragraph seems to be build on debunking the hypothesis that temperatures should immediately and closely follow CO2. This is something that no one in their right minds would claim imho. I certainly wouldn’t. Neither would I claim that CO2 is “the control knob” for climate. That would be a gross simplification of what is a complex coupled and chaotic system. Or in simple terms, assuming temperatures should be in exact step with CO2 is madness. You seem to use arguments based on of short term fluctuations (which I would think are very much expected in complex coupled systems). I am happy to agree with you that these fluctuations have happened. Precisely because CO2 is not “the control knob”, but rather one of the many knobs. Now that we have established that there are short-term variations, and that these are what is to be reasonably expected, can we also agree that these have come on top of a longer term warming trend? If so, what, if not CO2 could have caused this warming trend in your opinion?
Menicholas,
I am going to be a bit shorter, otherwise I will have Richard accusing me of wasting space again.
The argument that temperature has not followed CO2 in the past does not negate the possibility of it doing so now. If I am on trial for murder, I cannot use previous murders I did not commit in my defense.
As for the “control knob” argument, I refer to my second answer to Lady Gg.
Aran,
To your credit you’re not like some of the other alarmist commenters here, trying to argue by assertion, appeals to authority, belief, “what if…” arguments, and other non-data. So maybe there’s hope.
But I can see that you’ve been given lots of misinformation, so let’s correct some of it. You say:
Over the last couple of decades we have measured that ice mass at the poles is decreasing and the decrease is accelerating.
The reason “ice” is such an emotional topic with the alarmist crowd is because it is about the only prediction they got half right. Every other alarming prediction has been flat wrong.
But half right is wrong, too. The Arctic has been ice free in the past. Arctic ice comes and goes. There is no evidence that the current fluctuation is anything other than part of a completely natural cycle. And the Arctic ice decline is not accelerating.
The climate alarmists always mention the Arctic, but rarely the Antarctic. That’s because the Antarctic has been steadily gaining ice. Global ice is about at its long term average, so that scare is nonsense. If human CO2 emissions were the cause, global ice would be declining. It’s not. But soot and other particulates could be contributing factors. Complain to China about that. Next:
We have measured that glaciers are also retreating and that this retreat is accelerating.
Wrong, and wrong. Some glaciers are retreating, some are growing. The planet has more than 160,000 glaciers. You’ve been told only about the ones that are retreating. And asserting that the retreat is “accelerating” is just more misinformation. Next:
We have measured that the oceans are warming and that sea levels are rising.
Been happening since the Little Ice Age, and the last great stadial before that. So there’s no evidence that human emissions are the reason. (You forgot the narrative that sea level rise is “accelerating”. Just so you know, it’s not.) Next:
Land based temperature measurements have also shown an increase with no significant pause by any standard.
Look at the ‘Surface Stations’ link on this site. More than half the temperature stations are off by 2º – 5º and more. Since the ‘dangerous man-made global warming’ scare is based on a global rise of only about 0.7ºC, you’re better off ignoring land based ‘data’, which has also been hopelessly corrupted. Next:
Satellite measurements of the lower troposphere have been stable.
Correct. For almost twenty years! Satellite data is the most accurate by far. It is corroborated by thousands of radiosonde balloon measurements. So naturally, the alarmist crowd hates satellite data. Do you want the truth? If so, global satellite temperature measurements are the best available. Next:
As far as I can see the data do not agree with your statement that global warming has stopped.
Global warming has stopped. It may resume, or stay in stasis, or the planet may start to cool. But even the UN/IPCC admits to the “pause” (their word for ‘global warming has stopped’). Feel free to argue with them if you like. Next:
Your focus on one type of measurement for a limited time span might even be considered “confirmation bias cherry picking” by some people. But don’t worry. I’m not that kind of person.
Then why mention it? What you are doing is projecting your own faults onto others. Satellite measurements are the best available. What do you propose? To average corrupted ‘data’ with good data? Why would anyone do that?
To answer your other question, my first chart above was posted to show that global temperatures always fluctuate, and they’ve varied more in the past than since the industrial revolution. And you commented on past global temperature fluctuations:
If global temperature… …wasn’t related to CO2 in the past it can’t be related to CO2 now?
Ever hear of Occam’s Razor? The simplest explanation is almost always the correct explanation. Adding an extraneous new variable like CO2 to your explanation just convolutes things. Now, if you could produce a measurement of AGW I would sit up straight and pay attention. But there are no such measurements. Blaming human-emitted CO2 for silly things like Arctic ice fluctuations is just arguing by assertion. On this “Best Science” site, you lose by arguing that way.
In science, data is everything, and measurements are data. But no one can produce any such data quantifying AGW. I personally think AGW exists, but it must be so tiny that it’s down in the noise. AGW is just too minuscule to measure, so it’s a non-problem.
Aran
September 24, 2015 at 3:55 pm
Then the climate models are not in their right mind, since temperature rising steadily with CO2 is just what the GCMs show.
Don’t you think that there should be a better fit for a CO2-temperature relationship than this: 32 years of cooling, then 20 years of warming, then 18 years of flat to falling T?
If indeed the world has been storing up heat, then the current El Nino will release it to the atmosphere, thence out to space.
Alarmism fails utterly as science because it fails to reject the null hypothesis. There is no evidence whatsoever that what has happened since 1945 is anything out of the ordinary. Whatever warming has occurred (during the 1977-96 interval, with none before or after), is well within normal, natural limits. Indeed the post-war period has lasted less time and warmed much less than occurred during the early 18th century, when the world was coming out of the Maunder Minimum.
Hence, there is nothing about which to worry. So far increased CO2 has been a boon to the planet. If over the next 165 years another degree F of warming happens, as has possibly been the case since 1850, that too would be a good thing. So would two degrees F and even two degrees C, although that’s highly unlikely.
Aran,
One thing in common with all alarmists is their penchant for always asking questions but never answering questions. The reason is simple: some uncomfortable truths would be exposed.
You posted a graph showing ice loss is accelerating. I grew up by the shores of Lake Erie, and it was extremely rare to see it frozen all the way to Canada. That happened a couple of times during the global cooling when TIME and other magazines were pushing that scare. But the lake hasn’t frozen over completely in any recent decade.
This past winter almost all the Great Lakes froze over completely. But NASA says ice loss is accelerating. Here is a much more unbiased source:
http://www.climate4you.com/images/IRAC%20JAXA%20ArcticSeaIceExtentSince20020601.gif
You can see that Arctic ice loss is not “accelerating”. It has been in a small but steady decline for a long time.
This next chart shows Arctic, Antarctic, and global ice cover:
http://www.climate4you.com/images/NSIDC%20NHandSHandTOTALiceExtension12monthRunningAverage.gif
We see that currently (as of last month) global ice is above its long-term average. That is another fact which added to all the other evidence, demolishes the assertion that the ‘pause’ never happened.
Here is a chart of the past 15 years, measuring global ice:
http://www.climate4you.com/images/NSIDC%20GlobalSeaIceAreaSince2000.gif
So, back to my question that you ignored:
“When you look at the real world situation versus the alarmist crowd’s predictions, what do you think? Do you consider the possibility that their basic premise was wrong? If not, how do you rationalize it?”
I’ll add another:
Can anything convince you that you’ve been misinformed? Or is you belief such that no facts, no matter how contrary they are to the ‘dangerous man-made global warming’ narrative, can possibly convince you that AGW is a non-problem?
But if you can be convinced of that, then what would it take? Please don’t say ‘we have to wait X number of years’. That is just avoiding answering.
dbstealey,
If you are going to accuse me of using misinformation, at least use data or other sources to back your claims up. It is hard to discuss if someone’s response boil down to statement of the opposite.
So let’s put your claims to the test:
Regarding ice:
I’ve shown my data sources in an earlier post in response to Lady Gaiagaia. The measurements as far as I have found show a definite decline in both Greenland and in the Antarctic. What the basis for your statement “the Antarctic has been steadily gaining ice” is, I don’t know, but the data don’t agree. Maybe you are referring to the Antarctic sea ice extend, which is growing, but that would be ignoring one important spatial dimension.
So based on the data I would call your claims about Antarctic as well as global ice to be false.
Regarding glaciers:
The most comprehensive data set I know of is being maintained by the WGMS, the World Glacier Monitoring Service. From all the glaciers that have been monitored for long enough periods, the overall trend is definitely declining:
http://wgms.diff.ch/wp-content/uploads/2015/04/Mean-cumulative-mass-balance-of-all-reported-glaciers-blue-line-and-the-reference-glaciers-red-line.jpg
More specifically, only one shows significant growth, and its rate of growth is declining, Your assumption that I have only been told about the ones which are retreating is false. Your statement that some are retreating and some are growing I would call at the very least misleading, based on this data. Of course it is possible that the overall trend, which is declining and accelerating, is a chance result, but the probability of that would be small.
So based on the data I would call your statement that glaciers are not retreating implausible.
Regarding ocean warming:
I’m glad you agree. I did not forget the accelerating part. I know acceleration cannot be inferred from the measurements.
Regarding land temperature data:
The individual accuracies of the stations are not what matters. For two reasons, firstly we are concerned with trends rather than absolute values, secondly we are concerned with the accuracy of the aggregated outcome. You can measure to the same accuracy with a small number of highly accurate devices or a large number of not very accurate devices. If the stations have individual accuracies of 2-5 degrees you cannot simply extrapolate that to think that the overall result will have the same accuracy. I don’t like to ignore data except in extreme cases where there is a clear reason. Your arguments for ignoring these data are not convincing.
Regarding satellite data:
Your skeptical attitude towards land based data seems to somehow have completely disappeared when satellite data is concerned. These are not simple measurements, they are not direct measurements and they have undergone similar adjustments as the land data, which you consider “hopelessly corrupted”. Also it is not a question of one or the other. They don’t measure the same thing, so the results are not necessarily contradictory.
Regarding the UN/IPCC use of the word ‘pause’:
I do disagree with them on the basis that there is no solid statistical evidence for a pause.
Regarding past temperatures and Occam’s razor:
Many of the past fluctuations of temperature can be explained by for instance solar fluctuations or other effects, for the recent changes in temperature I have not seen any such claim. Furthermore CO2 is not an “extraneous new variable” it has properties known to affect climate. Serious skeptics such as Watts, Monckton, Spencer etc. all acknowledge this and question the strength of its effect, not whether or not the effect exists.
Regarding data being everything:
I completely agree. Which is why I am puzzled by you ignoring data that doesn’t suit your claims and embracing the data that does without acknowledging its limitations.
On any of these, feel free to show me wrong, supported on factual information. I am always eager to learn.
dbstealey,
All the graphs you posted show only the extent of sea ice, not the volume or mass. It is very possible for sea ice extent to be stable or increasing, whilst the total amount of ice is decreasing.
Regards to your question about “the Alarmist crowd” or whatever you call them. I do not hold climate models responsible for short term fluctuations since they were never intended to predict them. They have serious issues and I am very doubtful of how well they are able to predict what is going to happen. I take their results as ballpark possibilities, which they are, hence the large error margins. I am also aware that the results have recently not been very consistent with observations. I think it is very well possible that they overestimated the influence of CO2, since they were mostly developed during a period of strong temperature rise. I have however so far not seen any model that has done better using alternative explanations, so I do consider them the best we have, knowing that they still leave a lot to be desired. I don’t think rejecting their premise is a good idea. If by their premise you mean the basic idea that CO2 can influence temperature. If we were to take CO2 out all together we would be much further removed from the actual observations.
That kind of answers your second question as well. I would be easily convinced if an alternative explanation were available that could show quantitatively how these changes can be explained without or with significantly reduced CO2. That’s how science progresses. By improving on current understanding. Claiming CO2 has no or hardly any influence would only decrease our understanding. Basically all they have to do is do better than the current climate models, and from what I understand reading this website, that should not be a hard task.
DBS,
Let me then also take this opportunity to ask you the same question. What would it take to convince you that you have been misinformed? That people have shown graphs of sea ice extent trying to make it look like the amount of ice was increasing whereas it is only the surface area that is increasing. There is a lot of misinformation out there. On both sides. At the very least I would like to ask you to be equally critical to the people that tell you global warming is a hoax as you have been to people like me. Critical thinking is good. We desperately need it if we want to make progress. People that argue against global warming based on fallacies or false information are just as harmful as the most rampant religious alarmists
Aran says:
Let me then also take this opportunity to ask you the same question.
Ah, always asking, never answering. The hallmark of the climate alarmist cult. When you answer my question I’ll answer yours. I asked first. Now you’re just deflecting, as usual. And your “critical thinking” comment is very amusing.
Your cult has grabbed onto a small, natural, cyclical decline in ice — at only one of the Poles — like a drowning man clings to a stick. The only arguments attempting to support it are baseless assertions, and appeals to corrupted authorities.
There is no verifiable connection between the recent dip in Arctic ice and human CO2 emissions. The alarm is based entirely on two things: assertions that there is a connection, and the coincidental natural Arctic ice cycle. That’s all.
Given the complete lack of supporting data, the best explanation for Aran and his True Believer cult was given by Dr. Michael Crichton:
Today, one of the most powerful religions in the Western World is environmentalism. Environmentalism seems to be the religion of choice for urban atheists. Why do I say it’s a religion? Well, just look at the beliefs. If you look carefully, you see that environmentalism is in fact a perfect 21st century remapping of traditional Judeo-Christian beliefs and myths.
There’s an initial Eden; a paradise, a state of grace and unity with nature, there’s a fall from grace into a state of pollution as a result of eating from the tree of knowledge, and as a result of our actions there is a judgment day coming for us all.
We are all energy sinners, doomed to die, unless we seek salvation, which is now called ‘sustainability’. Sustainability is salvation in the church of the environment. Just as organic food is its communion, that pesticide-free wafer that the right people with the right beliefs imbibe.
[source]
So keep dodging those questions, Aran. You don’t want to be an apostate. You’ll be shunned by the True Believer crowd.
Aran,
Sir those graphs end about 7 years ago, so what are you up to?
I am sure you cannot be trying to make a point in 2015 using data from 2008, can you?
i honestly want to give you the benefit of the doubt here…but am disappointed you use such a flimsy argument in your response to my CO2/tem post below.
“It never was before, but it might now”? Seriously? What sort of BS straw man was that about a murder?
Say what?
Are you unaware that the situation has reversed at both poles?
That the Arctic just had the shortest melt season on record?
That the Greenland Ice Sheet Balance is showing a tremendous increase in mass for the year, on the order of several hundred billion tons of new ice and snow, net accumulation? And that temps on the GIS are at frigidly low values for the time of year, indicating that another and perhaps more disastrously cold winter may be in store?
That Antarctica set a new all time record high for sea ice volume and extent as recently as this past April?
That average ice thickness and extent of multiyear ice in the Arctic is now approaching levels of the middle part of the first decade of the millennium, thus erasing in a few short years all of the precipitous declines that led to the many gloomy foretellings of an impending disaster of icelessness?
@dbstealey
WTF????? I answered your question. quite extensively imho. You did not answer mine though.
And what’s with all the ad hominems, accusing me of being part of a cult. You accuse me of a lack of supporting data???? That is ridiculous. My answers were based on data. I have given the sources and the links The only data you showed was of sea ice extent rather than volume, a fact I pointed out to you and you did not reply to. You have been making many claims without any sources or data to back it up. And you make false accusations about me.
I have based my claims of retreating ice on several data sources.
You have ignored them
I have based my claims of retreating glaciers on data
you have ignored them
You made an error in comparing station accuracy with overall accuracy. I have pointed this out.
you have not replied
You made an error confusing sea ice extent with total amount of ice. I have pointed this out.
you have not replied
Anyone reading back can clearly see. You are the one dodging. You are the one ignoring data. You are the one lacking data supporting your claims.
Menicholas, the relation between CO2 and temperature is a bit more complex than your posts suggest. It is not CO2 just lagging temperature. Sometimes it lags, sometimes it leads. Having had a quick glance at the literature it appears that other factors such as the sun can cause an initial rise in temperature, which releases CO2, which then causes more warming, etc. In this mechanism CO2 is both lagging and leading. Looking over such long times there are simply much more factors to take into account. Only looking at temperature and CO2 is too simplistic.
As for the reversal and other big changes in polar ice volume you claim, show me the data! I am really curious. Sounds like some quite spectacular changes.
Aran says:


All the graphs you posted show only the extent of sea ice, not the volume or mass.
You’re deflecting again. I’ve already addressed the volume question. The Antarctic has ≈10X the volume of ice that the Arctic has. Furthermore, sea ice is the only kind of ice in the Arctic, so that is the only legitimate comparison.
Next, Aran asks (always asking, never answering):
What the basis for your statement “the Antarctic has been steadily gaining ice”
If Aran is that clueless, maybe this will help:
Next, Aran makes a ridiculous comment about glaciers:
…only one shows significant growth
Total nonsense. The planet has more than 160,000 glaciers, but Aran believes that only one is growing. Don’t take off the dunce cap yet, Aran.
Some glaciers are advancing, some are retreating. The planet is still recovering from the (natural) LIA, so we would expect glaciers to be retreating. It has nothing to do with CO2 emissions.
Next, Aran insists that oceans are heating up. But assertions don’t cut it, they belong on alarmist blogs. Here, we use data:
Next, Aran tries to argue that land temperatures are accurate. They are not, and they ignore the 71% of the planet that is ocean. Once more for the rationally-challenged: satellite data is the best temperature data. It is the most accurate by far, and it is corroborrated by thousands of radiosonde balloon measurements over many decades. The only reason Aran wants to use land temps is because they feed his confirmation bias. But they are inaccurate. Satellite data is accurate. For reasonable people, that ends the discussion.
Next:
…there is no solid statistical evidence for a pause.
Religious faith does not need evidence. That’s why they call it ‘faith’. But for those who want evidence, there is a mountain of it.
Next, Aran says:
…CO2 is not an “extraneous new variable” it has properties known to affect climate. Serious skeptics such as Watts, Monckton, Spencer etc. all acknowledge this and question the strength of its effect, not whether or not the effect exists.
I also think that CO2 has an effect. I have never stated otherwise. But the effect is so minuscule at current concentrations that it can be completely ignored. It is too tiny to matter:
Finally, Aran says:
…feel free to show me wrong, supported on factual information. I am always eager to learn.
You are not eager to learn. You have a religious faith in ‘dangerous man-made global warming’, and no matter how many facts and references I provide, your faith overcomes all of it. Your mind is closed to any facts that contradict your eco-religion.
I’ve provided plenty of “factual information” that totally demolishes your arguments, which are anyway mostly baseless assertions. But for True Believers, baseless assertions are enough. Contrary facts just get in the way of your belief.
dbstealey September 24, 2015 at 5:06 pm
This next chart shows Arctic, Antarctic, and global ice cover.
http://www.climate4you.com/images/NSIDC%20NHandSHandTOTALiceExtension12monthRunningAverage.gif
We see that currently (as of last month) global ice is above its long-term average.
It would be useful if when you copy and paste graphs from other sources, you also pasted the legend since you frequently do not understand what you are linking to.
In this case you refer to the 12 month average of global coverage and compare it with the 35 year average and claim that this means that “currently global ice is above its long-term average”, despite the fact that the other graph you link from the same source shows that currently the global monthly average is below the longterm average, and far below the average for the time of year!
“Phil.”, AKA: Pee Wee, the link I posted is from a site that belongs to someone who has forgotten more than you will ever learn about this subject.
Next, we have “Lewis Buckingham”, AKA: Gordon Ford, Martin Clark, Edward Richardson, David Socrates, Joel Jackson, and about twenty other know-nothing fake names or names stolen from others, complaining that I’m comparing sea ice from both poles.
But the identity thief doesn’t understand that sea ice is the only thing that can be compared, since the Arctic has only sea ice, no land ice. Duh.
Members of the alarmist cult have some things in common: they’re just not very smart, and some aren’t very honest. Fake names are a way to get around being repeatedly banned.
“As for the reversal and other big changes in polar ice volume you claim, show me the data! I am really curious. Sounds like some quite spectacular changes.”
Trust me.
Just trust me.
If you cannot, I will tell you when I think you are ready to know.
dbstealey September 25, 2015 at 8:14 am
“Phil.”, AKA: Pee Wee, the link I posted is from a site that belongs to someone who has forgotten more than you will ever learn about this subject.
No issue with the site, as I stated the problem is it being posted here without the context from that site by someone who doesn’t understand it and who then misrepresents it and misinterprets it. Then you’re unable to understand the errors you make and instead of answering the criticisms you resort to abuse and personal attacks.
That’s utter nonsense. Ice volume can very well be compared whether it is on land or on water. You seem determined to only look at surface area oblivious of the fact that that says nothing about the amount of ice. Basically by only showing two of the three dimensions you are showing only a subset of the data. The subset that agrees with you. Had you taken all three dimensions into account the data no longer agree with you.
This is really bad. You are twisting my words out of context. If you had actually read my post you would have seen that I have said “From all the glaciers that have been monitored for long enough periods” and yes, from those only one shows significant growth. I’ve given you the link to the data, so can check for yourself. By only quoting part of my sentence you try make it seem like I claimed something which I did not claim. This is a very unethical thing to do if it was intentional. If it was unintentional you are a very bad reader.
This is quite hilarious. You really have a problem with reading, cause you are showing me data I showed you earlier. The only problem is, you show only a subset of it, whereas I showed everything. Let me give you the link again, so you don’t have to look back. Lord Moncton even prettified the graph for you. You should know the argo floats go down to about 2km. However, you have conveniently cherry-picked to show only the top 700m. Had you shown the entire depth that has been measured the data would no longer agree with you.
I have used ocean temperatures in another part of my argument, so that’s not a problem, I use both. Actually, I am glad you think the oceans are important. In the end they take up by far most of the heat. Which is why it really makes no sense at all that you are actually using them to make a case for satellite measurements, because satellite measurements do not measure the ocean temperature. They measure (indirectly) the temperature of the air above the oceans. This is an important and non-negligible difference.
Mareover, since you only really seem to rely on satellite data you are basically ignoring more than 99.9% of the total heat capacity of the earth. So if you only look at satellite data you can’t make any statement about wether the earth is warming or not, since you are focusing at such a tiny part of the entire system
That is really not very scientific. You can draw a straight line through anything. It doesn’t say anything about statistical significance. You really need to make a more thorough analysis if you want to be scientific.
That’s really not very scientific. That graph you show is calculated for equilibrium conditions, so it does not apply, since the current condition is not in equilibrium, you will have to compensate for that if you want to do it properly.
Lets recap your factual information:
For ice and for ocean you only showed part of the data. Area rather than volume and for the ocean only the top 700m. This was convenient for you, because if you had shown all of the data they would have no longer agreed with you. This is called cherry picking. Maybe it was unintentional, in which case you have simply been gullible. The data you showed for the CO2 sensitivity was based on equilibrium conditions, which do not apply in the current situation, so you either don’t understand radiative forcing or you did not understand the graph, or possibly both. The data you showed from wood for trees showed you don’t understand statistical inference very well, since it did not answer the issue.
All your posts indicate you don’t understand the workings of the greenhouse effect, since you’ve made errors in your statements on radiative forcing, you don’t understand basic statistics, since you’ve made errors in your statements regarding accuracy and significance, you don’t read very well and you like to use cherry-picked data and twist words out of context. You ignore data that don’t agree with you, which leaves you focusing at only < 0.1% of the heat capacity of the planet. I understand why you don’t like questions, when you have to show the actual basis for your assertions, it turns out it’s based on bad and error-laden science and lack of understanding of some very basic principles.You think you are being scientific, and make statements with lots of confidence, but the scientific argumentations you give are extremely weak. You are really just copying errors made by other amateur armchair “scientists”. So for example you post the last 20 years of satellite data and then you claim that you have shown using data that global warming stopped 20 years ago. What you have actually shown is that a minute fraction, less than one per mille, of the system has not warmed. Data from the other part such as the oceans etc. show a very different picture.
Menicholas,
I can not. I have issues with trust. I only trust my own eyes. I think it has to do with my childhood. You see, I did once belong to a cult, believing in a superhuman being, because my parents told me so. I was still just a child when I found out the truth. They had been lying to me. Lying to manipulate my behaviour. Saying that if I was a good boy, I would get nicer presents come December. When I found out, I immediately broke all contact, and I haven’t looked back since.
Aran is back, admitting now that:
You see, I did once belong to a cult…
So Aran has exchanged one cult for another. That often happens. Aran says:
They had been lying to me. Lying to manipulate my behaviour.
It’s still happening. The new cult is just like the old cult.
Some things never change — like the fact that Aran ignores all my questions, while I try to educate him on the questions he asks.
But educating Aran is like trying to teach a dog trigonometry; a hopeless task.
The basic fact is that there is nothing unusual or unprecedented happening. But the “ice” false alarm keeps chugging along, fueled by an endless supply of money. And the cultists believe every word about the ‘ice’ alarm that they’re being spoon-fed by government scientists.
Next, I pointed out that sea ice is the only kind of ice in the Arctic, so that is the only legitimate comparison.
Aran replied:
That’s utter nonsense.
Really? An assertion is Aran’s rsponse? And a wrong one at that? Aran digs his hole deeper:
Ice volume can very well be compared whether it is on land or on water. You seem determined to only look at surface area oblivious of the fact that that says nothing about the amount of ice.
Aran is deliberately ignoring the fact that several times I’ve pointed out that the Antarctic has up to 10X the volume of ice that the Arctic has, and that the Antarctic is gaining ice. Poor Aran, the facts are demolishing his arguments. And when he posted his link above, it was… a cartoon! For Aran, that’s ‘science’.
Re: glaciers, Aran admits that he’s only been told about retreating glaciers. He can only find one that is advancing — one, out of more than 160,000. Aran’s Confirmation Bias is in high gear. But then, ‘dangerous MMGW’ cultists are like that.
Next, Aran believes that ocean temps are zooming upward. He bases his Belief on models. But the reality is very different:
Before go’t scientists “fixed” it, Argo buoys showed steady decline in ocean temperatures:
http://www.friendsofscience.org/assets/documents/FOS%20Essay/Argo_Heat_Content.jpg
Next, this peer reviewed chart shows deep ocean cooling:
http://s27.postimg.org/idj4ait4z/Deep_OHC.png
Even the journal Nature shows what happened when they “adjusted” the data. Raw data on left, ‘Adjusted’ crapola on right:
http://www.nature.com/nclimate/journal/v4/n5/carousel/nclimate2159-f1.jpg
Out of all the measurements of OHC here, only one is rising: zero – 194 meters:
http://tumetuestumefaisdubien1.sweb.cz/ARGO-sea-temperature-max-max.PNG
The rest are all declining.
I have lots more charts like these, showing that the boiling oceans scare is complete nonsense; the oceans are cooling overall. But no amount of evidence can sway cult members like Aran. His mind is made up and closed tighter than a Jehovah’s Witnesses.
Aran says:
Mareover, since you only really seem to rely on satellite data you are basically ignoring more than 99.9% of the total heat capacity of the earth. So if you only look at satellite data you can’t make any statement about wether the earth is warming or not, since you are focusing at such a tiny part of the entire system
That is such a preposterouly wrong statment that it requires no refutation. Anyone familiar with satellite measurements can see that Aran is just winging it with another baseless assertion. It was emitted by someone ignorant of the entire subject, and who gets his catechism from climate alarmist blogs like Sks.
Next:
For ice and for ocean you only showed part of the data.
But you can only show so much, and I posted far more polar ice data than Aran, who seems to believe that his religios faith is convincing. It’s not, it is merely amusing to knowledgeable folks.
Aran’s final paragraph above is more of his baseless assertions. He fails to understand that Planet Earth herself is solidly debunking what he believes in. He is still unable to produce even one measurement quantifying MMGW, which he is just certain must exist — even though he cannot produce a single measurement confirming it. Thus, Aran’s endless assertions, which take the place of testable data.
The planet has been flat to cooling for many years now. All of Aran’s comments avoid that reality, because if he admitted to that fact like the IPCC does, his arguments would be destroyed. They are anyway.
And Aran cites NASA, of all places, as his “authority”. Aran me boi, aside from NASA’s mission being changed to “Muslim Outreach”, it has been proven repeatedly that NASA lies:
Believe them if you like. You only believe factoids that support your confirmation bias anyway. Why stop now?
Finally: Aran always asks questions. He doesn’t answer questions. If he decides to answer questions, I hope he lets me know, because I have some very uncomfortable questions for him. Of course, he will deflect as usual and never really answer. But the question will still be there.
Yes you said that the Antarctic has 10x the volume of ice and next you show that the area is increasing. That’s a red herring. You are not showing what you claim to be showing. You show area is increasing, but you don’t show volume because the measurements show that is decreasing. Either you don’t understand the difference or you are deliberately diverting.
That’s a lie. Either you are deliberately twisting my words again, or you have not read properly. I have admitted nothing of the such, since it is not true.
Again a very bad cherry pick. Do you not read at all? No wonder you falsely claim I never answer your questions. You only show a convenient part of the Argo data the entire set shows a different picture. I gave you the benefit of the doubt at first, thinking you might just have been naive, but now it seems you are deliberate. Or are you arguing Monckton got it wrong?
Your mistakes keep getting worse. Now you don’t even understand your own graphs anymore. Those graphs don’t show OHC.
If by that you mean graphs that show something different from what you think they show, I believe you immediately. The amount of potential red herrings is infinite.
That’s convenient. If you can’t refute you just relieve yourself of having to. Do you deny the heat capacity of the oceans is some 3 orders of magnitude larger than that of the atmosphere? Oh and I got those numbers from WUWT, not from Sks, if you were thinking of shooting at the messenger again rather than the message.
Another lie. I have answered your question and I have let you know:
and
You just can’t read very well
Comparing apples and pears, or in this case atmosphere temperatures and surface temperatures. You focus only on the data that agree with you and you dismiss all the other data, leaving you with only < 0.1% of the total heat capacity. Talk about confirmation bias. Oh and if you can prove NASA lies I suggest you sue them. You could become very rich.
Phil. (quoting dbstealey)
Greenland’s ice cap area does not vary over time of year, and thus it does not affect changes in solar energy reflections over the year, does it? Canada’s Arctic island areas also share the Arctic sea ice “domain” between the pole and latitude 70 north, and they do change over the year (dark in the summer, increasingly dark now that extra CO2 means more plant growth every year, and snow-and-ice covered in winter and spring) but their melted ice does not materially increase sea level rise year-to-year either.
“Greenland’s ice cap area does not vary over time of year, and thus it does not affect changes in solar energy reflections over the year, does it?”
Actually it does. Reflectivity also depends to some extend on the depth. See this article showing both the (accelerating) mass loss and the loss in reflectivity of the Greenland ice sheet.
Phil. says:

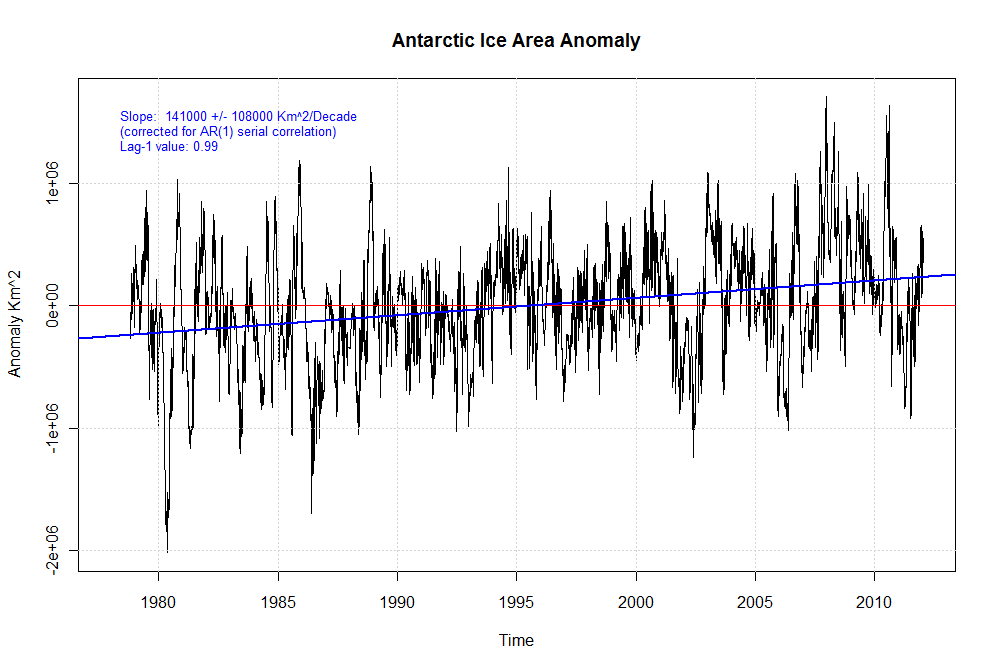
Wow, whatever happened to Greenland?
Once more for the slow to understand: Arctic ice cannot be compared with land ice because Arctic ice is 100% sea ice.
And wow, whatever happened to the endless predictions of runaway global warming? Any unbiased person looking at the climate alarmist predictions of 15 – 20 years ago, and what has happened since, knows that the alarmist crowd was flat wrong. End of story, for anyone with common sense. Sorry, Pee Wee, the planet has ruled against you.
Next, Aran the True Believer says:
…you don’t show volume because the measurements show that is decreasing.
That’s just another assertion. Ice volume in the Antarctic is not decreasing because the Antarctic has remained uniformly cold many decades — and it is getting colder. Aran can’t understand that if the Antarctic is getting colder, there will be more ice… DUH.
This year Antarctic ice was somewhat below normal — temporarily. But upon compiling the latest data, we see the Antarctic ice is back above its average:
And last year, Antarctic ice set a new all time high record:
Sorry about the belief system. Antarctic sea ice thickness is also rising:
http://news.bbcimg.co.uk/media/images/79721000/jpg/_79721234_cryosatmap1.jpg
And of course, the Antarctic is steadily gaining ice cover:
Next, regarding the glacier scare: Aran posted a graph that shows only 37 reference glaciers. Now, if Aran wants to believe that the source quoted has tracked all 160,000+ glaciers on the planet, he can be as credulous as he wants. But all they’re doing is tracking the 37 glaciers that they want, plus, as they say, their “subset of reference glaciers”. Cherry-picking and confirmation bias intended for the cult members.
That is not to say that the planet is not recovering from the LIA; it is. That’s the ‘Occams Razor’ explanation. But Aran believes that human CO2 emissions are the cause. You can’t fix stupid.
Next, Aran says:
It is very possible for sea ice extent to be stable or increasing, whilst the total amount of ice is decreasing.
And it’s very possible that the cow jumped over the moon. But assertions like Aran makes are not a credible argument. They are only a cult belief.
Anyway, this is tedious. I can easily refute every belief Aran has that claims human CO2 emissions are causing runaway global warming, or Arctic ice to vanish, or any of the other swivel-eyed claims he and his cult are trying to sell to the public.
The fact that global warming stopped many years ago is enough to make rational folks laugh out loud at the ridiculous assertions of the alarmist cult. All they’re doing is proselytizing their religious climate beliefs to skeptics. That provides skeptics with much amusement. But sorry, Aran, we’re not buying your hoax.
Wrong, Talk about baseless assertions. several different methods of measurement independently show it is. You are denying the data.
All the data you show are some kind of cherry pick of the parts of the planet where the ice is increasing. either leaving out Greenland or looking only at sea ice extent etc. The original statement was that overall the ice is melting. So looking at the total volume or mass of ice This is true for the Antarctic and for the Arctic. As many measurements have shown.
You really really really don’t read very well. Did you even check the data? If you had you would have seen that we are not talking about just the 37 reference glaciers. You are wrong.
Wrong again. I don’t believe that. The argument has been about whether or not it has warmed. Not about the cause. You are using a red herring to try to divert. And even a false one at that.
And wrong again. I don’t claim human CO2 emissions are causing runaway global warming nor am I claiming the Arctic ice is about to vanish. All your so-called refutations have been based on an increasing amount of scientific errors.
(Note: GRACE is unreliable for such measurements. -mod)
“Anyway, this is tedious.”
DB, you have absolutely proven that you have the patience of a saint.
The moving target of claims made by warmistas has so far meant that no amount of refutation is sufficient to settle anything. Except for one thing: They have been very inventive in coming up with new things to be wrong about.
The selective attention demonstrated by them is stunning. Claims made in months and years past become “irrelevant” once disproven or debunked or just plain shown to be meritless.
If I ever write a book, it will be a timeline type compendium of each claim made, each prognostication issued, and the dire consequences which were foretold, along with how each of these was refuted, or proven to be incorrect, or just dropped by the wayside.
When one looks back at it all, that is when it becomes truly jaw-dropping.
Re: Arctic sea ice…it has not been long since all were assured that at a certain point, albedo shifts would cause the remaining ice to disappear pretty much all at once (Funny how the converse situation in the Antarctic has never been predicted to cause ever more rapid expansion of ice, is it not?). That failed to happen, and now that the ice is rapidly reforming, the rear guard action is to dispute ever little point…claiming that extent does not matter, it is all about volume.
This is very similar to the above discussions of Greenland temps during the LIA and the MWP in relation to current temps. In years past, glib assurances from warmistas were that the MWP was local. Now that that has been proven untrue, the argument has shifted to the nonsense we are being assailed with here on this thread.
But I remember back further than that, when the alarmist meme concentrated on making the case that it was THE RATE of warming that was unprecedented. This was before widespread alterations of the historical records made it possible to claim that recent years were “the warmest evah!”
Back as recently as 1998, even James Hansen was still admitting publicly that there was nothing unprecedented about the temperatures.
One wonders how fast this crappola about ice volume will be forgotten, once there are even more overwhelmingly undeniable mountains-worth of evidence to show that claims of larger extent but smaller volumes are as transparently bogus as a belief in Santa Claus.
“…either leaving out Greenland or looking only at sea…”
Well gosh, did Greenland get left out of the discussion?
I had not noticed, what with all the talk about…um…GREENLAND!
As for the Greenland ice melting, they just had the shortest melt season on record, and the mass balance for the year is that the ice sheet there has gained over 200 billion tons!
All this nonsense about posting graphs and data, from people who have asked and been answered with reams of such over and over again…is becoming quite tiresome.
Aran, do you need to see a mass balance chart for Greenland for the past year?
And even more tedious is the sea ice questions, when everyone who has ever looked into it knows full well that sea ice in the Arctic has been cycling higher and lower for as long as records exist and historical accounts have been recorded.
Menicholas,
Good points. Aran and this nutter are both the same:
Aran has never answered my question: what would it take to convince him that the temporary dip in Arctic ice was not caused by human CO2 emissions? Could anything convince him?
dbstealey September 27, 2015 at 7:50 pm
Phil. says:
“Wow, whatever happened to Greenland?”
Once more for the slow to understand: Arctic ice cannot be compared with land ice because Arctic ice is 100% sea ice.
Except for the substantial chunk of land ice known as Greenland!
This year Antarctic ice was somewhat below normal — temporarily. But upon compiling the latest data, we see the Antarctic ice is back above its average:
Not only is the graph you posted not the latest but it appears to have been altered, here is the latest data:
https://nsidc.org/data/seaice_index/
And Pee Wee still can’t understand the difference between sea ice and land ice!
I give up. You can’t teach a dog trigonometry.
ftp://sidads.colorado.edu/DATASETS/NOAA/G02135/Mar/S_03_plot.png
dbstealey September 28, 2015 at 9:05 am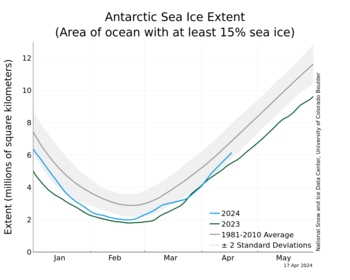
And Pee Wee still can’t understand the difference between sea ice and land ice!
I give up. You can’t teach a dog trigonometry.
Nor you english apparently! (Note: “English” in that sentence should be capitalized. -mod)
The link to the correct antarctic sea ice apparently didn’t work, here it is again:
Menicholas,
You said:
Exactly my point! Thank you. Maybe you had not noticed, but Greenland did get left out in this plot by dbstealey, which was precisely my argument. Showing a subset of the data.
http://news.bbcimg.co.uk/media/images/79721000/jpg/_79721234_cryosatmap1.jpg
You also asked:
Really no need for that. I have already linked to the Greenland data in my post at 9/27 7:27. Maybe you had not noticed that too?
Finally you say:
Could not agree more. The sea ice is a red herring. A diversion brought into the discussion by dbstealey. I have always talked about total ice volume. I’m happy to admit sea ice extent is increasing. That does not change the fact that the total volume trend is decreasing.
You know dbstealey what bothers me most? That bad scientific argumentation and errors from people like you actually provide ammunition to the alarmists. This makes it harder for skeptical scientists like me to get my point across. Whenever I am in a discussion with an alarmist scientist I always have to evade accusations based on the errors made by skeptics that really don’t understand the basics of science.
You just don’t read, do you. link second paragraph.
I am actually working on an alternative model from scratch in my spare time. Hoping for a publication somewhere during the next calendar year.
Apologies, I posted too quickly. The comment above is a reply to dbstealey’s accusation of me not answering his question
Aran says:
I am actually working on an alternative model from scratch in my spare time. Hoping for a publication somewhere during the next calendar year.
Oh, goody! We can average Aran’s new model with all the others, and arrive at an accurate global T. Then we’ll know for sure.
Aran says:
… skeptical scientists like me…
Hey, we have a comedian in the house!
Aran also sez (referring to his comment he linked to):
I would be easily convinced if an alternative explanation were available that could show quantitatively how these changes can be explained without or with significantly reduced CO2.
As usual, Aran is trying to make skeptics prove a negative. But it takes intelligence to paint skeptical scientists into a corner like that. Aran isn’t up to it. The Scientific Method gets in his way.
Aran either forgets, or doesn’t know that the one putting forth a conjecture or hypothesis (such as ‘CO2=cAGW’) has the onus of producing a credible, data-based argument with predictive value. That conjecture has neither. We keep asking for measurements of AGW, but neither Aran, nor anyone else has ever produced any such measurements.
Measurements are data, but the alarmist crew has no such data. So their arguments rely mostly on baseless assertions, and the appeal to authority logical fallacy. But authorities don’t matter. Data matters. And the data shows no global warming.
Aran adds:
That’s how science progresses. By improving on current understanding.
No, Aran, data improves our current understanding. Assertions are nothing more than… well, assertions.
Next, Aran asserts:
Claiming CO2 has no or hardly any influence would only decrease our understanding. Basically all they have to do is do better than the current climate models, and from what I understand reading this website, that should not be a hard task.
When alarmists don’t have any data, they fall back on veiled insults like Aran does here. “This website” has won the internet’s Best Science & Technology Weblog Awards for the past 3 years running. But Aran gets his misinformation from head-nodder blogs that censor the skeptical point of view. So it’s no wonder that Aran doesn’t understand the basics.
Aran me boi, the basic fact you don’t get is that global warming has stopped. Despite decades of alarmist predictions foretelling runaway global warming and climate catastrophe, they were wrong. All of them. They were so wrong that they won’t debate publicly any more. They were so wrong that they can’t even produce one measurement of what they insist must be happening.
Back in the 1950’s Professor Leon Festinger explained the psychology of the alarmist cult, which applies directly to Aran:
A man with a conviction is a hard man to change. Tell him you disagree and he turns away. Show him facts or figures and he questions your sources. Appeal to logic and he fails to see your point. We have all experienced the futility of trying to change a strong conviction, especially if the convinced person has some investment in his belief. We are familiar with the variety of ingenious defenses with which people protect their convictions, managing to keep them unscathed through the most devastating attacks. But man’s resourcefulness goes beyond simply protecting a belief. Suppose an individual believes something with his whole heart; suppose further that he has a commitment to this belief, that he has taken irrevocable actions because of it; finally, suppose that he is presented with evidence, unequivocal and undeniable evidence, that his belief is wrong: what will happen? The individual will frequently emerge, not only unshaken, but even more convinced of the truth of his beliefs than ever before. Indeed, he may even show a new fervor about convincing and converting other people to his view.
That’s Aran: Planet Earth is demolishing Aran’s beliefs. His response? He shows a new and even greater fervor trying to convince and convert others to his green eco-religion.
Bertrand Russell said much the same thing:
What a man believes upon grossly insufficient evidence is an index into his desires — desires of which he himself is often unconscious. If a man is offered a fact which goes against his instincts, he will scrutinize it closely, and unless the evidence is overwhelming, he will refuse to believe it. If, on the other hand, he is offered something which affords a reason for acting in accordance to his instincts, he will accept it even on the slightest evidence. The origin of myths is explained in this way.
But Aran can’t even be convinced by overwhelming scientific evidence that his ‘dangerous man-made global warming’ myth is being falsified by the only Authority that matters: Planet Earth. Sad, but true.
Finally, the great Leo Tolstoy explains Aran and his fellow travelers:
I know that most men, including those at ease with problems of the greatest complexity, can seldom accept even the simplest and most obvious truth, if it be such as would oblige them to admit the falsity of conclusions which they have delighted in explaining to colleagues, which they have proudly taught to others, and which they have woven, thread by thread, into the fabric of their lives.
In other words: Aran will never climb down now, no matter how many verifiable, empirical facts and observations contradict his repeatedly falsified belief system. His ego could not take being so thoroughly debunked in public.
If this Arctic sea ice VOLUME chart was a stock chart, I would be selling with both fists.
Note that each of the past four melt seasons has ended with a higher ice volume than the previous melt season.
http://psc.apl.uw.edu/wordpress/wp-content/uploads/schweiger/ice_volume/BPIOMASIceVolumeAnomalyCurrentV2.1.png
I am not sure how reliable PIOMAS is…some of these ice trackers are biased, and tend to skew their results to play down any accumulation of ice.
Summer is a little boring for sea ice, and I had stopped paying very close attention to it for a few months there, but we have some very interesting things happening now. I will be on it like frost on a cold drink for the next 6-8 months or so.
As for any irregularities with the sea ice charts, it may be due to changes in the methodology which are ongoing. Previously, coastal ice was not counted, but now it will be, and for a time both graphs are being made available. I am not sure if this accounts for the discrepancy mentioned.
But, Aran, methinks you are being a tad slippery in some of your assertions.
‘Skeptic’, be ye? Hmmm…
And know…I mostly see eye to eye with DB on the broad strokes in these matters, and he has a ton more experience in these discussions in recent years than I have.
I just got home, and will need to reread some of the discussion before commenting further…just wanted to post this volume chart, as you seem to be under the impression that volume and extent are unrelated.
The charts do not always track each other in identical fashion, but obviously extent and volume are closely related. You cannot have one without the other, although they can vary at differing rates.
Be aware to that volume estimates are just that…estimates, as no systematic and highly accurate and reliable method exists to determine the exact thickness of ice floating on water.
I recall last year when some measurements in the Antarctic showed the sea ice there to be far thicker than had been supposed by some, and claimed by many more.
What often stands in for volume is a measure of the area of multiyear ice, broken down by age. Certianly during the years of higher than average melting, loss of multiyear ice was cited as a particularly alarming trend.
In closing for the time being, I just want to add that I, for one, do not view Arctic melting as anything to get worried about, and in fact see growing ice with great alarm.
Why, one might wonder, am I so unconcerned about the plight of the polar bears to say such a thing? I think it is pure hooey and hogwash to think that these animals are going to be hurting if conditions in their favored habitat change. Bears are survivors, and are very adaptable. They are perhaps the champion swimmers among non-aquatic mammals. And they are growing in numbers.
The other reason I see more to be alarmed about with growing than with shrinking ice extent/volume, is that humanity has far more to be worried about from a drastic cooling trend, than from some warming.
Alarmism over warming is made up nonsense, in my view.
Correction…past three melt seasons, not four, have been higher than previous.
The 2012 melt season marked the turnaround point by my analysis.
Oh, and I thought I would include this bonus chart, even though you said you did not need to see it…i need to show it.
I was tired last night, got a little lazy:
http://realclimatescience.com/wp-content/uploads/2015/09/ScreenHunter_2972-Sep.-09-07.05.gif
And this article from a few weeks back contains some interesting pics and graphs.
I will look for an up to date graph later:
https://stevengoddard.wordpress.com/2015/09/09/update-on-the-guardians-greenland-fraud/
dbstealey:
Not if mine will show significantly lower warming for the next century.
You really don’t get it do you? Your tunnel-vision is so strong that as soon as someone disagrees with the assertion that there has been no warming at all for two decades you label them as being part of some alarmist cult. You make all sorts of assumptions about me most of them false. You paint me as some kind of male gullible unscientific doom-preacher. You could not be much further from the truth. You wouldn’t recognise a serious skeptic if they stood right in front of you.
Note that the mean for Greenland’s surface mass balance for the past several decades is for a huge yearly accumulation. I see no reason to worry about a few years of negative mass balance…in other words, more melting that accumulation.
But it may be that that was a brief anomaly, as the AMO and the sun cycle seems likely to now favor rapid ice gain and severe Arctic winters.
“If this Arctic sea ice VOLUME chart was a stock chart, I would be selling with both fists.”
Apologies again.
What I intended to have said was that I would be buying, as the downtrend almost surely broken and the new trend is up.
This actually looks a lot like a stock chart, at a time where the buyers step in and sellers retreat.
The big takeaway, from the perspective of the dire warning we all were treated to for the past bunch of years, is that the idea that below a certain ice extent melting would become more rapid and the ice would vanish quickly. This is obviously not the case, at least not so far…although one could always hope.
Perhaps Aran is a Woman?
If so, I apologize for assuming otherwise. Truly.
Not sure why I thought I knew one way or the other.
Aran says:
You make all sorts of assumptions about me most of them false.
ORLY? Then suppose you define exactly what your position is:
Do you think that man-made global warming (MMGW) exists? If so, do you think it is dangerous? Or if it isn’t currently dangerous, do you think it will be dangerous in future? If so, give us a time frame. And exactly how dangerous do you think it will it be? We need your cost/benefit analysis: how much money is required to lower global T by 1ºC?
To be fair, I’ll define my position, which has not changed for many years:
I think MMGW exists. It is not dangerous at all. It will not become dangerous. It is too tiny to even measure. I think ‘MMGW’ is a complete non-problem. I also think that government bureaucrats and “.edu” people, along with the media, have a vested self-interest in promoting the false climate alarm, because of all the money involved. They prosper at our expense.
I also think that if CO2 increased by 20%, or 30%, or 50%, any resulting global warming would still be too small to measure. On net balance, I think a rise in CO2 is entirely beneficial. Plants grow better and faster with more CO2. It is a non-problem. (Many people think a plant in a pot uses dirt to grow. Wrong. It uses the CO2 from the air, which builds all the plant’s sugars, starches and cellulose. Otherwise, the dirt in the pot would be depleted as the plant grew.)
I also think that CO2 does not cause any measurable global warming, and that lowering CO2 would not cause global cooling. The geological record supports that view completely.
I think that even a 3º – 5º warmer planet would be just fine. Zero Arctic ice would be a benefit, too: transit times would be cut significantly, saving much fossil fuel use. Icebreakers would not be needed. The Northwest Passage would be open year round. And areas like Alaska, Siberia, Mongolia, and other areas too cold for good farming would become much more productive. Rainfall would increase.
I can back my positions with a mountain of evidence. I ask that you back anything you believe with data, and not with appeals to authority arguments, or with assertions.
Maybe we’re not that far apart. We’ll see — if you’re as sincere as I am.
*****
Menicholas says:
Well gosh, did Greenland get left out of the discussion?
I had not noticed, what with all the talk about…um…GREENLAND!
That’s a typical tactic of the alarmist crowd: if ‘sea ice’ supports their confirmation bias, then they pound the table about ‘sea ice’. But if ‘ice volume’ does it for them, then it’s ‘ice volume’ all the time.
The problem with ice volume, as you pointed out, is that it is imprecise. Both sides can find papers and measurements that support their arguments. The GRACE satellite has been shown to be in error. Therefore, I place polar ice volume way down on the credibility list.
Ice area and extent are much more precise (I always have to larf at the hand-waving over “ice”), so those are the preferred metrics for anyone who wants real answers, and not political arguments.
Aran doesn’t understand that like most skeptics, I do not care if runaway global warming becomes a proven fact. It is the knowledge that I want. That requires verifiable data, facts, and empirical observations. Likewise, I want to know if we are headed for global cooling (which is much scarier than any amount of warming).
This is a science site, but it has become infested with politics. When it began, WUWT was at least 97% science <–(see what I did there?) Now it's about half politics, and the reasons are easy to see. I've posted about them above, and on many other threads.
We have to fight back against the politics and the eco-religionists, which are all supported by money and misinformation. There are new readers coming here every day; we cannot let the alarmist contingent spread its misinformation. With both sides posting their arguments, the result is easy to see: most readers are, or become scientific skeptics when they can read all sides of the debate.
That's why most alarmist blogs censor skeptics' comments. Because when readers see all points of view, their common sense will direct them to the logical, data-based conclusion: MMGW is a hoax designed to promote the passage of a carbon tax — the true, unstated goal of the alarmist scientists. They, in turn, are supported by a contingent of True Believers, who believe any and all factoids that support their belief, and reject out of hand any facts, evidence, or empirical observations (no global warming for almost 20 years) that deconstructs their belief system.
We're fighting for the middle ground here — readers who haven't decided, but who want to understand if there is really a problem or not. Our job is to convince them that there is no measurable evidence or data that supports the MMGW scare.
I think we're winning hearts and minds. Slowly. But a few years ago there were still lots of concerned comments under 'global warming' articles. Now, the large majority of comments ridicule the MMGW scare. We just have to keep pounding away with facts, evidence, and observations — because the alarmist side doesn't have good arguments or evidence. All they have are their assertions, their "what if…" arguments, and their appeals to bought-and-paid-for authorities. Given time and with our help, the truth will win out.
– Do you think that man-made global warming (MMGW) exists?
Yes
– If so, do you think it is dangerous? Or if it isn’t currently dangerous, do you think it will be dangerous in future? If so, give us a time frame. And exactly how dangerous do you think it will it be?
Potentially dangerous in the long run. Definitely not currently. Exactly how long the long run is will depend on many factors, but I’d say at least quite a few decades if not a century or more. On of the unknowns is the sensitivity of climate to CO2, which I think might very well turn out to be too high in most models because they were developed during a time of strong warming. How dangerous is also a tricky question. One of the dangers in the long run is high costs due to rising sea levels with many people living in coastal areas. In Asia there is the potential for humanitarian problems with dense populations close to sea and countries too poor to take the appropriate measures to protect them. Apart from that there are a lot of proposed dangers as well as benefits (which you have already mentioned) but none of these are well understood, because we are basically going into unknown territory. I suppose in the purely hypothetical situation that we don’t do anything at all for a very very long time and do not invent or adapt or whatever we could trigger a mass extinction, but that is a totally unrealistic. The way I see it we are poking – with a very small stick, but still – in a system that we only partly understand. The biggest danger might very well be that the system reacts in a way we had never foreseen, which could be in a good way or in a bad way.
– We need your cost/benefit analysis: how much money is required to lower global T by 1ºC?
I really don’t know anything about this. Apart from the fact even that I see no reason why we would want to lower global T. I try to stay away from economics, not my field of expertise and that’s an understatement.
Aran,
OK, good. Now we’re starting to get somewhere.
I’ll forget about the cost/benefit stuff. And since the sea level rise is an effect, not a cause, I’ll disregard that, too. And since “carbon” is the goal (as in carbon taxes), let’s stick with CO2 emissions.
These are numbered for easy reference:
1. What exactly is (are) the danger(s) we’re facing from a rise in CO2?
“… there are a lot of proposed dangers…”
2. Next, what is the definition of a ‘danger’ from more CO2? You could say water is dangerous. So we need a specific definition of ‘dangerous’.
3. Next question: since CO2 has been up to ≈20X higher in the past without ever triggering runaway global warming, do you think that is one of the putative ‘dangers’?
4. Next: since CO2 has been much higher in the past, and at times has rapidly spiked up without ever causing runaway global warming, what other “unknown territory” are you referring to?
5. Finally (I have lots more questions, but I’ll limit it to 5 so it doesn’t get too far out of hand), given that your ‘potential dangers’ seem to be of the “But what if…” and “unknown” variety, while the alternatives are very well known (rapid growth of government bureaucracy, loss of discretionary spending by everyone, higher taxes, economic stagnation, misallocation of resources, higher costs for all goods and services), versus the real world situation of every alarmist prediction having failed, how likely do you think it is that the entire basic premise (CO2=CAGW) was simply wrong from the start? Answer with a percentage, ie: 5%, 40% 85%, 97%…
Aran,
Skip #5. I got distracted and the question is too confusing as written. #1 – #4 will do for now.
I would like to answer as well.
The answer is that, at first, there was a slim chance there could be something to it, and I mean less than 5%.
At this point Slim, like Elvis, has left the building..
Menicholas September 28, 2015 at 2:55 pm
Note that the mean for Greenland’s surface mass balance for the past several decades is for a huge yearly accumulation. I see no reason to worry about a few years of negative mass balance…in other words, more melting that accumulation.
The surface mass balance is only part of the overall balance, the overall balance includes glacier loss and is recently negative, i.e. glacier loss exceeds surface mass accumulation:
http://www.arctic.noaa.gov/reportcard/images-essays/fig3.3-tedesco.jpg
Fig. 3.3. Monthly mass anomalies (in Gigatonnes, Gt) for the Greenland ice sheet since April 2002 estimated from GRACE measurements. The anomalies are expressed as departures from the 2002-2014 mean value for each month. For reference, orange asterisks denote June values (or May for those years when June is missing).
1. What exactly is (are) the danger(s) we’re facing from a rise in CO2?
What I meant with the “lot of proposed dangers” are all the scary stories that pop up in the media every so often, such as wars, droughts, species extinctions and I don’t know what else. A lot of them I would call guesses since they only partly (if at all) rely on deterministic reasoning and always tend to contain assumptions. A lot of these depend on how we are going to deal with a warming planet and since I consider politics a way more complex and chaotic system than climate I try not to spend too much time on these things.
2. Next, what is the definition of a ‘danger’ from more CO2? You could say water is dangerous. So we need a specific definition of ‘dangerous’.
Just off the cuff I would say anything that has the potential to bring about large financial, material, ecological or humanitarian damage
3. Next question: since CO2 has been up to ≈20X higher in the past without ever triggering runaway global warming, do you think that is one of the putative ‘dangers’?
I am still learning about past climate situations. They become a lot more complex since Milankovic cycles, solar cycles and such start to play a significant role. You cannot simply compare CO2 then and now without taking such factors into account. I agree that runaway global warming is definitely not imminent, but you can’t just assume it’s safe to go up to past levels, because there’s more than just CO2 to consider.
4. Next: since CO2 has been much higher in the past, and at times has rapidly spiked up without ever causing runaway global warming, what other “unknown territory” are you referring to?
We are adding CO2 by a non-natural process. In the past – and here I will admit I am trusting what I have been told – strong warming events were typically triggered by the sun and then amplified by CO2 that was released as a consequence of the warming. From a systems theory perspective climate can be simplified as a system having several states that are relatively stable and then certain processes that allow the system to “jump” (apostrophes because of the time scale involved) from one state to another. If this were not the case we would indeed have long ago transitioned into some extreme “runaway” state from which there was no escape process. In such a system every process must have a feedback that counteracts when another level is reached. At the present, part of the warming process comes from a non-natural source, or, from a systems perspective, a source that is not part of the system and which might not have a stabilising feedback. By adding a new process to the system, the system as a whole changes, which is the unknown territory. If you like analogies I would say we have added a cog to a complex clockwork meaning all the other cogs might now behave slightly differently.
“The surface mass balance is only part of the overall balance, the overall balance includes glacier loss and is recently negative, i.e. glacier loss exceeds surface mass accumulation:”
Surely you cannot be serious!
Do you know what the word “balance” means? It means the net gain or loss after accounting for all additions and subtractions.
Is English your first language, Philperiod?
Just wondering.
And nice try at a misdirection with that anomaly chart, which is intended to do one thing…confuse the weak minded.
Get a grip…are you that addicted to Kool Aid?
“I agree that runaway global warming is definitely not imminent, but you can’t just assume it’s safe to go up to past levels, because there’s more than just CO2 to consider.” ?oh=f3f8013885abc4da6d27fec9a4cae388&oe=56AAE56A
Aran,
In fact, the entire giant house of cards is built upon one single premise…that CO2 is the only important factor to consider…that it is the temperature control knob of the atmosphere.
I give you credit for grappling with some issues which you seem to be admitting you are not understanding in their entirety. I seriously do.
But do not be confused about this…CAGW is all about CO2. Period
And CO2 does not, it simply does not, correlate in a causal way with temperature.
It matters not to atoms and molecules from what source they sprang…they act on the physical properties of the condensed matter that they are…nothing else.
You asked some questions about some of my assertions, and I have not had a chance to answer them. To be honest, tis is not my job, and there are fresh stories every day anyway, which beg for my insightful commentary 🙂
But the turnaround in the Arctic ice is plainly evident. The 30 year cycle of waxing and waning Arctic sea ice in plainly evident.
The ice core data from Antarctica is very clear in showing that CO2 follows temperature. You stated that it sometimes does…this is incorrect. It always does! In every instance. In every epoch. In every case, in the ice core data…it follows. Which means that as temperatures bottom and then begin to rapidly rise, CO2 is low and continues to fall for hundreds and hundreds of years more, while temps rise quickly. When temps fall, they often do so rapidly. And in every case, they begin to fall while CO2 is near it’s cyclic peak. CO2 continues to rise for hundreds of years, while temps fall, often quite rapidly and quite far. So temps fall while CO2 is high and still rising.
I will provide you with one quote and an article to begin your homework on this…the story is quite fascinating, and not at all what you may have ben led to believe.
“Figure 6 provides an expanded view of the last glaciation where it can be seen quite clearly that there is a time lag of about 8,000 years between temperature falling and CO2 being pumped down. The temperature fell to glacial conditions (-6˚C) with CO2 at interglacial values (265 ppmV). Methane fell immediately with temperature but CO2 did not. This suggets that CO2 has little control over the main structure of the glacial cycle that is controlled by orbital forcing. There are similar time lags at the beginning of each glacial cycle (Figure 4). This is clearly an important and reproducible geological process or sequential combination of processes.”
http://www.euanmearns.com/wp-content/uploads/2014/11/vostok_150001.png
http://wattsupwiththat.com/2014/12/27/vostok-and-the-8000-year-time-lag/
I will trust you when you say you are skeptical. But unsure.
This is my “Surely you can’t be serious” face:
I am serious, and do not call me Shirley.
Ciao.
-Nick
Menicholas September 29, 2015 at 7:15 pm
“The surface mass balance is only part of the overall balance, the overall balance includes glacier loss and is recently negative, i.e. glacier loss exceeds surface mass accumulation:”
Surely you cannot be serious!
Do you know what the word “balance” means? It means the net gain or loss after accounting for all additions and subtractions.
Is English your first language, Philperiod?
Just wondering.
Yes, English is my first language, I do know what ‘surface’ means, apparently you do not!
If you actually read the material from which you copied you’d know that the nett balance is negative due to the fact that loss from the glaciers in Greenland exceeds the accumulation from snow (the SMD defined as “essentially net snow accumulation minus meltwater runoff”).
The DMI website which presents the SMB graph you posted says this in the paragraph immediately above that graph:
“Satellite observations over the last decade show that the ice sheet is not in balance. The calving loss is greater than the gain from surface mass balance, and Greenland is losing mass at about 200 Gt/yr.”
And nice try at a misdirection with that anomaly chart, which is intended to do one thing…confuse the weak minded.
Of which you are evidently one, that graph confirms what DMI says.
Aran,
Sorry, I’ve been away from my keyboard. Thanks for answering.
Since I numbered them, I’ll refer to the numbers in your reply:
#1: Good answer. In fact, all the scary predictions (note: I said ‘scary’) made by the alarmist crowd have turned out to be flat wrong: accelerating sea level rise, disappearing Arctic ice, vansihing Polar bears, bumblebee tongues, etc. And the big enchilada: runaway global warming and climate catastrophe, has ben proven to be so obviously wrong that many on the alarmist side has taken to simply lying about it. They claim that the satellite data is wrong, and global warming has never stopped.
Since every alarming prediction has been wrong, would you agree that the basic premise — that a rise in CO2 emissions will cause grave problems — must be wrong? (Please, no “what ifs”. Anyone can say “But what it ________?”) Fill in the blank with anything you want. But that isn’t science, which depends on data. You must produce verifiable, real world measurements showing that problems are occurring. But there are no such measurements.
#2: You define ‘danger’ as anything that has the potential to bring about large financial, material, ecological or humanitarian damage. OK, now define “large”. Then, plug in your definition of ‘large’ with a cost/benefit analysis… oh, right. You don’t want to do that. Well then, your definition of danger can apply to almost anything, can’t it? Asteroid hits, terrorist attacks, stock market meltdowns, earthquakes, global cooling, etc. We spend hundreds of $billions on “studying climate change”, but very little on studying how to deal with asteroids colliding with the earth. Not much more on earthquakes, and almost nothing is spent to “study global cooling”.
Therefore, money is being mis-allocated into something that has been shown to be a non-problem. That should end, stat. At this point it is at least 97% politics, not science.
#3: You say, I am still learning about past climate situations. They become a lot more complex since Milankovic cycles, solar cycles and such start to play a significant role. You cannot simply compare CO2 then and now without taking such factors into account.
Sorry, but that’s a non-answer. All the cycles you refer to have happened repeatedly during the geologic record, for which we have credible temperature and CO2 proxies. Despite them, CO2 has never caused the problems the alarmist crowd say it will cause now. They have no evidence to support their CO2=CAGW scare. None at all. Why should anyone pay them any mind? Why should the public be forced to subsidize their measurement-free belief system? Doesn’t it look like they have a pretty good racket going?
#4: By your explanation, everything is “unknown territory”. So that amounts to another baseless “what if” alarm. There is no evidence to support it. You write:
We are adding CO2 by a non-natural process.
I do not agree. All the CO2 emitted from fossil fuel use was originally in the atmosphere. It was sequestered in plants and rocks, bringing down atmospheric CO2. Now some of it — really a very small amount — is being put back where it came from. How is that not “natural”? Plants do that same thing constantly. Furthermore, it does not appear to be causing any global harm at all. If anything, more CO2 is beneficial.
You can do a search for ‘coal seam fires’ and find that underground coal deposits have been burning for thousands of years. They cannot be extinguished. What is the difference between those, and human coal use? The only difference is that humans (in the West, at least), use scrubbers to eliminate almost all particulates, leaving only harmless CO2 and H2O. But coal seam fires — and there are a lot of them — constantly burn unchecked, and emit everything.
So the “natural” argument is a canard. We are using fuel that was naturally sequestered, and making sure we don’t put harmful byproducts into the air. We are re-emitting only a very small portion of what has been stored. And our CO2 emissions are measurably greening the planet, thus holding down food costs, and the cheap electricity being produced is making life much better for the world’s poorest. There’s a cost/benefit there, but you don’t want to discuss that.
Bottom line: there is no good evidence to support the false alarm being sounded. There still isn’t a single measurement quantifying AGW. The whole scare is built on three primary pillars:
• Money, and lots of it. $billions every year, and that’s just in the U.S.
• Constant appeals to authorities that are dependent on receiving that money, so they cannot be unbiased; the same money does not go to skeptical scientists who point out that there is nothing unusual or unprecedented happening, and that the past century has had about the flattest global temperatures of anything in the geologic record.
• Measurement-free assertions. Alarmists cannot produce any measurements of something they insist must be happening, and which they assert will cause catastrophic problems. In other words, they are saying: “Trust us.”
If this debate were in any other field of science, those promoting this kind of failed conjecture would be laughed out of the room, and their funding would be cut off. Why should ‘climate science’ be held to a lower standard?
Menicholas:
Definitely not. There are many factors. The sun, methane, aerosols, water, and so on. All of these matter and are considered.
It does matter to the progression of the climate system though. Similarly, for example, it matters to the sea level whether added water molecules sprang from land or sea ice.
Look at your graph. At the big maximum around 130000 years ago, there is first a small drop where CO2 leads, then a large drop where CO2 lags. Similarly at the slope leading up to that peak it looks as though CO2 starts leading and ends lagging, although at these scales it’s hard to see exactly. However, the number of 8000 years lagging seems to be based only on the part where the arrows are. It definitely does not hold for the rest of the graph. There are many cases where it is really hard to see which of the two is leading or lagging. This has a simple reason, namely that there is not a simple linear relationship between the two. Temperature depends on CO2 and a whole bunch of other factors. CO2 also depends on many things besides temperature. Generally, if you want to see the influence of parameter x on y or vice versa, you have to compare them keeping all other factors stable! This is not true for the period over which the graph was made.
A similar argument holds for dbstealeys runaway global warming questions. Let’s say you are worried about a gas explosion in your house. So you do an experiment where you fill your entire house completely with gas and light a match. Nothing happens. Can you then conclude that if the house does not explode with 100% gas it will definitely not explode with just 50% gas or 20% gas? No, because you ignored the factor oxygen. Similarly a runaway global warming will be triggered not just by a certain level of CO2 but by a combination of all factors. As said before, sun, water, methane etc. all matter.
Just one more example to finish. In his book on data-driven prediction called The Signal and the Noise, Nate Silver gives the example of body weight and caloric intake. If you simply plot those two against each other you would see no good correlation at all. This because you have not taken other variables (age, genetics, types of food and so on) into account. If you were to account for those variables there would be a very clear correlation. So you can’t draw conclusions from plotting one variable against another if you know there are other variables that play a role and have not been kept constant.
🙂
dbstealey:
The premise you state is not a premise but a result. The premise is that CO2 has the properties to influence temperature. Something you agreed on. The statement “that a rise in CO2 emissions will cause grave problems” is a conclusion that some people draw from the results of the prediction.
I don’t think your numbers are very accurate. I happen to know that earthquake research is quite an active field. Also quite a lot of climate research is not on climate change and certainly not on climate change in the last couple of decades. The research that is being done requires a lot less money than for instance looking for new subatomic particles or galaxies far far away. In the end this is all a political choice. I have my opinions, but given my position I will probably be biased and it will definitely not be ethical for me to comment on it here.
The alarmist crowd would argue that is because of them, not despite them. My position remains that you have to take other factors than CO2 into account. CO2 levels from the past will not have the same effect today if some of the other factors differ.
The source is natural, the process is not. Maybe the choice for the word natural was not the best. I mean a process that is not a part of the climate system. Or in other words a process that is not one of the processes that together have regulated the climate to stay within certain boundaries until now. What plants do is part of the Carbon cycle which has its own control mechanisms, or else we would not be here. Burning fossil fuels releases carbon back into the carbon cycle that under regular circumstance would not have been in there for ages, bypassing some of the processes that have helped keep everything within boundaries.
I don’t think you are right. Faster-than-light neutrino’s have not induced the demise of particle physics. DDT has not hampered chemistry, Thalidomide has not stopped funding for medicine. Moreover, the track record for predictions in economics is worse than in climate science. Same for earthquakes.
Aran,
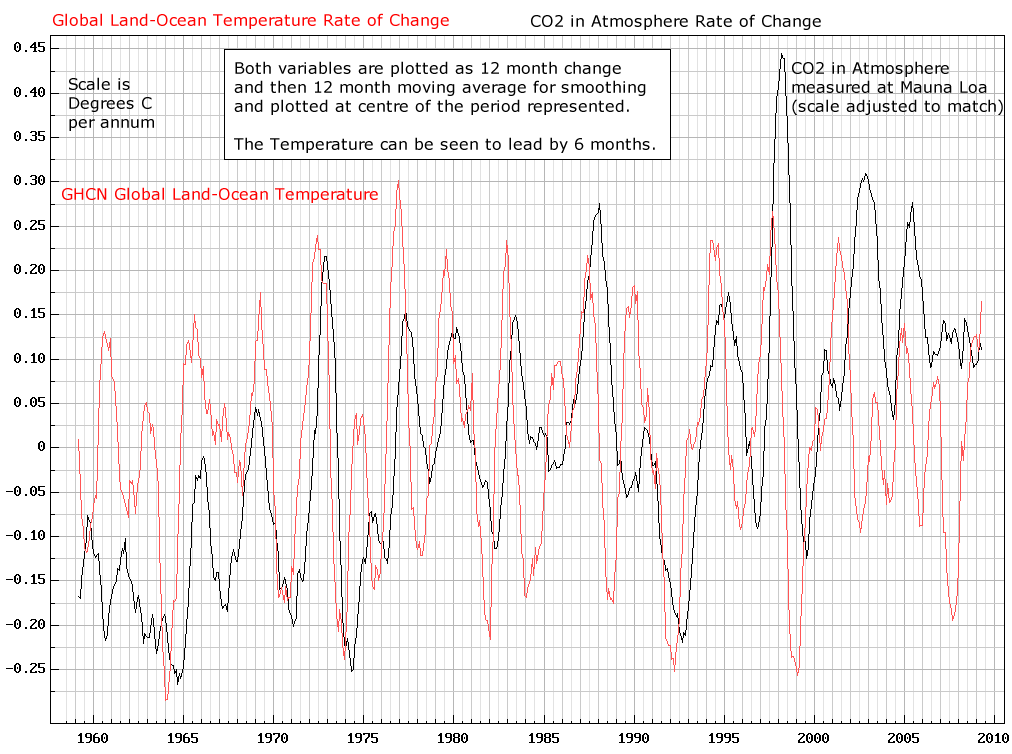
This is a science site, and therefore you need to back up your statements with solid evidence. Otherwise, they are no more than baseless assertion fed by your impenetrable confirmation bias.
You assert that:
Temperature depends on CO2…
Show me a chart verifying that. I’ve never seen a cause-and-effect chart showing what you assert here:
Look at your graph. At the big maximum around 130000 years ago, there is first a small drop where CO2 leads, then a large drop where CO2 lags. And:
However, the number of 8000 years lagging seems to be based only on the part where the arrows are. It definitely does not hold for the rest of the graph.
First, it isn’t my chart. And second, that chart is simply an overlay of CO2 and temperature. Thus, it does not show cause-and-effect. You need to be able to tell the difference. But as you say, maybe you’re too blinded by your ideology and belief to see that on all time scales, from years out to hundreds of millennia, changes in global T cause subsequent changes in CO2; but not vice-versa.
There are dozens of charts like this, showing that ∆T is the cause and ∆CO2 is the effect:
http://www.brighton73.freeserve.co.uk/gw/paleo/400000yearslarge.gif
But there are no similar charts showing that changes in CO2 are the cause of subsequent changes in temperature (T). This applies on all time scales. Here’s another example of cause and effect:
http://www.woodfortrees.org/plot/esrl-co2/isolate:60/mean:12/scale:0.26/plot/hadcrut3vgl/isolate:60/mean:12/from:1958
And here is another showing that ∆T is the cause and ∆CO2 is the effect:
http://www.daviesand.com/Choices/Precautionary_Planning/New_Data/IceCores1.gif
And another:
http://theinconvenientskeptic.com/wp-content/uploads/2010/09/Vostok-CO2.png
And here’s another (click in any chart to embiggen; read the Note in this chart):
And another:
They ALL show that ∆T is the cause of ∆CO2. But there are no charts showing that CO2 causes global warming (a single one-off cherry-picked point proves nothing at all; the consistency of the data shows conclusively that ∆CO2 is being caused by ∆global T). That consistent cause-and-effect relationship between changes in T and subsequent changes in CO2 that follow are alone sufficient to falsify the entire climate alarmists’ conjecture. I do, however, believe I’m trying to explain these facts to a brick wall. There’s no doubt that most other readers can easily see that the climate alarmists’ “dangerous man-made global warming” narrative is based on evidence-free assertions, not on scientific measurements. But when someone’s mind has been colonized by a religious belief, all the facts and evidence in the world will not convince them they’re wrong. Glaciers could descend on Chicago a mile deep again, but they would still be arguing that it’s all due to man-made global warming. Think I’m exaggerating? I’m not.
Next:
I don’t think your numbers are very accurate.
You don’t think so, eh? But you have no numbers! You sound like the folks who ‘don’t think’ men walked on the moon. Your arguments are faith-based assertions like that. You provide no verifiable, testable measurements that would contradict the facts I post. As you admitted:
I have my opinions, but given my position I will probably be biased…
No kidding. Your opinions are heavily biased; they are non-science beliefs, they are not fact based. You add…
…it will definitely not be ethical for me to comment on it here.
We used to call lame excuses like that a ‘cop out’. Why wouldn’t it be ‘ethical’ to make a comment? Are you admitting that you benefit in some way from the climate alarmist narrative? Sure sounds like it.
Next:
CO2 levels from the past will not have the same effect today if some of the other factors differ
Another assertion, which I’ve repeatedly falsified. Everything observed now has happened in the past, yet there has never been any runaway global warming due to CO2. And the recent rise in CO2 has had no measureable effect on global T — the incessant predictions of the alarmist crowd were wrong. All of them. And all the same cycles you listed have happened repeatedly, without CO2 having an effect of any kind. You’re just looking for more confirmation bias to support your belief. But it isn’t there.
Here is another of your assertions:
Burning fossil fuels releases carbon back into the carbon cycle that under regular circumstance would not have been in there for ages, bypassing some of the processes that have helped keep everything within boundaries.
What “boundaries”? Human CO2 emissions were very low until the late 1940’s – 1950’s. Since then, there has been no “fingerprint of AGW” found anywhere. The assertion that the rise in CO2 will caused global harm is completely evidence-free. If you understood how the Scientific Method worked, you would be embarrassed to make that argument without any supporting measurements.
And this nonsense:
Faster-than-light neutrino’s have not induced the demise of particle physics. DDT has not hampered chemistry, Thalidomide has not stopped funding for medicine. Moreover, the track record for predictions in economics is worse than in climate science. Same for earthquakes.
That is just more “Say Anything” pablum. You throw unrelated things against the wall, hoping something sticks. So, by the numbers:
1. $1 billion+ per year is not wasted on FTL “studies”. There is no comparison with the CO2 scare.
2. DDT is proven to work — unlike every alarmist climate prediction; those have all failed. No exceptions.
3. Thalidomide is such a lame comparison I shouldn’t bother commenting on it. But it was the result that caused problems. CO2 emissions cause no problems. They are harmless, while being very beneficial to the biosphere.
4. No, the track record for economics is not worse than climate alarmist predictions. The scary alarmist predictions have been wrong. All of them. No exceptions.
5. Finally, who is claiming they can predict earthquakes, and getting $billions in government grants for their failed predictions? No one. But a small clique of corrupt scientists has been claiming they can predict the future temperature of the planet. They were flat wrong; global warming has stopped.
Aran, your mind is closed tight, and all the common sense and verifiable facts in the world can’t pry it open. MMGW is your religion, there’s no denying it. Wake me when you have verifiable, testable measurements quantifying AGW. Otherwise, your arguments are so weak they’re risible.
dbstealey, first you say:
“that chart is simply an overlay of CO2 and temperature. Thus, it does not show cause-and-effect.
and then you say:
There are dozens of charts like this, showing that ∆T is the cause and ∆CO2 is the effect:
and those charts are all “simply an overlay of CO2 and temperature” which you have just stated do not show cause and effect.
You keep trying to reduce a multivariate problem to a simple linear regression of one variable onto another. It makes me wonder what you are doing on a “science.site”. Pretty much every single post you wrote has contained big scientific errors. Furthermore your post are internally inconsistent.
I’m going to ignore the insulting assumptions about me. You have made too many already. Let me just state that my work is not in climate change research. That the choice how to divide science funding over different fields is a political one, and I am here to discuss science not politics. And yes, since my job does depend on that political choice in general, I would consider it unethical to try to influence public opinion on the matter via a channel like this, and probably so would my employer.
No that is not an assertion and no you have not falsified it. It is a mathematical statement which can be generalised in layman’s terms as: If a system depends on multiple variables, you cannot determine it’s behaviour from only one variable. You compare past temperatures only to CO2. This may be fine when preaching to the converted over here, but as a scientific argument it is hopelessly flawed.
What “boundaries”?
The boundaries in parameter space between which the earth’s climate has fluctuated until now.
Your post continuously show a lack of understanding of basic science, yet you make statements about scientific work with an air of authority unbefitting of a person making such bad mistakes.
Aran,
If your job is political, then you are probably the only one here with a job like that, who is not trying to influence public opinion. Because that is exactly what you’re trying to do: convince by assertion.
See, CAGW is nothing but politics. It certainly isn’t science-based. Any scientific claims of CAGW have been repeatedly debunked by the only Authority that matters: Planet Earth herself.
Next:
…those charts are all “simply an overlay of CO2 and temperature”
Then you don’t understand anything about overlay charts vs charts showing cause and effect. I’ve had this debate with lots of folks, but you’re the first one who has denied outright that the charts I posted show cause and effect. Of course they do. But if you admitted that, then your CO2=CAGW conjecture would be falsified by the real world. So your response is to deny reality. You’re no different from the prevaricators who claim that global warming never stopped, that it’s still chugging alaong as always. heh
For other readers, it’s very easy to look at the charts’ time axes, and see which changes first: T or CO2. They consistently show that temperature changes first, followed by CO2. Even a 5th grader can observe and understand that fact.
Next, you wrote about “cycles”, but now you’re changing to “variables”. I repeat: everything observed now has been observed in the past, and to a greater degree — and ∆CO2 has never caused runaway global warming — or any consistent global warming, really. The few examples are no more than coincidental.
In the recent geologic past, temperatures have fluctuated by TENS of degrees — within a decade or two! If you need something scary to worry about, there’s a real scare. But AGW is not only a non-problem; you can’t even quantify it with a measurement! That is über-lame.
So if you’re scared of a tiny 0.7ºC wiggle over a century and a half, how can any rational person take you seriously? That is as flat a global T as anything in the entire geologic record.
You are trying to fabricate an alarm without a shred of measurable evidence. You desperately want to believe in ‘dangerous MMGW’, but that’s all it is: your belief. The best you can do is to try and claim that I don’t know science, when you don’t know me at all. But you are never able to refute the mountain of data-based charts I’ve posted. Your totally lame response is to assert that the cause-and-effect I have conclusively shown… isn’t, when everyone else can clearly see the cause and effect.
Aran, you are in the thrall of the green eco-religion. It has colonized your mind to the point that your arguments are mere assertions, not backed by measurements, or anything convincing.
Skeptics are the only honest kind of scientists. You are no skeptic; you are a True Believer. Wake me when you can produce a measurement quantifying what you believe must be happening all around us: dangerous man-made global warming. You’re certain it’s there, and that it’s gonna getcha, but you can’t even measure it. How lame is that? I’ve asked you to produce such a measurement about a dozen times now, but you always avoid answering.
The reason is obvious: you’ve got nothin’ but your religious belief, argued with baseless assertions. Scientific skeptics have made fools of the swivel-eyed Chicken Little contingent, for the simple reason that the alarmist cult cannot refute climate skepticism by producing any measurements of AGW. Certainly you can’t do it with your assertions, opinions, and falsified conjectures.
You have made many unscientific errors in these posts. I have pointed some of them out and you have not refuted them.
You continue to insult me.
I have given lots of arguments for my statements, but you tend to ignore them and accuse me of baseless assertions
You seem to have no problems making baseless assertions yourself.
You continuously read badly, and take my quotes out of context.
You repeat yourself, blindly ignoring counterarguments You made an argument comparing T to CO2, I have pointed out several times that this is a simplification of a multivariate system, but you ignore and keep using the same flawed argumentation.
You don’t seem to understand causation or at least you think it can be proven by a simple temporal dependence. You are applying the post hoc ergo propter hoc fallacy. Just because one thing happens after another you claim this proves that one thing causes another. By the same argument I could prove that my alarm clock causes the morning rush hour. By your way of argumentation I could “conclusively show” this to be true by plotting the sound level of my alarm over a chart showing traffic into town. One will precede the other. Post hoc ergo propter hoc.
Aran says:
You have made many unscientific errors in these posts.
May I correct that misinformation? Thank you:
“I have asserted that you have made many unscientific errors in these posts.”
There, now it’s stated correctly. Assertions are the basis for most of your arguments. They take the place of objective facts, observations and measurements. They are opinions, nothing more.
I’ve shown conclusively that on time scales from months to hundreds of thousands of years, changes in CO2 follow changes in global T.
That basic fact alone refutes the alarmist premise that “carbon” must be lowered, because the alarmist contention has been that CO2 is the cause of changes in global T — when it is obviously an effect.
But at this point the alarmist crowd cannot admit that, because they would be admitting that the hated scientific skeptics are right, and the climate alarmists were wrong all along.
As I’ve pointed out repeatedly, the past century and a half has been a true”Goldilocks” climate:
http://butnowyouknow.files.wordpress.com/2009/07/globa-mean-temp.gif
The screaming over a tiny 0.7º wiggle in T over a century and a half is preposterous to rational folks.
The most reprehensible aspect of the debate is the fact that if the alarmist crowd got its way and caused atmospheric CO2 to be lowered to pre-industrial levels, it would cause immense suffering, through malnutrition and starvation, to the one-third of the world’s population that subsists on less than $2 a day.
But the alarmist crowd would rather see millions suffer and starve, rather than admit to what every rational observer knows: the climate alarmists were wrong, and the scientific skeptics of runaway global warming and climate catastrophe were right.
Because really, this is what all the wild-eyed arm waving has been about:
http://4.bp.blogspot.com/-lPGChYUUeuc/VLhzJqwRhtI/AAAAAAAAAS4/ehDtihKNKIw/s1600/GISTemp%2BKelvin%2B01.png
Also, you keep trying to push me into the alarmist corner, but I have made no alarmist claims in this thread. All I did was argue against your bad science, but to you that appears to be the same as being alarmist. Another flawed reasoning, just because I disagree with your argumentation does not mean I agree with them.
Aran,
You are pushing yourself into the alarmist corner, not me. You just commented to Werner Brozek on another thread that global T may well be higher than what even HadCRUT shows. That is also the alarmist claim.
The alarmist crowd has taken the position recently that global warming never really stopped; that it is chugging along as always. You are now making essentially that same argument.
Fact 1: You tried to use calculations for equilibrium conditions to argue about a non-equilibrium condition
Fact 2: You copy/pasted/linked to many cherry-picked graphs, including one of a subset of the data which I had posted earlier
Fact 3: You used the post hoc ergo propter hoc fallacy
Fact 4: You used single measurement accuracy to make an argument against a composite measurement accuracy
Fact 5: You ignored 99.9% of the heat capacity of the earth
Fact 6: You the importance of the ocean as an argument to measure atmosphere temperatures
Fact 7: You tried to use surface area to make an argument about total amount of ice
Fact 8: You use arguments based on long term data, but ignore very important factors such as global wobbling that have been shown to have strong influence on those time scales.
Fact 9: You tried to make a claim about OHC using a graph that did not show OHC
Fact 10: You falsely claimed there is no land ice in the Arctic
There are probably lots more. No opinions
I have said nothing of the kind. I have argued that the error margins on linear regression on RSS and UAH data allow for higher temperature trends than hadcrut. I.e. their linear fit is so uncertain that it allows for very high values. It’s their fit result that is higher. Not global T. You just don’t read properly and keep on twisting my words.
And even if you have misunderstood that statement, you have made so many attempts to push me into the alarmist corner in this thread well before. Don’t deny it.
Well, Aran me boi,
Everything is ‘cherrypicking’ to you that debunks your alarmist nonsense.
Here’s your problem in a nutshell: Planet Earth has been busy falsifying your eco-religious belief system. Global warming stopped many years ago, and there’s not a damn thing you can do about that fact, except emit your usual wrong assertions.
Scientific skeptics of ‘dangerous man-made global warming’ have been flat wrong for 18 years, eight months. And yet, you keep assserting your nonsense, LOL!! That’s pretty much all you ever do. I post lots of verifiable facts and link to empirical measurements, while you give us your opinions. No contest.
It must really suck to be debunked by the real world. But I wouldn’t know, I’m just guessing how you have to be feeling about it.
18 years, 8 months and counting… ☺
dbstealey
“Global warming stopped many years ago”
I totally agree! Global warming stopped many years ago. In the lower troposphere. We will ignore the data sets from other parts of the climate system that do show warming. If they don’t show the same behaviour they must be biased. Even the argo set, often used here at WUWT will probably be biased or overcooked so we will ignore it. We will also ignore the error margins, which must be very big for such an analysis which is close to fitting the noise. But we don’t need to talk about error margins on this science site and if anybody asks we can just call them alarmists. We will also ignore the fact that we have no explanation for this sudden unphysical change and that the moment when global warming stopped (18 years, 8 months ago currently) might change depending on future data. We will claim that planet earth agrees with us, even when we have ignored a data set representing more than 1000x the heat capacity of our data. Should anyone be foolish enough to criticise us we will divert by ignoring their arguments and calling them alarmists.
Aran,
May I translate? Thank you:
“We will ignore everything that contradicts my belief system.”
Short. Concise. True.
I will agree that we can’t see the future. That’s the alarmists’ bailiwick. It doesn’t seem to bother them that their scary predictions have been repeatedly debunked. And of course, thet’s why everyone labels them ‘alarmists’. Because they never say, “Hey, you know what, it turned out that more CO2 is a good thing! I’m very happy that we were so wrong about that. Now we can put that money to better use.”
Desperate arguments usuallly fall back on assertions, and that’s what most of your opinions amount to. That’s why they’re so easy to refute. When you can post verifiable, testable, replicable mesaurements quantifying the fraction of man-made global warming out of all global warming, we can decide if we should worry or not. But until then, all you are doing is arguing via assertion, not understanding that your opinion isn’t worth squat here. We need facts, backed by measureable evidence and data; the things you can never produce.
Yes, that’s an excellent summary of what you do. You ignored data that contradicted your claims and you ignored arguments. The good thing about ignoring arguments is that it allows you to claim i am using baseless assertions.
The statements above are not baseless assertions. You have ignored data from Argo, from land stations (meaning you basically ignored all the land and ocean mass of the earth), from glaciers and ice volume data. When you did reply to these you used bad scientific argumentation. Again this is not an assertion, I have given many arguments for this, I have summarised 10 of them not too long ago and you have, in your true style, ignored those arguments. Instead you diverted by accusing me of alarmism, not based on any alarmist claims I have made, mind you. The only alarm I sounded was the bad science alarm, and I did so based on the mistakes you have made, which I have pointed out.
Furthermore you don’t seem to know your data. This, again I have to stress it apparently, is based on arguments already pointed out earlier. For instance, you showing graphs that show something different from what you claim they show (such as for example with OHC), graphs which only show a subset of the entire data set (such as with the argo data or some of the ice data), trying to argue about amount when showing area data, or trying to argue about a non-equilibrium state using equilibrium calculations and so on. Also you don’t tend to give sources, making it hard or sometimes even impossible to verify exactly what is being shown. It might also give the impression that you have simply googled for graphs showing the behaviour you were looking for, which, as you know very well, would be a very typical example of confirmation bias.
How is this just a local phenomenon? Wouldn’t one expect the oxygen isotope ratios to be well mixed globally? And don’t the Antarctic ice cores agree temporally with the Greenland ice cores?
Well I sure hope the graph posted by Anthony refers to local temperatures. – 30 degrees C doesn’t sound like very comfortable global average.
“Wouldn’t one expect the oxygen isotope ratios to be well mixed globally?”
Just look at the scale. It isn’t -32°C globally.
The scale itself means nothing, it’s only an artifact of the maker of the graph. You didn’t answer my question. Since oxygen isotope ratios are well-mixed globally, shouldn’t the ice core samples represent the global temperature, not the local temperature?
No, the isotope ratios are local, and the fact that hey are given in absolute temperatures shows that. If they were well mixed globally, since they do measure absolute temperature, they would tell nothing.
In fact they are related to a separation that occurred during phase change, usually evap, and reflect the temperature where the water in the ice last evaporated. That is usually local, although where can be an interesting question. I’m not sure how they get to -30°C – maybe that is sublimation.
How can you say the scale means nothing? Seriously, if we can ignore scales on graphs we can make any nonsensical claim seem true.
As for the mixing of isotope ratios I am not sure I believe your statement that they are well-mixed globally. Can you show that? I can easily imagine many processes that would alter isotope ratios locally due to e.g. fractionation.
Nick, aren’t the oxygen ratios related to the ocean temperatures? That’s what the alarmist-controlled Wiki article on the subject states. Is Wiki wrong about this?
Aran, the temperature scale can’t be meaningful. Even Nick Stokes agrees with that. The temperature varies during the course of the year, so any temperature written on the scale is just an estimate of the annual average (or average over a longer period). Hopefully the proxy is correct with respect to the change in temperature, but the absolute zero point of the scale is just a WAG. That’s why global temperatures are stated in anomaly rather than absolute temperatures.
Scarlet,
If the temperature scales were not meaningful, they would not have exact numbers or they would have been stated in arbitrary units or something. But actually we can easily verify what they mean, since Anthony has given the source. They refer to temperatures in Central Greenland in degrees C. I.e. local temperatures. They will definitely be averages over periods longer than a year, since it takes many years for ice to form from snow. At time scales of thousands of years, which is what the original research was about, no one will care about seasonal or even annual fluctuations.
Aran, what you’re missing is that the ice core data do not have temperature measurements with which to correlate. So using (say) the current Central Greenland temperature to match (say) the most recent (last 100 years?) ice core sample is only a guess at what the proxy actually shows. What’s more important is how a change in temperature correlates with a change in O18/O16 ratio, i.e. the anomaly.
But that’s not even the gist of what I’m saying. Your argument was that the proxy was local because it was matched to a local temperature. Whatever temperature the author chose to match with the proxy does not determine whether it is local or global. Oxygen ratios track CO2 concentration remarkably well, albeit with a time lag for CO2. CO2 concentration is a global phenomenon. Even you can’t believe that’s just a coincidence. The oxygen ratios in the ice cores have to be a global temperature proxy because they track the global CO2 concentration.
All this is still based on the assumption that oxygen isotope ratios are close to constant globally. I am not convinced they are.
The ^18O ratio is a measure of the ratio of H2(^18O)/H2(^16O) and depends on the temperature at which the precipitation occurs, it is therefore a local variable.
Mann’s hockey stick is ultimately about one stand of trees in the American Southwest. so the comparison is valid in that it’s comparing one location against another single location.
Neither is valid as a “global temperature proxy” because there is no such thing.
“since firstly it concerns local temperatures rather than overall temperatures” Same as for tree rings, is it not?
Yes
Anthony, sorry to correct you, but SkepticalScience is not run by a cartoonist, it is run by a cartoon.
Mikey suffers from a number of delusions, chief among them being that the attempt to get rid of the Medieval Warm Period was successful, and that “the debate is over”.
I’m so glad that Mikey failed in his attempt to get rid of the Medieval Warm Period. He went through so many fictitious gyrations in his attempt I thought he was going to break his reputation. Oh, wait….
My father used to have a cottage on the west coast of Wales, situated close to the site of an old monastery.
You can still see the terraces there the monks used for growing vines, which according to old records occurred in the years circa 1050-1200. I should imagine the wine these vines produced was not up to Chateau Latour standards, but if you went and experienced the climate there today, you would just laugh at the idea of growing grapes there.
That has been a major point in supporting my belief that the MWP was warmer than today.
Of course, it is always possible that a combination of: i) dodgy statistical methodology, ii) obviously cherry picked data, iii) splicing on unrelated data sets, and iv) the use of a ‘science’ which measures historic precipitation better than temperature (amongst its other many faults) is a better indicator of historic temperature than the archaeological evidence of the monks’ endeavours.
So, Peter, what you are saying is those monks cleverly tricked those grape vines by presenting them with fake temperature data, which made the plants think it was warmer than it really was?
Peter Miller September 23, 2015 at 11:59 pm
My father used to have a cottage on the west coast of Wales, situated close to the site of an old monastery.
You can still see the terraces there the monks used for growing vines, which according to old records occurred in the years circa 1050-1200. I should imagine the wine these vines produced was not up to Chateau Latour standards, but if you went and experienced the climate there today, you would just laugh at the idea of growing grapes there.
That has been a major point in supporting my belief that the MWP was warmer than today.
There are quite a few vineyards in Wales these days, including on the west coast:
http://www.winetrailwales.co.uk/vineyard/llaethliw-estate-vineyard/
http://www.winetrailwales.co.uk/images/vineyards/sub/201309241012381.jpg
A full list can be found here:
http://www.winetrailwales.co.uk
“the debate is over”
and of course “The Science Is Settled” (isn’t it so much more Authoritative with CAPS?)
SkepticalScience.com regularly promotes the idea that the IPCC is not alarmist enough.
They are far from being in line with mainstream science.
It’s a loony fringe blog.
Mann:
“Readers …should consult scientist-run websites like skepticalscience.com…”
Watts:
“Last I heard, skepticalscience.com was run by a cartoonist.”
Perhaps from Manns’ perspective, cartoonists are scientists.
He probably has tree rings to prove it.
I think he only needs one tree ring to prove it, John.
One ring to rule them all
Was Mann there-in the medieval times. He is so sure!
Michael Mann is there presently in Mediaeval Times as far as his thought process is concerned.
Uh… what? How in the world would a single proxy from one area disprove Michael Mann’s claims about the temperature patterns for the entire Northern Hemisphere? Is this post claiming temperatures from a single area can tell us what temperatures for the entire hemisphere were?
Even if it is, how in the world would this proxy, of all proxies, disprove what Mann says? He talks about Medieval times and modern times. This proxy was focused on times something like ten thousand years before medieval times. It doesn’t even have information about temperatures of the last century. How could it possibly disprove anything? Are we supposed to believe temperatures from 10,000 years ago prove temperatures today aren’t warmer than temperatures 1,000 years ago?
I mean, sure, calling John Cook a scientist is silly, and maybe that’d be worth highlighting, but pretty much everything else about this post seems beyond wrong.
I agree Brandon, one single proxy shouldn’t do it. Then again, maybe it’s worth reflecting on “the most influential tree in the world” (YAD061) and see what that one tree did for Mann’s results/conclusions.
Michael Jankowski, I don’t know how I could reflect on that tree “and see what that one tree did for Mann’s results/conclusions” given that tree wasn’t even used by Michael Mann. I’ve been seeing a lot of people talk about how important that tree was for Mann’s work. I don’t know where they got that idea. He didn’t even use it.
I don’t know if it’s just coincidence, but I’ve been seeing more people make that mistake ever since Mark Steyn’s book came out. I don’t remember him making the claim in his book, but perhaps I missed it? Or is there maybe some other explanation? Where are you guys getting this idea from?
Michael J,
Yes, just one treemometer was enough:
One sample is always enough to confirm your belief, if your confirmation bias is in high gear.
(And yes, Brandon, that was Briffa’s treemometer, not Mann’s. But it exemplifies the kind of shenanigans the alarmist clique typically uses.)
hI Brandon Shollenberger
Kievan Rus was destroyed in a winter Campaign in the 13th century by the Mongols. The latter stages of the medieval warming. proxy shmoxy try doing that with a cavalry army in todays winter climate
Oh oops I forgot Genghis Mann would lead
Brandon all in good fun
michael
well, since for periods of time mann reconstruction is dependent on a single tree in yamal, i dont see that his conclusion couldn’t be undermined by the same type of anecdotal evidence used to support his claim, no?
Not that an ice core isn’t as unreliable a single TREE, but it is a geographically disrupt point , there is that….
There isn’t a single period of time in which Michael Mann’s reconstruction “is dependent on a single tree in yamal.” The Northe American PC1 is always present in his reconstruction, and it is always sufficient to give him a hockey stick shaped reconstruction. The only thing the Yamal series is necessary for is to give some semblance of robustness to his reconstruction by letting him say his reconstruction isn’t dependent entirely upon a single proxy (and by allowing him to come up with a bizarre adjustment for the NOAMER PC1 proxy in the 1000-1400 AD period).
I don’t know where you’re getting your information from, but somebody is giving you bad information. I suggest you stop listening to them.
.”The only thing the Yamal series is necessary for is to give some semblance of robustness to his reconstruction by letting him say his reconstruction isn’t dependent entirely upon a single proxy (and by allowing him to come up with a bizarre adjustment for the NOAMER PC1 proxy in the 1000-1400 AD period).”
yet in an earlier post you imply than mann didn’t use this proxy, no?
I mean here are your own words:
“Michael Jankowski, I don’t know how I could reflect on that tree “and see what that one tree did for Mann’s results/conclusions” given that tree wasn’t even used by Michael Mann.”
so brandon, which of your responses should we depend on as representing your position?
“…the tree wasnt even used by Michael Mann” or
“”The only thing the Yamal series is necessary for is to give some semblance of robustness to his reconstruction”
These are two comments from you separated by less than one screen…I didn’t write them, you did, on the same effing day Brandon.
do you even bother to keep up with what it is that you write?
its sad really. Just sad.
davideisenstadt:
Uh… yeah. Sorry, my bad. I had a brain fart. For a minute I mixed up Yamal and Gaspe and thought the your comment had some semblance of a real point. It didn’t. Yamal wasn’t used in Michael Mann’s work at all, for any purpose. You weren’t just wrong to say it was the only proxy Mann’s work depended upon for a certain period. You were wrong to say it was used at all.
And I was wrong to fail to point that out. I shouldn’t have said Yamal was used at all. It wasn’t. My bad. For whatever reason, I mixed up Yamal and Gaspe for a moment and thought your comment was less wrong than it actually was. So to be clear, what you said was completely wrong, not just mostly wrong like I said.
I’m sorry for failing to notice your comment was so wrong it had no connection to reality. I shouldn’t have thought what you said had any truth to it at all. To be clear, Mann’s hockey stick did not use Yamal.
Brandon,
When you say “Sorry…”, it is insincere if you try to turn it around and attack the person who pointed out your error.
dbstealey:
That was the point. I do sincerely regret that I made the mistake, but the mistake I made was merely that I failed to realize how utterly wrong that person’s first comment was. That he wants to mock me over me failing to realize how wrong he was is laughable.
If he hadn’t made the initial comment that was completely wrong, or if he hadn’t been incredibly rude when he pointed out my mistake, I wouldn’t have been hostile when I responded. But given the rudeness of his response over what ultimately was me not realizing how wrong he had originally been, I think he didn’t deserve any kindness.
As for attacking people, I’m generally not very hostile, but sometimes a bit of hostility is appropriate. Besides, this site seems to encourage it, so… eh.
I have a policy of not conversing with hostile people. I find it unproductive and a waste of time. And I think hostility during what is basically a casual conversation is disgusting, abhorrent and appalling.
So forget about what I said above…I am no longer going to burden myself with pure thoughts, against the day that you will grace me with your engagement. In fact, I am going to paste a very rude sneer to my ugly mug whenever I read one of your comments, Brandon.
*sniff*
*Bruce Lee neck snap and curl*
“Northe American PC1 is always present in his reconstruction, and it is always sufficient to give him a hockey stick shaped reconstruction”
So, Greenland is “local”, but North America is not? Is that what you are saying? Just to be clear?
The flip side would be… does this proxy prove what Mann says? Do temps from 10,000 yrs ago prove that temps now are warmer than 1,000 yrs ago?
Not only no, but hell no! As we say in Texas.
Since Brandon posited the opposite (flip side) of my ludicrous inquiries and called them also wrong, maybe we can just forget about it and go watch OSU vs Texas, this weekend.
Well seeing as how Mann felt alright about his rigged/faked/cheated tree ring data was useful in predicting the temperature of an entire hemisphere…then why can’t we indulge in the same shite science?
Brandon, can you tell us exactly what Mann used for his proxy? Also can you explain how it represents what you claim it does.
I think Steve McIntyre dismantled Mann’s results quite thoroughly as well as showing that most of his proxies depend on one or more of up to four faulty trees or measurements. As well those who claim to have done “independent” studies also used the same faulty objects which are amplifies to obscure the other objects.
Gerald Machnee:
Can I… what? What do you mean by “proxy” Michael Mann used over a hundred different proxies for his first reconstruction, with different subsets being used for different periods. But I don’t know what you mean when you ask me to “explain how it represents what you claim it does” since, as far as I know, I haven’t claimed it actually represents anything. Mann certainly claims it represents the temperatures of the northern hemisphere, but that he claims it does not make it true.
Um… no. What you’re probably thinking of is proxies, or prehaps tree rings series. More than one tree can go into making those. If I remember right, the actual count of trees that are responsible for Mann’s original hockey stick is something like 16. As far as actual proxies go though, it’s only two: NOAMER PC1 and Gaspe. And Gaspe really shouldn’t count since it is a tree ring series already included in the NOAMER network.
You seem to be operating under the illusion I somehow think Mann’s work is good or accurate or at least not complete garbage. Let me disabuse you of that notion. I think Mann’s work is fraudulent, and I’ve even written two short eBooks as introductory guides for people to understand the facts of the hockey stick debate. You can find them here and here. (Free copies are available on request)
But the fact I think Mann’s work is wrong and even fraudulent does not mean I am going to ignore false criticisms of his work. If anything, it means the opposite. Because I want the case against Mann to be taken seriously, I want people to stop making bad arguments about his work. That is the only way the real arguments will get heard.
One of the primary reasons Mann has gotten away with as much as he has is because people keep making bad arguments he can easily shoot down. Bad arguments give your opponents ammunition. It’s that simple.
As I stated above, Mann’s hockey stick is ultimately about one stand of trees in the American Southwest, not the entire North American continent. His bristlecone proxy is so grossly overweighted it drowns out everything else, which is what Mann wanted. So essentially one ice core is as representative of one location as Mann’s Hockey Stick is to one location. Beyond that, pretty useless.
I forgot to add; Bristlecone Pines are an extremely poor temperature proxy, so Mann’s HS is worse than useless.
Jeff Alberts, because of the number of comments above yours, I can’t tell which comment yours is in response to (I wish the nesting on this site was clearer), but it looks like it might be in response to my comment. If so, I could somewhat agree. The problem is even though one proxy dominates Michael Mann’s reconstruction’s shape, the reconstruction as a whole doesn’t have the same size/variance as the proxy. Comparing the NOAMER PC1 directly to the temperature record would give a different picture than comparing Mann’s reconstruction to it. This post would be akin to doing the former, not the latter.
Even if we ignore that though, I don’t see that a person making an error justifies making the same error yourself. The post could said something like, “Since Mann’s conclusions are dependent entirely on NOAMER PC1, it’s no better than if we use a single proxy from one location like…” In that case, I wouldn’t have complained. I might not have fully agreed with the comparison, but with the details of the comparison being explained to the reader, I’d have accepted it as at least a somewhat reasonable depiction.
Brandon, I think we agree. My point was that using one set of ice cores for global temperature is as ludicrous as Mann’s recon, due to his purposeful gross overweighting of a single proxy. But, neither is as ludicrous as thinking there is a global temperature in the first place.
Ah, the myth of the “global temperature.”
If you want to have some fun, stack all the temperature reconstructions since 1950 on the same graph.
Then take the raw proxies, and plot them.
Now tell me the Flying Spaghetti Monster isn’t a real god with millions of worshippers!
“…Let’s get past the fake debate about whether the problem exists, and on to the worthy debate about what to do about it…”
Putting aside that the debate really has always been about how much warming that we really control and therefore how much we can “do about it”…I guess it’s time for him to resign from his post and find another field of study to do research.
With respect to the ice core graph, what exactly is the y axis measuring? It’s graduated from -32.5 to -28.5 deg C. What is the zero point?
That would be, and I am just guessing here, 0.0 degrees Celsius.
Sure, but deg C of what, the annual average temperature of central Greenland, or something else?
Yes, I would also guess it was the temp at the ice core site. It was mentioned that bore hole temps were used and some other methods. These would only be applicable to the actual location of the testing.
Except data such as isotope ratios, which should be a broader measure.
As I recall, the Antarctic ice cores were correlated/calibrated with benthic forams and other such proxies, in order to draw a more global correlation.
He is *still* pushing his failed MWP disappearing act?
How pathetic.
There would be no debate about the temperature record of the last 2000 years, if we had used that $18B of AGW research money to study natural climate change. That is a *lot* of tree ring counting (and ice cores and Viking campsite analysis and sea shell studies and pollen studies…)
…or brought the proxies up-to-date.
I see one of MrManns sycophants is present today! Go visit the east coast in Canada and count the vineyards in the Viking Vineland! Go visit the roman winery up by Hadrians wall! It’s just grows heather on moorland now! The ice cores are consistent compared to three trees that gave Mann the phoney hockey stick! Wait wasn’t that modern( if adjusted) thermometer readings glued on the historic proxies?
Here’re photos of a vineyard in Newfoundland:
http://www.dccw.ca/vineyardpictures.htm
The commander at Vindolanda on Hadrian’s Wall imported his wine from Gaul, no evidence of wine growing near there, currently many vineyards in the UK.
Evidence from wine amphorae remains indicates that the wine consumed by the roman troops in Britain was mainly Gallic and some from Rhodes.
Anthony, you know damn well that, as has been pointed out over, and over and over that the graph at the top of this post ends in 1855. I really think that Mann ought to name you as a co-defendant.
Does not Dr Mann have enough troubles without you adding more?
unless you are willing to pony up the costs,fees and restitution Dr Mann may have to pay?
Note to all Dr Mann made his bed and now he will have to sleep in it. He has hurt to many people, he needs no more enemies.
michael
See the update to the post.
Your updates above are inadequate. As Brandon S points out, you have splice 20th century Greenland instrumental records, not the entire 20th century record – apple to apples. Brandon claims 2-3 degrees of warming for 20th century Greenland. I took him up on his challenge, found what looked to be closer to 2 degrees warmer, but could not locate anything conclusive.
I’ve studied his posts and read his blog and Brandon believes words matter. He goes to great lengths to point out their misuse. Above, he writes:
“And if you look up Greenland’s temperatures, you’ll find it has warmed by 2-3 degrees. That means by your own argument, this proxy actually supports Mann’s claim.”
Mann claims:
“overall warmth of the globe and northern hemisphere today is substantially greater than during Medieval time”
Two degrees warming would make the Modern Warm Period comparable to the Medieval Warm Period not substantially greater. So um, Brandon, no. If so, it would not support Mann’s claim.
However, I would like to see and apples to apples splice.
Ockham, I think one of us must be missing something. The last point on the graph is just below -31.50. The point labeled “Medieval Warming is just above -30.50. Two degrees of warming would be more than enough to bring just below -31.50 to a point “substantially greater than” just above -31.50. Could you tell us what numbers you use to estimate that the two periods would only be “comparable”?
Brandon,
Even with massive warming adjustments, the CET has yet to record a 50 year period as warm as many such intervals during the Medieval Warming Period.
Brandon,
It is you that made the claim that modern Greenland warming is in the 2-3 degree range. Since you made the claim, the burden of proof is on you. Please point me/us to a link. I am more than happy to accept the verdict that the the data points to.
…and Brandon of course fails to not that even if modern warming surface record showed today as warmer then the MWP (It does not by the way and many peer reviewed reports indicate the MWP was as warm or warmer then today) is would be meaningless because the ice core proxy shows nothing about short decadal periods of warmth.
Ockham’s Phaser:
I’m confused. Are you the “Ockham” who previously commented, commenting under a different name? If so, you said two degrees of warming wouldn’t be enough to support what I said. In that case, why would me providing a link which shows two degrees of warming now help?
I don’t get why it would, but if it would help, the easiest to access link I know of is on Berkeley Earth’s website, as it lets you look up temperatures by things like country. Here are there results for Greenland. Anyone who’s followed my blog will know I’m a harsh critic of BEST, those results mesh reasonably well with what I’ve seen when I’ve looked at the individual stations. I don’t actually like using that interface though, as I much prefer using gridded results. I just don’t know of a quick way for people to access those on their own, so I’d have to generate graphs with each data set if I wanted to show the results. All of them seem to show ~2 or more degrees of warming since 1855 though.
David A:
If you actually look at the comment of mine Ockham refers to, you’ll see I didn’t endorse the numbers he refers to as being meaningful. I just pointed out what they were to show one problem with the comparison being made. That means you’re effectively complaining that I failed to note this comparison is wrong in even more ways than the one I drew attention to.
It’s not my fault if people like Watts chose to compare the modern instrumental record to a proxy record, and I don’t have to list all the problems with making such comparisons in order to discuss one of the problems. If you have a problem with the comparisons, take it up with the people who are actually making the comparisons as though they are meaningful – like the one who wrote this post.
Lady Gaiagaia
“Even with massive warming adjustments, the CET has yet to record a 50 year period as warm as many such intervals during the Medieval Warming Period.”
__________________
The warmest 50 year (600 month) period in CET, which starts in 1659, is the one just ended in August 2015. What are you comparing the CET record against re MWP proxy data?
Dr. Mann has done something good! He turned me into a skeptic. One of my hobbies is history and on that basis I knew that the hockey stick was junk science because it contradicts the historical record.
Steyn’s A Disgrace to the Profession is still doing well:
If you haven’t done so yet please buy a copy. It will help support Steyn in his lawsuit with Mann. It also gives plenty of evidence in the case that you are talking to someone who still believes in the hockey stick.
Don’t worry, history will soon be “adjusted.”
Michael Mann says: “overall warmth of the globe and northern hemisphere today is substantially greater than during Medieval time”
I assume Mann has evidence for his statement other than just his ‘expert’ opinion. Are his data and methods in the public domain, or have they been kept proprietary? Unless they are available so other scientists can replicate and verify his conclusions, they mean nothing.
I read skepticalscience.com now and again. It always gives me a laugh, it is like an elementary school newspaper group.
Now THAT was disrespectful of Elementary School newspapers everywhere.
Although, I haven’t been to skepticalscience in a long time, perhaps they have elevated themselves?
My favorite entry is the one that says since climate models can hindcast to models of the temperature data, there’s no reason to think the climate models can’t predict the actual future of real temperatures, even though the actual record of climate models predicting real temperatures is one of nearly unmitigated failure.
The first hit on a web search for proxy’s that validate the MWP being global said “do not cite or quote”. It did confirm the MWP being global. The second one I looked at also confirms this.
Proxy climatic and environmental changes of the past 1000 years
W Soon, S Baliunas
I think archaeological finds that strongly suggest that it has been warmer than the present are good enough evidence for a reasonable person. Check my site where I talk about Gården under Sandet and Schnidejoch in Switzerland as well as “Links to illustrate the Globalness of the Medieval Warm Period and other Warmings”
Cheers
Roger
http://www.rogerfromnewzealand.wordpress.com
Has Mikey taken any legal action against Steyn or the publishers of his book?
Funny!
When it comes to Dr Michael Mann, I think people should first familiarise themselves with what too many scientists have had to say about Mann, before paying any attention to anything Mann has to say or paying any attention to the work of Mann. It’s all laid out clearly in the book, “A Disgrace to the Profession”.
Based on what is exposed in this book about Mann, one can come draw one conclusion … he does not do science in accordance with the scientific method, his work cannot be trusted, and he should be stripped of the letters after his name.
Dr Tim Ball, however, best summed it up when he said that Mann should be in the state pen, not Penn State.
That period of time was likely set up by a climate regime shift (which I like to call a weather pattern variation) that triggered oceanic-atmospheric patterns that included warmer and colder regions. The warmer regions, as well as the colder regions, defined that period of time. Therefore if evidence is sought to substantiate a global pattern of warmth by finding warmth everywhere, you will likely not find it. Today, oscillations whereby El Ninos are more prevalent will set up fairly well defined warm and cold areas. I don’t see any reason why the Medieval past would be any different. Mann attributes a lack of warmth in some areas of the globe as a non-global pattern when in fact it was global: some areas would be warmer and some areas would be colder during the Medieval Warm Period.
The W Soon, S Baliunas paper I referenced found just that. They looked at all the proxy’s and found a wide range but over all generally warmer.
Wrong as wrong can possibly be.
The MWP was demonstrably global, as was the LIA and the warm and cool periods before them.
How does it feel to be in bed with Mikey Mann?
Based on your count, my bed is getting crowded. Are you sure there is room?
And just as an additional thought, your presence here is degrading the blog. Your tawdry comments are wearing thin with me.
Who besides Mikey and his fellow unindicted co-conspirators is in there with you?
You may find it tawdry, but it’s a common expression.
So how does Mann explain how Vikings were farming in Greenland for many years in the MWP in about 1000 AD in places where such is nearly impossible today?
Ask Brandon, maybe he will converse with you. Me, not so much.
Hiding under his desk.
I think he sicced Aran on me instead.
Just goes to show how tough those Vikings were, right? They heated their houses without wood too.
Only a few years ago, substantial tree roots were found in the permafrost in an area outside present communities and where trees do not now grow. And this was carbon dated to the MWP. Clear evidence that the MWP in southern Greenland was warmer than today?
Tsk they seem to ignore me Menicholas, I try to tell people like Napoleon Bonaparte said study the Campaigns, if the same type of army could not move today then guess what, things had to be different at the time.
Look at at when things like sleds were in wide use, and not. Oh and sleds are fun for confirming the LIA. Its just that the other side is so ignorant of history.
michael
Comment snobs!
Oh well, what are you gonna do?
He hates climate whistleblowers.it would seem.
But his mock outrage fools no one.
A 2013 paper concluding that the MWP was worldwide, with temperatures warmer than today’s.
http://m.sciencemag.org/content/342/6158/617
Abstract
Observed increases in ocean heat content (OHC) and temperature are robust indicators of global warming during the past several decades. We used high-resolution proxy records from sediment cores to extend these observations in the Pacific 10,000 years beyond the instrumental record. We show that water masses linked to North Pacific and Antarctic intermediate waters were warmer by 2.1 ± 0.4°C and 1.5 ± 0.4°C, respectively, during the middle Holocene Thermal Maximum than over the past century. Both water masses were ~0.9°C warmer during the Medieval Warm period than during the Little Ice Age and ~0.65° warmer than in recent decades. Although documented changes in global surface temperatures during the Holocene and Common era are relatively small, the concomitant changes in OHC are large.
It really is interesting the number of petulant rants that conflate the last measured ice core with the time scale being used. Allow me to instruct: BP on the time scale means before present it is not a particularly good way to scale a scientific paper since the present keeps slipping into the future but there are apparently some who think of it as some kind of endorsement (and it was at the time of its adoption) to have measurement of years zero on the birth of Christ which apparently some group of anthropologists deem cannot be allowed. It would be simpler to take all annul time scales using that zero and the Modern Roman Calender as the metric simply for the convenience and simplicity of having the “scientific” calendar correspond to the one everyone uses every day. It would put everybody on the same page when comparing medieval dates and scientific research and minimize the number of knuckleheads who conflate the difference between the two and start climbing on their soap boxes about how the last measurement was recorded for 1855, 1905, 1950, 95AD. 200, 180, 50 years ago! A lot of sound and fury over nothing. Look at the graph of the last 10,000 years Mann’s “hockey stick” is nothing EVEN IF HE DIDN’T COOK IT UP!
“BP on the time scale means before present it is not a particularly good way to scale a scientific paper since the present keeps slipping into the future”
I’ve read that “Present” means 1950, because after that nuclear fallout threw off dating procedures.
You may be right… that only makes it goofier (yes that is a technical term) to treat 1950 as the “marker of present” like I said ther was some silly objection to using the 0 year as the traditional birth of Christ without even getting into whether or not some carpenter in Nazareth was actually born on that agreed upon date!
Adopting 1950 as ‘present’ was a standardization in the early 50’s for the new field of radiocarbon dating, calibration is done relative to standard samples of 1950 oxalic acid. This has been standard notation for 60 years and is understood in the field.
By the way no one used the ‘0 year’ as the traditional birth year of Christ, they used 1 AD there being no zero in the latin numbering system, the year 1BC is the year before 1AD, there is no year zero in the calendar.
“Let’s get past the fake debate about whether the problem exists, and on to the worthy debate about what to do about it.”
Hilarious Mikey, we’ve been shredding birds and destroying the environment for 10 years now to create the facade that props up your fraudulent science with vile unworthy actions.
Combatting climate change – zero parts per million at a time:
http://www.lastwordonnothing.com/wp-content/uploads/2015/03/keeling.jpg
… and by the way Mikey, if there was really something that needed to be done about it, it would be the grown-ups doing it, not you.
Dr. Patrick Moore 4 min YouTube on CO2 http://youtu.be/WDWEjSDYfxc
Here is a 2006 study from Jones, Briffa etc that shows Greenland temps were higher in the 1930s to 40s than 2000. Remember we were told that the Co2 impact would be after 1950. But other studies show that Greenland was warmer during the earlier Holocene and certainly much warmer during the Eemian interglacial.
And the Pages 2K study also found that Antarctica was warmer than today from 141 AD to 1250 AD . The 1250 date fits well for a Med WP as well. Here is an interesting section of the Jones, Briffa study———–
“However, of greater importance is the fact that the researchers found the warmest year on record to be 1941, while the 1930s and 1940s are the warmest decades on record. This represents very bad news for climate change alarmists, since the warmest period was NOT the last quarter of the 20th century. In fact, the last two decades of the 20th century (1981-1990 and 1991-2000) were colder across the study area than any of the previous six decades, dating back to the 1900s and 1910s (Table 1). When examining the instrumental records of the stations it is apparent that no net warming has occurred since the warm period of the 1930s and 1940s (Figure 1).”
http://www.worldclimatereport.com/index.php/2006/11/17/cooling-the-debate-a-longer-record-of-greenland-air-temperature/
The consensus answer to “what to do about it” is “reduce fossil fuel emissions”. That would work only if the rate of warming were correlated with the rate of fossil fuel emissions in the post industrial age at the consensus time scale at which emissions are supposed to drive warming; but no such correlation could be found in the data for the sample period 1850-2014.
http://papers.ssrn.com/sol3/papers.cfm?abstract_id=2662870
The hope here is that everyone will FEEL warmer from arguing and adding Ocean temperatures that only those who rule the waves can record, will add more warmth above that.
If something were to be done about a supposed rise in Earth’s temperature, they should start up coal mines in the northeast and producing goods next to where they are consumed. Not shipping oil and goods all the way from China and the middle east to the U.S. But that’s not AGW’s mission. It is to seal in place global investments in China and the middle east, by locking in a cooler any production startups in the west.
This report from co2 Science also looks at the 2006 study on Greenland temps. Here is their summary——–
A 221-Year Temperature History of the Southwest Coast of Greenland Reference
Vinther, B.M., Andersen, K.K., Jones, P.D., Briffa, K.R. and Cappelen, J. 2006. Extending Greenland temperature records into the late eighteenth century. Journal of Geophysical Research 111: 10.1029/2005JD006810.
What was done
Combining early observational records from 13 locations along the southern and western coasts of Greenland, the authors extended the overall temperature history of the region – which stretches from approximately 60 to 73°N latitude – all the way back to AD 1784, adding temperatures for 74 complete winters and 52 complete summers to what was previously available to the public.
What was learned
In the words of the authors, “two distinct cold periods, following the 1809 ‘unidentified’ volcanic eruption and the eruption of Tambora in 1815, [made] the 1810s the coldest decade on record.” The warmest period, however, was not the last quarter century, when climate alarmists claim the earth experienced a warming that was unprecedented over the past two millennia. Rather, as Vinther et al. report, “the warmest year in the extended Greenland temperature record [was] 1941, while the 1930s and 1940s [were] the warmest decades.” In fact, their newly-lengthened record reveals there has been no net warming of the region over the last 75 years!
What it means
With approximately half the study region located above the Arctic Circle (where CO2-induced global warming is suggested by climate models to be most evident and earliest expressed), one would expect to see southwestern coastal Greenland’s air temperature responding vigorously to the 75-ppm increase in the atmosphere’s CO2 concentration that has occurred since 1930, even if the models were only half-way correct. However, there has been no net change in air temperature there in response to the 25% increase in the air’s CO2 content experienced over that period. And this is the region the world’s climate alarmists refer to as a climatological canary in a coal mine??? If it is, real-world data suggest that the greenhouse effect of CO2 has been hugely overestimated.
The glaciers in Glacier National Park are only about 3k old. This used to be prominent on the official National Park Web Site. Now it’s hard to find this info.
The Ice Man melted out of the alps. But when he first got trapped in the ice, it was much warmer.
Examples like this are throughout the globe. Both Ice Cores, sediment proxies, pollen proxies, sea level at archaeological sites and historical documents all show the earth has been much warmer than now in the past. While our current uptick coming out of the little ice age is not as high as prior upticks, our overall trend when you smooth all this information is we are still on our inevitable descent back to our normal ice age conditions.
Now that descent and how fast it will occur and when will it occur is very worthy of actual climate science to study. All this silliness for a political agenda or greed tainting true science, to me, is in the same category of creation science. Agenda’s don’t mix well with true science. The IPCC by definition is an agenda whose purpose is to taint science.
Reading these little ‘missing the forest for the trees’ comments by people stating things like Greenland is a single location so can’t be relevant to global climate history, need to get their heads out of the sand. All the information is consistent and self reinforcing in the paleo-climate world. It’s not even really in dispute in the paleo-climate field itself.
We are well within natural variation, CO2 is not a thermostat, and we are heading to a return of the normal temps as our little break from full ice age conditions will come to a close.
I predict peoples’ names in the forefront of this agenda based science, long term, will become new adjectives in the English language (like your name is Mudd did for instance). You can have a lot of fun playing with this idea, but I won’t here.
I expect increasing levels of craziness as the Paris conference arrives at the same time models and reality continue to diverge.
(and also to see people here nit picking non-points to continue their sheep like belief systems)
Mr Mason, you are one of my new favorite commenters.
I especially like the part about people’s names being immortalized…as I have made this same prediction myself.
Some people’s names are definitely going to go into the crapper…the Thomas Crapper.
Thank you.
The Ice man died approximately 5100 years before present (~3150 BCE) so he was buried in ice in springtime here:
Why do you say it was warmer then?
I would hazard that skepticalscience.com is run by a idiot. A Cartoonist is much more educated and knowledgeable, and has talent, which the idiot has demonstrated he/she is severally lacking of such qualities, like the IPCC and the UN.
Ha ha
well you can go to the site itself and read from the horses mouth that he’s a failed physics student that didn’t pursue a career in science out of …laziness!
Yes, but have we not learnt that the southern hemisphere’s foremost bastion of scientific accumen has awarded him some honorary something or other?
No matter what, I am not buying a bike.
All I can see is the undermining of our civilization by a bunch of wacko greens that are flying in jet planes or being driven in limos, staying at expensive resorts all over the planet or living in huge homes or on private islands and we are paying for this scam.
But they are the ranchers and you and I are merely the cattle. Get back in your place in the herd, troublemaker./sarc
Although also affected by extraneous factors the tree line would seem to be a more reliable temperature proxy than tree growth rings:
“To begin, we outline the present climate–treeline relations across northern Eurasia. We then present evidence that temperature increases over the past century are already producing demonstrable changes in the population density of trees, but these changes have not yet generated an extension of conifer species’ limits to or beyond the former positions occupied during the Medieval Warm period (MWP: ca AD 800–1300) or the Holocene Thermal Maximum treeline extension (HTM: broadly taken here to be ca 10 000–3000 years ago) …” (G.M MacDonald, K.V Kremenetski, D.W Beilman).
http://rstb.royalsocietypublishing.org/content/363/1501/2283
The paper’s abstract goes on to genuflect to the dogma by speculating about “the future position of the treeline due to global warming”, but concludes: “Given the slow rate of northward forest extension observed thus far, coupled with the climatic, edaphic and ecological factors outlined above, it is difficult to envision that the anticipated northward forest expansion and development of new forest communities as projected by model experiments such as that presented in the Arctic Climate Impact Assessment (2004) would be completed by AD 2100”.
If you want to compare Greenland temps thousands of years ago to present, I guess your best data is Kobashi et al 2011.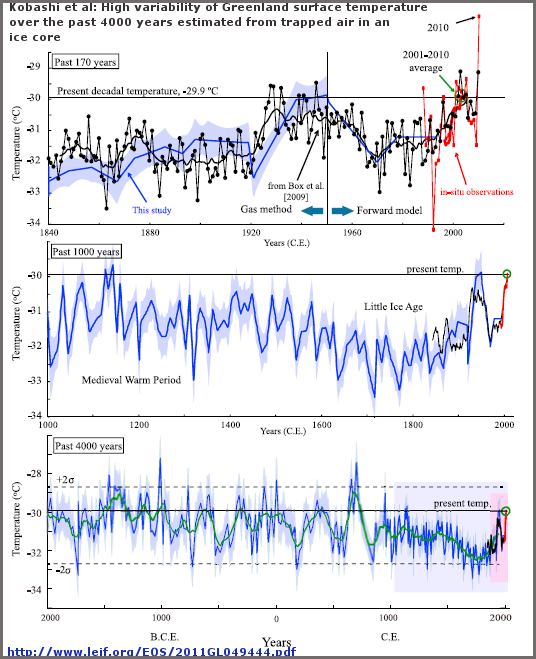

And, if you compare Kobashi to Alley’s temperatures in Greenland, you get something like this:
One wonders why Pennsylvania State University is spending $1,000,000 dollars per month to “protect Michael E. Mann” from the student population? Could it be that Penn State U. is protecting the student population for Michael E. Mann? Pennsylvania tax payers might just want to ask the Pennsylvania Legislature why their tax dollars are going to Michael E. Mann.
Re temperatures in Greenland in the MwP; here is a CNN 2012 report which says
“Eric the Red sailed to Greenland in a small wooden boat, but nowadays the area around Greenland is covered all year with pack ice and icebergs. It would have been impossible for him to penetrate the ice fields around Greenland with the vessels of the day.”
http://edition.cnn.com/2012/12/04/world/greenland-secrets/
So, confirmation, independent of the ice cores.
So true.
“Climate science” (anti-science) naturally ignores the evidence of documentary sources.
Schweinhunden!
The modern definitions:
A “skeptic”: someone who bases their views on the evidence, not “consensus”.
A “Scientist”: someone paid by the government to prove skeptics wrong.
I make the point about the absence of contrarian advertising In my Notes From Skull Island. It lists nearly 20 things that we climate contrarians (“skeptic” is too mild a term) would be doing differently, including more ads, if we were in fact well organized and well funded:
http://wattsupwiththat.com/2012/12/16/notes-from-skull-island-why-skeptics-arent-well-funded-and-well-organized/
I would really like to see some of this “fossil-fuel industry-funded climate change denial propaganda”. Can anybody point me to anything? Anything at all?
When reason fails only the extreme remains.
Mann never mentions the ice core data, because that’s a data set cared for by real scientists and therefore can’t be manipulated by him.
The ice core graph also shows that the next ice age may be just around the corner.
I’ve read thousands of words on this blog, looking for the blog’s purpose. There are 15 to 20 regulars, of which I’d guess about 80% are skeptical about climate change. Those 80% are in the same choir and yet nothing seems to get decided. With so much unity, I would think that someone would start a movement to stop spending money to prove a point, that maybe can’t be proven. Is there a skeptics movement some where? Does anybody write their congressmen or senators? If not, again I ask, what’s the purpose of this blog? Do you just enjoy writing to each other?
You’re confusing the blog with the comments section. It’s like judging the Superbowl’s value based on the half-time entertainment. Sure the dancing boobs are a nice bonus but hardly the point of the exercise.
Do you just enjoy writing to each other?
Sure do.
Bobthebear:
Yes I do write my elected officials, if only to keep them from making public comments about something they don’t understand. I frequently let them know when they are being spun by folks from the EPA and Green NGOs.
One of the things about science and folks dedicated to it even as a hobby, is that we look for data and proper analysis. When someone comes out with dead certainty about something we tend to look for the error analysis, data handling and methodology. If any of those don’t pass the smell test we tend to knock it about. We would do the same if someone published a global proxy tomorrow showing an ice age commencing as we do the thermageddon papers. If the data, methodology and error bars support the statistical analysis we would get worried. Hobbyists are replicators by nature. We try to reproduce the work the professionals are doing as much to understand what they are thinking as to debunk anything. Since we can’t afford the equipment the grant funded science centers get to play with, we have to use their data as our starting point. The problem is many of them are not confident enough in their conclusions to share the data – After all, we are just going to try to find something wrong with it! Science without replication is not science at all, but faith. I trust Maxwell’s equations because I have measured many of the results by replicating his experiments. They seem to hold in the cases I have measured. That doesn’t mean that someone won’t conceive of an environment where they fail and we will need a new set of equations. That is how science works.
Thank you for the wonderful explanation of the “scientific method” and how it applies to this blog of hobby enthusiasts. As someone answered it is a group that “enjoys writing to each other”. I must say that you all seem to respect each other. Not a lot of name calling except for Prof. Mann. ;-]) With regard to elected officials, it’s pretty difficult to get them to understand what you might be talking about either as a skeptic or a believer. I don’t believe that there is one of them that could read these comments with understanding. That’s why movements are necessary. It’s the only thing that wakes up the politicians. Have a good day and thanks again for the comment.
@bobthebear – many of the commenters on this blog site are scientists, mathematicians, and etc, so they hardly qualify as hobbyists. You might call someone like me an enthusiast, but actually I use reports and commentary from this site when discussing the lack of CAGW with students and friends. You on the other hand have the smell of troll about you and I will not be discussing anything you have to say here with anybody.
Bob,
You must be new here if you imagine that commenters on this blog all respect each other. Mann is hardly the only charlatan for whom we have contempt and of whom whom we make fun.
It’s more like 50 to 60 regulars, and a couple of hundred irregulars (once a week commenters).
” Is there a skeptics movement some where? Does anybody write their congressmen or senators? If not, again I ask, what’s the purpose of this blog? Do you just enjoy writing to each other?”
This blog is read by people in the media and mainstream climatology, and in politics. It influences them.
I ask the question because in my experience, I haven’t seen mention of WUWT or any of its contributors. I’m always reading, so I’ll just keep at it. Thanks for the reply.
In addition to the GISP2 ice core data, oxygen isotope measurements of travertine cave deposits, sea surface temp reconstruction in the Sargasso Sea, Chinese tree ring measurements, and a number of other temp proxies show the Medieval Warm Period warmer than present.
Arctic weather stations consistently show that the 1930s and 40s were warmer in Greenland, Norway, Russia, and Iceland, so not only is the present not warmer than the Medieval Warm Period, it isn’t even warmer than 70-80 years ago.
There are four GISP2 temp records: (1) the oxygen isotope record of Stuiver and Grootes, (2) the Cuffy and Chow bore hole temp record, and (3) the Alley reconstruction based on the Cuffy and Clow data, and (4) the Kobashi et al trapped air data. The GISP2 core oxygen isotope data of Stuiver and Grootes gives a temp record that ends in 1950 and temps similar to the bore hole temps.
Given Don Easterbrook’s comment above and regarding the debate earlier about the actual end date in the erroneously labelled first chart in the above article: “Greenland GISP2 Ice Core – Temperature Last 10,000 years”. This chart seems to be produced from Alley, 2004: ‘GISP2 Ice Core Temperature and Accumulation Data’: ftp://ftp.ncdc.noaa.gov/pub/data/paleo/icecore/greenland/summit/gisp2/isotopes/gisp2_temp_accum_alley2000.txt
This is described as the smoothed version of the GISP2 data from original measurements published by Cuffey and Clow (1997), as presented in Figure 1 of Alley (2000). As the Alley 2004 data set indicates, the first (or most recent) data point is dated to 0.0951409 years ‘before present’; where ‘present’ is identified as 1950 in figure 1 of Alley, 2000: ftp://meteor.geol.iastate.edu/data/2005/stuff/504_papers/Younger-Dryas.pdf
In that case, the most recent datum point in the top chart equates to ~1855 (1950-0.0951409*1000 = 1855).
Yes, paleoecological temperature reconstructions take the year 1950 as present. The latest data in the GISP record is 95 years before present, i.e. 1855.
If you want to add on the 20th century warming to the end point in order to make a comparison with earlier temperatures remember to include a polar amplification factor of about 2. So add about 1.8 to 2.0 degrees to the last recorded point.
Except we don’t know how much warmer Greenland is now, compared to 1895. I see you add the magical Polar Amplification Factor, whereas the DMI record shows no warming during its period of existance, neither is there any warming at the South Pole over a similar period.
Nuuk in Greenland, is now colder than it was in the 1950s.
http://realclimatescience.com/wp-content/uploads/2015/09/ScreenHunter_10512-Sep.-23-07.04.gif
Given the interest in medieval Norse settlements in Greenland may I recommend the book by Kirsten Seaver : “The Frozen Echo: Greenland and the Exploration of North America AD1000-1500”.
I picked up a second hand copy in excellent condition and it contains some very interesting items , well researched, about the Norse settlements .
Reports from mariners of the time indicate that there were 2 periods of cooling which increased arctic ice and therefore navigation problems one in the 13th cent , and the later one which may have marked the end of settlement .
However there is evidence ,from trade goods fashionable in London, that there was still communication with England , directly or indirectly via Iceland, in 1400AD.(There has long been a suggestion that Bristol seamen and fishermen were either dealing for Greenland cod directly or fishing the Grand banks themselves long before the Cabot expedition in 1497)
Another suggestion is that the quantity of wood used in the settlements , for building and utensils, even floors, is larger than might be expected from driftwood and supports the possibility of regular trips across the Davis Strait to well forested Markland to collect birch logs.
There is much more, for example about the break with the episcopal authorities before 1400 which is basically about politics and additional taxation imposed by Popes to pay for the retaking of Jerusalem (about as practical an objective as the present Pope’s imposition of punitive carbon taxes on US and EU to prevent CAGW).
“Near-simultaneous changes in ice-core paleoclimatic indicators of local, regional, and more-widespread climate conditions demonstrate that much of the Earth experienced abrupt climate changes synchronous with Greenland within thirty years or less.”
Nonsense. The warmest part of the Medieval Warm Period for Europe was during the 8th century, that was during the second coldest period of the Holocene for Greenland.
The so called Minoan Warm Period in Greenland around 1200BC in fact was so cold/dry in the mid latitudes that it caused the demise of the Minoans as well as most other Mediterranean and cultures and the European Neolithic culture. The Minoans actually flourished from around 2700BC, as did most other cultures, because it was generally a warmer wetter climate for the mid latitudes, but a very cold period for Greenland.
I find it crazy that this has not been realised, and much crazier that what I am saying here and have said many times in the last few years, will continue to be ignored, simply because everyone is wedded to the idea that warm spike in GISP around 1000AD is concurrent with the MWP in Europe. With all the other points of contrary temperatures between Greenland and Europe through the Holocene, the sensible thing to do is investigate if there were cold periods in the mid latitudes in the late 10th and early 11th centuries, contemporary with that warm spike in GISP, and yes there were.
And you have published these insights, where?
Several times here and at Climate Etc with the relevant data, but no one has the spine to give up what they already think to be true about a single warm spike in GISP around 1000AD, and proceed to ignore the rest of the opposing temperature extremes between GISP and Europe that I have demonstrated.
Care to share a link with us in the bleacher seats?
I meant in a peer-reviewed publication. And I think I’m entitled to that question because you claim it is “crazy” that nobody listens to you. Well, I am one of those and therefore I must be “crazy”, to which I take offense.
There is ample historical evidence that the 11th and 12th centuries were warm in Europe (and not just a “single warm spike in GISS”). It was the time of cathedral building and pre-industrial societies did not embark on that sort of enterprise unless life was relatively easy and food plentiful. The building of such monuments declined in the 13th and stopped altogether in the 14th, because the climate turned colder and colder still.
“There is ample historical evidence that the 11th and 12th centuries were warm in Europe”
So what, that does not mean that the late 10th and early 1th centuries were not cold. And you have done the very typical response of clinging to what you think you know, and ignore the key point about the MWP that I keep on making. That the warmest part of the Medieval Warm Period in Europe was in the 8th century, during the SECOND COLDEST PERIOD ON GISP THROUGH THE HOLOCENE!
How about we go into detail of what happened in the mid latitudes around 1200 BC, in the “Minoan Warp Period” as I prefer to call it, being such a travesty of science.
A full 31% of Americans believe that AGW is an Hoax/Fraud see Bloomberg poll recent. This is an ENORMOUS amount of people. This is simply going to grow every year. If I was a major “climate scientist” in any way associated with the scam I would get out now because you are possibly going to go to jail in the next 10 years
http://images.businessweek.com/cms/2015-09-22/150923_wednesday_2121165.pdf
Look at the Dark Ages cold period c. 380-540 AD on GISP, it was decidedly warm, and the Roman warm period before climatologists re-dated it was largely in the first four centuries AD, a mostly colder period on GISP. There was also a well studied cold period of cultural collapse and droughts around 2200BC, a very warm period on GISP.
Your “observations” go straight against what we know from copious historical source, who recorded what was going on at the time it happened, not 2000 years later.
“Your “observations” go straight against what we know from copious historical source”
No they do not. In fact the single misinterpretation of the c. 1000 AD warm spike in GISP is at odds with the number of points of opposite temperatures between Greenland and Europe that I have identified.
Ed, Ulric (excuse the familiarities) there is a fairly recent paper , open access,in PNAS which may reconcile some of your differences :
http://www.pnas.org/content/107/12/5306.full.pdf+html
It is entitled :
” Two millennia of North Atlantic seasonality
and implications for Norse colonies ” and is the result of d18O analysis of molluscs from North Iceland . Admittedly not Greenland but the authors claim correlation with settlement dates and loss of settlements so may be more relevant than the GISP ice core measurements .
One point that is made is the identification of “notable” cold and warm periods , thus :
Cold : 360 – 240BC, AD410, AD 1380 – 1420
Warm: 230BC – 140AD, AD 640 – 780
Quote from your link:
“A return to cooler conditions by ∼A.D. 410 […]
this period coincided with prevailing cooler and wetter conditions experienced
by much of Europe at this time, during the “Dark Ages Cold Period,” ∼A.D. 400 to 600”
Well that does not agree with GISP which has warm spikes in the 5th and early 6th centuries as big as the one around 1000AD. I don’t stand corrected.
[Snipped. Off topic. ~mod.]
Another example of taking the talk off topic and turning haranguing into an art form. Another troll attempt to degrade the usefulness of the site as a source of information. The record that Mann bases his information on isn’t useful to show that Mann was wrong. Wow. And then the arguing just strays further and further away from the topic at hand.
Sounds more like he was promoting his book.
To clear up the apparent confusion about when the GISP2 ice core record ends, here is the original description (which is followed by several thousand isotope ratios from accelerator data). The top of the core is 1950. The 1855 date is based on temp reconstructions (not isotope ratios) by Cuffy and Clow and Alley.
GISP2 Oxygen Isotope Data (from Stuiver’s original description with the measurements)
General Description
Between 1989 and 1993, the Greenland Ice Sheet Project 2 (GISP2) collected several ice cores from near the summit of the Greenland Ice Sheet (72°36’N, 38°30’W). Two of these were the 200m B core drilled in 1989, and the 3053m D core (drilled from 1989 to 1993) – the longest ice core drilled to date in the northern hemisphere. The D core penetrated the depth of the ice sheet, and allowed the further recovery of some 60-cm of bedrock. The Principal Investigators for the University of Washington’s contribution to this multi-university effort were M. Stuiver (Box 351360, University of Washington, Seattle WA 98195, USA) and P. M. Grootes (now at Leibniz-Labor, Max Eyth Strasze 11-13 24118 Kiel, Germany) .
All d18O values were determined at the Quaternary Isotope Laboratory (M. Stuiver, Box 351360, University of Washington, Seattle WA 98195, USA).
The data columns represent:
Depth Top depth of each interval, in meters. Samples are continuous unless specifically noted.
Age Layer count age at the given depth (in yr BP), where 0 BP represents AD 1950 summer to AD 1949 summer. Age corresponds to the top of the interval, unless noted otherwise.
Del 18O Mean d18O value (in per mil) over the interval starting at the indicated top depth. Standard deviation in a single d18O measurement is 0.14 per mil. Multiple measurements (such as in the data sets below) reduce the standard deviation to the 0.05 to 0.1 per mil range.
The top of the core is not 1950, that is the reference year, ‘present’ (based on C14 dating standards). The first level from which data is collected is 95 years earlier, i.e. 1855.
Mann really likes that “parroted” word. And loves “scurrilous”. Maybe he’s a bird-brain or a rodent…
RE: Brandon Shollenberger
September 23, 2015 at 7:53 pm said:
“But the fact I think Mann’s work is wrong and even fraudulent does not mean I am going to ignore false criticisms of his work. If anything, it means the opposite. Because I want the case against Mann to be taken seriously, I want people to stop making bad arguments about his work. That is the only way the real arguments will get heard.
One of the primary reasons Mann has gotten away with as much as he has is because people keep making bad arguments he can easily shoot down. Bad arguments give your opponents ammunition. It’s that simple.”
Thank you, I appreciate the clarification of your perspective (and the motivation for your argumentation),
Hogwash.
Brandon Shollenberger is acting as a rear guard, so to speak, in an attempt to force skeptics to argue to near wits end for every little scrap of recantation, even as the warmista horde is being routed from the positions they clung to so tenaciously for all those years.
His pretending to be a skeptic merely wanting better arguments from his brethren is not to be taken seriously.
Michael Mann. Talk about an outliar!
There was some talk about what was and can now be grown on Greenland. It’s a very long thread and I am not sure if this has been posted yet.
This is what the archeological record has found.
“Little Ice Age stopped corn cultivation
The Greenland climate was a bit warmer than it is today, and the southernmost tip of the great island was luscious and green and no doubt tempted Eric the Red and his followers. This encouraged them to cultivate some of the seed corn they brought with them from Iceland.
The Vikings also tried to grow other agricultural crops. Their attempts to grow these crops and barley did not last long, however, as the climate cooled over the next couple of centuries until the Little Ice Age started in the 13th century.”
http://sciencenordic.com/vikings-grew-barley-greenland
I recently read Richard Alley’s 2000 book: “The two-mile time machine,” about the GISP2 project of which he was a part. Great read. If he since went to the “dark side” in his research papers, too bad. I still recommend the book.
Sorry this is a late reply, but I’m old and it takes me a while to think these things over.
But the questions put forward here are suppose do just that right? Get people to think .
This was on the source linked website.
Norm Sauer, who lives in Nevada City, is a member of The Union Editorial Board. His opinion is his own and does not reflect the viewpoint of The Union or its editorial board.
Is this the Mr. Sauer that Dr. Mann felt compelled to chastise?
The reference to ice cores from Greenland got things going. Some of the exchange got p r e t t y sporty.
Weather, climate, history, archeology, thermal dynamics and more. And VIKINGS!
I personally learned a lot and it created yet more questions in my mind.
Besides who doesn’t like VIKINGS?
Still, come on, an op-ed piece in a rural county paper and Mr. Sauer is in the clutches of ‘big oil’!
Dr. Mann throws the scientific consensus, a decade and a half of validation, and the Washington Post (they have their own march you know composed by JPS in 1889) against the opinion of one man.
Had it been Ben Cartwright (of Bonanza), I could understand. Ben had gravitas. I identify more with Norm.
Norm doesn’t have his own march or long running TV show (please fact check me on this).
So, is Dr. Mann doing his own spin and damage control? What damage? His followers are legion. His graph has become the icon of activists around the globe. Doctor, ‘move on’, as we used to say.
But remember ‘yesterdays news wraps todays fish’.
It is not about the science. It is the about headline stupid!
Note to self, crawl back to the shadows.
The hockey stick proxy data are approximations to global surface temperature ‘anomalies’. The GISP ice core data are not global (nor are they anomalies) – they represent regional (at most) fluctuations in the Greenland air temperatures. You can’t just shove the ‘stick’ on the end of the GISP data and then use it to make false claims about the magnitude of the present day warming. You might as well splice any two time series together for that matter – your data are not apples to apples!
“Medieval” is a very broad term used variably, thus is not scientific.
Some people use it as starting circa 400AD whereas others start the Dark Ages then and Medieval later. The broader use of the term covers two cool periods and the warm MWP.