[This is an important essay, so I’m going to make it a top post at WUWT for a day. New stories will appear below this one. -Anthony]
Guest Post by Bob Tisdale
OVERVIEW
I recently presented the modeled energy imbalance at the top of the atmosphere (TOA) in the post No Consensus: Earth’s Top of Atmosphere Energy Imbalance in CMIP5-Archived (IPCC AR5) Climate Models. As you’ll recall, there was a very wide spread in the individual model simulations of the TOA energy imbalance. (See Figure 13 from that post.) I’ve shortened the timeframe to 1955-2014 in Figure 1, which is the period for which ocean heat content data are available from the NODC.

Figure 1
Ponder that graph for a moment. The average TOA energy imbalance (red curve) in recent years is in the expected range…the range we’ve been told by the climate science community. Example: According to Trenberth et al. (2014) Earth’s Energy Imbalance:
All estimates (OHC and TOA) show that over the past decade the energy imbalance ranges between about 0.5 and 1 Wm-2.
Trenberth et al. (2014) must not have been referring to the individual climate models, because they show a much larger range. In fact, some of the models show relatively high positive TOA energy imbalances, in the neighborhood of +2 to +3 watts/m^2, while others show negative energy imbalances, roughly -3 to -2 watts/m^2.
The simulated oceans in the models with the high positive TOA energy imbalances have to be accumulating heat at relatively fast rates. On the other hand, the simulated oceans in the models with the negative TOA energy imbalances have to be losing heat very quickly. Yes, losing heat.
In this first look, we’re going to calculate and illustrate the ocean heat accumulation from 1955 to 2014 based on the climate-model-simulated TOA energy imbalances for all of the models included in the earlier energy imbalance post. We’ll start with the full oceans compared to data for the top 2000 meters, and we’ll then compare models and data for the top 700 meters.
INTRODUCTION
Because the oceans to depth have a tremendous capacity to store heat, they are supposed to be storing about 93% of the excess heat created by the emissions of manmade greenhouse gases. See Figure 2.

Figure 2
The pie chart in Figure 2 is based on the Earth’s total energy change inventory from Box 3.1 of Chapter 3 – Observations: Oceans of the IPCC’s 5th Assessment Report. There they write:
Ocean warming dominates the total energy change inventory, accounting for roughly 93% on average from 1971 to 2010 (high confidence). The upper ocean (0-700 m) accounts for about 64% of the total energy change inventory. Melting ice (including Arctic sea ice, ice sheets and glaciers) accounts for 3% of the total, and warming of the continents 3%. Warming of the atmosphere makes up the remaining 1%.
WE CAN USE THE MODELED ENERGY IMBALANCE AT THE TOP OF THE ATMOSPHERE TO DETERMINE HOW MUCH HEAT THE OCEANS SHOULD BE ACCUMULATING, ACCORDING TO THE MODELS
The ocean heat content outputs of the climate models stored in the Climate Model Intercomparison Project Phase 5 (CMIP5) archive are not available in easy-to-use form at the KNMI Climate Explorer. In fact, I know of no place where ocean heat content outputs are easy to access for any of the CMIP5-based models.
Fortunately, the components of the modeled Energy Imbalance at the Top of the Atmosphere (TOA) are available. So we can determine the energy imbalance, and, in turn, how much heat the oceans should be storing, according to the models.
As you’ll recall from No Consensus: Earth’s Top of Atmosphere Energy Imbalance in CMIP5-Archived (IPCC AR5) Climate Models, the energy imbalance at the top of the atmosphere is made up of 3 components (nomenclature and acronym used at the KNMI Climate Explorer are shown in parentheses):
- the amount of sunlight reaching the top of the atmosphere (TOA Incident Shortwave Radiation, rsdt),
- the sunlight being relected back to space primarily by clouds and volcanic aerosols (TOA Outgoing Shortwave Radiation, rsut), and
- the infrared radiation being emitted by Earth relative to the top of the atmosphere (TOA Outgoing Longwave Radiation, rlut).
The top of the atmosphere energy imbalance is calculated by subtracting the Outgoing Shortwave and Longwave Radiation from Incident Shortwave Radiation.
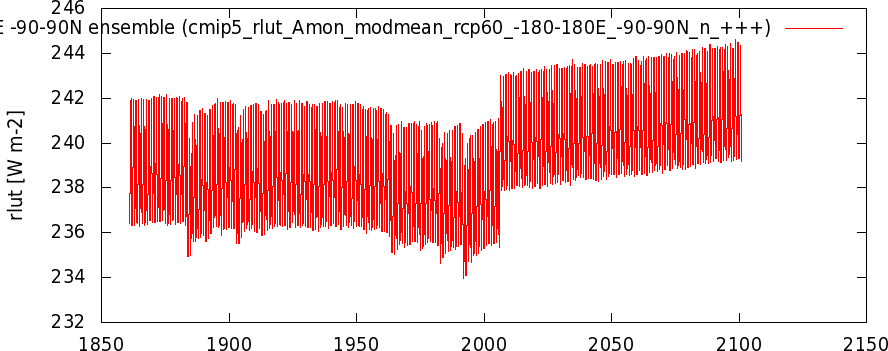
Figure 3 presents the average TOA energy imbalance of the climate models stored in the CMIP5 archive, specifically the multi-model mean of the models using historic and RCP6.0 forcings. We’re discussing the multi-model mean now for simplicity sake…for those new to the topic. The 1955 to 2014 timeframe relates to the NODC’s ocean heat content data for the depths 0-2000 meters (about 6600 feet or about 1.25 miles).

Figure 3
The large dips and rebounds are caused by the aerosols emitted into the stratosphere by explosive volcanic eruptions.
Each year that the energy imbalance is positive, the oceans gain heat, and each year the TOA energy imbalance is negative, the oceans lose heat. The energy imbalance is positive most of the time, so the modeled oceans should be warming to depth, according to the model mean.
Note: You’ll notice in the title block of Figure 3 that I excluded three models: CESM-CAM5 and two IPSL models. There were shifts at 2006 in the TOA Outgoing Longwave Radiation outputs of all three runs of the CESM-CAM5 model (one with a monstrous shift), which skewed the multi-model mean of that metric for that scenario. (I notified KNMI of that problem, and NCAR has since corrected them. I’ve continued to exclude them so that the models in this post are the same in the TOA energy imbalance post.) I also excluded the two IPSL models because their TOA Incident Shortwave Radiation contains a volcanic aerosol component, while all other models do not. (The other models address volcanic aerosols with the Outgoing Shortwave Radiation.)
That leaves 21 models, including BCC-CSM1-1, BCC-CSM1-1-M, CCSM4 (6 runs), CSIRO-MK3-6-0 (10 runs), FIO-ESM (3 runs), GFDL-CM3, GFDL-ESM2G, GISS-E2-H p1, GISS-E2-H p2, GISS-E2-H p3, GISS-E2-R p1, GISS-E2-R p2, GISS-E2-R p3, HadGEM2-AO, HadGEM2-ES (3 runs), MIROC5 (3 runs), MIROC-ESM, MIROC-ESM-CHEM, MRI-CGCM3, NorESM1-M, and NorESM1-ME.
For those models with multiple runs, the ensemble members are averaged before being included in the multi-model mean.
[End note.]
CONVERTING FROM WATTS/M^2 TO JOULES*10^22/YEAR
We’ll need to convert the units of the modeled TOA energy imbalance (watts/m^2) to those used for ocean heat content to the depths of 2000 meters (Joules * 10^22). Gavin Schmidt presented two conversion factors (the one he originally used in his model-data comparisons at RealClimate and the corrected one) in his post OHC Model/Obs Comparison Errata.
My error was in assuming that the model output (which were in units W yr/m2) were scaled for the ocean area only, when in fact they were scaled for the entire global surface area (see fig. 2 in Hansen et al, 2005). Therefore, in converting to units of 1022 Joules for the absolute ocean heat content change, I had used a factor of 1.1 (0.7 x 5.1 x 365 x 3600 x 24 x 10-8), instead of the correct value of 1.61 (5.1 x 365 x 3600 x 24 x 10-8).
Unfortunately, Gavin didn’t present the units for those factors.
So we’ll turn to the always very helpful Willis Eschenbach, who replied to me in an email, after presenting how the conversion factor is derived:
1 watt/m2 = 1.14E22 joules/ocean/year
Or to put it another way, for the ocean we can say:
1 W/m2 = 1.14E+22 joules/year added to the ocean
The 1.14*10^22 Joules/year per watt/m^2 factor is the roughly same as the 1.1 presented by Gavin Schmidt.
[Note: It turns out I didn’t need to bother Willis for the units. They were identified in Gavin’s reference: Hansen et al. (2005).]
When I first prepared the spreadsheets for this post, I used the higher of the two scaling factors used by Gavin Schmidt (1.61*10^22 Joules/year per watt/m^2) because the TOA imbalance refers to Earth’s total surface area. But then it became obvious to me that if I used the smaller scaling factor (1.14*10^22 Joules/year per watt/m^2) the trends of the model means of all of the models would align almost perfectly with the data. So on this first pass, I decided to give the models the benefit of the doubt and use the smaller of the two factors, which helps the models. But am I making the same mistake that Gavin Schmidt initially made in his model-data comparisons?
We’ll make one more adjustment to the conversion factor. We’ll assume the oceans are accumulating 93% of the TOA energy imbalance, which lowers the conversion factor to 1.06*10^22 Joules/year per watt/m^2.
MODELED ANNUAL OCEAN HEAT UPTAKE AND ACCUMULATION BASED ON THE MODEL MEAN (FULL OCEAN)
Based on that conversion factor, the annual modeled ocean heat uptake (absolute) for the full oceans that was derived from the simulated TOA energy imbalance are shown in Figure 4…again using the model mean to simplify these early discussions. Basically, Figure 4 illustrates the average of the modeled TOA energy imbalance but in terms used for ocean heat content. Every year the value is positive, the oceans gain heat, and each year the value is negative, the oceans lose heat. The difference between an annual value and zero indicates how much heat the oceans gain or lose in a given year. In other words, the graph shows the annual ocean warming and cooling rates for the global oceans.
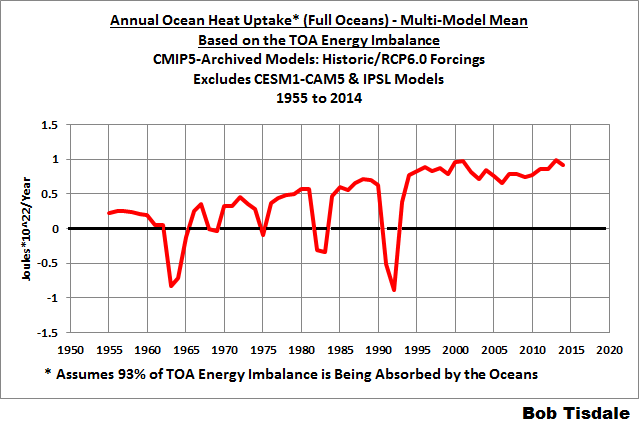
Figure 4
But that still doesn’t allow us to directly compare the models to the data. The (much-adjusted) global ocean heat content data from the NODC for the depths of 0-2000 meters are presenting how much heat the oceans are accumulating in the top 2000 meters. To determine the modeled ocean heat accumulation, we simply take a running total (cumulative sum) of the annual heat uptake…like the balance in a bank account. See Figure 5.

Figure 5
I’ve included the NODC ocean heat content reconstruction for the top 2000 meters (zeroed at 1957) in pentadal form as a reference for the (much-adjusted) observations. (Data here.) The data have been shifted so that the 1957 value is zero. That was done solely to ease the visual comparisons. Keep in mind, before the early 2000s when the ARGO floats were deployed, the NODC ocean heat content data for the top 2000 meters are based on very few temperature and salinity measurements. Phrased differently, before the ARGO era, the NODC ocean heat content data to depths of 2000 meters are basically make-believe data.
For the sake of discussion, we’ll assume there is no heat gain below 2000 meters. It’s commonly done. That is, we’ll assume all of the excess heat is being absorbed only in the top 2000 meters. That’s consistent with the findings of Liang et al. (2015) Vertical Redistribution of Oceanic Heat Content. (See the preprint copy here.) In fact, Liang et al. found (1) the oceans below 2000 meters had cooled from 1992 to 2012 and (2) part of the heat above 2000 meters was from the redistribution of heat upwards from the depths below 2000 meters. By assuming all of the observed heat gain is in the top 2000 meters, we can then compare the data to the model outputs, the latter of which are for the full ocean, from surface to floor.
With those things considered, it might be misleadingly said that the models, as represented by the model mean, do a good job of simulating the observed warming rate of the oceans. Why misleadingly? As we’ve already shown (Figure 1), there is no agreement among the models on the energy imbalance at the top of the atmosphere, and that means there is no agreement among the models on how much heat the oceans are accumulating…if they are in fact accumulating and not losing heat in their modeled oceans.
MODELED ANNUAL OCEAN HEAT UPTAKE AND ACCUMULATION FOR ALL MODELS (FULL OCEAN)
Using the conversion factor presented earlier (1.06*10^22 Joules/year per watt/m^2), the annual heat uptake and losses (absolute) in modeled ocean heat content, for the full oceans, based on the simulated TOA energy imbalance from 1955 to 2014, are shown in Figure 6…this time for the model mean (in red) and the individual models stored in the CMIP5 archive using the historic and RCP6.0 forcings. Again, in other words, Figure 6 illustrates the modeled energy imbalance of the individual models but in the terms used for ocean heat content, which is why it looks so similar to Figure 1.

Figure 6
The simulated oceans in the models with higher absolute positive values are gaining heat faster than those whose energy imbalances are closer to zero. And the oceans in the models with the negative imbalances from 1955 to 2014 are not accumulating heat; they’re losing it.
The models with the high positive imbalances and with the negative imbalances are obvious outliers. They create incredible (but not in a good way) ocean heat content curves that should probably be considered implausible. See Figure 7. Yet they are among the models used by the IPCC for their 5th Assessment Report. Then again, if we were to eliminate models because they didn’t simulate some metric properly, there would be no climate models left in the CMIP archives.
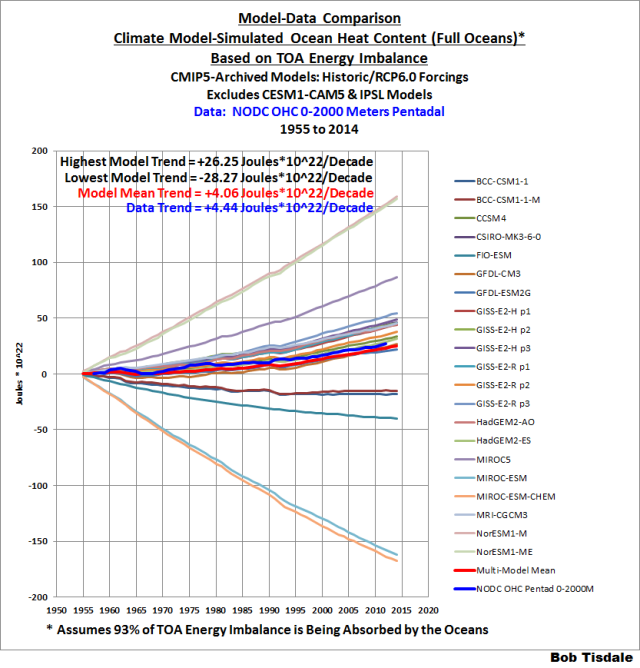
Figure 7
Obviously, based on the energy imbalances in the climate models used by the IPCC for their 5th Assessment Report, there is no agreement on how much heat the oceans should be accumulating, or even if the oceans are accumulating heat. And the differences in the simulated ocean heat accumulation are so great that using the model mean to represent the models is very misleading, because the model mean gives the impression of a consensus when there is none.
LET’S ELIMINATE THE OUTLIERS (FULL OCEAN)
Three of the 21 models in Figure 7 are showing way too much heat accumulation, and 5 of the models show the oceans losing heat because of their negative TOA energy imbalances. They are so far from the much-adjusted observations, I’ve excluded them in Figure 8.

Figure 8
But eliminating the outliers creates other problems for the models. With the obvious outliers removed, only two of the remaining 13 models have an ocean heat content trend that’s lower than the observed trend. In other words, the vast majority of the models are showing too much warming. And that means, for most the remaining models, the climate sensitivities to CO2 are too high.
WHAT ABOUT THE GISS MODEL E2 SIMULATIONS FROM THE CMIP5 ARCHIVE (FULL OCEAN)?
For a number of years, Gavin Schmidt (now the director of GISS) presented model-data comparisons at RealClimate that included simulated and observed ocean heat content for different depths. Gavin compared models and data for the depths of 0-700 meters in the posts that appeared in December 2009, May 2010, January 2011 and February 2012. It was only in the last post that Gavin presented the comparison for the modeled full ocean and data for 0-2000 meters. We’ll illustrate the model-data comparison for the top 700 meters in a moment, but let’s first stick with the data for the top 2000 meters and the modeled ocean heat accumulation for the full oceans.
You’ll note that the ocean heat content graphs in those RealClimate posts have been corrected per Gavin’s May 2012 post OHC Model/Obs Comparison Errata. The ocean heat content comparisons in them used the GISS models from the earlier CMIP3 archive. Gavin Schmidt closed his errata post with:
Analyses of the CMIP5 models will provide some insight here since the historical simulations have been extended to 2012 (including the last solar minimum), and have updated aerosol emissions. Watch this space.
I suspect some of you, like me, have been patiently waiting for those CMIP5-archived GISS Model E2-based model-data comparisons for ocean heat content. Yet, for more than three years, none have been posted at RealClimate.
For those interested, Figure 9 compares the data with the TOA energy imbalance-based ocean heat content for the three GISS Model E2-R simulations…along with the mean of those 3 runs. The “R” suffix letter stands for the Russell Ocean model that’s coupled to the GISS Model E.
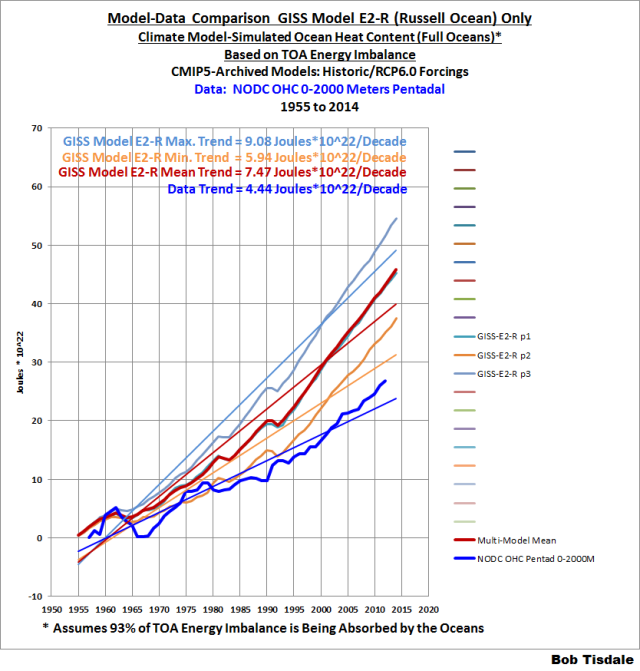
Figure 9
This batch of GISS climate models is showing that they are too sensitive to CO2 by a wide amount. Keep in mind, I’m using the lower of the two scaling factors.
Looking at the legends in Figures 6, 7 and 8, you’ll note that GISS also has another group of model experiments with an “H” suffix. The “H” stands for HYCOM ocean. Figure 10 includes the model-data comparison of the GISS models with the HYCOM oceans.
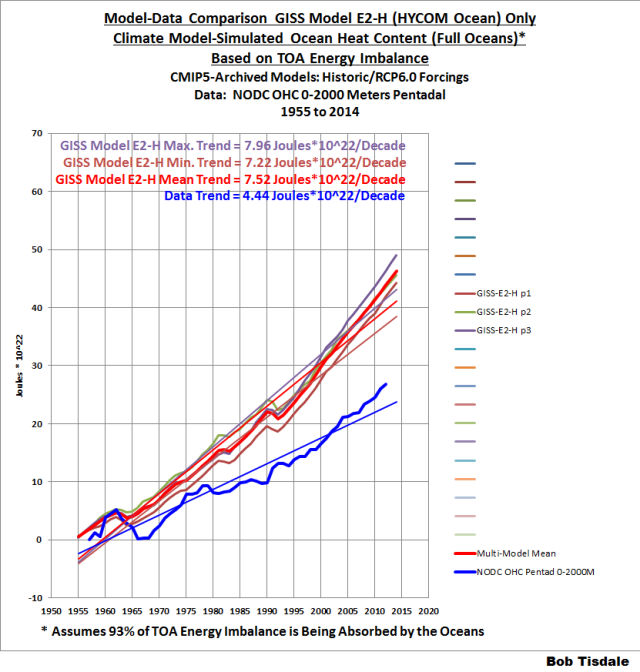
Figure 10
Once again, the GISS models show they are way too sensitive to CO2.
I’ll let you speculate about why there have been no model-data comparisons of ocean heat content at RealClimate for 3 years.
MODEL-DATA FOR 0-700 METERS
We’ll be using the annual NODC ocean heat content data (0-700m) here in the following comparisons. For the comparisons I’ve simply shifted the data so that the 1955 value is zero.
There is better sampling at the depths of 0-700 meters than at 700-2000 meters before the ARGO era, so the NODC ocean heat content data for the depths of 0-700 meters is a better dataset. While sampling at these upper depths may be better globally, they are still very poor in the southern hemisphere. With that in mind…
For these comparisons we’ll rely on the IPCC’s statement that “The upper ocean (0-700 m) accounts for about 64% of the total energy change inventory…” from the earlier quote. That is, we’re taking the lower of the two scaling factors (1.14*10^22 Joules/year per watt/m^2) and multiplying it by 0.64 to determine the annual ocean heat content uptake for the top 700 meters of the oceans from the TOA energy imbalance. The following are the pertinent graphs without commentary, because the comments would basically be the same as those for the full oceans.
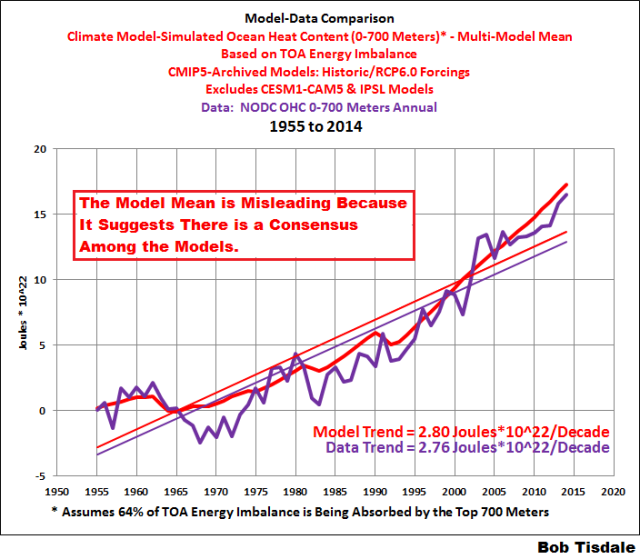
Figure 11
# # #
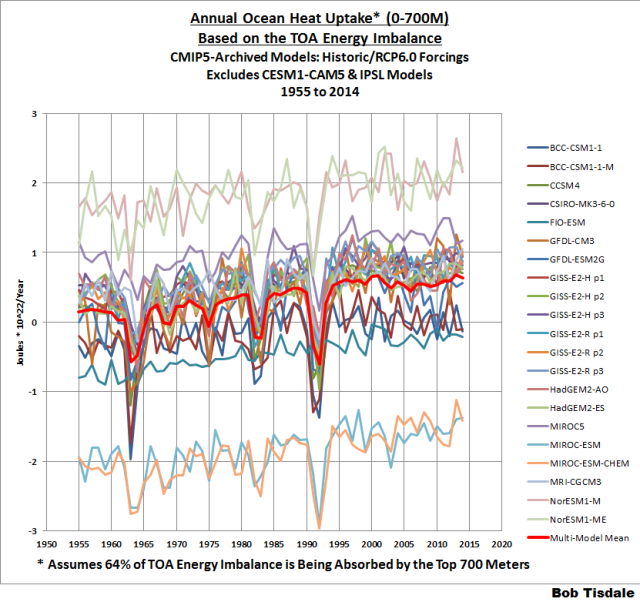
Figure 12
# # #

Figure 13
# # #
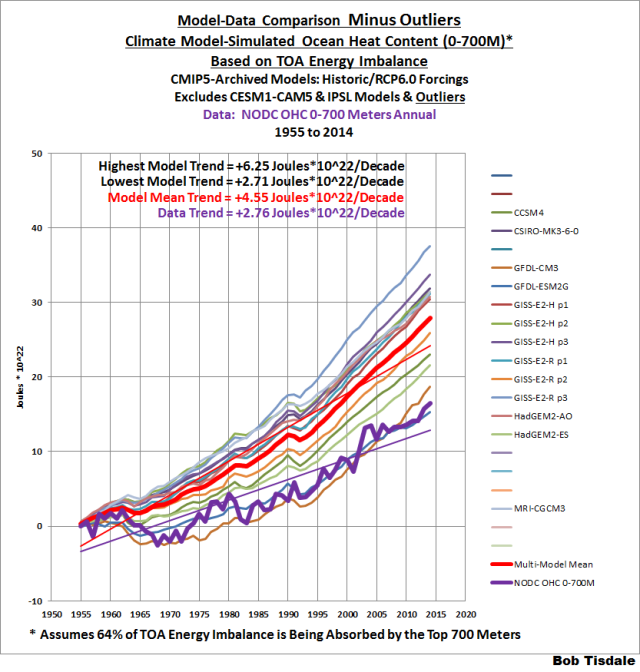
Figure 14
# # #
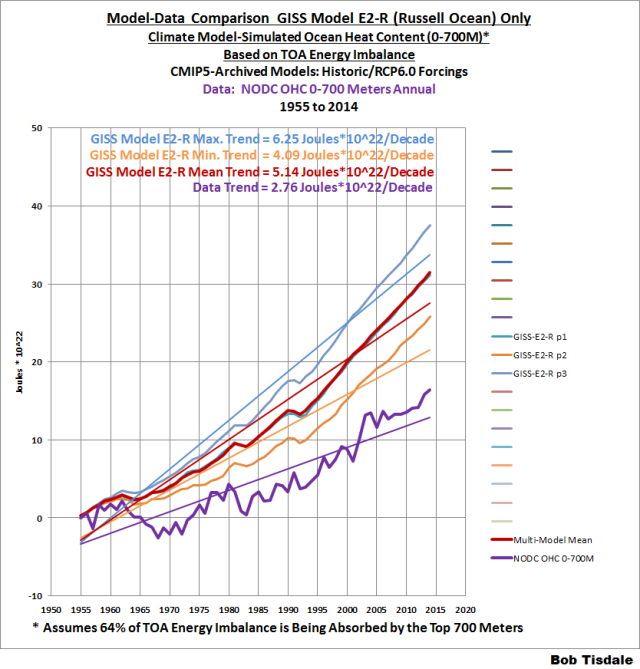
Figure 15
# # #

Figure 16
CLOSING
Let’s start with the big question: Should I have been using the larger of the two scaling factors when converting the TOA energy imbalance to the annual change in ocean heat content? See the discussion under the heading of CONVERTING FROM WATTS/M^2 TO JOULES*10^22/YEAR. If that’s the case, then all of the model-related ocean heat content information will need to be multiplied by a factor of 1.41. It would only take a few hours for me to update this post, if it’s determined that I made the same mistake that Gavin Schmidt did with his original model-data comparisons.
It’s a shame that the modeled ocean heat content of the models store in the CMIP5 archive are not available in easy-to-use form. It would be interesting to compare the actual modeled ocean heat content for the full oceans and the top 700 meters to the respective values derived from the TOA energy imbalance.
Looking at the model-mean for all of the models, the similarities in the trends of the modeled full oceans and data for 2000 meters (Figure 5) and between the trends for the models and data for the top 700 meters (Figure 11) are striking. One might believe they’re too close…as though the data are adjusted to match the models, or the models are adjusted to match the data…or both. Then again, I may have used the wrong scaling factor and there are no similarities.
The energy imbalance at the top of the atmosphere and ocean heat accumulation are crucial elements in the hypothesis of human-induced global warming. Because there is no agreement among the climate models about the energy imbalance at the top of the atmosphere (Figure 1), there can be no agreement among the climate models about the heat accumulating in the oceans (Figures 7 and 13).
With the unlikely outliers removed, or referring to the GISS Model E2-R and GISS Model E2-H simulations, the differences between the observed and modeled ocean heat accumulation indicate the models are much too sensitive to the hypothetical impacts of CO2.
Many of the modeled oceans in the models used by the IPCC for their 5th Assessment Report are not storing heat close to the (much-adjusted) observed rates, so those models are not simulating global warming as it exists on Earth. But there’s really nothing new about that either. We can simply add ocean heat accumulation and TOA energy imbalance to the list of things that climate models do not simulate properly: like surface temperatures, like precipitation, like polar sea ice, like polar amplification, like El Niño and La Niña processes, like the Atlantic Multidecadal Oscillation, like the Pacific Decadal Oscillation, and so on.
Once again, climate models have shown they are good for one thing and one thing only: to display how poorly they simulate Earth’s climate.
I look forward to your feedback on the scaling factors. It would only take a few hours to update this post if needed.
THANKS
Many thanks to Willis Eschenbach and Roger Pielke, Sr. for their comments on the initial (but much different) drafts of this post.
Only if the GHE theory is correct. As yet it has not been validated, after $billions squandered to do so. Dr Spencer claims to have measured it at 300W.m2 but forgets that 300W/m2 via S&B is a radiation equilibrium temperature of 272K. This has not enough energy to increase temperatures above that any higher, see Plancks Law.
Trenberth gets some energy increase by adding fluxes which is totally meaningless and thus incorrect.
Thanks Bob.
Actually the TOA “partial blackbody” from CO2 (+ H2O overlap) is only “equivalent” to a blackbody Planck curve at ~217K as shown in these OLR spectra:
http://1.bp.blogspot.com/-vvN1VZjxhu4/Vc0gRW-aXeI/AAAAAAAAHUI/dlx0Wlsaeco/s640/OLR%2BNimbus_energy_out%2B2.jpg
Planck’s law of blackbody radiation says a 217K blackbody cannot warm a warmer blackbody at 255K by 33K up to 288 K.
Try thinking of it in a different way. CO2 is transparent to high energy EMR. Most of this passes through the atmosphere and is absorbed by the system. This energy is radiated back out to space, but the earth is much darker than the sun, so the radiated energy is at wavelengths that are absorbed by CO2 (it is a different colour if you will), hence the atmosphere warms. Radiant energy colour is necessarily different than absorbed energy colour if the source of the radiant energy (the sun) cannot warm the absorbing body (the earth) to an equal temperature. As such, the atmosphere happily allows energy through, causing the surface to warm. CO2 absorbs some of the radiated energy going back out because the radiation going out is a different colour. This absorbance requires the system (surface plus atmosphere) to be at a higher temperature to achieve thermal equilibrium. For the energy to balance, temperature of the radiating system must be higher than that predicted by a black body. The total black body radiation of the system is constant, but some of that radiation is now from the atmosphere rather than the surface. The more CO2 in the atmosphere, the higher the equilibrium temperature necessary to allow the system (atmosphere plus surface) to achieve thermal equilibrium. No need for a cooler body to warm a hotter body and the net temperature required for thermal equilibrium is higher than a black body. Radiant energy colour is necessarily different than absorbed energy colour if the source of the radiant energy (the sun) cannot warm the absorbing body (the earth) to an equal temperature. In summary, for the energy to balance, temperature of the radiating system must be higher than that predicted by a black body. The more CO2, the higher the required equilibrium temperature. In order to accurately calculate the equilibrium temperature one then gets into the RTE’s, back radiation and other things (none of which violate the laws of thermodynamics) that may seem counter intuitive. No more counter intuitive than Schrodinger’s cat though.
The gravito-thermal GHE of Maxwell/Clausius/Carnot/Boltzmann/Feynman/ US Standard Atmosphere perfectly explains both the 33K GHE from the 255K ERL to 288K surface as well as the even larger -35C ANTI-greenhouse effect from the 255K ERL to 220K top of the troposphere on the sole basis of atmospheric mass/gravity, and without any consideration of CO2 concentrations or “radiative forcing” whatsoever.
The Arrhenius GH theory confuses the cause (gravito-thermal) with the effect (IR absorption & emission from GHGs).
I’m confused by your assertion. Are you asserting that the atmosphere is entirely transparent to electromagnetic radiation? More specifically, are you asserting that the atmosphere does not absorb, emit or scatter emr?
John Eggert, I don’t think hockeyschtick thinks the atmosphere is perfectly transparent. Rather, I have a question of my own for you: you state that “CO2 absorbs some of the radiated energy going back out”. Does it not also absorb some of that same energy on its way in (and re-radiate it back out into space before it ever arrives)? Or will you tell me there is no incoming energy of the correct “colour” (wavelengths)? Seems to me, however much of the appropriate “colour” is available in or out, the amount of CO2 will intercept the same amount, whether the energy is coming or going.
Since Venus is no hotter than it “should” be given its proximity (at altitudes where the atmospheric pressure is equal to Earth’s at sea level and higher, the temperature is just what you’d expect of Earth’s atmosphere at that distance, or slightly cooler), CO2 appears to play no net role. (If you want to argue albedo, acknowledge that it’s a magic albedo that perfectly offsets CO2’s “warming” at 49km altitude — but also note that, as you get still higher in the clouds where the albedo effect must be falling off, the temperature is slightly cooler than mere proximity would have it — so your albedo is being more effective, the less of it there is, which is . . . odd.)
As CO2 actually has a narrow IR absorption ranges, most of the IR from the surface goes right out to space. And, the CO2 in the atmosphere is always colder than the surface—the models are daytime 24/7, no night time—the energy levels in the surface equivalent to the IR given off by CO2 are full and the IR will be reflected. CO2 cannot and does not warm the surface. The warmists target specifically the upper tropical troposphere that is not only cold than the surface but has been cooling instead of their predicted warming.
John Eggert, your response was so clear I thought any fool could understand it. Apparently I was wrong ;(
This will be my last response here as I don’t want to highjack the thread. mellyrn said: Does it not also absorb some of that same energy on its way in (and re-radiate it back out into space before it ever arrives)? Absolutely. In the process, the atmosphere gets hotter than it would if the CO2 were not there. Hence contributing to the warming associated with an increase in CO2. I guess you missed that “most of this passes through the atmosphere” part. Key word there is “most”.
hockeyschtick August 26, 2015 at 6:03 am says
Planck’s law of blackbody radiation says a 217K blackbody cannot warm a warmer blackbody at 255K by 33K up to 288 K.
Yes, but it can slow down the cooling process, the 255K body is no longer radiating effectively to space at Zero K. But the sun at 5000 K keeps on warming it up at the same rate. So it does heat up.
“Yes, but it can slow down the cooling process, the 255K body is no longer radiating effectively to space at Zero K. But the sun at 5000 K keeps on warming it up at the same rate. So it does heat up.”
GHGs only slow down radiative cooling by a few milliseconds, easily reversed and erased during the 12 hours every night. Secondly, GHGs accelerate convective cooling by much more frequent collisions with N2/O2 than photon emissions in the troposphere. Convection dominates radiative-convective equilibrium in the troposphere by a factor of ~10 times, thus, any increase in radiative forcing is easily compensated by increased convection. The GHGs effect on accelerating convection and decreasing the lapse rate, both of which cool the surface, far far exceeds any possible “radiative forcing” on the surface.
Would any of you guys who think GHE is valid please explain why there is no evidence of it in over 500 million years of geologic history of earth. Please explain why the Antarctic and Greenland ice cores of the most recent 3/4 million years of the Pleistocene show atmospheric CO2 lagging temperature changes by 800 years. Please explain why steadily increasing CO2 during the lasts 18+ years has corresponded with flat-lined, then decreasing temperatures. Arrhenius was a smart guy and I think had he been aware of the above observations, we would not be having this discussion. Thanks.
“Sigh”.
1. More CO2 reduces the mean average absorption distance for certain wavelengths.
2. EM radiation travels at the light.
3. Absorbed radiation travels at the speed of squirrel (slow and wandering aimlessly).
4. If the mean absorption distance for CO2 wavelengths is reduced 10% they will be in the atmosphere about 10% longer.
5. The more energy is buffered in the atmosphere the warmer it is.
6. There is little solar radiation in the far infrared.
7. There is lots of earth black body radiation in the far infrared.
Now – the IR effect has been measured and is about 0.2 W/m2 for 22 PPM or about 1/3 what the IPCC thinks it is.
The Arrhenius people have it about 1/3 right and the Maxwell people are about 2/3rds right.
Because the atmosphere is holding more energy – upward convection should cause more rapid cooling of the surface.
The difference between satellite and surface data would suggest the effect is only significant within a few hundred meters (less than 1 km) of the ground.
It is useful to note that 77 W/m2 incoming is absorbed by the atmosphere, 58 W/m2 net blackbody radiation is emitted from the ground, and about 105 W/m2 transferred to the atmosphere by conduction/convection/evaporation from the surface. So about 1/4 of the atmospheric heating is due to surface radiation and only 1/3 of surface heat loss is due to radiation. Which is probably why Arrhenius is only about 1/3 right.
I think a picture might help, but I don’t seem to be able to copy it here. The link is: http://en.wikipedia.org/wiki/Image:Atmospheric_Transmission.png
Dan Sage
hence the atmosphere warms.
==============
the simple fact that the lower atmosphere is warming slower than the surface is proof that the warming is not due to CO2.
there is no physical mechanism by which CO2 can cause the surface to warm faster than the lower atmosphere. nor is there any GHG prediction that the surface should warm faster. all GHG predictions call for the lower atmosphere to warm faster.
yet when we compare GISS to RSS for example, the surface is warming faster. this is proof positive that whatever is causing the warming, it cannot be CO2.
“Sigh”.
5. The more energy is buffered in the atmosphere the warmer it is.
=====================
If CO2 is the cause of the warming, the lower atmosphere would be warming faster than the surface. This would lead to a net energy transfer from the atmosphere to the surface, warming the surface.
However, all the records show the surface warming faster than the lower atmosphere. This would lead to a net energy transfer from the surface to the atmosphere, cooling the surface.
What this means is that CO2 cannot be the cause of the surface warming, because CO2 can only warm the surface by FIRST warming the lower atmosphere.
The energy to warm the lower atmosphere comes from CO2 cooling the upper atmosphere, because you cannot get blood from a stone. If more energy is going to the surface to cause warming, it must be taken from somewhere and that somewhere must cool. This cooling of the upper atmosphere leads to the TOA imbalance.
“The Arrhenius people have it about 1/3 right and the Maxwell [gravito-thermal] people are about 2/3rds right.” “So about 1/4 of the atmospheric heating is due to surface radiation and only 1/3 of surface heat loss is due to radiation. Which is probably why Arrhenius is only about 1/3 right.”
I’d say you’re being much to generous to Arrhenius, who didn’t include convective cooling in his greenhouse paper at all. The Chilingar paper calculates heat transfer in the troposphere to be 7% radiative and 93% non-radiative convection and WV condensation, and the 93% dominance of non-radiative heat transport over radiative-convective equilibrium in the troposphere can easily overcome changes in “radiative forcing.”
Chilingar paper: http://hockeyschtick.blogspot.com/2015/07/new-paper-finds-increased-co2-or.html
The Arrhenius theory confuses the cause (gravito-thermal + solar) with the effect (IR absorption/emission from GHGs)
PA August 27, 2015 at 5:03 am
DAN SAGE August 27, 2015 at 6:32 am
Thanks for your attempted responses. However, I asked for EVIDENCE, you know, stuff that’s actually been measured in the real world. I’ve seen all the theory; and if the theory actually worked there must be evidence out there. But the only evidence I can find contradicts the theory. To paraphrase Dr. Feynman: it doesn’t matter how beautiful the theory or who thought of it, if it doesn’t match the evidence the theory is wrong.
PS: And you didn’t answer my questions. I know why not: there is NO explanation possible. If GHE were valid then we would see the evidence throughout geologic history; we would see CO2 changes leading temperature changes in the ice cores; and temperatures would have continued following CO2 upwards for the past two decades. None of it happened, therefore the theory is wrong.
Of course IR-active gases (‘greenhouse’ gases) absorb and re-emit photons (and also preferentially transfer heat by collisions with N2/O2 in the troposphere to accelerate convective cooling). CO2 absorbs and re-emits ~15 micron low-energy/frequency photons “equivalent” to a “partial blackbody” emission temperature of 193K by Wein’s Law. By Planck’s Law, a true blackbody radiating at 193K cannot warm any other blackbody warmer than itself, especially not the 255K Earth blackbody by 33K to 288K as the Arrhenius theory claims. Absorption and remission of 15um photons by CO2 only slows down their ultimate passage to space by a few milliseconds, and this small effect is easily reversed and erased at night. Absorbing and re-emitting photons does not “remove” any “missing heat” from the atmosphere, explained in further detail here:
http://hockeyschtick.blogspot.com/2015/08/why-greenhouse-gases-do-not-remove-any.html
Instead, the only radiative forcing is from the Sun, and atmospheric mass/gravity/pressure redistributes the heat from the Sun to more near the surface and less at the top of the troposphere, proven by another new paper for 6 planets including Earth:
http://hockeyschtick.blogspot.com/2015/08/new-paper-confirms-gravito-thermal.html
Conversation continued at your blog. Cheers! JE
it is interesting that the 1/2 mass of the atmosphere is approximately 5km in height and the average wet lapse rate is 6.5C per km. multiplied together this is about 32C, which is the warming attributed to GHG.
it does seem more likely that what we are seeing is simple conversion of KE/PE via convection and condensation. the top 1/2 the atmosphere is made colder by this, the bottom 1/2 is made warmer. the mid-point remains unchanged, which reflects the energy received by the sun.
the full surface warming then becomes simply the energy from the sun, further warmed by the atmospheric stratification due to the lapse rate. GHG is nowhere in the equation, except that the cooling of the atmosphere by GHG sets the vertical circulation in motion. the more GHG, the faster the convection and condensation, balancing the effects of GHG.
Which is why the calculation for GHG exactly matches the calculations for wet lapse rate and 1/2 atmosphere height. One balances the other.
ferdberple: That’s a good summary of the gravito-thermal GHE. I would add that Feynman discusses the inter-conversion of KE & PE as the source of the temperature gradient of a pure N2/O2 atmosphere on Earth in his Vol 1 Chapter 40 on statistical mechanics, and never once discusses any radiative forcing or greenhouse gases:
http://hockeyschtick.blogspot.com/2015/07/feynman-explains-how-gravitational.html
The reason why the center of mass of the atmosphere is where the 255K ERL and equilibrium temperature with the Sun is located is because the gravitational PE force = mg (Newton’s 2nd Law) as applied to a system of particles is located at the center of mass.
http://www.colorado.edu/physics/phys1110/phys1110_sp01/Notes/Chap10.htm
The is why the HS greenhouse equation calculates F= mg at the center of mass where P=0.5 atmosphere (after density correction).
http://hockeyschtick.blogspot.com/2014/11/quick-and-dirty-explanation-of.html
ferdberple @ August 27, 2015 at 6:56 am
Your comment on the centre of mass of the atmosphere and hockeyschtick’s supplement at 10:07 am is a keeper for me.
hockeyschtick: Does the centre of atmosphere mass concept apply to Venus, with its thick dense atmosphere and slightly different planetary gravity?
“John Eggert, your response was so clear I thought any fool could understand it. Apparently I was wrong ;(”
I see that one fool understood it.
Mark: I’m pretty sure that hockeyschtick understood it. I’m thinking you do to. I’ve been doing calculations that involve the absorptive properties of CO2 for a long time now. None of those have anything to do with climate. Here is an example. A 3 ft square flue carries 3000 ft³/min (STP) of hot gases, and the inside surface temperature of the flue is 100°F cooler than the gases. Calculate the rate of heat flow from the gases to the flue wall per foot of length under the following conditions: a) The gas is dry air at 2500°F, b) The gas is a flue gas at 2500°F, analyzing 12% CO2, 8% H20, 4% O2 and 76% N2. Are you asserting that the answer is identical in both cases?
@ John Eggert August 27, 2015 at 5:07 pm
The fact that you think that heated gases going through a flue proves anything about the topic under discussion is sad. The planet’s surface is not heated up by radiation reflected back to it.
What you need to do to prove your failed hypotheses is to do an experiment that replicates in some way the topic. What you are discussing is not wrong; you are just interpreting the situation incorrectly by thinking it replicates “warming by back radiation”.
By the way, you were going to take up this subject at another blog but did not give a link to the place where you were going to leave a comment. If you did leave one, could you please post a link here for me to follow?
Quote ‘Once again, climate models have shown they are good for one thing and one thing only: to display how poorly they simulate Earth’s climate.’ Yes they do manage that very well. But moving away from the science, stepping further right on the God to Mammon scale*, the models have surely served to raise a great deal of money for their owners and operators.
* That evocative phrase was used by Cuthbert Daniel in a different context, in the preface to his fine book ‘Applications of Statistics to Industrial Experimentation’.
Yes. “Climate Models Fail” is a “dog bites man” sort of headline. It’ll be news when they get something right.
It looks to me like the model ensemble was selected to have the ensemble MEAN match data. Did they document the initial criteria for model selection? Or was it ad hoc?
That is a very perceptive comment.
The only thing the models get right is that the ensemble mean matches the data.
As the ensemble mean has no physical meaning – that can only be due to the choice of ensemble.
So what is the rationale for the choice of ensemble?
And when is it updated to throw out the worst performing models?
in the grand scheme of things, the tiny amount of data have little physical meaning either .so in this instance the data and models are equally poor.
I believe the point is that, having been fitted, they fail totally to match data after their forecasts?
“Because the oceans to depth have a tremendous capacity to store heat, they are supposed to be storing about 93% of the excess heat created by the emissions of manmade greenhouse gases. ”
How is long wavelength radiation supposed to heat the ocean when it is absorbed in the top mm of the ocean surface?
More importantly, how is atmospheric amplification in the upper troposphere going to happen if the energy ends up in the ocean and not the atmosphere! Their BS excuse for the missing warming falsifies the core principle of their theory!
Exactly. Have any of the usual suspects tried to address this “dangerous AGW”-destroying point, or have they swept it under the rug, hoping it will go away?
Tony, I am a skeptic of CAGW and think AGW is much smaller than warmest propose, but your question shows you do not understand how the back radiation effect works. It is a fact, and does cause an atmospheric warming. It results in a decrease in NET radiation up from the surface, and thus is a radiation insulation effect. However, evaporation and convection make up the energy removal, but at a slightly higher temperature. The fact that it is a small effect, and dominated by natural variation, does not change the fact that absorbed back radiation is real. The argument that it is absorbed in the top mm or so is not a limit, due to the fact that it is not a net heating, just a slowing of absorbed solar energy removal by radiation.
Does the radiation loss and evaporation not still occur at the surface? I still don’t see how that is communicated to depth any faster than previously.
No, warming from back radiation is not a fact. It is pseudo science bs that defies all logic scientific laws and basic common sense. The sooner you luke Warmers stop living in fantasy land, the sooner we can all put this stupid hoax to rest for good. Energy transfer occurs from high to low, from hot to cold, from faster to slower. This is an absolute, non negotiable, fundamental fact. No exceptions. EVER!
Energy transfer occurs from high to low
===============================
thus, surface warming cannot occur unless and until there is a warming of the atmosphere, because the atmosphere and surface are tied together via the lapse rate.
thus, unless the atmosphere (read satellites) show warming FIRST, then the surface stations follow, the warming CANNOT be due to CO2. Simple cause and effect.
However, when one looks at the data it is clear that the surface stations are warming first, followed at a lower rate by the atmosphere. This means that the warming CANNOT be due to CO2.
This of course does not mean that the warming is not happening. It simply means that CO2 and back radiation cannot be the cause.
Rather, the cause must be something that is allowing MORE radiation from the sun to reach the surface from the sun. The atmosphere CANNOT be the source of the warming, because it is lagging the surface.
Energy transfer occurs from high to low
===============================
The more correct form of this statement is “Net energy transfer occurs from high to low”.
Thus, it matter not if back radiation is increasing. If surface radiation (including convection and conduction) is increasing faster than back radiation, there will be a net cooling of the surface, given that solar radiation and albedo are constant. There is no other possibility.
And since surface temperatures are seen to be increasing faster than atmospheric temperatures, there is only one logical conclusion possible.
@ferdberple – I have seen research previously posted on here positing that, historically speaking, CO2 increase has *LAGGED* warming. Your description in regard to “Energy transfers from high to low” would seem to follow in this manner, although how that plays into the question of cause/effect I as a layman would never presume to say. Can you speak to this observation? Am I off in thinking there is any relation or is it a completely separate issue?
One of the most frustrating patterns in debates between luke-warmers and full blown, rug-biting sceptics (like me) is the persistent confusion of statistical facts, and facts about individual photons, which are, as they say in more than one profession, anecdotal in nature. The Second Law is a statistical law and it is not open to argument or contradiction, any more than an actuarial table is. The routes that individual photons can take when re-emitted from a CO2 molecule collectively obey that law because you are discussing a mass behaviour and the life history of any individual photon is not relevant. “Back radiation” is statistically (and geometrically) a net cooling in effect. Far more than half of all reradiated LWIR photons will head for space, simply because free paths are longer as altitude increases. In fact, any backward path is likely to be quite short. So while we can go outside any day or night and measure some LWIR coming in from the zenith, those photons are highly unlikely to have traveled far. Very few will have traveled from an altitude of even a few hundred meters back toward the surface.
CO2 increase has *LAGGED* warming.
===============
while this can be shown to be true for ice ages, I’m not sure that there is enough accuracy to show this within the past 100 years.
However, what can be shown, and shown quite clearly is that the surface temperatures are increasing faster that the atmosphere temperatures. For example, look at woodfortrees and compare GISTEMP to RSS.
Since radiation varies as the 4th power of temp, there cannot be a net INCREASE in warming of the surface by the atmosphere during the period 1970-2015.
Think of it this way. In 1970 the surface is at 15C, the lower atmosphere at -15C. By 2015 the surface warms to 17C while the lower atmosphere warms to -14C. Would you accept that there has been an increase in the NET energy travelling from the atmosphere to the surface?
of course not. There must be an increase in the net energy flowing from the surface to the atmosphere. and as a result there must be a net cooling effect on the surface by the atmosphere from 1970-2015. at the time we are told there must be a warming of the surface by the atmosphere.
ferdberple says:
…while this can be shown to be true for ice ages, I’m not sure that there is enough accuracy to show this within the past 100 years.
Here’s some evidence:
And here’s the same thing, from the WoodForTrees site. It’s interesting that there are lots of charts that show CO2 lagging temperature, but I’ve never found one showing that temperature lags CO2. The cause-and-effect seems clear.
Here’s another interesting chart:
http://jonova.s3.amazonaws.com/guest/de/temp-emissions-1850-web.jpg
Will those who support back-radiation in any form, please tell us why, in an age of great experimentalists, Arrhenius’ hypothesis was never proven or refuted empirically?
All gasses, including CO2, emit infrared radiation isotropically – i.e. equally in all directions. Adding CO2 to the atmosphere will therefore increase emissions in all directions, including upwards into space as well as downwards back to the Earth’s surface. Conclusion; If more CO2 makes emissions into space increase, then it makes the Earth cooler not warmer.
Even RealClimate admits (indirectly) that longwave IR can’t heat the oceans
http://hockeyschtick.blogspot.com/2012/09/realclimate-admits-doubling-co2-could.html
and the oceans have over 1000 times the heat capacity of the atmosphere, thus could theoretically absorb ALL of the heat in the atmosphere 1000 times over without any temperature change. This is only theoretical of course since heat rises via convection, and because the atmospheric “blackbody” is much colder than the top of ocean “blackbody”.
As to the claim GHGs are “slowing cooling” not warming the oceans, this is also false. GHGs only slow radiative heat loss to space by a few milliseconds, easily erased and reversed at night. GHGs also increase heat capacity Cp and accelerate convection by collisions with N2/O2, both of which increase cooling.
…. and also, as the surface of much of the global ocean sees it, given the overlap of water vapor and CO2 bands, what’s the difference between CO2 at 280ppm and water vapor at 40,000ppm, and CO2 at 400ppm and water vapor at 40,000ppm ??
PS Responding to Tony at 4:41 am
There is no “energy imbalance” thus this entire post is meaningless, pandering to false assumptions, drivel. If an object (ANY object) is exposed to more heat it will warm until it reaches a new equilibrium, if the heat source is reduced it will cool until it reaches equilibrium. This takes a period of time. This is the ONLY imbalance that exists. CO2, water, methane, etc are NOT a source of heat, therefore they can not cause an imbalance. They may affect the amount of time needed to reach equilibrium when a change in the sun (heat source) occurs, but they can never affect the end state of equilibrium.
Greenhouse gasses absorb heat and then radiate it as IR in all directions, half of it going back toward the surface. Convection is important at lower altitudes but is not sustained at the TOA where radiative heating predominates because the atmosphere is thin. The only form of heat that can be passed to space is radiative heat. When greenhouse gasses are present then for a given T radiative loss of heat will be less. In order for radiative loss to return to its baseline T must rise so that radiative loss increases. So greenhouse gas “warming” is the result of reduced radiative heat loss for a given T. Greenhouse gasses don’t actually warm anything; they retard the transfer of heat.
Take a digital IR picture of a cloud in the sky late in the evening. You’ll find that the cloud is giving off IR that the camera can see even though it’s much colder than the camera. What makes the cloud visible to the camera is back radiation.
GHGs only “retard” radiative heat transfer by a few milliseconds, easily revered & erased at night. Secondly, GHGs accelerate cooling by preferentially transferring heat by collisions with N2/O2, accelerating convective cooling. GHGs also increase heat capacity Cp, which is inversely related to temperature change, and they increase radiative surface area to space, accelerating radiative heat loss to space.
“Convection is important at lower altitudes but is not sustained at the TOA where radiative heating predominates because the atmosphere is thin.”
Convection to the troposphere is substantial. It is the mechanism for establishing the lapse rate. See here.
That convected heat is then essentially free to radiate away. An increase in convection due to increasing temperature thus acts as a negative feedback on energy retention.
“GHGs only “retard” radiative heat transfer by a few milliseconds, easily revered & erased at night.”
You can’t just assume it is erased. It still means nightly cooling starts from a higher level, and declines to a higher level than it otherwise would have been by dawn. When it is all worked out, the average temperature would rise, all other processes held constant (which, of course, they aren’t).
Less than half goes “back toward the surface.” An that fraction decreases inversely with altitude.
“You can’t just assume it is erased. It still means nightly cooling starts from a higher level, and declines to a higher level than it otherwise would have been by dawn. When it is all worked out, the average temperature would rise, all other processes held constant (which, of course, they aren’t).”
If the photon absorption/emission delay is mere milliseconds, it would have to be erased over a 12 hour night. Otherwise, the planet would have been continuously warming over the past millions of years opposite to temperature proxies (assuming constant solar input).
This new paper demonstrates GHGs do not retain any heat on 6 planets, including Earth and Venus, and surface temperature on all 6 is only dependent upon surface pressure & solar insolation, not GHG concentrations or radiative forcing from GHGs:
http://hockeyschtick.blogspot.com/2015/08/new-paper-confirms-gravito-thermal.html
“When it is all worked out, the average temperature would rise, all other processes held constant (which, of course, they aren’t).”
Even if atmospheric temperature rises (for any reason), Kimoto shows how the negative lapse rate feedback would compensate; climate models falsely assume a fixed lapse rate:
http://hockeyschtick.blogspot.com/2015/08/why-climate-modelers-seeking-funds-fame.html
I’m also sure my wall insulation does not cause energy imbalance in the long run, but it might cause the interior to warm or let it cool too much meanwhile. More seriously, a snarky redefinition of a word does not much help in understanding anything. Been there, done that. I’ve also found that when I’m smarter than a few people, chances are I’m dead wrong, though not always.
Hugh’s corollary to Hugh’s law: If you disagree with The Guardian, you are most probably right.
Based on Hugh’s corollary I’m probably right 100% of the time, thanks Hugh very much
Indeed wickedwench it is the variation of heat input that that determines the equilibrium temperature. That the sun cycles and mainstream science has no idea why, that 95% of the energy is missing in the universe one would expect that this missing energy is what drives the universe and changes our sun in a cyclical manner.
I have been waiting most of my life for science to stop chasing rainbows, and to start thinking outside the square. To me the Aether of old, a sea of energy makes more sense.
There are only 3 points in the great CAGW debate that matter:
1) IPCC can’t assign blame to industrialized mankind for the increase in atmospheric CO2 between 1750 and 2011 because they have no reliable numbers for the natural sources and sinks. (& neither can anyone else)
2) The 2 W/m^2 additional RF (imbalance?) due to CO2 between 1750 & 2011 is of no consequence considering the magnitudes and uncertainties in the overall global heat balance especially the heat carried by the water vapor cycle.
3) IPCC admits their GCMs can’t explain the pause/lull/stasis/hiatus and are essentially useless.
All the rest of the discussions and debates are interesting academic sideshows, but simply a lot of distracting noise.
Nicely said… Calorimetry attempting to measure the 4th significant digit & beyond was a problem with cold fusion too: It’s interesting that the 1 W/m^2 order of imbalance at TOA is the same as the variation of incoming solar radiation at ~1366 W/m2 plus or minus 1 or 2 W/m2 and with cloud albedo nonlinearity in tropics, sub-grid speckle with T^4 outgoing, there are indeed a lot of uncertainties. Hansen, Pons, & Fleischman.
Exactly so. It blows my mind that these folks are claiming accuracy for field measurements that couldn’t be achieved at a lab bench. I spent a career measuring various kinds of EM radiation and can tell you that there were times when we were delighted with 20% accuracy.
I do electronics and have worked in science labs. It always amazes me how clueless some very bright scientists are about the limits to measuerement accuracy and repeatabity.
For example, the original floats used to measure ocean temp were no more accurate than +/- 1 degree C and that on a good day,. Argo are much more accurate (0.05 degrees C) and repeatable, but I read somewhere that Argo data was “adjusted” to suit the old floats. Just what kind of science is that ?…
Nicholas,
For your point 1):
One doesn’t need to know any individual natural CO2 influx or outflux, as one knows the net result of all these fluxes. Together with all the other observations, that is sufficient proof that humans are the cause of the CO2 increase in the atmosphere. See:
http://www.ferdinand-engelbeen.be/klimaat/co2_origin.html
No problem with points 2) and 3)
The average TOA energy imbalance (red curve) in recent years is in the expected range…
===========================
as to be expected when double blind controls are ignored.
https://en.wikipedia.org/wiki/Observer-expectancy_effect
The observer-expectancy effect (also called the experimenter-expectancy effect, expectancy bias, observer effect, or experimenter effect) is a form of reactivity in which a researcher’s cognitive bias causes them to unconsciously influence the participants of an experiment.
Thanks, Bob.
“Once again, climate models have shown they are good for one thing and one thing only: to display how poorly they simulate Earth’s climate.”
Yes, they simulate a climate controlled by CO2, not by oceans.
So…according to these models, we should be seeing things, all things, heating up, or according to some models, all things cooling off, since the final affects of CO2 (heating or cooling) should be well mixed.
Given the current state of TOA models, we are making global policy decisions based on Mario Brothers version 1. Anyone paying taxes on that should be stark raging mad and bemoan the fact that there just isn’t enough jail space.
Pamela, I respectfully disagree, it’s policy decisions based on Nolan Bushnell’s original beta code that was used as an exemplar for Chicago Coin’s arcade game “Speedway” (circa 1968)
Mario Brothers version 1 is substantially more sophisticated than current climate models
HA!!! I cut my teeth on a WANG and played Pong after the last researcher in the lab went home. During working hours I put my data into the computer with punch cards and worked with true floppies. http://www.computerhope.com/jargon/p/punccard.htm. Beat that!!!!
http://www.ponggame.org/
However I would agree that Mario Brothers v1 is indeed leagues ahead of climate models.
Thanks Bob. Important to evaluations of model accuracy.
Further to your methodology, Nir Shaviv wrote:
Shaviv, N. J. (2008), Using the oceans as a calorimeter to quantify the solar radiative forcing, J. Geophys. Res., 113, A11101, doi:10.1029/2007JA012989.
Summarized by Ken Gregory. Shaviv has 23 citations including:
Quantifying the role of solar radiative forcing over the 20th century
The Climatic role of the Sun – How, How Much and What does it Mean?
I am just a layman but am I wrong about the following position of the IPCC using it’s AR5 Climate Models?
1. There is no agreement in IPCC models with respect to TOA energy imbalance.
2. There is no clear understanding of TOA energy imbalance, the IPCC models having wildly varying results.
3. IPCC uses an average of clearly misunderstood models to conclude that oceans are absorbing nearly all the heat caused by Anthropogenic release of CO2.
4. The IPCC models show/predict ocean warming greater than the inadequate measurements we have on ocean temperature.
5. This all occurs without atmospheric warming.
6. There can be no doubt that CAGW is occurring and we must spend $Trillions to combat it.
Gregory, have you read IPCC AR5? It’s a free download. In particular TS.6, Key Uncertainties. You don’t have to be a scientist, just read and look for all the weasel words. e.g. Text box 9.2 (the models don’t work and we don’t know why.) is also interesting. Worst case sea level rise, RCP 8.5, takes 450 years. Google “Climate change in 12 minutes.”
IPCC AR5 TS.6 Key Uncertainties is where climate science “experts” admit what they don’t know about some really important stuff. IPCC is uncertain about the connection between climate change and extreme weather especially drought. IPCC is uncertain about how the ice caps and sheets behave. Instead of gone missing they are bigger than ever. IPCC is uncertain about heating in the ocean below 2,000 meters which is 50% of it, but they “wag” that’s where the missing heat of the AGW hiatus went, maybe. IPCC is uncertain about the magnitude of the CO2 feedback loop, which is not surprising since after 18 plus years of rising CO2 and no rising temperatures it’s pretty clear whatever the magnitude, CO2 makes no difference.
Do you have the link? I can only find the Synthesis Report and lots of drafts?
Climate change in 12 minutes was most informative, thanks.
I hope you can find it in here:
http://www.ipcc.ch/report/ar5/wg1/
the full report link downloads a 1552 pages pdf.
Bob,
“And the differences in the simulated ocean heat accumulation are so great that using the model mean to represent the models is very misleading, because the model mean gives the impression of a consensus ”
Though nonsensical, this may actually be a good thing as it indicates that at the model level there is no consensus. Of course at the conclusion level all is brought back to the consensus. And I believe that any skeptic would agree that consensus science is not science or at very best poor science. I have presented a short plan to the powers that be in our high school where I sub for math and science courses to teach the concept of skepticism in science and a few basic statistical tools for the kids to use in order to be capable of questioning “study” results and conclusions. It starts with the concept that correlation is not always causal. So far the idea has met with resistance. What a surprise!
You shouldn’t have used the word skepticism. Administrators have been taught that such a thing is evil. Try Critical Thinking Skills in Science-basic tools that allow students to accurately scrutinize scientific study results themselves.
Why does El Niño is not working.
http://earth.nullschool.net/#current/wind/isobaric/250hPa/orthographic=-115.26,1.79,819
Ren, are you showing us the start of the end for El Nino?
Yes.
http://earth.nullschool.net/#current/ocean/surface/currents/orthographic=-115.09,9.37,356
Brett these cyclones will be visible from satellite.
http://earth.nullschool.net/#2015/08/31/1200Z/wind/isobaric/1000hPa/orthographic=-146.64,11.61,512
Thanks, ren – bookmarked links to watch progress
When solar activity reaches the low solar average parameters I suggest we will see the ocean response which will be negative as far as heat retention.
The models do not incorporate solar variability to any degree if at all therefore they are useless.
Bob presents the data the best I have ever seen! A great teacher of showing how things work and are. I get so much out of all of his articles.
IPCC is concerned entirely and solely with what man does, natural variability is not their concern. It says so in their very mandate for existence.
So we have thermometer data from 1% of the heat store and think (somehow) we can ignore tranfers between stores and variation in source of heat, and then say ANYTHING that matters? Have these folks never done calorimetry at all? Even in highschool chemistry?
Nice work Bob. I did a similar analysis a few years ago using 0-700m and concluded that the total OHC energy gain is currently right around 0.5W/m^2, which is the same as TOA imbalance (since the atmosphere has virtually no heat capacity compared to oceans). Given that a doubling should be producing 3.7W/m^2 total, and we are at 0.51 doublings now (log2(400/280)), we should be seeing 1.9W/m^2 at a feedback of zero, including all ocean depths. Since we only see 0.5 W/m^2, we are seeing vastly less energy gain to the system than the “consensus” 3x multiplier. Instead of seeing a 3x multiplier, we are seeing instead a 3.77 divisor, meaning the IPCC projections are off by a factor of 11.3x. I realize they’re consistently walking back the +feedback idea by inching it down (and it is probably estimated at less than the 3x factor I used), but they need to abandon it totally and start dividing by 3 or more. Or scrap the ARGO units and continue living in a dream world. I don’t think anyone who has analyzed OHC like this can take H2O positive feedback seriously anymore. OHC is the Achilles heel of the entire theory.
For me, it’s already dead. My analysis a few years ago pretty much solidified the case for me. But now I’m leaning toward the idea that the entire forcing/feedback paradigm is simply wrong. It’s a convenient way to look at the system, and I don’t think the effect of CO2 is zero, but depending on where you are on earth and the time of day, feedback is as low as almost -infinity. If it hasn’t started raining yet that day, it could be +10 in your locale. The important thing is the integral over the entire sphere at any given moment. It’s not all perfectly regulated like the tropics, so there almost has to be an impact, but even the poles tend to self regulate. Right now, the multiplier is about 0.27x, NOT 3x. That’s negative feedback.
If there is an energy imbalance at TOA because the oceans are heating up, this imbalance should be smaller over land. Clearly, horizontal convective heat transport will diminish this effect. But I think it should show up in a spatially resolved comparison of the models with data.
I suggest the following as a corrective to Tisdale’s argument:
https://andthentheresphysics.wordpress.com/2014/10/28/bob-tisdale-is-wrong/
What utter garbage, and entirely irrelevant to the subject of the post. It’s mostly about a viciously ad hominem blogger.
What rising temperature? The atmosphere is cooling, as shown by satellite and balloon data. How did that fact escape your notice?
Still waiting for you to present the data which you imagine supports AGW.
Please explain how on your planet it’s possible for man-made CO2 to be the primary driver of “climate change” over the past 70 years, when for most of that time the climate has cooled or stayed flat, rather than warmed, as required by the repeatedly falsified hypothesis in which you believe, contrary to all actual evidence.
warrenlb:
Do you bother read material you post? It is entirely unrelated to this subject. No facts whatsoever, just an emotional blurt from 2014. Do you have anything relevant and documented that you can provide?
No, he doesn’t and never has had. Nor can he explain why he believed in AGW despite these facts:
1945-76: Rising CO2, cooling earth.
1977-96: Rising CO2, allegedly warming earth.
1997-2015: Rising CO2, cooling earth.
Gloria S says to warrenlb:
Still waiting for you to present the data which you imagine supports AGW.
He has none. I’ve asked him repeatedly for the past few years to post a measurement quantifying AGW. The only response I get (if I even get one) is an appeal to authority fallacy, or something completely unrelated like he posts here.
Gloria continues:
Please explain how on your planet it’s possible for man-made CO2 to be the primary driver of “climate change” over the past 70 years, when for most of that time the climate has cooled or stayed flat, rather than warmed, as required by the repeatedly falsified hypothesis in which you believe, contrary to all actual evidence.
There is no hard evidence showing that CO2 drives temperature. That narrative is simply a conjecture; an opinion. But there is hard evidence showing that temperature drives CO2:
(Click in chart to embiggen)
When we look at a longer time frame, it is clear that there is no correlation supporting the belief that CO2 drives global T:
http://jonova.s3.amazonaws.com/guest/de/temp-emissions-1850-web.jpg
warrenlb lost the science debate a long time ago because he has no measurements, data or evidence. His only arguments are logical fallacies and baseless assertions.
Lack of correlation implies lack of causation in this case.
Warren, how can that be a corrective,when it was written in 2014?
It doesn’t address the post content here and now at all.
oooh, attp getting tetchy since being “outed” . the comments on any blog are very telling. echo chambers indicate inability to deal with questions relating to the blog owners and followers beliefs . the attp blog,just like sks is an echo chamber.
ROFL
Trouble is, climate scientists still can’t take numbers seriously, as if the little critters were made of rubber.
Here is the CERES_EBAF-TOA_Ed2.8 dataset. According to it global average ToA (Top of Atmosphere) radiative imbalance is 643 mW/m² for the decade 2005-2014 (the ARGO era).
However, satellite measurements are far too inaccurate to measure radiative imbalance. This value is said to be arrived at by adjusting it to OHC (Ocean Heat Content) by a process called CERES EBAF Net Balancing.
At the same time we also have OHC data. According to it in the same decade average annual heat accumulation in the upper 700 m of oceans is 0.417×10²² Joule. If IPCC AR5 is correct, and it is indeed 64% of the entire global heat accumulation, it translates to a net ToA radiative imbalance of 405 mW/m².
Somehow the value CERES EBAF arrived at is 59% higher than that. Go figure.
Great Post Bob.
I have been preaching for several years that the IPCC forecasts based on the GCM outputs fall into the not even wrong category. The climate models on which the entire Catastrophic Global Warming delusion rests are built without regard to the natural 60 and more importantly 1000 year cycles so obvious in the temperature record. The modelers approach is simply a scientific disaster and lacks even average commonsense .It is exactly like taking the temperature trend from say Feb – July and projecting it ahead linearly for 20 years or so. They back tune their models for less than 100 years when the relevant time scale is millennial. This is scientific malfeasance on a grand scale.
A new forecasting method needs to be adopted. For forecasts of the timing and extent of the coming cooling based on the natural solar activity cycles – most importantly the millennial cycle – and using the neutron count and 10Be record as the most useful proxy for solar activity check my blog-post at
http://climatesense-norpag.blogspot.com/2014/07/climate-forecasting-methods-and-cooling.html
(Section 1 has a complete discussion of the uselessness of the climate models.)
Again Bob has hit at the heart of one of the climate issues. Very good post.
Bob, I have not parsed all of this excessively long article because life is too short.
However, based of the first few pages I see two fundamental problems.
1/ OHC data back to 1955 is BS. Don’t give any credence to it by even considering it. OHC to 200m was not sample. Period. We missed that opertunity. There is no point at all in pretending those figures even MAY mean something. In fact it is nothing but a deception. If data with a reasonable coverage is not available, live with it, do not try to pretend that badly sampled data “may” be good enough for an approximation. NO, that data does not exist. Sorry, we missed the boat.
2. You main worry seems be the ratio to be used. You can not “average” it one way or the other. From no more than 10m down the ground it warmer than the surface. Specific heat capacity is way different and mainly depends upon how ‘moist’ the tiny grains of rock are that we call soil.
The only way to address this problem is with a land/sea mask and then work with the energy flux for the oceans.
You cannot take the average of two fundamentally incompatible quantities when doing physical calculations. Don’t even try.
There is no correct ratio since it is all meaningless. That is why even a genius climatologist like Gav is having problems.
When l look at the global SST map on the ENSO page. lt seems to me the Gulf Stream as it moves away from the North America coast is taking a more southern track then normal.
ls this the case.?
And if so could that be part of the reason for the recent cooling of the northern Atlantic.
just as likely the southerly deflection is a result of the cooling.
How much worth is the model mean?
The following is a quote from the contribution from Working group I to the fifth assessment report by the Intergovernmental Panel on Climate Change.:
Box 12.1 | Methods to Quantify Model Agreement in Maps
“The climate change projections in this report are based on ensembles of climate models. The ensemble mean is a useful quantity to characterize the average response to external forcings, but does not convey any information on the robustness of this response across models, its uncertainty and/or likelihood or its magnitude relative to unforced climate variability.”
This can be regarded as a glimpse of realism. Except from the logical fallacy expressed in the same section. Let us rephrase the section:
The ensemble mean does not convey any information on:
– the robustness of this response across models
– its uncertainty
– likelihood
– its magnitude relative to unforced climate variability
but it is a useful quantity to characterize the average response to external forcing.
That is a quite silly thing to say – isn´t it?
How can it be useful when you do not know
– if it is robust
– its uncertainty
– its likelihood
– its magnitude relative to unforced climate variability?
Exactly what is the ensemble mean then supposed to be useful for?
Later in the same section it is stated:
“There is some debate in the literature on how the multi-model ensembles should be interpreted statistically. This and past IPCC reports treat the model spread as some measure of uncertainty, irrespective of the number of models, which implies an ‘indistinguishable’ interpretation.”
I think this section speaks for it self. What ” implies an indistinguishable interpretation” is supposed to mean – I have no idea – I don’t even find it worth analyzing the argument. If you have read this far – I think you agree with me that it is totally meaningless.
IPCC AR5 acknowledges the pause/hiatus/lull/stasis.
WG1AR5_Chapter09_FINAL
Box 9.2 | Climate Models and the Hiatus in Global Mean Surface Warming of the Past 15 Years
“The observed global mean surface temperature (GMST) has shown a much smaller increasing linear trend over the past 15 years than over the past 30 to 60 years (Section 2.4.3, Figure 2.20, Table 2.7; Figure 9.8; Box 9.2 Figure 1a, c). Depending on the observational data set, the GMST trend over 1998–2012 is estimated to be around one-third to one-half of the trend over 1951–2012 (Section 2.4.3, Table 2.7; Box 9.2 Figure 1a, c). For example, in HadCRUT4 the trend is 0.04ºC per decade over 1998–2012, compared to 0.11ºC per decade over 1951–2012. The reduction in observed GMST trend is most marked in Northern Hemisphere winter (Section 2.4.3; Cohen et al., 2012). Even with this “hiatus” in GMST trend, the decade of the 2000s has been the warmest in the instrumental record of GMST (Section 2.4.3, Figure 2.19). Nevertheless, the occurrence of the hiatus in GMST trend during the past 15 years raises the two related questions of (1) what has caused it and (2) whether climate models are able to reproduce it.”
And two very good questions.
(1) Heat is absorbed/released by oceans, water vapor, clouds, albedo, etc. orders of magnitude greater than CO2.
(2) Obviously no, no they haven’t and can’t.
Bob, Thanks for the post. Three comments:
1) The conversion factor from a global mean TOA radiative imbalance in W/m2 to planetary heat uptake in 10^22 J/year is definitely 1.61,as per Gavin’s OHC Model/Obs Comparison Errata.
2) Quite a few CMIP5 models have significant TOA radiative imbalances in their preindustrial control runs, due to energy leakages etc. It is standard to deduct a model’s preindustrial control run TOA imbalance when calculating TOA radiative imbalances during other simulations, and any drift in the imbalance (very small for most models) is also often allowed for. If you do that, the spread of TOA imbalances at the start of the historical simulation is almost zero for all in CMIP5 models.
The justification normally given for deducting the imbalance is that it is a near constant offset with little relevance to the fidelity of a model’s representation of the climate system or its response to changes in greenhouse gases and other forcings. Whether the imbalance changes materially with GMST is, however, an issue here.
Sometimes the amount of the imbalance deducted is calculated by reference to the period of the control run corresponding to the simulation involved (which is branched off some point of the control run). But I recommend calculating it over the full control run.
3) A comparison of CMIP5 model and observed TOA imbalance/ ocean heat uptake from ~1995-2014 is a cleaner test of model behaviour, since earlier periods are affected by likely over-strong negative aerosol forcing in most models and by volcanic activity.
Hi Nic. (1) Thanks for the confirmation about the scaling factors.
(2) You wrote: “It is standard to deduct a model’s preindustrial control run TOA imbalance when calculating TOA radiative imbalances during other simulations, and any drift in the imbalance (very small for most models) is also often allowed for.”
In other words, the modelers know of the TOA energy imbalance problems and have devised excuses and remedies. Typical. Instead of creating models that work, they create excuses.
(3) I considered doing a shorter timespan, 1995 to present, but I first wanted to present the full run. The next post will be with the revised (higher) scaling factor.
Nic, do you mind if I refer to your comment in the next post?
Cheers.
PS, Nic. It’s odd that the trends of the model mean align with the wrong scaling factor…almost as though the models were tuned to the wrong values.
Hi Bob
You’re welcome to refer to my comment in your next post. You might also want to include Figure 9.17 a) and b) from IPCC AR5 WG1, which show OHC change (0-700m and total) for individual CMIP5 models, their mean, and observational data. Its caption contains the statement “Simulation drift has been removed from all CMIP5 runs with a contemporaneous portion of a quadratic fit to each corresponding pre-industrial control run”.
I believe it is very difficult to avoid some energy leakage, but I think that one should be extra cautious of models that have large prindustrial TOA imbalances.
I don’t know why you get a good match using the lower scaling factor, but I imagine it is a coincidence.
BTW, good idea of your reporting the corrupted CESM1-CAM5 outgoing LW raditation files to KNMI. I reported that various files in the CMIP5 archive were corrupt direct to NCAR at the start of the year, but whilst admitting the problem – not noted on their CMIP5 errata pages – they didn’t seem in any hurry to upload files with the correct data.
IPSL’s treatment of volcanic forcing as a reduction in incoming solar radiation rather than an increase in reflected solar radiation shouldn’t affect the validity of the TOA net radiative imbalance, so you could include their models if you wished.
One perhaps worrying issue is that TOA radiative imbalance in CMIP5 models isn’t necessarily the same as total model planetary heat uptake, even allowing for energy leakage, although it is generally similar. See Smith et al (2015) Earth’s energy imbalance since 1960 in observations and CMIP5 models, Geophy Res Ltrs. http://www.researchgate.net/publication/273059087_Smith_et_al-2015-Geophysical_Research_Letters_-_final_version Compare the yellow and green lines in Figure 3.
Thanks, Nic.
Anyone who thinks there is a great variety of ideas among the comments here, should check the contribution from working group I to the fifth assessment report by IPCC. It is well worth a read, quite entertaining. There are many glimpses of realism – the realism just fails to find its way to the conclusions by IPCC.
Ref: WG1AR5 2.3.1 Global Mean Radiation Budget
“The emerging debate reflects potential remaining deficiencies in the quantification of the radiative and non-radiative energy balance components and associated uncertainty ranges, as well as in the consistent representation of the global mean energy and water budgets ”
Ref also: WG1AR5 2.3.2 Changes in Top of the Atmosphere Radiation Budget
“The divergence after 2004 is referred to as ‘‘missing energy’’ by Trenberth and Fasullo (2012b), who further argue that the main sink of the missing energy likely occurs at ocean depths below 275 m.”
I think it is hard to understand how the energy is supposed to
– be absorbed by CO2 in the atmosphere
– but fail to warm the atmosphere (ref satellite records)
– the pass the upper 275 m of the oceans without warming it
– and then warm the deep oceans (In which the temperature happen to be scarcely sampled)
IPCC don´t even try to explain it properly.
Re: Figure 5.
Keep in mind, before the early 2000s when the ARGO floats were deployed, the NODC ocean heat content data for the top 2000 meters are based on very few temperature and salinity measurements. Phrased differently, before the ARGO era [ i.e pre-2003], the NODC ocean heat content data to depths of 2000 meters are basically make-believe data.
I agree! So why give it any prominence at all? It is make-believe * obfuscation^4.
1. The Levitus “data” comes from poorly sampled temperature measurements in space and time.
http://i1367.photobucket.com/albums/r782/Stephen_Rasey/140210OHCAbraham2013_zps0e3b2b6d.jpg
The Office of Naval Research, which paid for these profiles, had as its mission the understanding of thermoclines in submarine petrol area. They didn’t care about water temps at the equator, much less the Souhern hemisphere. Plot the number of data points by year and latitude and you’ll see the problem of non-uniform sampling.
2. The Levitus units are in Joules. 10^22 Joules, to be sure, but it is left as an exercise to the reader, if not left to faith, that it amounts to anything significant.
An important climate constant to keep in mind is that it takes 2.75E+22 Joules = 27.5 ZJ to raise the 0-2000 meter water column a grand total of 0.01 deg C. So the entire 1955-2014 “data” trend is a whopping 0.10 Dec C or maybe 0.015 Deg C / decade. This 0.015 Deg C / Decade is only arguable within the ARGO’s thermal precision, but couple that with its temporal and spatial under-sampling, even that precision is in doubt within the ARGO era, much less before.
3. No error bars. And even when error bars are shown, they are only based upon the uncertainty from the biased spacial sampling of the data. See point 1.
4. What has been done to the ARGO data to make it conform to the make-believe pre-ARGO data is itself without merit.
http://wattsupwiththat.com/2011/03/20/ocean-heat-content-adjustments-follow-up-and-more-missing-heat/
http://wattsupwiththat.com/2015/06/05/has-noaa-ncdcs-tom-karl-repealed-the-laws-of-thermodynamics/
Adendum: the images (b) and (c) are data coverage maps b=1960, c=1985. from Abraham, J. P., et al. (2013) (pdf),
Do you mean 0.01 ºC or maybe 0.015 ºC/decade?
No, what I wrote was correct. 27.5 ZJ will raise the 0-2000 m water column a total of 0.01 deg C and it is irrelevant how long it takes.
The specific curve from 1955 to 2015 (six decades) rose by about 270 ZJ, so the total temp rise is under 0.10 deg C and over the 6 decades it works out to be 0.015 deg C / decade on average.
Latent heat over ocean is around 80 W/m2 and therefore the TAO (3.7 W/m2) and surface (1.0 W/m2) have to be larger than this value to make any noticeable difference. If TOA and surface were around 80+ times higher than observed, we would probably notice a little ocean warming directly from the TOA energy balance. There is none observed and even the entire atmosphere above a water body with latent heat, show no warming in experiment you can do in your garden. All we are seeing at times are slight increases in moderate deeper ocean waters due to increasing solar radiation penetration at the surface. It changes the AGW scare to only 29% of the land and without the main 71% there will be no catastrophic global warming and why the planet has never shown a projection this will ever happen.
Bob
Arond this area
https://noconsensus.wordpress.com/2015/08/25/1234/
So in Fig.14, which models were represented by the blue and brown lines that best tracked the data trend? I couldn’t match them with the color legend.
Bob
There should be a fourth component added to the shortwave solar radiation, which is the reflectance of the sun off the ocean. I see it in the satellite image data all the time. It occurs over hundreds of thousands of square miles of the ocean and it is at least 3-5x brighter than the surface of the ocean. I have never seen this accounted for in the models.
Thanks
I think I’m missing something here. All 2W/M^2 are not created equal. CO2 traps IR between 13 & 18µ. Those wavelengths don’t penetrate the oceans, and in fact most likely cause evaporation and cooling of the oceans. If those 2W/M^2 were of blue light they would warm the oceans. Simply take an 2W/M^2 IR light and shine it through a 13 to 18µ filter onto water. The water won’t warm. Shine a 2W/M^2 red light on the water and it will warm.
http://oceanservice.noaa.gov/facts/lightinocean.jpg
http://www.montereyinstitute.org/noaa/lesson06/wavelength_chart.jpg
Also, changing CO2 from 250 to 400 only adds 2.2W/M^2 under ideal clear skys. Add clouds and you lose 25 W/M^2. With such extreme natural variation, CO2 becomes immaterial.
http://climatemodels.uchicago.edu/modtran/
Someone please explain to me how 13 to 18µ IR at 2W/M^2 warm the oceans. Would someone point me to where this experiment was run and what were the results. Can you in fact warm water with 13 to 18µ IR at 2W/M^2.
“Someone please explain to me how 13 to 18µ IR at 2W/M^2 warm the oceans. Would someone point me to where this experiment was run and what were the results. Can you in fact warm water with 13 to 18µ IR at 2W/M^2.”
The closest “experiment” I’m aware of is this one on RealClimate, which apparently was never published in a journal (likely due to its very inconvenient results for CAGW), and in which they apparently didn’t define what wavelengths they considered as LWIR, but shows ability of 2 W/m2 LWIR to heat the oceans to be effectively nil. RealClimate does a spin job on the data to try to claim otherwise:
http://hockeyschtick.blogspot.com/2012/09/realclimate-admits-doubling-co2-could.html
That is my point. The warming of the oceans is a smoking gun. WUWT should focus on the issues with the greatest bang for the bucks. Same thing with how does CO2 lead temperature coming out of an ice age, or how does CO2 trapping heat result in colder temperatures, or how does an increase in CO2 result in a pause. The defined GHG effect has certain mechanisms by which it works, and it doesn’t allow for a pause or fall in temperatures. The only way CO2 affects climate change is through trapping heat and warming. If there is no warming it can’t be causing the climate change. There are no legitimate mechanisms by which CO2 can lead temperature coming out of an ice age, at least not one that repeats on a cycle…except maybe volcanoes and that opens another can of worms.
The words “cooler” colors in the context of the spectrum above is idiotic.
Bob: I love your work. I love the way you dissect the IPPC. However, I caution you: Ocean heat, prior to the Argo Buoys is a FICTION. There is no basis in fact. It’s contrived from US Navy data which was taken with NO quality control and NO standards, and primarily was done to locate the thermocline for submarine warfare.
So we already established here at WUWT that the individual models have been synthetically tuned, with circular logic, to show CO2 GHE via rising global anomaly temperatures.
Furthermore, Tony Heller and the recent post here at WUWT has demonstrated that NOAA has fudged the USHCN temperature records vs CO2, one that already shows they are tuning the temp data to atmospheric CO2 concentration.
Then is not such a stretch to think that the selected/archived CMIP ensemble of models then also provides a “tuned mean” value to coincide with the past temperatures?
Of course they did. NOAA/NASA Climate agencies are now fully corrupted to support the politcal narrative. NOAA and NASA climate agencies have fully succuumbed to a NCC mentality via “the ends justify the means” science dishonesty.
If I sent this to any of my Facebook friends, they would all say the charts and graphs all go uphill for both the models, and the observed data, which shows continued global warming they will think. Even though most show watts/meter squared. The CAGW warmist people will all say the same. And where is the 18+ year pause in all this data? Just from a layman’s point of view.
How do you explain in a couple sentences that this doesn’t show that global warming is out of control – to the “masses”?
The argument is that the “missing heat” is being captured by (i.e., stored in) the oceans. Therefore, the gradual increase in the system’s total energy is not reflected in surface temperatures — yet.
Nic Lewis confirmed that the conversion of TOA imbalance in W/m^2 to planetary energy uptake is 1 W/m^2 = 1.61 x10^22 J/yr. Using the earth’s surface of 5.10 X10^14 m^2, the conversion is:
1 W/m^2 = J/(s.m^2) x (365x3600x24) s/yr x 5.10 x10^14 m^2 = 1.61 10^22 J/yr for the earth.
If you assume that the oceans absorbs 93% of the planetary energy uptake, then the oceans would absorb 0.93 x 1.61 x10^22 J/yr = 1.5 x10^22 J/yr for each W/m2 of top of atmosphere imbalance. Bob Tisdale incorrectly used 1.06 x10^22 J/yr of ocean heat uptake per W/m^2 of earth TOA imbalance.
Ken, I used the wrong scaling factor for a reason…simply to show that, oddly, the model mean trends and the data trends agree with the wrong scaling factor. The next post, with the correct scaling factor, will show even greater differences between data and models.
Cheers
I’m still waiting to be told authoritatively what proportion of the observed increase of carbon dioxide in the atmosphere arises as a result of human activity.
My reading tells me that the answer is a single figure percentage. Jo Nova asserts it is 4%, the low end; elsewhere I’ve seen 6% and 7% at the high end of estimates.
I would have supposed that before we embarked upon such hazardous escapades as carbon capture and storage (think Lake Nyos, Cameroon in 1986) we’d have a high degree of confidence that we were doing something effective.
Leaving aside estimations of human contributions it is apparent that carbon dioxide is falsely arraigned as the author of warming; the historical record indicates that increase of carbon dioxide in the atmosphere follows heating of the planet. Warming bodies of water (oceans, lakes and that contained in pots on stoves) necessarily releases dissolved gases (which include carbon dioxide). Am I missing something here? Isn’t it that simple?
As to the preposterous concept of “carbon pollution”, which I first heard uttered by Australia’s then Prime Minister Gillard several years back, what word does that leave us to apply to the legion of actual pollutants our industrial technologies have bequeathed us?
I’m quite bewildered by the momentum the Intergovernmental Panel of Climate Charlatans has been able to generate in stampeding opinion through the use of quasi-science and the simple repeating of discredited assertions (that glaciers are disappearing was trotted out again recently notwithstanding that the Indian government had gone to pains to assure the world that those in India were overall increasing).
One can only hope that the Paris meeting will end in disarray and that the whole sham will be forgotten. AGW would not have got legs back in the fifties and sixties when I was educated; the holes in its proponents’ arguments would have been apparent to all; in fact, it would have made a very interesting challenge for Clear Thinking classes. Surely common sense will eventually prevail and this website will become a historical curiosity.
IPCC has long shown the global biogeochemical carbon cycle is at least 33 times larger than the anthropogenic. The deep ocean geological sources and soil biology exchanges are significantly underestimated. There is a one year mixing delay from NH to SH, but the atmospheric tau is 16 years based on the 14C bomb measurements since 1964.
The CO2 component of the total atmosphere flows from sources to sinks just like a river flows from sources to sinks, so CO2 never accumulates any more than water accumulates in a river. Basically that means that the 400 ppm CO2 is 97 percent natural and 3 percent anthropogenic. 400 x .03 is 12 ppm.
You say “IPCC has long shown the global biogeochemical carbon cycle is at least 33 times larger than the anthropogenic.” Where exactly shall I find this statement? Is it in every report? Website?
Mike, the best estimate of the proportion of the observed increase of carbon dioxide in the atmosphere arises as a result of human activity annually is 100%. Over the annual cycle, there are very large natural emissions and large natural sequestration of CO2, giving the sawtooth shape of the monthly CO2 concentration curve, as shown
http://www.friendsofscience.org/assets/documents/FOS%20Essay/GlobalTroposphereTemperaturesAverage.jpg
But we are interested in the longer term increase, not the annual cycle.
Over the 3 years 2009 to 2011, humans emitted 100.2 GTCO2 (Giga tonnes of CO2), but the atmospheric CO2 content increased by only 47.2 GTCO2, so 54% of our emissions were absorbed by natural sinks.
Since nature is absorbing about 17.7 GTCO2 per year, nature is not emitting any net CO2 annually.
Global emissions data to 2011 from CDIAC is:
http://cdiac.ornl.gov/ftp/ndp030/global.1751_2011.ems
Indirectly probably not meaning to, B Tisdale is actually pushing the warmist agenda like most lukewarmer sites. They still do not seem to get it that they have been duped(see graphs above). Stop using their data its just junk cop on!
This issue is likely related to our 2014 APJAS paper (Spencer & Braswell) in which we show (Fig. 1) that the CMIP3 model oceans had widely varying deep-ocean temperature trends. We suggested that maybe the models had energy conservation issues (if a physical model can’t even conserve energy, how the hell can it be used for global warming research??) Since the CMIP3 modelers weren’t required to archive the TOA energy fluxes (!!) we couldn’t investigate this as Bob Tisdale has.
@Abe, do you feel like the thermodynamics elephant in the climate living room these days? 😉
I admit that my own attempts to grasp what is described as ‘back radiation’ and its effect keeps slipping… not in the sense of grasping the math (which I most certainly CANNOT, though I grasp feedback)… rather, intuitively the concept seems to be tied in with Zeno’s Paradoxes https://en.wikipedia.org/wiki/Zeno%27s_paradoxes in some way, as if something real is being described (with claim that it is possible or impossible) in a certain Really Clever Way that not only clouds one’s understanding of it, it actually de-rails understanding for some people.
If this is true, who are the people? If it turns out that those who believe this ‘back radiation’ drivel, as you call it, are not being willful about it but are merely ‘bailing out’ philosophically before completely describing some more complete and smooth phenomenon, such as equilibrium, then what form does that bail-out take…? Where do we go off the rails?
Lots of really good comments and analysis in this thread including Bob’s of course which shows some very important facts about the models which are extremely hard to find.
Some of the models have negative ocean heat uptake? yet they still produce atmospheric/surface warming in the long-run. I mean, that is completely non-physical. The only way they could have warming in the long-run is by introducing a global-warming-fudge-factor to their model or by assuming the atmosphere warms but the ocean cools (again completely non-physical). We pay money for this.
The real Earth energy imbalance is a very small number of about 0.64 W/m2/year which will not lead to any substantive warming in the long-run. Maybe 0.2C in the 0-2000 metre ocean and 1.0C at the surface in 100 years. The climate models have no relevance to what is actually going on.
Bottom line: TOA energy imbalance, even observed imbalance is either wholly or partially comprised of models and assumptions. So the actual onus is on temperature sensors, which themselves do not encourage confidence. Where is the missing heat? Some will point to recent temperatures but those are related to El Nino weather pattern variations. Some will point to the oceans but those show a complicated pattern of surface and subsurface changes in warming patterns likely related to thermodynamics. There may be a slow steady ocean trend under the noise but that may be related to the recovery from a previous deep chill resulting from a sudden influx of massive continent covering ice sheet melt.
All this is to say that statements presented to the media by hot-headed researchers about any imbalance are more often than not wild-ass guesses within the context of a wickedly complex dynamic. Bob highlights the poor model performance which matches the current state of research, regardless of premature “it’s humans what done it” statements we see all too often coming out of the ivory tower orifice. I will leave it up to you to decide which orifice I refer to.
I read down through the interesting thread and then this……
“warrenlb August 26, 2015 at 12:40 pm
I suggest the following as a corrective to Tisdale’s argument:
https://andthentheresphysics.wordpress.com/2014/10/28/bob-tisdale-is-wrong/”
As others have commented there is nothing in that remotely germane or useful.
Instead it is the kind of petulant crap so often the trademark of one David Appell.
.
I am not sure that this is really relevant.
To ensure energy conservation you have two ways
A) either you assume that variation of energy content may drive TOA (for instance, an El Nino event release energy, warms surface, increase radiation)
B) or you don’t
If a model is of “A” kind, then indeed it must take care to coherence between TOA and energy content.
But the whole AGW theory is based on “B” : basic assumption is that heat content don’t drive TOA in any way, only GHG do. In which case they don’t really need to take care of energy conservation, because they can use “heat content” as adjustment variable, taking advantage of the fact that no good enough data exist to check their results. Even better : if the result regarding heat content variation is some kind of huge number (even negative !) , they can use it as a scary propaganda tool (whereas any honest modeler would take it as a clue that the model is questionable).
Said otherwise : climate models are “not even wrong” regarding Global Ocean Heat Content. You simply don’t have the data to falsify their results, far less their assumptions
1.the amount of sunlight reaching the top of the atmosphere (TOA Incident Shortwave Radiation, rsdt),
2.the sunlight being relected back to space primarily by clouds and volcanic aerosols (TOA Outgoing Shortwave Radiation, rsut), and
3.the infrared radiation being emitted by Earth relative to the top of the atmosphere (TOA Outgoing Longwave Radiation, rlut).
The top of the atmosphere energy imbalance is calculated by subtracting the Outgoing Shortwave and Longwave Radiation from Incident Shortwave Radiation.
The above says it all and this is what has to be determined, and also monitored going forward.
Anyone have an explanation as to why the Antarctic sea ice level has suddenly declined?
http://nsidc.org/data/seaice_index/images/daily_images/S_stddev_timeseries.png
Due to the strong solar wind at the beginning of 2015 south polar vortex is strong this winter.
http://www.cpc.ncep.noaa.gov/products/stratosphere/strat-trop/gif_files/time_pres_HGT_ANOM_ALL_SH_2015.png
Temperature very low.
http://www.cpc.ncep.noaa.gov/products/stratosphere/strat-trop/gif_files/time_pres_TEMP_ANOM_ALL_SH_2015.png
http://www.solen.info/solar/images/swind.png
It’s still within the standard deviations. Goddard would know.
Reblogged this on gottadobetterthanthis and commented:
–
Did you read this?
Do you understand it?
It is worth working through and understanding. Pay attention to how long we have actually been measuring. Note how much we assume and how much we simply make up (as in, make-believe) with regard to the data before our current methods of measuring.
Note how unrealistic and nonphysical some of the graphs look (keeping in mind the graphs are from the supposed-experts, not Bob).
Bob, maybe interesting? http://onlinelibrary.wiley.com/doi/10.1002/2015JD023381/abstract . The latest paper of Trenberth. “Different model global mean trends are evident, however, and possibly hinting at too much positive cloud feedback in the model.”
IPCC AR5 suggests net cloud feedback of -20 W/m^2. Where was Trenberth?