Guest Post by Bob Tisdale
INTRODUCTION
Apparently, based initially on a 1975 “first intuition” by an economist (not a climate scientist), politicians have sought to limit global surface warming to 2 deg C above pre-industrial levels by restricting greenhouse gas emissions. To that end, those politicians created the political entity called the Intergovernmental Panel on Climate Change (IPCC), whose sole purpose is to prepare reports to support the politicians’ agendas.
Politicians from around the globe are once again gathering this year to futilely try to reach agreement on how to achieve that goal of limiting global warming to the economist-suggested limit. So, in order to increase public awareness, we’re being bombarded weekly with speculations of pending global-warming gloom and doom. One was a recent article Earth now halfway to UN global warming limit at NewScientist. It included a graph titled “Halfway to hell”, my Figure 1, prepared by chemist Kevin Cowtan. The graph showed that the values of most surface temperature reconstructions would likely rise above a 1.0 deg C anomaly in 2015.

Figure 1
AN EFFORT TO HELP NEWCOMERS UNDERSTAND
What’s novel about that graph? The anomalies (deviations from “normal”) are referenced to pre-industrial times. Global surface temperature reconstruction suppliers typically reference their anomalies to other more-recent time periods. GISS uses 1951-1980, the UKMO uses 1961-1990 and NOAA often uses 1901-2000, while the WMO recommends 1981-2010. Blogger Rob Honeycutt included that Cowtan-prepared graph in his post The 1C Milestone at SkepticalScience and recommended using pre-industrial times as references for anomalies because it was the best way to convey to persons new to global warming where “we currently are relative to a 2C rise in temperature over preindustrial times”.
Obviously, Cowtan and Honeycutt are overlooking something very important. Their graph shows that it took well over a century for global surface temperatures to reach the 1.0 deg C halfway point. Many newcomers will look at the graph and wonder what all of the hubbub is about.
Cowtan and Honeycutt needed to present something more eye-catching, more alarming, if they were going to get their message across, but they didn’t. The “Halfway to hell” graph was the only graph in the NewScientist article and Honeycutt only added to his blog post a graph of CO2 emissions for different scenarios, which is meaningless to most newbies.
The only way for them to illustrate a fast-approaching threshold would be to present climate model simulations of global surface temperatures. But, oddly, the outputs of climate models don’t appear in those articles.
PRESENTING CLIMATE MODEL OUTPUTS REFERENCED TO PRE-INDUSTRIAL TIMES WOULD LIKELY RAISE SKEPTICISM FROM NEWCOMERS
The time-series graph in Figure 2 includes 81 climate model simulations of global surface temperature anomalies for the period starting in 1880 and ending in 2059, with the modelled global surface temperature anomalies referenced to the pre-industrial times of 1880-1899. Long-term surface temperature reconstructions from GISS and NOAA start in 1880, and 2059 is the year when the last climate model reaches the 2 deg C threshold of imaginary bad things. The models are driven by historic forcings through 2005 and the forcings for the projected worst-case (RCP8.5) scenario starting in 2006. Included are 81 separate climate model runs from a bunch of different modeling groups around the globe. (The listing of the 81 climate models and runs are shown in the legend of the elongated version of Figure 2 here.)
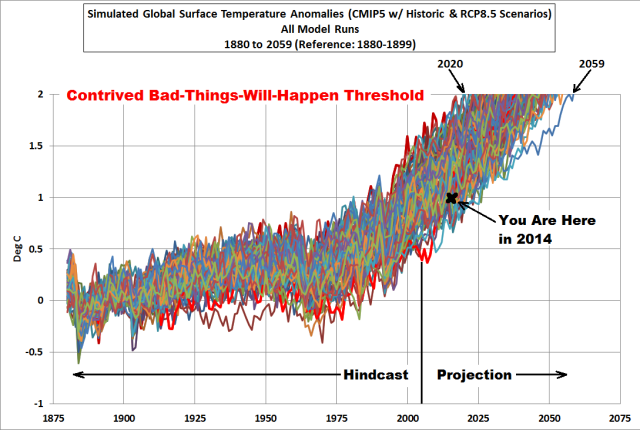
Figure 2
The thing that stands out is the 40-year spread for the time at which climate model simulations of global surface temperature anomalies meet the 2.0 deg C fantasy-based bad-things-might-happen threshold. The slowest model to arrive there does so in 2059 and the quickest model reaches the threshold 5 years from now. Climate models aren’t very helpful when it comes to telling us when we might reach the 2.0 deg C limit.
Maybe that’s why NewScientist and SkepticalScience didn’t present climate models to the newcomers, with the model outputs referenced to pre-industrial times. While it took over a century for observed global surface temperatures to rise 1.0 deg C, the climate models are telling us that the next 1.0 deg C rise will happen in 5 to 44 years. That might be confusing to someone new to global warming. Then somebody like me would have to explain to the newcomers that climate models are not simulating Earth’s climate as it existed in the past, as it exists now, or might exist in the future.
The newcomers might then focus their attentions on 2005, because it was the last year of the hindcast. There appears to be a very large spread in modeled surface temperatures at 2005 when we reference the model outputs to pre-industrial times. And we can confirm that in Figure 3.

Figure 3
So the newcomers to global warming would see that the climate models perform pretty poorly at simulating past global warming. The global temperature anomaly in 2005 from one model is about 1.17 deg C higher than that of another. In other words, there’s a 1.17 deg C spread in the change in simulated global surface temperatures from pre-industrial times to 2005, which is greater than the 1.0 deg C observed rise shown in Kevin Cowtan’s graph (my Figure 1).
And if a newcomer was as curious as I was…and had nothing better to do…she or he just might download all of the 80+ climate model outputs of global surface temperatures with the historic and worst-case RCP8.5 forcings, with the intent of determining the models with the highest and lowest warming rates. Then that newcomer just might compare those models to the warming rate of the alarmist favorite GISS Land-Ocean Temperature Index, with the new NOAA ERSST.v4 pause-buster sea surface temperature reconstruction. See Figure 4. Note that I shifted the GISS LOTI reconstruction and climate model outputs so that the trend lines intersected with zero at 1880.

Figure 4 (I corrected the typo.)
The 0.079 deg C/decade spread in the climate-model-hindcast warming rates from 1880 to 2005 is also greater than the observed warming rate of 0.060 deg C/decade.
ONE LAST POINT
While there’s nothing wrong with presenting the change in temperature as Kevin Cowtan has done (see Figure 1), the climate science community normally relies on linear trends to express changes in a metric over time. Based on the linear trend of the GISS LOTI reconstruction, global surface temperatures have only risen 0.9 deg C since 1880. See Figure 5. It’ll be a while longer (maybe a decade, based on the linear trend from 1880 to 2014) until we reach the halfway mark of the 2 deg C threshold.

Figure 5
Just in case you’re wondering, let’s look at the linear trends of the Berkeley Earth (BEST), the Cowtan and Way, the NOAA NCEI and the UKMO HACRUT4 global surface temperature reconstructions. Only the trend-line value in 2014 of Berkeley Earth comes close to 1.0 deg C. The others show increases (based on their warming rates from 1880 to 2014) that range from 0.9 deg C to 0.85 deg C.

Figure 6
CLOSING
Using pre-industrial times as the bases for anomalies helps to illustrate something very important to persons new to global warming: climate models do a poor job of simulating past global warming. Why then should those newcomers believe the political-agenda-financed climate-model predictions of future global warming that are based on speculations about yet-to-come emissions of greenhouse gases?
SOURCES
The following are links to the data for the long-term global surface temperature reconstructions:
- Berkeley Earth
- Cowtan and Way
- GISS LOTI
- HADCRUT4
- NOAA NCEI (Click on the “Anomalies and Index Data” link)
The climate model outputs are available through the KNMI Climate Explorer.
Happy Friday.
Same to you Bob.
Pointman
For some of us its Saturday 🙂 Looking at Fig. 2 prods me to just get on and down load the data and do it for absolute rather than anomalies and see the spread. It may only be an index but it is an index that reflects what is happening to physical phenomena on the modeled globe.
Venus. 1000millibars= 66C
More than 3400 times the pre industrial concentration on Earth yet closer to the sun. No global warming. No greenhouse effect. None. Zero. Nada. Zilch.
I’m astonished. This is off-topic, but I’ll question this anyway.
66 C is higher than at Earth. How much higher it should be, and why? What is your source for that calculation? It ain’t trivial, I can tell you.
I mean, even if you were right, how can you provide a factoid and assume I’d just digest it as a proof, when you didn’t prove anything.
I don’t have any Venera lander data, but here are a couple Magellan orbiter charts from two decades ago. I get 434K, which is well above 66°C.
http://www.rockyhigh66.org/stuff/venus-p.png
http://www.rockyhigh66.org/stuff/venus-t.png
Plus, its not at the surface. Venus has so much atmosphere, that the equivalent air pressure is quite high up in the venusian atmosphere. Plus the CO2 concentration is so high that it could be saturating IR wavelengths on Venus in ways that we are not on earth. To extrapolate from one number to ‘no greenhouse’ is invalid. There’s quite a bit of apple’s vs oranges going on there.
https://en.wikipedia.org/wiki/Atmosphere_of_Venus
66C around ~51 km. But that is not the point. It could be colder, and didn’t prove a thing.
The Venusian atmosphere has a mas equivalent to the mass of the Earth’s oceans and acts more like our ocean than our atmosphere. Just as the boundary between the deep ocean and Earth’s solid surface is about 0C and independent of surface or solar conditions, the boundary between the Venusian ocean (its dense CO2 atmosphere and its solid surface is similarly constrained by the PVT profile of the ‘ocean’ between it and the surface that’s actually in equilibrium with the Sun, which for Venus, is high up in its clouds. Like Earth’s ocean bottom, the Venusian surface has no seasonal or diurnal variability and as such, is just as isolated from the Sun and GHG effects. Given that some top layer of the Venusian atmosphere is in equilibrium with the Sun, the PVT profile of the CO2 ocean between it and the solid surface dictates the required surface temperature. This is for the same exact reason that the atmosphere heats up as we dive into the atmosphere of a gas giant. It’s called gravity.
Owing to many errors made by Hansen and Schlesinger when they first quantified climate system feedback (which persist to this day), the fact that any kind of runaway effect related to feedback is a physical impossibility is obscured. One of the many flaws is that Bode’s feedback control theory which climate feedback its based on assumes that the amplifier block measures the input+feedback to determine how much power to deliver to the output from an effectively infinite external source, while in the actual climate system, the output power originates from the input and feedback power itself. This otherwise unaccounted for COE constraint precludes any runaway effect due to any kind of realizable feedback.
One more significant difference is that Earth clouds are tightly thermodynamically coupled to the oceans surface via hydro cycle, while on Venus, the clouds comprise a thermodynamic system completely independent of its solid surface.
But the ALBEDO on my planet is much higher than Earth, over 70% of sunlight is reflected by the sulfuric acid clouds. The EFFECTIVE temperature of Venus is LESS than Earth’s. Cloudtop temperature is -35C (that’s 238K, really cold).
Lubos Motl pointed out some time ago that we passed the ‘halfway point’ in terms of CO2 warming back in 2010, since CO2’s effect is logarithmic.
I’m sure this claim makes sense to someone, for me it does not.
The logarithm really does something, but not what you said.
http://motls.blogspot.fi/2014/09/one-half-of-co2-doubling-achieved.html
Half a CO2-doubling in terms of warming vs. halfway to 2C. Different things.
Hugh, the effects, or purported effects, of a doubling occur faster on the first half doubling, because the logarithmic curve is steeper in the first half. So in a doubling from 280 to 560ppm, the “effect” half-way point is around 396ppm (not the arithmetic mean of 420ppm).
A better way to put it is that you get the same amount of warming from the last X% increase that would occur in the next X% increase. That’s how log works The 400/280 ppm ratio, an increase of 42%, gave us 0.7C rise in 70 years, and thus the next 42% increase, to 568 ppm, will give another 0.7C, more or less.
Since we are increasing by 2ppm per year and Co2 absorption is taking half of emissions, it will take 85 years to get to 568ppm, ie we will be there at 2100.
So we can expect another ~0.1C rise per decade on average and be ~0.7C warmer … in 2100.
Now, what’s funny is that a simplistic observational-based ‘model’ (aka back of envelope calculation) is better than the billion-dollar model$ the IPCC shares that overstate the warming. if the Motl point is that we are already ‘halfway to the warming expected by 2100’ he’s about right.
… so there is technically nothing wrong in your comment, it just didn’t make sense to me in the context.
OK, you already got it while I was typing …..
Writes Mr. Tisdale:
Yep. If an explanation of natural phenomena can’t account for precedent observations in the same domain, how the hell can it be received as anything other than an idiot burble worth nothing more than summary dismissal?
What science is there – really – in the catastrophists’ “consensus science” on AGW?
Reblogged this on The Grey Enigma and commented:
Using pre-industrial times as the bases for anomalies helps to illustrate something very important to persons new to global warming: climate models do a poor job of simulating past global warming. Why then should those newcomers believe the political-agenda-financed climate-model predictions of future global warming that are based on speculations about yet-to-come emissions of greenhouse gases?
We used to hear about a “tipping point”. If that temperature were exceeded then non-linear positive feedback would cause the temperature to soar to catastrophic levels.
Have the alarmists given up on the tipping point?
Don’t know about alarmists, but anyone who gives it a few minutes’ serious thought should find the concept absurd. There have been countless opportunities in Earth’s history for the “tipping point”, but curiously it has never “tipped” in all those billions of years.
Actually there is a catastrophic “tipping point” around and the earth has crossed it numerous times .
273.15K == 0c .
Only a few degrees below our aphelion gray body temperature .
The consequence of this tipping point is apparent in the temperature asymmetry of our plunges into ice ages .
I believe that they are using 2C as the “tipping point”.
A (The?) tipping point reflects some physical process that once passed cannot readily be reverse. Think of a snap-action switch. You add more and more force, and at some point the resisting force changes direction and it travels the rest of the way on its own.
Ric,
A switch is a switch. Look at the ocean, the tide comes in and it goes out, it does not remain in one state or the other, it is always in tranist between one state and the other, The same goes for temperature, ice ages to warm periods. they come and go, sometimes regularly sometimes not.
Mani, no a switch is not just a switch. That is, not all switches operate in the same manner.
Mark. Ric was talking about a snap action switch. What switch are you talking about
ManBearPig: Yes
I believe that the jargon related to the notion of “point of no return” is more consistently linked to journalists than to any other group. Journalists basically fight for real-estate, (publication position), and that leads to a lot of hyperbole, and stories that are nonsensical based on the underlying principles and facts. They ask questions like “are we past the tipping point?” Academics, in particular, are too eager to make their stories relevant by speculating about “point of no return” scenarios. So when an idiot reporter asks an attention hungry Assistant Professor in the Department of Irrelevant Redundancies that Junior Faculty Nobody always goes “You know, we may very well be on our way …” Pretty soon there’s a headline “North American Deer Tick Population may be poised for world domination …”
People become immune to this stuff after a while, they don’t really think about it, but it’s just like Chicken Little, so maybe the jargon on AGW and Tipping Points is changing, but I think it’s more likely that it’s just wearing out.
The problem with the Tipping Point is that no-one can claim when it will occur and therefore, no-one can be sure it hasn’t occurred already.
So if you invoke the mythical Tipping points you are committing yourself to adaptation rather than trying to prevent CO2 emissions. As adaptation needs the cheapest energy sources that means supporting coal.
Greens cannot believe in Tipping Points without abandoning all their policies. Inconvenient.
No, the problem with the Tipping Point is why the hell it never occurred when CO2 concentrations and/or temperatures were FAR higher.
They’re postulating a positive feedback mechanism with NO evidence of its existence.
By “temperatures” I meant global temperatures, sloppy sentence construction, sorry.
Eustace Cranch, that’s just a scientific problem.
The question raised by commieBob was “Have the alarmists given up on the tipping point?”
That is not a science question. And understanding why it’s been given up on is not related to the science either.
You are scientifically correct.
But if the science determined the actions of the alarmists then they wouldn’t be alarmists.
“The problem with the Tipping Point ” is that it’s an expression to desbribe a positive feedback, and the #1 flaw of the IPCC climate science is their invention of several positive feedbacks that turn out to be mythical or based on bad data/models.
Whether it’s the methan permafrost ‘tipping point’ or the sea level rise or ocean acidification, it’s the same old fearmongering based on weak data.
“They’re postulating a positive feedback mechanism with NO evidence of its existence.” That’s the part that gets me. As far as I can tell, the whole shaky edifice depends on this assumption, and there is absolutely no evidence for it. It’s 100% pure-D made up, and clung to, no matter how many years go by without confirmation in the temperature data or even a plausible physical theory to support a prediction. That CO2 has a greenhouse effect has never been in serious dispute, but that there’s a “runaway train” effect is. None of the political effects of AGW work without the positive feedback mechanism; if the feedback is negative, it will reverse whatever AGW there may be, more easily and conveniently than we’ll ever be able to no matter how badly we wreck our economies trying.
Regardless of the precise weight of the mass and how its volume fits around the tropics, the point is that a large mass centered at a position askew to the spin axis can produce a significant change in the rotation of the earth.
There is two problems:
1. The only tipping point we are close to is going back into an ice age. We are within a couple of watts of being cold and frozen and some people speculate that only anthropogenic CO2 emissions have saved us (which would be multi-trillion dollar benefit to more CO2).
http://2.bp.blogspot.com/-qFEkp9r1Gv4/UPgJZo6hF5I/AAAAAAAAA3U/iiYmWhuiHJE/s1600/AMO_AND_PDO%2B1900%2B2010.jpg
2. Other than phase change tipping points (like return to the ice age) in general the climate orbits around the received forcing. Any serious deviation in temperature is followed by a deviation in the other direction. The earth is a giant heat engine and any change in forcing causes oscillations (PDO, AMO, etc.) with periods of up to century time scales because of ocean temperature inertia. The earth in general has sloshing points not tipping points.
I am so stealing “sloshing points”. Great terminology!
“The earth in general has sloshing points not tipping points.”
Right ! The simple fact that it’s a sphere not a disk means there is no one tipping point .
Did the mass displacement of ice age glaciation affect the position of Earth’s rotational axis?
Right ! The simple fact that it’s a sphere not a disk means there is no one tipping point
Actually that means it doesn’t have any tipping point – it just rolls around on the floor.
Did the mass displacement of ice age glaciation affect the position of Earth’s rotational axis?
This is one of those “which came first the chicken or the turkey?” questions.
The earth reaches maximum tilt about every 40,000 years. The earth used to come out of the ice age every 40,000 years at maximum tilt. Now it only happens about every third time. The theory is the earth has gotten too cold (ice sheets too thick, etc.) to come out and play every time.
So the tilt affects the ice sheet not the ice sheet the tilt (mostly). It shouldn’t have much effect on tilt (and about 1/4 as much as commonly published). What it does affect is rotation speed. But that doesn’t seem to get a lot of attention and what attention it does get is confused.
http://tycho.usno.navy.mil/lod.1973-may2015.jpg
There are articles that state that the ice ages slow down the rotation of the earth. . Moving gigatons of water from the equator to the poles will not slow the earth down.
I was going to comment on rotational speed and ice ages but the scholarship is confused and I need to figure out why there are conflicting claims. The moment of inertia of the earth is about 8.036E37 kg-m2. This is a large number. In theory If we drop the sea level 120 meters (last ice age) a crude estimate would be a reduction of 1.27E33 kg-m2 or 0.0015% in the moment of inertia or about a 1/60,000 faster rotational speed.
Actually the mass lost by the sea was moved to the ice sheets, ie. farther from the center of gravity. The rotational speed would decrease.
commieBob August 15, 2015 at 12:23 pm
Actually the mass lost by the sea was moved to the ice sheets, ie. farther from the center of gravity. The rotational speed would decrease.
No.
This is one of those engineering subjects where there are right answers.
The formula for moment of inertia:is the integral of the mass times the square of the distance from the axis in question.
The angular momentum for motion about an axis is L = mvr
What is obvious from this term is that since v is the linear speed (angular speed times radial distance) – is the contribution of angular momentum from a piece of mass varies with r squared.
You don’t care about any mass north of 60° since it has less than 1/4 of the momentum that water at the equator does. Water at the poles has zero effect (0.00000000) on momentum for rotation about the polar axis. 1 meter of water at 60° (basically 3200 km from the axis) has more momentum over 9000 km of ice 1 km from the pole.
On looking at the numbers it is going to be closer to 1/30,000 (the sea level change will have more effect than I thought).
That occurred to me after I had gone out for the evening. The mass moved poleward and therefore closer to the axis. The earth would indeed rotate faster.
commieBob August 15, 2015 at 7:50 pm
That occurred to me after I had gone out for the evening. The mass moved poleward and therefore closer to the axis. The earth would indeed rotate faster.
I figured you just a had a blonde moment.
But the relative changes in rotational velocity are small, 2-3 seconds/day at best, and could be reduced by some effect we are overlooking (there will be some long term isostatic changes). I was expecting something significant. I can’t see where such a tiny change is going to have much impact.
And I can find scholarship that it actually slows down, which I can’t explain to this point
verdeviewer “Did the mass displacement of ice age glaciation affect the position of Earth’s rotational axis?”
What would giga tonnes of ice do to a spinning globe? The vast ice sheets unevenly arranged around the globe during the glacial times has no effect on the size of the wobble?
****************
Polar wandering and the forced responses of a rotating, multilayered, viscoelastic planet
Roberto SabadiniDavid A. YuenEnzo Boschi
http://onlinelibrary.wiley.com/doi/10.1029/JB087iB04p02885/abstract
Sabadini and Peltier [1981] have constructed a physical model in which they found that a net polar wander could occur as a result of the periodic forcing by active glaciation and deglaciation. This phenomenon is illustrated in Figure 1. Previous work by McElhinny [1973] and Jurdy and van der Voo [1974] have concluded that the amount of true polar wander (TPW) during the last 55 m.y. has been quite small, about 2 ø. However, recent reanalysis of paleomagnetic data by Jurdy [1981] and Morgan [1981], using a reference frame based on hot spots, have revealed that TPW of between 10 ø to 15 ø had occurred since the Cretaceous. Furthermore, Morgan has proposed boldly that, in fact, 5ø-10 ø of this polar wander must have taken place in the last 10 m.y.
Copyright ¸ 1982 by the American Geophysical Union
DD More August 17, 2015 at 8:00 am
verdeviewer “Did the mass displacement of ice age glaciation affect the position of Earth’s rotational axis?”
What would giga tonnes of ice do to a spinning globe? The vast ice sheets unevenly arranged around the globe during the glacial times has no effect on the size of the wobble?
No they don’t. You can stack 9,000 km of ice on the north pole and it has zero (0.000000000) effect on the wobble, none, zip, nil, not any, nada.
https://en.wikipedia.org/wiki/Milankovitch_cycles
The Milankovitch theory (sometimes mistakenly called the John Malkovich theory) explains the rotational wobble in terms of precession and orbital obliquity. There is little to no “wobble” for your theory to cause.
Which gets back to the “which came first the chicken or the turkey question?” The ice age ends at the point of maximum orbital tilt some of the time. If ice sheets were driving the orbital tilt – it would happen all the time not just 1 out of every three cycles or so. Currently the earth goes through three cycles with the ice pretty much unchanged.
Hard to make the argument the ice sheets are doing the tipping. There is the possibility of some icing on the cake effect but the vast majority of the variation is not caused by the ice.
Thanks for the responses to my wandering axis question, especially DDMore’s reference to an unfortunately-paywalled paper that appears to answer the question in detail.
Moving the mass of ocean waters nearer the pole would logically cause the earth to spin faster, but it seems that moving so much mass to relatively small segments of longitude in the North would tend to move the location of the axis away from the mass of ice as centrifugal and tidal forces pulled the ice sheets southward to restore balance. Melt the H2O back into the ocean basins and the previous equilibrium would eventually be restored.
Of course, since the ice sheets depress the crust, some of the mantle is squeezed from beneath them, tempering the effect. All very complicated.
From the Sabadini, et al, paper:
SUP tag doesn’t work, apparently. Should be 10^19kg.
verdeviewer August 19, 2015 at 11:22 am
SUP tag doesn’t work, apparently. Should be 10^19kg.
No it shouldn’t.
There is currently 30-33 mega giga tonnes of ice in ice sheets.
That is 30 * 1e6 * 1e9 * 1e3 kg or 30 e19 kg, in current ice sheets.
The ice age maximum at least doubled (or tripled) the amount of global ice.
Err… Whoops.
That is 3.0 E 19 kg “Sigh”.
Anyway, that is about the same mass as a 120 m belt of water around the tropics. So the maximum land ice mass during the ice ages was something in the 60-80 exakg range or about or 60-80 million km3.
Regardless of the precise weight and how its volume might fit around the tropics, the point is that a large mass centered at a position askew to the spin axis can produce a significant change in the rotation of the earth.
verdeviewer August 19, 2015 at 9:33 pm
Regardless of the precise weight and how its volume might fit around the tropics, the point is that a large mass centered at a position askew to the spin axis can produce a significant change in the rotation of the earth.
The precession of the earth is due to the forces of the other solar system bodies on the equatorial bulge. That is the result of an applied torque and causes precession much like a top.
Out of balance is a different story. The imbalance due to ice sheets is going to be at most 1 part in 240,000 (the loss of equatorial water 1/60000 * 1/4 the effectiveness of a polar imbalance). The ice sheets are too close to the axis and not unbalanced enough.
Now Sabadini, et al, claims a couple of degrees shift in true polar wander (a shift in axial rotation to the new preferred axis of rotation since a rotating spherical object can only rotate on one axis.) This entirely different than precession. It also tends to be self correcting since the “heavy” side of the ice sheet gets rotated away from the pole and melts. I’m dubious. There is some true polar wander – but that doesn’t impact ice age entry or exit.
However – I am not a mechanical engineer and defer to smarter and better informed people on the subject.
PA:
“It also tends to be self correcting since the ‘heavy’ side of the ice sheet gets rotated away from the pole and melts.”
I didn’t think that would be very significant in the time frame. But then, I’m not qualified to argue numbers, just looking to confirm or refute my layman’s logic. It seems impossible to me that the repositioning of mass wouldn’t affect rotation to some degree.
You’ve provoked further education. Thanks for the replies.
BTW, some say Venus did get ‘tipped’, but this paper argues otherwise:
http://www.nature.com/nature/journal/v411/n6839/full/411767a0.html
verdeviewer August 20, 2015 at 12:13 pm
You’ve provoked further education. Thanks for the replies.
BTW, some say Venus did get ‘tipped’, but this paper argues otherwise:
http://www.nature.com/nature/journal/v411/n6839/full/411767a0.html
Well, the original Sabadini article is from 1982. This is either accepted science or someone has refuted it by now.
I did find excerpts from his 2004 book and am mulling them over.
https://books.google.com/books?id=3a-tDZhsC20C&pg=PA128&lpg=PA128&dq=Sabadini+and+Peltier+ice+sheet+true+polar+shift&source=bl&ots=tys5g63YhU&sig=8yfxEVMVIj_yZXFjEgy9j0_l6gY&hl=en&sa=X&ved=0CB4Q6AEwAGoVChMI0sr2nsK4xwIVhj4-Ch13zAWP#v=onepage&q=Sabadini%20and%20Peltier%20ice%20sheet%20true%20polar%20shift&f=false
Apparently he thinks the ice mass went from an ice age 6.5e19 kg to 2.6e19 kg at the current time (figure 4.3). The common estimate range for current ice mass is 2.8e19 to 3.3E19 so he is low balling current ice mass.
Quite basic undergraduate level computations of radiative balance show by an order of magnitude that Venus’s surface temperature CANNOT be explained as any spectral , ie , “greenhouse” effect . See , eg , http://cosy.com/Science/RadiativeBalanceGraphSummary.html .
That pretty much leaves gravity as the only “force” capable of explaining the equilibrium between the bottom of atmosphere surface temperature and the effective radiative top of atmosphere .
Plates form and subduct relative to the top of the mantle, jockeying the continents around the crust. How much does this entire bouyant crust float around on the mantle relative to the core?
Bob Armstrong:
I don’t think the Venus paper has anything to do with greenhouse gases. The paper argues that Venus’s retrograde rotation is not due to it physically tipping over from internal forces. It claims Venus’s rotation is a logical result of various forces related to its orbital position and dense atmosphere.
Oh , looks like I had a Pavlovian moment 😉
Bob Armstrong August 20, 2015 at 3:14 pm … The surface of the earth receives about 163 W/m2 of solar energy, and loses about 58 W by radiation, 18.5 by convection, and 86.5 watts by evaporation. The earth is assumed to emit 398 W/m2 (289.5K) and get 340 W/m2 downwelling IR from the atmosphere. 15-30% of the earths IR escapes.
That pretty much leaves gravity as the only “force” capable of explaining the equilibrium between the bottom of atmosphere surface temperature and the effective radiative top of atmosphere .
Hmm. Well, the atmosphere of Venus is about 93 times as thick so a 3 m/s wind on Venus has the force of a 30 m/s wind on earth – a class 2 hurricane. However the actual surface wind speeds are 1 m/s or less. There isn’t a significant thermal difference to power a heat engine.
The Venusian atmosphere absorbs more than twice the energy of the surface. On earth the surface absorbs over twice the energy of the atmosphere and actually warms the atmosphere.
Venus has to lose 100 W with essentially no convection or evaporation and an atmosphere that is basically opaque to IR. Venus emits about 16100 W/m2 at 730K and would have the equivalent of about 16000 W/m2 downwelling IR. The Venusian atmosphere has about the same lapse rate as the earth. The apparent effective surface emission of IR is 1% The apparent atmospheric opacity to surface IR emission is about 25 times greater than earth – but this ignores the direct solar heating of the atmosphere.
http://www.sciencedirect.com/science/article/pii/S0032063314002268
We don’t even know all the absorption modes of the Venusian atmosphere. The atmosphere is the density of fresh Western powder snow or the processed stalks of things like cottonseed or sugar cane. It is over 1/10 as dense as water. Things like compton scattering and IR reflection that are insignificant in air could contribute to the dynamics. Earths atmosphere reflects IR (mostly in the 0.7 mm to 3.0 mm. band) which doesn’t seem to get a lot of mention.
The point that some comments and links by HockeySchtick & Stephen Wilde on http://wattsupwiththat.com/2015/07/22/why-we-live-on-earth-and-not-venus/ got thru to me is that statically the temperature lower in a gravity field has to be higher than at the effective radiative surface by the amount of energy represented by that depth in order for the constraint of the divergence theorem at the radiative boundary to be met . I haven’t yet worked thru the equations Hockey presents , but they appear – and should be – quite straight forward and apparently match the observed “lapse rate” for both Venus and Earth .
I so the the word “tipping” and it triggered me going off on the stupidity of claiming any fabled “tipping points” , ie : phase changes , around other than the freezing point of water — despite being aware that the conversation was about actual axis tipping .
Bob Armstrong August 21, 2015 at 9:13 am
The point that some comments and links by HockeySchtick & Stephen Wilde on http://wattsupwiththat.com/2015/07/22/why-we-live-on-earth-and-not-venus/ got thru to me is that statically the temperature lower in a gravity field has to be higher than at the effective radiative surface by the amount of energy represented by that depth in order for the constraint of the divergence theorem at the radiative boundary to be met . I haven’t yet worked thru the equations Hockey presents , but they appear – and should be – quite straight forward and apparently match the observed “lapse rate” for both Venus and Earth .
I so the the word “tipping” and it triggered me going off on the stupidity of claiming any fabled “tipping points” , ie : phase changes , around other than the freezing point of water — despite being aware that the conversation was about actual axis tipping .
The divergence theorem concerns the net energy through an arbitrary surface which has to be zero if the area inside the surface is at a stable temperature.
I’m not sure how this helps you. If any energy gets to the surface of a planet there will be a positive lapse rate since the energy has to find its way out again.and the surface area at each level of the atmosphere is successively larger. At the altitude where the atmosphere ceases to be an ideal gas, or a good gas, or even an average gas this breaks down.
There are tipping points – but they are actually related to albedo. Current snow/ice cover is 30-70 million km2. Pre-ice age it was zero. That is about 50 million km2 that has a .7 higher albedo. Current 11% of land is covered by ice sheets (about 16 million km2) – during an ice age the ice sheets are about 26% of land area (with a .7 lower albedo) plus the average snow/ice coverage is much higher.
I wondered if centrifugal and tidal forces could pull the entire crust circumferentially in an axial direction. Still not sure how likely. But there’s evidence of movement down below that I wasn’t aware of.
http://www.columbia.edu/cu/record/archives/vol22/vol22_iss1/Core_Spin.html
http://www.pnas.org/content/110/40/15914.long
verdeviewer August 21, 2015 at 1:17 pm
I wondered if centrifugal and tidal forces could pull the entire crust circumferentially in an axial direction. Still not sure how likely. But there’s evidence of movement down below that I wasn’t aware of.
http://www.columbia.edu/cu/record/archives/vol22/vol22_iss1/Core_Spin.html
http://www.pnas.org/content/110/40/15914.long
http://www.universetoday.com/60192/does-the-sun-rotate/
The various parts of the sun rotate at different speeds.
Other than the crust which is pretty rigid the interior can pretty much do what it wants and clearly the crust moves relative to the mantle (hence island chains).
I am awaiting sound research showing the optimum climate for our present biosphere. But most “research” is really an attempt to secure the optimum level of government intrusion in our lives.
It is no surprise that almost every demand made by advocates of global warming converges on bigger government, higher taxes, less freedom and more restrictions on how we choose to live our lives. That tells me all I need to know about this massive fraud.
“….optimum level of government intrusion in our lives.”
We’re past that point
There’s a tipping point we can get behind!
Well…
http://www.barrypopik.com/index.php/new_york_city/entry/warmunism_global_warming_communism/
http://www.frontpagemag.com/fpm/241909/save-environment-socialists-daniel-greenfield
http://www.westernjournalism.com/is-progressivism-the-new-communism/
http://www.worldaffairsjournal.org/article/new-communism-resurrecting-utopian-delusion
It is what it is, green is the new red.
Social marxism, progressivism, environmentalism have a lot of feel good moments together.
http://rightwingnews.com/quotes/environmentalist-wacko-quotes-2/
http://www.c3headlines.com/global-warming-quotes-climate-change-quotes.html
John Davis, editor of People Last! journal: “Human beings, as a species, have no more value than slugs.”
You look at the quotes from warmunists in the their own words, and they don’t like capitalism, affluence, and in general don’t care much for people.
About 20% of the population is a dangerous modern version of a neoluddite who believe man is a problem that must be controlled, restrained, and reduced.
It gets more incredible
As time passes by,
Surly the only question now
Is quite simply “why?
The hypothesis is proved wrong,
With science that’s been solved,
But the alarmists can’t let go
There’s too much money involved;
Then there’s the agenda
For a new world order of things,
As the world is kept dancing
On the IPCC puppet strings!
http://rhymeafterrhyme.net/mother-nature-is-laughing-shes-having-such-fun/
I think you have a misprint on the GISS graph – 0.79C per decade would be 7.9C over a century. Perhaps it should be 0.079C. Not that this affects your argument.
The later ones must be per century or they are too high by factor of 10.
Reference Figure 4 text … “The 0.79 deg C/decade spread in the modeled … Figure 4” is a typo. The correct value is obvious from the chart and is given in the below Figure 4 in the original post. See … “The 0.079 deg C/decade spread in the climate-model-hindcast …”
I’ve corrected the typo in Figure 4. Thanks to all.
Temperature rise since the late 1800’s is how we know the Little Ice Age ended then. For a little ice age to end there necessarily needs to be warming. That happened – why is this a surprise? Glaciers that advanced during the LIA are now receding. That is happening. Why is *this* a surprise?
They don’t claim it is a surprise, they claim it is an anthropogenic disaster.
I have little to complain on. 1C over the Little Ice Age temps is very good. And they contribute it wholly to human activities, which means we have done excellent job so far keeping bad climate from happening.
Which begs the corollary: What was it mankind did to cause the Little Ice Age in the first place?
The answer is: Nothing.
So mankind neither caused the LIA nor resolved the LIA.
That’s an inconvenient truth to most CAGW-brainwashed acolytes.
(It also means mankind has little hope of preventing the next Ice Age.)
It’s worse than the boy crying wolf, it’s yelling FIRE in a crowded theatre. See the massed and helpless victims already.
==================
Many still squirming desperately. And in Paris, the band plays on. Dance, or don’t!
============
Too bad they are rearranging the deck chairs also, at least we would know an end to the shenanigans was forthcoming.
I choose the medieval or Roman warm period as my reference period for anomalies.
Now things don’t look so bad !
Yes, that’s what you would do, and we appreciate it!
I suggest people just take the well hyped Karl et al that concludes warming is continuing apace at less than 1.0C° per century and point out we have more than a century to do something.
…. or do nothing, which is vastly less expensive than pretending to do something while simultaneously destroying the environment in order to save it.
Does anyone have a good, solid, robust reference for the actual temperature of hell, because something doesn’t seem to jibe here ??
Hell, no one has “a good, solid, robust reference for the actual temperature” of Earth today!
That was supposed to be a reply to “philincalifornia
August 14, 2015 at 6:23 am” on the “Halfway to Hell” topic.
That was to explain the mis-post on the “Sun Data” topic… Firefox or fatfingers has befuddled me!
Some calculations: https://www.lhup.edu/~dsimanek/hell.htm
2.1 C hotter than 1880! Man don’t you pay any attention at all to 97% of scientists who agree with the Club of Rome!
The figures for 2320GMT 14/8/2015 were very comfortable. Try http://www.worldweatheronline.com/v2/weather.aspx?q=Hell,%20Norway for current values.
My colleague Godfrey Sill, co-discoverer that clouds of Venus are sulfuric acid, told me that “we’ve discovered where hell is”, with surface T just a couple hundred degrees less than molten lava, sulfuric acid, probably Hg vapors, etc.
So maybe you’d prefer to go to heaven? Radiation calculations based on descriptions of heaven as brighter than 1000 suns, etc show that heaven is much hotter than hell. Any other options?
What, exactly, is the timeframe of “pre-industrial levels”? 1750?… 1750 BC?… 15,000 ya?… When, exactly?
And what, exactly, was the GMST of that timeframe?
Exactly – there was a fair amount of industrial activity prior to 1880-1885. Who decided that “pre-industrial” was prior to 1880-1885?
Yeah, Jim, but in terms of CO2 emissions, it was negligible until the 20th century.
What there WAS, was a lot of agricultural activity (grazing by goats) leading to desertification of most of the middle east, with consequent reduction in ground cover and photosynthesis. Don’t know if it was significant on a global scale in terms of lost CO2 transformation to O2, but it certainly affected the climate over wide areas. Goats are apparently way worse than sheep in this regard because they pull plants up by the roots, while sheep just chew off the tops and leave the plants a chance to recover.
Take a look at Google Earth images of the Egypt-Israel border. On the Israel side, where the Negev is a military zone and nomadic tribespeople (the guys who were there before the arabs) with their goats are not allowed to graze, there is significantly more and denser vegetation than on the Egypt side, and this has all happened since Israel was created in 1949. Leave the desert along and it will re-vegetate itself → more transpiration of water vapour → more rain → more re-vegetation and so on and so on. It might even reach a tipping point LOL. You have to zoom in fairly close to see it. It’s best seen in the sandy lowlands between 25 and 55 km southeast of the coast, but you can pick it up in much of the hilly areas further inland too.
On this analysis, goats may have been a bigger driver of climate change (very large-scale regional, but not global, I hasten to add) than fossil fuel burning, which is looking a bit shaky these days, what with the pause and the very disparate (and desperate too) excuses for the pause and/or denials that there is a pause. And the goat factor has acted over a time scale measured in millenia, even if it can be visibly ameliorated in decades.
Which does not excuse Israeli bulldozers and tanks pushing down peoples’ houses to make room for other peoples’ houses. Got to put my left wing credentials on display here, you know, at the very least to show that not all sceptics are conservative ideologues.
We need a global coal industry reference page on WUWT. Although some data is slow and only in annual frequency, it would help keep tabs on reality among the regions less impacted by the daily climate alarm media campaign. There are dupes out there that think shuttering some coal power plants and steel plants around Beijing city somehow validates claims of Chinese national participation in WH schemes.
Even more interesting I think would be a work up on when folks in NYC or San Francisco flip their light switch where those energized electrons came from. I suspect one would find that for all the sound and fury about green technologies in those respective cities that the actual bulk of the electricity originates from more traditional means out of state!
Why do the so many people believe the conditions of the LIA represent the ideal global climate? Yes, it is indeed “pre-industrial”… but hardly ideal… for plant nor critter. We should all be celebrating the end of this miserable hardship, by huge centennial parties. The warmup has made possible, the thriving of modern civilization. A return to LIA conditions should be regarded with great dread, for and by, our present population levels. GK
Could someone tell me where Kevin Cowtan obtained his B.Sc. and PhD awards? His B.Sc. subject and his PhD thesis title would be useful too.
I’ve tried Google with no joy and his page at University of York doesn’t seem to have the information either.
Thanks
See the very bottom of:
http://www-users.york.ac.uk/~kdc3/papers/coverage2013/background.html
Thanks for that. Basically York for everything past and current.
As has been pointed out the CO2 output tripled after 1945. Almost all CO2 we have put in the atmosphere has happened since 1945. It is therefore bizarre that they keep referring back to 1880 when we know that during that period there was very little co2 forcing. I speak about this at my blog entry: https://logiclogiclogic.wordpress.com/2015/04/10/temperature-rise-by-end-of-century-cannot-be-significant/
IMO that is a good thing. Because then the rise from about 1920 to 1945 MUST be attributed to natural variation. Which cannot be presumed to have suddenly diappeared, or even more illogically (Trenberth’s new Science comment) to have switched to cooling only. Which raises the attribution problem in climate models. Which is why the pause has falsified them using Santer’s own criterion.
And so the CAGW house of cards collapses.
“Which cannot be presumed to have suddenly diappeared, or even more illogically (Trenberth’s new Science comment) to have switched to cooling only.”
Presume so; it humans saved Earth from cooling dramatically and tipping to an ice age.
…it MEANS humans…
Well, I don’t believe the CO2 warming effect is big enough, but we can hope.
============
There’s still the fact that the so called 2.0C limit was just made up, there never was any basis for it. Regardless, the roman and Minoan warm periods were apparently hellish, because they both broke that limit.
Tol’s done good work showing the fuzziness of this ‘line in the sand’. In fact, paleontology never shows the upper limit of benefit from warming, and always shows immediately the detriment of cooling.
===========
Looking at the “Halfway to Hell” chart and I’m very much reminded of the sun spot chart from the previous article. Weak sunspots from 1880 till about 1920, a couple of stronger cycles, a weaker cycle around 1960, then 4 strong cycles. The above chart has cool from 1880 till about 1920, warming till around 1950, slightly falling temperatures for the next 20 years, then temperatures start rising again.
Even of more importance to “Newbies”….
What if all the terrestrial data was “massaged” to show warming that doesn’t or didn’t exist?
“there’s a 1.17 deg C spread in the change in simulated global surface temperatures from pre-industrial times to 2005, which is greater than the 1.0 deg C observed rise shown in Kevin Cowtan’s graph (my Figure 1).” I was expecting that all the CMIP5 models would have the same anomaly for 2005, as a sort of “we are here” reference. I was truly shocked by Figure 1, that “the spread is greater than the observed warming” seems a rather damning discrepancy. Could someone help me understand this? As close as I can get by analogy is: asking people with different map programs for the shortest route between New York and LA and learning the answer is
“Laramie, Wyoming if you don’t mind starting in Nashville.”
OK, they’re telling us we’ve warmed 1 degree since 1880. Do they include how much we should have warmed since 1880 were it not for our release of CO2? Did I miss that? Or, are they suggesting, normally, we shouldn’t have warmed at all and the 1 degree is all on us? Or is it supposed to have cooled since 1880?
Well, hell; if Hell exists, then the Alarmists are certainly hell-bent for leather on their way there. The climate, on the other hand, is just fine.
Woah, we’re half way there
Woah, livin’ on a prayer
Take my hand, we’ll make it I swear
Woah, livin’ on a prayer
I’d like to choose 1910 as the baseline in the first graph, so that the warming is already well over 1C. So…what.
Just how many people have died because of this increase in temperature? Fewer than would have, because more people die of cold weather than warm weather.
But what about more severe storms like Katrina — it was one of the worst US hurricanes ever! It was in the top 5, but 3 of those 5 happened before 1910, and the other happened in the 1920s.
I never understood what was so magical about 2 degrees of warming, anyway. Can anyone explain what is supposed to happen if we ever reach it? Why will we avert disaster if we can limit global temperature rise to 1.9 degrees?
Unfortunately, it’s not desperation – it’s the ‘if you’re gonna lie, lie big’ method.
And can there be any bigger lie than that the source of carbon to carbon based life will ( but never has before ) destroy that life in a geological instant ?
“Halfway to hell”.

===============
The lowest depths of Dante’s inferno was icy:
The preindustrial LIA was about as cold as this interglacial has got:
Can anyone please explain how 7 IPCC authors can make this statement at point 20 of the latest Royal Society and NAS report? And 5 of those seven are Lead authors.
Using this info we can say that trying to mitigate their CAGW is a load of crap. In human terms “thousands of years” is a bloody long time. But do these people really believe this and if so why do all the govts claim we only have a few short years to act or else? Can anyone help me out, do we believe the 7 scientists or govt leaders? Here’s their point 20.
20. If emissions of greenhouse gases were stopped, would the climate return to the conditions of 200 years ago?
No. Even if emissions of greenhouse gases were to suddenly stop, Earth’s surface temperature would not cool and return to the level in the pre-industrial era for thousands of years.
fig9-small
Figure 9. If global emissions were to suddenly stop, it would take a long time for surface air temperatures and the ocean to begin to cool, because the excess CO2 in the atmosphere would remain there for a long time and would continue to exert a warming effect. Model projections show how atmospheric CO2 concentration (a), surface air temperature (b), and ocean thermal expansion (c) would respond following a scenario of business-as-usual emissions ceasing in 2300 (red), a scenario of aggressive emission reductions, falling close to zero 50 years from now (orange), and two intermediate emissions scenarios (green and blue). The small downward tick in temperature at 2300 is caused by the elimination of emissions of short-lived greenhouse gases, including methane. Source: Zickfeld et al., 2013 (larger version)
If emissions of CO2 stopped altogether, it would take many thousands of years for atmospheric CO2 to return to ‘pre-industrial’ levels due to its very slow transfer to the deep ocean and ultimate burial in ocean sediments. Surface temperatures would stay elevated for at least a thousand years, implying extremely long-term commitment to a warmer planet due to past and current emissions, and sea level would likely continue to rise for many centuries even after temperature stopped increasing (see Figure 9). Significant cooling would be required to reverse melting of glaciers and the Greenland ice sheet, which formed during past cold climates. The current CO2-induced warming of Earth is therefore essentially irreversible on human timescales. The amount and rate of further warming will depend almost entirely on how much more CO2 humankind emits.
Interesting to use ALL THE MODELS for SLR from the Royal Society as well. According to the models we have zip to worry about for hundreds of years. Greenland is positive for SLR but Antarctica is negative for at least 300 years. Who to believe????
http://rsta.royalsocietypublishing.org/content/roypta/364/1844/1709/F4.large.jpg
Thanks, Bob.
This global warming thing is a cult, only they know the truth. We heretics will burn first.
The notion of a tipping point is ridiculous. In fact if you look at a very long term temperature reconstruction you will see the hotter periods all plateau out at pretty much exactly the same temperature. It is astonishing how persistent this feature of our climate is. You could lay a ruler horizontally across the top of the graph and it would sit right on the top of all those plateaus. There is a clear upper bound – a place where the temperature of the planet pegs out and simply can’t go any higher. This is probably caused by some kind of phase change in the climate system occurring at that temperature – a global change to circulation patterns or similar.
There is no need to fear runaway warming. Earth simply can’t copy Venus. We are not all going to fry.
I recently canceled my subscription to New Scientist due to it’s continued non scientific ranting about Global Warming. One has to question whether anything it prints is truthful or meets the scientific standard required of an erstwhile magazine.
Bob Tisdale:
Your above essay says
More “obviously” Honeycutt, Cowtan and Honeycutt are overlooking something more important than that, and it may not be apparent to “newcomers”.
While a change in global temperature anomaly (i.e. a change in temperature difference from an average) of only 2°C is feared, global temperature changes by nearly double that during each and every year.
Global temperature rises by 3.8°C over 6 months then falls by 3.8°C over the other 6 months of each and every year while nobody notices it.
And, to date, nobody has provided any evidence and/or credible explanation of why a 2°C rise in global temperature anomaly would have much more harmful effect(s) than the 3.8°C rise in global temperature that occurs during each year.
Richard
While this non-optional annual cycle is far too little appreciated , I don’t understand a +- 3.8c variation over the annual cycle . My computation gives +- 2.3 degree variation in our equilibrium temperature from our peri- to ap-helion . Do you have a reference ?
Bob Armstrong:
I wrote:
You have responded saying
That is wrong on two counts.
Firstly, I did NOT say there is “+- 3.8c variation over the annual cycle”.
I said “Global temperature rises by 3.8°C over 6 months then falls by 3.8°C over the other 6 months of each year”, and that is a variation of +-1.9°C around an average value over the annual cycle.
Secondly, the observed variation I mentioned derives from the Northern Hemisphere (NH) being covered by more land than the Southern Hemisphere (SH). And throughout the seasons land changes temperature more than water. When it is summer in the NH it is winter in the SH and vice versa, but global temperature is the average of NH and SH temperatures.
The effect of different coverage by land in the hemispheres is sufficiently large that it
(a) negates the global temperature variation from the varying distance from the Sun
and
(b) provides the observed variation of +-1.9°C around an average value.
The matter is discussed in many places including here
http://judithcurry.com/2013/12/26/seasonal-radiative-response/
and its references.
The important point is that global temperature rises by 3.8°C (i.e. nearly double 2°C) over 6 months of each and every year while nobody notices it.
Richard
Richard , I see : +- 1.9c . I was catching up on a weekend+ of emails , but I do think you stated the cycle in a somewhat odd way .
However , , the annual cycle must contain the effects of both the 4.6c variation in insolation from peri- to ap- helion and the hemispheric asymmetry . I see Chief Hydrologist brings up this component in his comments on the JudithCurry.com post .
I don’t find a value of +- 1.9c at all surprising , but this discussion highlights the lack I see of a basic text presenting all these very basic facts in the analytical quantitative manner of classical physics .
Of course the reason no one is aware of this variation is that it’s not observable at any one place , only when you are able to see the whole . At any one place , all you see is your particular diurnal and seasonal variations which swap even these effects .
I can’t help thinking that if you took a poll in the average street, asking people by how much the temperature had risen over the last century almost all would say they didn’t know. Most of the rest would guess at a figure several degrees out from even the most alarmist estimate.
They’d be astonished at how small the figure is that all the fuss is about.
When I tell them the rise is only 0.7 to 0.9C, most of them accuse me of lying.
the pro climate change people shew the temperatures towards the ipcc graphs they are stupid sciencetints. the temperature curve is going sideways why cannot you see this in the data to corrupt.
buckwheaton August 14, 2015 at 5:22 am
Trying to define an “optimum” climate for Earth is like eugenics for Nazis. Why? Because different organisms are better suited to different conditions, just like different people may have better survival characteristics for different conditions.
There is no Ubermensch, because the superior individual can be defined as superior only under some specific set of conditions. The strength of a species is its diversity. That means some subpopulation may survive even if most of the population perishes when conditions change. And for Earth, its strength is the diverse network of species able to expand in to niches newly created as conditions change.
There can be an optimum climate only for some collection of organisms. There would be a different climate optimum for another collection of organisms.
Now which organisms do you favor for your optimum? Why should this current climate be considered the best? If not this one, which one? And why should conditions stay the same? Maybe we have the collection of organisms we have in the current distribution precisely because conditions have changed, and static conditions would lead the biosphere to another distribution of organisms altogether. But so might changing conditions. The point is, the Earth is alive, and to expect is to stay the same is an idea based on ignorance.
Actually, static conditions would lead to a far fewer, and more vulnerable, collection of species. Without a dynamic climate, earth would likely be lifeless. Examples abound in just our solar system.
Change is constant, static is death. Yes, it is. So much for the current conception of ‘sustainable’, which is paralytic.
===========
“Apparently, based initially on a 1975 “first intuition” by an economist (not a climate scientist), politicians have sought to limit global surface warming to 2 deg C above pre-industrial levels by restricting greenhouse gas emissions. ”
This is only the marketing ad to make the thing look legitimate . The real goal is to get $100 BILLION /year for United Nations by 2020 and every year there after . The secondary goals are world wide carbon tax or cap and trade indirect tax for the various governments that can be raised at will and unlimited free money and subsidies and new business for the green industry and the ” it is worse than we thought” alarmist scientists and universities. This is a billion dollar / day industry now that thrives and lives on free money.
Sadly, all the best science in the world about what may be true or what may be not true about climate change is now totally irrelevant. The global warming alarmists are not interested in truth. They are only interested in data they can cherry-pick to support the supposition that CO2 from human activity is causing catastrophic global warming and is the key driver of climate change. It is all political. It always was all political. The following video demonstrates how this global warming scare evolved into a political issue:
Nothing is going to get in the way of the United Nations’ goal in Paris this December of achieving an international agreement to control fossil fuel energy use, and eventually ban it by 2100. These people will lie, mislead, deceive and persecute people to get their way. These people are using climate change as a stepping stone to rid the world of capitalism, democracy, freedom, the market economy and prosperity, to replace it with the UN’s sustainability model (AGENDA 21) and enforce the ambitious, arrogant, and unscrupulous ideology of environmentalism.
“Halfway to Hell” is misleading in another way. First, it implies that the threshold in question is some kind of point beyond which we are, well, in hell: things are really, really bad. But that’s not true. Near as I can tell reading studies which attempt to quantify all alleged impacts together, the 2 degree threshold is the point at which warming ceases to be beneficial on net. Second, reading those studies, they refer to 2 degrees relative to the present, *not* relative to the preindustrial period. Both such facts would, if taken into account, seriously undermine “the narrative” however, and as such they cannot be spoken of, instead a dishonest picture of their own present understanding has to be painted.
My memory, too. The 2 degree C guess was when the possible drawbacks of global warming exceed the benefits of longer growing seasons, less cold winters, etc. We’re not “halfway to hell” when we get 1 degree warmer then either now or a century ago.