Guest Post by Bob Tisdale
This post provides background information and a quick update on the naturally occurring warming event in the eastern North Pacific known as The Blob. Not just any blob, The Blob.

Figure 1
INTRODUCTION
We first discussed an unusual hotspot in the sea surface temperature anomalies of the eastern extratropical North Pacific two years ago in the August 2013 post appropriately titled About the Unusual Warming Event in the Extratropical North Pacific Sea Surface Temperature Anomalies. That large pocket of elevated sea surface temperatures has been given the nickname The Blob. Since that first post, we’ve discussed it numerous times, along with its impacts on global surface temperatures:
- The Hotspot in the North Pacific (February 2014)
- On The Recent Record-High Global Sea Surface Temperatures – The Wheres and Whys (August 2014)
- Axel Timmermann and Kevin Trenberth Highlight the Importance of Natural Variability in Global Warming… (November 2014)
- Researchers Find Northeast Pacific Surface Warming (1900-2012) Caused By Changes in Atmospheric Circulation, NOT Manmade Forcings (December 2014)
- Did ENSO and the “Monster” Kelvin Wave Contribute to the Record High Global Sea Surface Temperatures in 2014? (December 2014)
- Alarmists Bizarrely Claim “Just what AGW predicts” about the Record High Global Sea Surface Temperatures in 2014 (January 2015)
- North Pacific Update: The Blob’s Strengthening Suggests It’s Not Ready to Depart (April 2015)
WHAT CAUSED THE BLOB?
Answer: According to Bond et al (2015), a persistent ridge of high pressure in the mid-to-high latitudes of the eastern North Pacific prevented the sea surfaces there from cooling normally. The Ridiculously Resilient Ridge is also responsible for the high temperatures and drought conditions along the west coast of the U.S. See Anthony Watts’s April 2015 post “Warm blob” in Pacific Ocean not caused by climate change, affects U.S. weather at WattsUpWithThat. It includes the press release for two papers: Bond et al. (2015) Causes and Impacts of the 2014 Warm Anomaly in the NE Pacific and Hartmann (2015) Pacific sea surface temperature and the winter of 2014.
WHAT’S NEW WITH THE BLOB?
Figure 2 presents the satellite-enhanced sea surface temperature anomalies (Reynolds OI.v2 data, not the pause-buster data) for The Blob, using the coordinates of 35N-55N, 150W-125W. The sea surfaces of The Blob continue to show warming, after a multidecadal period of no warming through 2012.

Figure 2
Based on the monthly data, Figure 3 shows the annual evolutions of The Blob’s sea surface temperature anomalies for the years 2012, 2013, 2014 and year-to-date 2015. Our base year with no warming is 2012. The majority of the warming took place in 2013. Then, in 2014, sea surface temperature anomalies ended a tick lower than they started in January. The sea surfaces of The Blob are once again warming in 2015, likely in response to the strengthening El Niño.

Figure 3
CLOSING
I closed the April 2015 Blob post with the following questions. They’re still valid:
- How long will The Blob and the Ridiculously Resilient Ridge last?
- Assuming a La Niña follows this El Niño, will the La Niña be strong enough to overcome The Blob and the Ridiculously Resilient Ridge?
- What will be the combined effects of the strengthening El Niño, The Blob and the Ridiculously Resilient Ridge on weather worldwide over the next 12 months?
- Will the El Niño be strong enough to overcome the other two and bring rain to California, or will The Blob and the Ridiculously Resilient Ridge continue their influences there?
- Will The Blob have a long-term impact on the sea surface temperatures of the Eastern Pacific Ocean as a whole? That is, will The Blob be responsible for another upward shift in the sea surface temperatures of the East Pacific Ocean like that in 1976/77?
SOURCE
The data and maps presented in the post are available through the KNMI Climate Explorer.
The Blob
Ridiculously Resilient Ridge
Forgive me, but the language reduces the article to one of almost Parody, unless of course it is.
But I find myself doubting this article, except for where it is posted.
rockyspears:
Forgive me, but I find your concern trolling offensive.
If you have a serious disagreement with the essay then please state it. Carping that the choice of language is not pompous and stating that an anonymous troll has some unstated doubts about the article do not rise above the level of abuse normally found in primary school playgrounds.
Richard
As I said “except for where it is posted”
And comment have neither to agree or disagree, I just commented
I even covered myself with the “unless it is”, because humour is known to exist.
Do not jump on commentators as Trolls, just because they have doubts, doubts make science what it is.
rockyspears:
Nice try but no coconut. Scientific doubts pertain to evidence and not the asserted “feelings” of anonymous internet popups whose ‘comments’ only exist to provide abuse as a method to troll threads from their subject.
Richard
Alas, rockyspears doesn’t know the correct jargon of wise water-watchers. He is unknowingly displaying his ignorance.
I feel deeply for him, for I often do the same thing. Just recently, talking about arctic sea ice, I referred to the melting on the underside of the ice as “bottom melt.” I now understand the correct jargon is “basal melt”. (That sounds just a bit vulgar to me, but what do I know…)
Some people are all about appearances and jargon, rather than the subject being discussed.
Humor of any sort is always dangerous, and that includes humorous jargon. However, speaking only for myself, if it wasn’t for humor the entire topic of “climate science” would have driven me utterly, raving mad around a decade ago.
My apologies for having “feelings” – not
“internet popups” – I make plenty of posts, all over, from Zero Hedge to Not a lot of people know that, just because I do not use WordPress, does not make me a Troll
“whose ‘comments’ only exist to provide abuse as a method to troll threads from their subject” – sorry, do not even understand that.
Caleb
Thank you so much. My embarrassment was immense.
Seems however that some people see Trolls under the bed and everywhere.
The phrase “concern trolling” is the most egregious of all the terms used in debate. It is intended to preempt full and honest debate (a form of censorship) and it presumes everyone understands that those of us who have legitimate concerns should, as a default condition of debate, STFU and that makes you an imperious ass as a minimum. STFU, jackass.
Mods – please share this with RSC before you kill it. The man is a serial idiot who believes he owns the rules of engagement here and he lacks the intelligence and temperament for it.
Actually dp, concern trolling is a real method utilized by some (including myself, on occasion) to point out that a group doesn’t actually subscribe to a position or standard that they claim to, when you yourself don’t either . And yes, It can be hard to differentiate between a concern troll and someone trying to make an honest criticism.
To me the best way to confront such a charge is to define what the ‘concern’ truly is and if it is legitimate. Rockyspears seems to be (to me) complaining that the names “The Blob’ and ‘Ridiculously Resilient Ridge’ are in some way too silly and unsophisticated to be used by a respected journalist or scientist to describe a meteorological phenomenon. To this argument all I have to respond in the defense with is ‘Snowmageddon’.
^_^
It is well known that concern trolling is a strategy. Taking a defacto stance that all expressed concern is a troll is Courtney’s specialty and he’s used it on me more than once. That is how I know he’s an idiot. Or to put it in terms he will jerk at, I’m concerned he’s bringing down the quantity and quality of self-correction of this site by concerned readers by damning them at every opportunity. You will never see him write “I share your concern”. He doesn’t.
dp:
Your trolling is offensive. Stop it.
Richard
Well, according to the highly reliable Wikipedia, here:
https://en.wikipedia.org/wiki/The_Blob_(Pacific_Ocean)
“The Blob” is the term used by Climatologists to describe the area, implying that folks who study the climate actually may have a sense of humor.
Who’d a thunk it?
Lol, wikistupidia 😑,
What evidence do we have to confirm a unique occurrence?
– has this been observed in the past?
– what has lead to its formation?
– what consequence is likely?
– is it a weather event or climate system related?
– is it a valid indicator of climate system states of change?
… The list goes on and on….
The obvious relates to salinity as import to the Arctic Ocean. Start with high Pacific salinity and sea ice formation in the past and you’ll likely hone in on similar climate forcings?
PS: note to Bob, thanks for the great work! Consensus is qualitative, use degrees of confidence related to aspects of the models instead.
Humorous yes, but more than that, the chosen names actually tell you something about the characteristics even if you’ve never heard before. The Blob, amorphous and maybe vaguely threatening in a campy movie kind of way. Ridiculously Resilient instantly tells you the effect has existed way more than expected. The fact that both have names also tells you they’ve been around.
eschew obfuscation.
My personal rail is against the word “utilize” about the 3rd or 4th utilize in a document has me screaming; use, use, use.
Plain language works. Pumping letters into a name may win Scrabble but rarely helps clarity. From the fake Smithsonian letter:
“assigning your specimen the scientific name “Australopithecus spiff-arino.” Speaking personally, I, for one, fought tenaciously for the acceptance of your proposed taxonomy, but was ultimately voted down because the species name you selected was hyphenated, and didn’t really sound like it might be Latin.”
John wrote:
> has this been observed in the past?
Yes – There was a warm pool in the Pacific in 1934 and it appears to have contributed to the extreme winter weather that year (warm in the west, cold in the east). February 1934 and 2015 were almost identical, see http://wattsupwiththat.com/2015/03/08/1934-2015-a-tale-of-two-februaries/
OTOH, I don’t think they called it the blob in 1934 as the movie hadn’t been released yet.
Another weather term you can look up is “bombgenesis.” It’s weird that has a definition, but “nor’easter” doesn’t.
The Blob isn’t caused by the eruption of the Axial Seamount 300 mi offshore of Oregon??
http://www.csmonitor.com/Science/2015/0503/Underwater-volcano-spewing-lava-off-Oregon-coast-video
rockyspears –
I don’t understand your doubt.
Do you doubt that the Blob exists?
Do you doubt that it has the effects described?
If either, then you have doubts about Climatology in general: not with either Bob Tisdale who is reporting on it or Anthony Watts who is allowing Bob’s “Blob” report to be posted.
Just making an observation.
My doubt existed as it reads like a parody, as these are Climate terms I’ve never before encountered, and, surely you must agree, they sound comical.
I neither agreed or disagreed about the content, I merely observed on the style.
Well, rockyspears, the “Blob” has been so termed since 2014, so maybe it is a good thing you’ve found WUWT: it will help you keep up.
Cheers.
rockyspears
August 12, 2015 at 6:53 am
My doubt existed as it reads like a parody, as these are Climate terms I’ve never before encountered, and, surely you must agree, they sound comical.
I neither agreed or disagreed about the content, I merely observed on the style
That is comical in itself, AS A layperson who has followed this site for quite a while, even with my ‘ignorance’, without a scientific education, I still understand Bob T’s post.
if you say you haven’t encountered these terms before, you ain’t reading much, (emphasis on ain’t) wink , wink.
Y’all, let’s not be rude. Let’s be honest. These names are bad, and anyone that hasn’t been following climate closely can easily be forgiven if they don’t initially realize that these names are official, because they don’t sound official.
There’s a reason that in engeering, we don’t make up cutesy names for our programs and instead make “The X Database”. People take you a lot more seriously if you act seriously.
benofhouston
Sometimes in engineering if you don’t define your name someone does it for(to) you e.g. TWAIN protocol
“None was selected, but the entry Technology Without an Interesting Name continues to haunt the standard.”
My personal favorite is from Calvin and Hobbes. “GROSS” Get Rid Of Slimy girlS
I guess one of my prejudices is my BS meter starts to go off when people inflate language to cover lack of facts. Generally the more pompous it sounds the less factual coverage.
Ben of Houston. As an engineer who worked with “Rbase” many years ago (1980’s), a natural query database language that we used as client server to our mainframe database. We had a query “Who are the axxholxs?” which gave back a list of all the project managers in the company who were projected to go over budget on their projects based on a well defined historical graph based on individual performance. Even engineers have a sense of humour. Most people did not know about the query, but a lot of us did. (and it saved us a lot of money.) Oh, and we had another one: “Who are the heroes?”
The RRR and the Blob have been around a while and have well known consequences that we will likely see again this winter and the west coast salmon fishery will be reviewing. I am not sure it is a particularly new phenomenon, but better identified than in the past.
rocky,
Is ‘El Niño’ all growed up enuf for ya? Being a little boy an’ all?
And another thread enters into the ever decreasing circles of sophistry and plain bad manners .
STFU springs to mind , Comments on the article and not on the comments would be appreciated !!
D’OH!
“The Blob” is actually scientific jargon for the phenomenon, and not humor at all, at this point.
https://en.wikipedia.org/wiki/The_Blob_(Pacific_Ocean)
As to the Ridiculously Resilient Ridge, it seems to be Tisdale’s suggestion for a designation of the corresponding atmospheric phenomenon. Bestowing names on phenomena has long been part of the practice of science.
And it is alliterative as well!
rockyspears- Just so you know, Bob Tisdale has written at least one book on the subject of SST and El Niño and is one of the world’s foremost experts on the subject. After reading other comments in response to you (and your responses) it would seem a good time to remind you of the first rule of holes…
Ne’er mind- I see you caught on.
“Rocky Spears”…”Ridiculously Resilient Bulge”…I mean Ridge.
Cliff Mass blog discusses the blob and RRR over the past few years and references the scientists at Univ of Washington one who dubbed the nickname Blob for the relatively warm water in NE Pacific.
Here’s an older reference: http://cliffmass.blogspot.com/2014/09/did-blob-cause-our-warm-summer.html
whom not who
You know, y’all, I’ll side with Rocky on this one. These are pretty bad names “The Blob” the “Ridiculously Resillient Ridge”. It makes it seem like we aren’t taking things seriously, even if the name is official.
Science may be the most important, but impressions count more than some of you seem willing to admit.
Floppy drive, hard drive…
Lack of drive
For a while, the 3 1/2 inch format drives were called stiffies.
Ben of Houston says “You know, y’all, I’ll side with Rocky on this one. These are pretty bad names “The Blob” the “Ridiculously Resillient Ridge”. It makes it seem like we aren’t taking things seriously, even if the name is official.
Science may be the most important, but impressions count more than some of you seem willing to admit.”
I agree Ben. And let’s not use Hockey Stick, Blue Northerner, Sun Spots, Climate Gate, “Greenies” Deniers, Warmers, Warmists, pause, (I could go on).
Strange quarks, charm quarks, gluons? And those aren’t even nicknames.
Seems a little late to worry about goofball terms in science.
Well scientists do have a sense of humor. How else do you get a name like “anandamide” for a compound the body produces?
See also here. Enjoy.
Don’t forget unobtainium. We have a critical shortage.
Went to Steve C’s “here”. Precious folks, precious. As the odor control guy for a landfill I deal with some of the molecules. My wife now believes me. Like Doctor T I like neat names so she was suspicious.
Hope all relax. Fun names are, well, fun. On first exposure though they likely do seem like Psychology, Sociology and Anthropology terms.
RS,
Do a little homework.
Bob Tisdale, Nick Bond (WA State Meterologist), and Cliff Maas (another good reference for this phenomenom) are all capable and reputable scientists. That one of them might coin a term that fails to meet your exacting standards in order to communicate something to the general public, is a critique on your standards, not theirs.
It seems that the use of silly names and a stiff resistance to faux “sciencey” sounding terminology is quite popular amongst people who do real science and are not struggling to pretend that they are scientists.
In the soft/fake sciences, the matters discussed are often of such little consequence that all discussions must be encrypted in pointless (often psuedo-latin-greek) invented terminology, such that everyday matters can be presented as appearing to be high science. In other words, there is sadly a tendency to take simple matters and make them appear unfathomable and to speak of them in specialist language that is hard to decipher.
Even in modern medicine the longstanding commitment to potentially misleading terms such as the oft confused/misheard prefixes, “hyper-” and “hypo-“, has no possible justification, beyond ostentation. (Why not “high” and “low”?)
However the real purpose of science communication should be to take complex matters and render them in a manner which makes them understandable, familiar and memorable, using terms which are distinct and therefore less liable to lead to confusion.
For this purpose, silly names are very helpful and certainly do no harm.
Here’s an example. An example page which I just found on the website of CERN.
CERN is not struggling to make its science “look” serious. So, silly terminology is of no concern to them.
http://pdg.web.cern.ch/pdg/cpep/quark_fun.html
the language reduces the article to one of almost Parody
=========================
A very quick internet search reveals these terms to be common usage. The Parody is not within the article. It is with Climate Science. Which, like Political Science, has nothing to do with science, and thus must add “science” to its name.
Climate Science is a Parody of Science. Hence the names:
https://en.wikipedia.org/wiki/Ridiculously_Resilient_Ridge
The “Ridiculously Resilient Ridge,” sometimes shortened to “Triple R” or “RRR,” is the nickname given to a persistent region of atmospheric high pressure that occurred over the far northeastern Pacific Ocean during 2013-2014.
https://en.wikipedia.org/wiki/The_Blob_(Pacific_Ocean)
The Blob is a large mass of warm water in the Pacific Ocean off the coast of North America.[1] It was first detected in late 2013 and is expected to continue throughout 2015.
IIRC, the “Big Bang” was coined by a detractor. People have tried and failed to come up with a better term.
Then please state what your doubts are. On what basis do you have these doubts? Just saying you have doubts doesn’t give us any information we can work with or take a position on. The author did not hurt or help his article with the use of the phrase Rediculously Resilient Ridge. All he is doing is emphasizing that it is an amazing weather pattern for having lasted so long, not that it is sentient and has guilt feelings about being ridiculous. Judging an article on a harmless name seems over the top to me. So spill the beans, what are your doubts and why do you have them?
Disagreement is fine so long as you provide some rational (or attempt at rational) reason for the disagreement. This at least gives others the opportunity to evaluate your intelligence or lack there of. If you simply dismiss something but don’t explain why, I always interpret this as a kind of delusional egoism. That doesn’t mean that I agree or disagree with any of the statements in the actual article. It just never ceases to amaze me that people can express empty opinions anonymously and somehow not be self aware enough to realise that any intelligent person reading them will consider them to be nitwits.
like acidification of the seas.
i had never heard of it pre- 2003.
Rocky,
Bob Tisdale probably was being humorous. That doesn’t preclude serious consideration. The ridge is in fact “ridiculously” resilient because under “normal” circumstances, a similar ridge appears every summer off the Pacific coast, but it weakens and breaks down during the fall and winter, only reform again in the following summer. It helps generate California’s “Mediterranean” climate. This time the stupid ridge has persisted season when it should go away, which forces weather, that the Pacifc coastal states need, to head for Canada and Alaska instead. Juneau for example experienced almost six (5.8) inches of excess rainfall in July, which is over double normal. Of course, its normal for that in July and August, but when it happens during the winter, here in California we get what Jerry “Baby” Brown calls a drought.
The “Blob” was not named by Mr. Tisdale, so you shouldn’t hold it against him.
there’s a large chain of seamounts right under The Blob, this may sound ridiculous but has anyone been down there to take a look?? and is it unfeasible that volcanic activity may be partly responsible for the elevated surface temps?
I think the amount of volcanism required to heat that much water would be very visible.
The volcanic activity under the Antarctic is huge yet relatively unknown until very recently. Volcanism does not need to be the major driver the warmth generating the blob. It could be one of several. I don’t think it a concept that should be so easily dismissed.
How much is known about volcanic/tectonic activity in that part of the ocean? How deep is the ocean in the area?
Posted this above with link – the Axial Seamount 300 mi off the Oregon Coast has been erupting for a few(?) months.
According to
this article, it’s been “having at it” since April this
year, or maybe earlier. The centre of “The Blob” appears
to be more or less coincident with the volcano’s location.
Could this be more than mere coincidence?
No, not the centre, more like the NE edge. The warmer, or less cool, area
could be where the plume of hot water reaches the surface. Currents there
would be trending southerly.
And yet in approximately the same position in the North Atlantic there is an equally persistent cold spot.
I cannot help but feel that these two opposites is just Mother Nature giving climate alarmists the finger, but they will still all carry on believing some BS explanation from the great Mann himself.
The mystery of this “warm blob” is just one more indication that there is a lot about the planet that we do not know.
Extensive “blobs” warm water appear on historic El Niño maps in many years. They simply don’t normally move to the west coast and hang.
Has the Blob shifted east? I thought it was doing that earlier this year, as for a while the water just south of Bering Strait was below normal, but it looks like it has warmed up a little and is now slightly above normal south of Bering Strait.
I figured the ice-melt would be above normal north of Being Strait, with all the Pacific warmth about, and there has been some decent melting up there, but what completely baffles me is why the air temperatures are not warm. The O-buoys have even been showing some refreezing happen in the Beaufort Sea. I’m not talking about the fresh water in melt-water pools, but the salt water between bergs.
This seems to verify a general rule I have: “Never bet more than a nickle on Arctic forecasts.”
https://sunriseswansong.wordpress.com/2015/08/10/arctic-sea-ice-the-last-floes-of-summer/
Blob – I believe it has shifted south east and for a while it seemed more concentrated in just to the north west; then seemed to spread south along the California Current and north up the BC/Alaska coast. A lot of people are expecting reduced salmon runs in the north this year as the salmon change where they feed and when they return to the rivers. Plus xome rivers are warmer and have lower flow so many salmon will spend extra time in the ocean before returning. (If you doubt that, you can search it with your favourite search engine like DuckDuckGo. As opposed to teachings in most school systems, salmon are pretty flexible on when they decide to go up river to spawn.) I suppose I could provide the links I have, but sometimes you learn a lot doing your own searches.
On an early post on this, I guessed it will be 5 years before the blob dissipates given the number of years it took to form. Fishermen and Government Fisheries have observed the phenomenon of varying temperature in this region and its affect on the fisheries for some time but the satellite definition of this blob has provided some new and important insight into not only the fishery, but the impact on North American weather. Not sure it is new since I seem to recall this weather set up occurring in the past.
Bob’s posts add another interesting dimension that we can keep track of and correlate with other things.
Thanks Bob.
thanks for that wayne, i was waiting to see if there were any noted effect on fisheries.
Oh come on, I think it is funny/serious. This is an update on the high temperature anomaly in the Northeast Pacific and the author was just interjecting some humor. I found myself smiling as I read it. I liked it. It was a fun read and a nice update. I’m curious as to what will happen after the probable El Nino is over.
I think the author should change his name to Blob Tisdale – just for these posts 😉
Thanks for the update Bob.
It may be easier for some people to understand this if they knew that the “hotspot” is not exactly hot.
It is just less cold than normal for water in this location.
Same for the North Atlantic…that water is always cold, right now it is even more cold than usual.
If one looks at a map of sea surface temps in that area, there is no blob of hot water evident.
Just sayin’.
you mean we can’t look forward to articles by alarmed environmentalists about scalded sea lions hauling out all along the Canadian Coast?
Here’s the alarming news story you were looking for 🙂
Posted today (8/12/3015) but refers to a event on Sunday.
http://www.patriotledger.com/article/20150812/NEWS/150818930/12662/NEWS
Warm seas nearly shut down Pilgrim power plant – Pilgrim operators were forced to begin preparing for a shutdown late Sunday afternoon when the temperature of the seawater used to cool the reactor edged above the 75-degree maximum set by the federal Nuclear Regulatory Commission.
After reaching a high of 75.09 degrees, the water temperature dropped below the limit about a half-hour later, and Pilgrim was up to full power by 8 p.m.
It was only the second summer in the plant’s 43-year history that water temperatures exceeded the federal limit.
In July 2013, Pilgrim had to lower its power level three times because of water temperatures during a heat wave. The plant has never been forced to fully shut down.
But on a serious note; Most nuclear plant were designed to operate within a specific band of input/output water temperatures. Once your intake temps get too high the plant’s condenser/coolers become less efficient and you have to either increase coolant throughput or reduce the reactors core temperature. The plant hasn’t updated it’s EPA license since 1996 so there is no problem with it doing anything illegal even if it exceeds design specs.
OK a quick little bit of research and the alarm is all over. A bit of regulatory bullshit and a design that dumps used coolant water into the same basin as it’s drawn from explains what is going on there.
are you trying to say that the sea water off the coast of Massachusetts is the same temp as Florida? Or is this because the coolant water is sequestered in such a way that local daytime temperatures can elevate the coolant temperature?
fossilsage,
This can be a problem for any thermoelectric (gas/coal/nuclear) power plant if it uses coolant water from the same source as it discharges the water into. Most plants don’t have any problems with this but there are a few that were poorly designed to handle the occasional freak heat wave. It’s clearly not a big problem since the EPA hasn’t said anything about it in 19 years.
I turn to Bob when I need facts on the Blob.
Thanks, Bob.
Yes, the hot blob in the NE Pacific and the cold blob in the North Atlantic are the most interesting oceanic happenings right now, but the El Niño will have the final word, I think.
For the latest monthly sea surface temperatures (SST) anomalies map, see the Monthly SST Anomaly at http://www.esrl.noaa.gov/psd/map/images/sst/sst.anom.month.gif
Bob, once again another good post, thank you.
Has this phenomena occurred before, and if so, for how long? We were in California In January 2013 and the drought was well under way then, so we do sympathise!
andrewmharding, there have been short-term spikes in the region before, but nothing this strong or that has lasted this long.
Isn’t there an active volcano located under the blob? Its called Axial Seamount. It erupted in 1998, 2011, and earlier this year. Its located on the Cascadia fault, the one that scientist say will cause a major earthquake in the coming years that will affect the entire west coast of the US. Could this volcano have anything to do with the blob?
Looks like Axial Seamount is closer to shore than the blob but then, who knows what’s going on right beneath the blob. http://m.livescience.com/50707-axial-seamount-eruption-gallery.html
Sure wish we had comparable data for the seventies! While the blob seems to be stalled out or resting now, its first appearance seems to have been more central in the Pacific.
So this says the summer persistent ice in Hudson Bay and James Bay does not even register?
I’ve been noticing that too! Compare this from NOAA:
http://polar.ncep.noaa.gov/sst/ophi/color_anomaly_NPS_ophi0.png
with the ice map from Canadian Ice Service:
http://www.bsis-ice.de/IcePortal/CIS/20150811180000_WIS30CT_0008413058.pdf
Not sure how the water can be above average when its covered by ice that’s never there at this time of year?
WUWT?
Dave in Canmore said
It’s because NOAA doesn’t actually have sensors in those areas, and the models they use to infill SST in the Arctic assume the Arctic is warming.
If it were so hot around Greenland, the melt season wouldn’t be so obviously coming to a close…
gymnosperm, the SSTa for the Blob are at record highs, so I don’t know that I’d say the blob has stalled or is resting.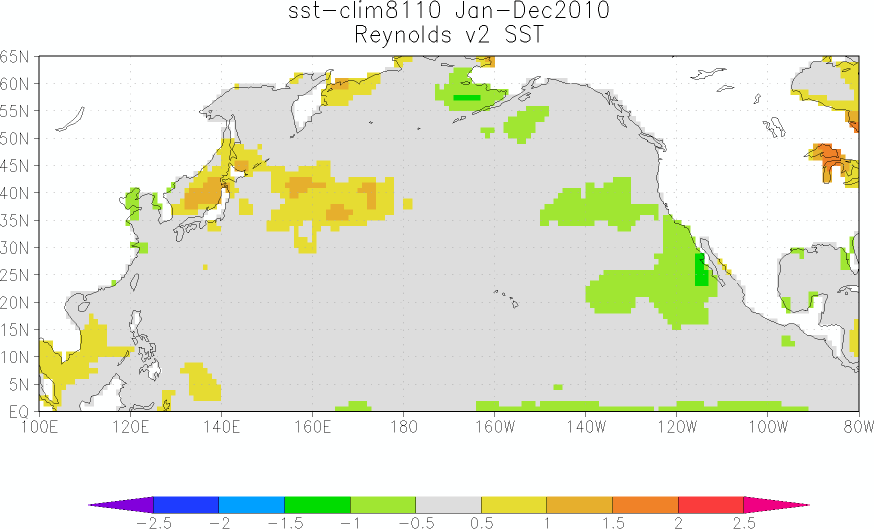
Also, see the following animation from the post here:
https://bobtisdale.wordpress.com/2015/04/21/north-pacific-update-the-blobs-strengthening-suggests-its-not-ready-to-depart/
It formed in the west and migrated east:
http://www.meer.org/ebook/npaccur2.gif
Given the current patterns isn’t the Blob just going to disappear without reinforcing warm water from the west?
Bob, I was just saying it moved from west to east and recently hasn’t moved much. No comment on intensity except that I wish we had data from the seventies.
Bob, I see the blob, but this time it is in 1955 to 2003 trends in sea level. Stumbled across this (and stole it from your post) while researching a value/degree C for the thermosteric component of sea level rise.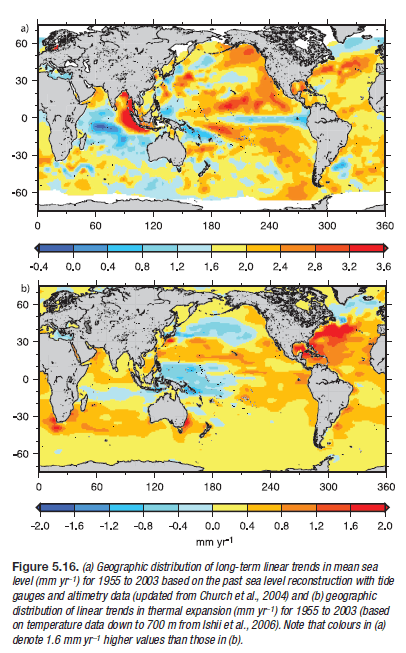
The first image showing the “blob” is old school based on tide gauges and “altimetry”. Don’t know how they did altimetry in 1955.
Been trying to articulate a suspicion that the blob is new to us because now we can see it, and we never could before…
Meanwhile, the Atlantic is dead quiet. How much longer will that hold?
Not too much longer, the water has warmed up some. The waves are coming across. The season is approaching the traditional peak (Sept 10) early season dust is probably settling out though there is still a lot of dust coming across, shear is not terribly noticeable. The season of long runners, the Cape Verde storms should start about now. Time will tell.
One of the effects of the Blob is increased water vapor over the Canadian shield and Hudson Bay. The reduced TSI has led to lingering ice in Hudson Bay and does not bode well for the east coast this winter.
Perhaps, not just the US East Coast. If a structure like this became semi-permanent for whatever reason, it could be a driver of another ice age. The jet stream would become nearly permanent with a NW flow over the eastern half of North America. This is exactly the format taken by continental glaciers.
The cooling of Hudson Bay could be key. If the ice doesn’t melt over the summer it would affect the nearby land areas which would also lead to later snow melts and eventually the formation of glaciers.
The higher planetary albedo would then lead to cooling over other areas of the planet.
I can’t help but notice that this persistent weather pattern has made life a little less pleasant for our friends on the West coast and the East Coast. It couldn’t happen to better group of… people. I hope D.C. gets so much snow this winter that the federal government has to close for the duration.
a little less pleasant for our friends on the West coast
=====================
Vancouver is the new San Diego. Somehow I don’t miss the 7×24 overcast drizzle.
I suspect The Blob is responsible for most the warmest evah claims over the past two years. Has anyone looked at where the global surface temperature would be right now without this warm area? Would it be tracking closer to the satellite data?
Richard M. The blob is responsible for the “most the warmest evah claims”. We discussed I in the post last year:
https://bobtisdale.wordpress.com/2014/12/04/did-enso-and-the-monster-kelvin-wave-contribute-to-the-record-high-global-surface-temperatures-in-2014/
Global sea surface temperature anomalies without the extratropical North Pacific:
The strengthening El Nino should be a major player too in 2015.
Why not remove the warm area covering -40/90 N, -180/180 E. Then there will be no warming at all.
http://data.giss.nasa.gov/cgi-bin/gistemp/nmaps.cgi?sat=4&sst=6&type=anoms&mean_gen=06&year1=2015&year2=2015&base1=1951&base2=1980&radius=1200&pol=rob
The North Atlantic region is in for a big chill. What goes around comes around.
Thanks Bob
How has the shape and extent of this anomaly changed over time? I see a SE movement based upon the 2014 graphic link you provided, but it is hard to tell without comparable overlays. What depth are we actually measuring too? Something similar to TCHP measurements?
ossqss, see the following animation using maps of 12-month averages:
https://bobtisdale.wordpress.com/2015/04/21/north-pacific-update-the-blobs-strengthening-suggests-its-not-ready-to-depart/
It’s few months old, but it’ll give you an idea of how it developed.
http://www.opc.ncep.noaa.gov/Loops/GRTOFS/sst/GRtofs_sst_Pac_03_Day_flash.shtml
Does it have anything to do with Arctic sea ice extent? Arctic Sea Ice Extent bottomed out in 2012. Could it be a reduction in cool water flowing out of the Arctic and into the Northern Pacific since 2012? Just a guess, I have no idea which way melt water flows between the Arctic and Pacific.
http://ocean.dmi.dk/arctic/plots/icecover/icecover_current.png
This map of ocean currents may reveal an answer:
http://www.physicalgeography.net/fundamentals/images/oceancurrents.gif
HAS ANYONE CONSIDERED PLATE TECTONIC FRICTION?? WHERE WOULD ONE FIND CURRENT SEISMIC ACTIVITY? IS THIS A PRELUDE TO THE BIG ONE WHERE THE ENTIRE WEST COAST FALLS INTO THE PACIFIC??? JUST SAYIN’.
cool but gross.
Answer: According to Bond et al (2015), a persistent ridge of high pressure in the mid-to-high latitudes of the eastern North Pacific prevented the sea surfaces there from cooling normally.
That of course begs the question:
“Why is the ridge of high pressure so persistent?”
While we are on the subject of questions….
Are there any measurable changes in currents over the norm for the season?
What do the ARGO data say for readings in the area of the blob over the past 5-10 years?
If there is a surface anomaly, do we see the anomaly at 200 m? 500 m? 2000 m?
Any noticeable changes in conductivity in the profiles?
How about drift magnitude and directions of sequential ARGO measurements in the area over the time period? (That would be an interesting series of maps, even if there were no changes at all.)
What volcanic sea mount explorations have been conducted in the past 5 years in the area?
In what has to be a very sparsely sampled domain, has there been ANY report of activity more than expected?
What are the error bars on the base line?
Just how good was the data in 1971? And
How variable was the base line in the decades of the 70’s, 80’s, and 90’s?
1. The blob causes a persistent ridge.
2. The ridge forces most of the weather systems to the North of the Blob.
3. With strong weather systems diverted around the blob, it… persists.
4. Go to 1.
Could this be an effect of The Blob??…
The U.S. Energy Information Administration (EIA) reported yesterday in their daily “Today in Energy” news release that U.S. West Coast wind power generation is significantly below normal so far this year:
http://www.eia.gov/todayinenergy/detail.cfm?id=22452
http://www.eia.gov/todayinenergy/images/2015.08.11/main.png
Not only that, the reduction in wind power output decreases the further north you get. The reduction in wind power is least in California, 2nd least in Oregon and the most in Washington State.
Wind power capacity factor for the entire west coast was less than 10% in January. For wind, that is exceptionally low.
Could it be that The Blob has altered wind patterns such that it’s decreasing wind farm energy production?
One might ask if the large scale wind farms have contributed to the creation of the blob over time also? I recall an MIT study (2009-10) on large scale wind farm impacts on regional climate. It was not a desirable impact. I do not have the links in this device unfortunately.
It would be interesting if a link were made between the existence of The Blob and all the wind farms that have been built in the Columbia River Gorge area. They obviously have taken away some of the airfow through the Gorge.
If that were true, then The Blob isn’t going away at all. There probably isn’t a link, but time will tell if one exists.
The Blob has altered wind pattern
=====================
Climate Science 101. Cause and effect. Which came first, the wind-farms or the Blob? Since the wind-farms were installed before the blob, they must be causing the blob.
Well, the windmills take kinetic energy from the air and reduce convection (since the wind moves more slowly).
Less convection would mean more NGAGW (Non-GHG Anthropomorphic global warming) which would attributed to CO2 to justify more windmills which would reduce convection, causing more NGAGW which would falsely be attributed to CO2 to justify more windmills… etc.
There isn’t a practical limit to the amount of warming Global Warmers can create trying to stop warming that is unrelated to CO2, by reducing CO2 emissions.
This graph clearly shows that the average monthly or yearly capacity factor is not 35% which EIA use for their levelized electricity calculations and comparisons for wind turbines vs conventional options like coal and nuclear . Using the 35% factor instead of 20- 25% lowers the cost per kwh and makes it look more competitive when in fact it may not be so.
I’m still trying to live down that infamous Friday night. I wish you hadn’t published my booking photo.
Thought I recognized you, Alan ;o)
.
.
Before the current Ice Age (i.e.permanent ice at the poles and not referring to the most recent past glaciation), I wonder if Blobs had a chance to get particularly large? It would seem to me that with better ocean circulation, the oceans would be warmer almost everywhere, but not really, really hot anywhere; no blobs. It sounds a little paradoxical to me, but would we only see great warm blobs when there is an Ice Age and then only during the interglacials?
I suppose somebody around here ought to know that answer.
Does this mean that we (Western Canada) are going to have another warm winter? Exelent!
In the top graph, it looks like SST in the Blob area averaged on the cold side from 1999 through the first half of 2012 due to three strong La Ninas, two of them double-dip ones. The Blob looks like it could be some sort of a bounce from this situation.
>>A persistent ridge of high pressure in the mid to high latitudes of the eastern North Pacific prevented the ocean surfaces there from cooling normally.<<
Really? Is this a fact or is it someone's theory? If it is a well-established fact then please explain to this novice the dynamics of how the atmosphere has kept the northern ocean warm. I've seen so many cockamamie theories presented as fact in recent years, I am unable to separate out what is real from what is only a theory. Anyone care to comment?
No response in nearly 24 hours. So this is a theory that apparently doesn’t have much of a basis. My theory is that submarine volcanism has caused this hot spot.
The Blob seams to be part of a STATIONARY WEATHER PATTERN along the same latitude:
—– Blob Warm — Hudson Bay Cold — Central Europe Warm —- Siberia Cold ( see Sea Ice Page:
Ice Remnants on Siberian Coast). This stationary feature reveals a CALMING of the atmosphere
with less pressure gradients…..(thus also less tropical cyclones)….a few things are connected with a common cause……
I have to wonder if it is related to the Juan de Fuca subduction zone – an area of submarine tectonic activity (and occasional INTENSE earthquakes!) associated with the Juan de Fuca tectonic plate.
I have not yet seen any acknowledgement among the ‘climatologists’ that submarine volcanic and/or tectonic activity (which releases tremendous amounts of heat!) can contribute to local ocean warming which gravity (through the process called convection) can transport to the sea surface directly.
Hi Bob,
Forgive me for asking if you’ve already explained it in the past, but what makes this SST configuration so unusual. Is the SST pattern not merely a manifestation of the positive phase of the PDO over the past couple of years ?
“How long will The Blob and the Ridiculously Resilient Ridge last?”
Well, and I don’t want to give the wrong impression that I am “predicting” anything here, but the “Ridiculously Resilient Ridge” is a condition thought to have triggered the formation of the Cordilleran ice sheet in Western North America. The notion being that a more meridional jet off the west coast pushed more moisture to the north depositing more snow in the Columbia Icefield. This resulted in glaciers like the Athabasca advancing across Alberta and eventually down into Montana. Also, more recent data indicate periods of several hundred years of drought have occurred in the central Sierra Nevada in the past 1000 years. One period was at least 200 years long and resulted in the levels of some Sierra Lakes to be over 100 feet below today’s levels.
So the answer to the question is … anywhere from a week to a few centuries.
http://climexp.knmi.nl/data/ihadisst1_210-235E_35-55N_n.png
http://climexp.knmi.nl/data/ihadisst1_210-235E_35-55N_na.png
I’m going with the SST for this region will be back to 0 anomaly with 1 year.
In the past extreme excursions have been short lived. This is either samo-samo or new behavior. If it isn’t back to nearly average in 1-2 years this region is doing something new.
If it does last more than 2 years and we start going into ice age mode drastic steps will be needed. Subsidizing unfiltered coal use and a radical increase in CO2 emissions may be necessary. Both soot and CO2 warm the arctic. In the US significant portions of the EPA would have to be RIF’d (Reduction in Force) and the savings, together with the $20+ billion in repurposed climate change funding, used to subsidize more fossil fuel consumption.
PA. It took 5 years to form, expect it to take 5 years to dissipate. IMHO See Bob Tisdale’s animation and previous posts where a bunch of folks made their predictions – I said 5 years then, I still think 5 years. But I have been wrong before. 😉
Historically extreme deviations are short lived. The Blob appears to be part of the 2 year old El Nino pattern. When the La Nina starts next year we will see how the Blob holds up. I expect it to disappear.
On the other hand we are on the edge (within a couple of Watts) of an ice age tipping point.
The global warmers are right about tipping points – but we are near all the cool ones and have been losing 0.25°C per millenia for 8000 years according to this:
http://wattsupwiththat.com/2012/09/16/onset-of-the-next-glaciation/
http://www.msn.com/en-us/weather/topstories/think-the-next-ice-age-is-1000-years-from-now-try-15/ar-AAcUrwE
Given that we are at a Milankovitch and solar minimum it could get interesting. If we start entering the ice age that is pretty much it,
Has this type of condition never happened before ?
Not in the satellite era. Before that, records are sparse.
Does that not also imply that we don’t have a full understanding of all the factors in play during the Dust Bowl?
Last really significant one was likely about the time of the Little Ice Age
https://www.hcn.org/issues/44.22/underwater-forest-reveals-the-story-of-a-historic-megadrought
So the high pressure keeps the heat from escaping and then the normal southerly current move sthe warm water down along the coast, right? Then doesn’t the heat escape along the way?
I wouldn’t say it “keeps heat from escaping” so much as the southerly flow offshore prevents colder water from the gulf of Alaska being blown down the coast. Note this is an anomaly graphic which means the water is 2 degrees warmer than normal. It’s still pretty cold. The wind blows from south to north instead of from west to east when we have this condition. The ocean surface gets more sunshine than normal, too. The last few years have seen tremendous amounts of rain but it has all been 500 miles out to sea from the California coast and pushed north into Alaska and British Columbia instead of into Washington, Oregon, and California.
Bob:
You just don’t get it. The approximately 3 – 5 ppm increase in CO2 from 2012 – 15 has forced an 2 – 4 deg C increase in the North East Pacific surface temps EXACTLY like the models predicted. 🙂
A more serious thought/question
“According to Bond et al (2015), a persistent ridge of high pressure in the mid-to-high latitudes of the eastern North Pacific prevented the sea surfaces there from cooling normally.
This layman’s gut feel says agrees with Don’t Get Out Much’s sentiments. Bond’s assessment has it backwards. The warmer sea surface temps helps create persistent ridge of high pressure and the associated effects that come with it.
Why do I tend to think in that direction?
If I recall correctly from a past post on WUWT, atmospheric temps has a 0.83 correlation to changes in sea surface temps. I do believe that correlation/causation link here. i.e. sea surface temps do cause atmospheric temps increases.
Looking at the Thermohaline circulation. As the poles freeze and the denser water sinks, it initiates a chain effect and eventually push water up somewhere. Depending the freezing rate the amount of displacement will vary accordingly. I would be asking the question does the up-welling water in the NE Pacific has more heat energy contained in it than previous years, ergo higher temps, creating a high pressure dominant ridge. If so, where is that higher heat content water coming from? At what rate? What is the heat content further up the supply chain? Then you can start to determine when it will end.
One question I have is the energy content. While volume may vary with the freezing rate at the poles, given the ice will freeze at a constant temp, I would think the energy content on a per volume basis would be constant. So, if we look at the supply chain system, where does that extra heat content in the up-welling water come from? I just can’t see the sun being so area specific it would create the blob.
Is anybody studying the ocean temps in the X, Y and Z direction to any degree beyond the broad scoped ocean current temp diagrams we see all the time? i.e. are they breaking areas down to the same degree climate models break the atmosphere into? Your thoughts?
Cheers
Mike
One thing I do know, as a Vancouver, BC area resident, I’m not buying a local area ski pass this winter. Waste of money last year and given the warm/warming NE Pacific ocean temps, I see another crappy season coming. We’ll find out soon enough.
Mike H. I agree with you. Have seen this pattern before (I’m old). I wouldn’t buy a pass for Grouse, Seymour or Whistler. But I bought my pass for Sunshine. Snow wasn’t great last year but enough came early that I skied Lake Louise and Sunshine in November in great Pow for the first time in years; lasted into January then not so good till spring but the back country in the Rockies was excellent. Get out of the Lower Mainland and come to ski country. 🙂
l think The Blob is a sign of climate cooling across the northern Atlantic side of the NH.
lce ages are caused by static weather patterns over many years. The real threat from the Blob is that it sets up the ‘Arctic Blast’ weather pattern across North America. This weather pattern starts to become a real threat when it starts to turn up every winter and then extends itself into the spring. Because should this happen for long enough, then along with other factors it takes the whole Northern Atlantic side of the NH into climate cooling.
http://www.woodfortrees.org/plot/esrl-amo/from:1950/plot/hadcrut4gl/from:1950
A other thing to watch is low pressure over northern Russia. Should this weather pattern become static during the summer and then linger into the winter. Then it risks moving the high pressure that would otherwise sit over this area during the winter. To move westwards and sit over northern europe instead. So there will be cold air pushing down across the northern Atlantic area on two fronts. Risking a pincer movement that takes the whole area into major climate cooling.
Look at the changes in the magnetic field and solar activity. The lower activity, the more impact of the magnetic field.
http://www.esa.int/Our_Activities/Observing_the_Earth/Swarm/Swarm_reveals_Earth_s_changing_magnetism
What causes the weather patterns to become static l don’t know.
But the ice ages suggest that they can stay that way for at least 100’s of years. Because the ice age shows that its not just the ‘Arctic Blast’ pattern that can become stuck. But also blocking high pressure between Greenland and NW Russia during the winter months. With what’s been happening over Russia for the last month or so. l now feel that l understand what could be the cause of this.
Likely we now have the instrumentation to identify the causation of long drought conditions characteristic of the region.
Several have talked about Hudson bay here and how the ice is lasting longer.
This from the NorthwestPassage2015
In 2014, the Bellot strait was still clogged with ice as late as Sept 9. It cleared enough to let 4 ships pick their way through and stayed open a week or two. The M/V Silver Explorer made a westward passage throught the Franklin/Victoria strait with the help of an icebreaker. http://wattsupwiththat.com/2014/09/03/has-arctic-sea-ice-made-the-end-of-melt-season-turn-prematurely-this-year/#comment-1739735
Northwest Passage Ice Concentrations – Queen Maud 12-Aug-2015
The Bellot Strait is that narrow break in the isthmus at 72 N 95 W.
http://ice-glaces.ec.gc.ca/prods/WIS38CT/20150812180000_WIS38CT_0008414805.gif
I don’t know about the rest of California, but here in the Eastern Sierra, El Nino has already been working for us…some areas are 250%, some 800% of normal precipitation for the new water year.
Now if El Nino sticks around and keeps working for us through the winter, that will be some real precipitation.
From Arsoles and Aha-has to Vini vidivicis
to Agathidium vaderi and the Big Bang,
the scientific world does not want for silly names. Just search for –
funny science names
Re: ‘Blob’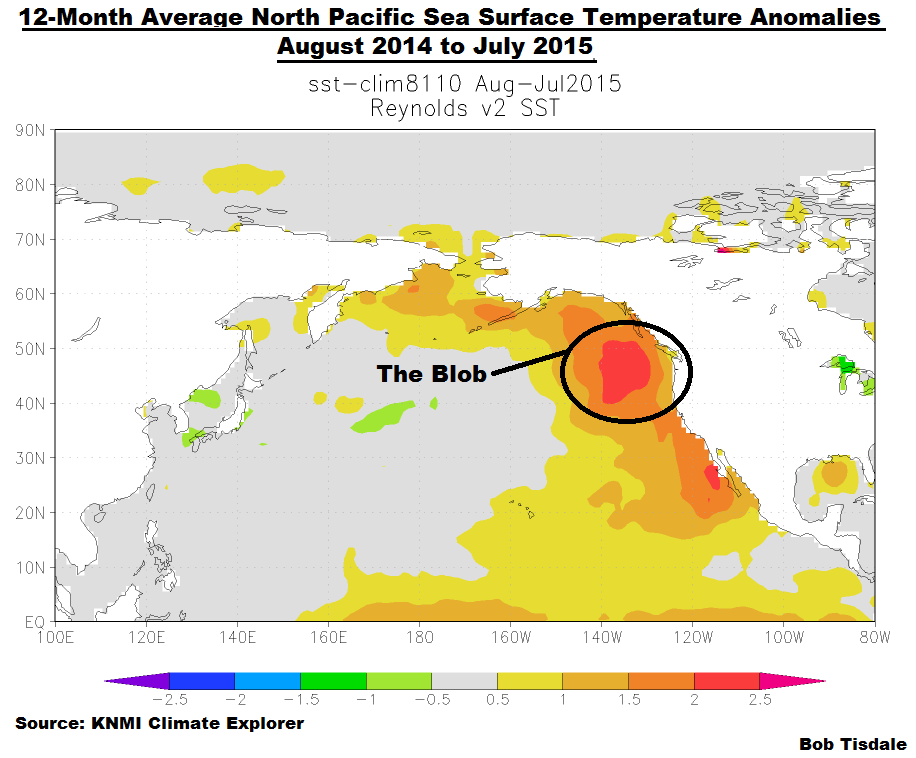 ?w=720
On number of past occasions I have commented that the significant temperature trend changes are caused by ocean currents in the area of confluence of the warm and cold currents.
One of those areas is just east of Japan
http://www.pmel.noaa.gov/np/images/maps/KuroshioOyashio.jpg
The Kuroshio Current (in red arrow) runs off the coast of Japan. It is a strong and very large warm surface oceanic current travelling 40 to 121 km/day at 1.6 to 4.8 km/h. At about lat. 35°N it divides to form an eastern branch flowing nearly to the Hawaiian Islands and a northern branch that skirts the coast of Asia and merges with the waters of the cold Oyashio Current to form the North Pacific Current.
The Oyashio Current (in green arrow) is a cold subarctic current that flows south and circulates counter-clockwise along the western North Pacific Ocean. The two currents collide near eastern shores of Japan forming the North Pacific Current.
North Pacific current that splits into the Alaska Current and the California Current The Alaska Current curves to the north into the Gulf of Alaska creating the Alaskan Gyre, while
the California Current veers south and flows around the East Pacific Gyre.
http://www.physicalgeography.net/fundamentals/images/oceancurrents.gif
Location of the Blob
In 2011 ocean floor topography at the confluence of Kuroshio (warm) and Oyashio (cold) currents to east of Honshu island was disturbed by magnitude 9 earthquake, having an effect on the surface currents circulation.
http://www.mediotech.co.jp/item/20110404_3.png
Enter your comment here…
vukcevic:
Let’s just say you are correct.
How long do you think it will be until someone claims that what you’ve described was caused by increased atmospheric CO2 levels?
Hmm…., good point.
Earthquakes are known to be releasing large quantities of CO2.
The area where I come from has the highest concentration of CO2 to be found anywhere in Europe; it is due to the local tectonic plate’s subduction
http://www.vukcevic.talktalk.net/SEE-CO2.jpg
(white circles a recorded earthquakes)
Honestly, the blob is still quite cold water (12-15C), but the interesting part is that it is warm to 500 m depth (see WUWT ocean reference page). How can this be a surface coverage effect? To me, it looks like a stream instability where the current coming down the coast has been diverted to the central pacific (where there is a cold spot). I was looking for ocean current data to show that the blob can’t disperse because of reduced current. Any idea where to find that?
Or due to a large deep sea volcanic eruption such as the none posted earlier:
http://www.csmonitor.com/Science/2015/0503/Underwater-volcano-spewing-lava-off-Oregon-coast-video
Hi JDN
Richard G posted this link
http://www.opc.ncep.noaa.gov/Loops/GRTOFS/currents/GRtofs_Curr_Wcst_03_Day_flash.shtml
Here is another one showing the north central Pacific.
http://www.opc.ncep.noaa.gov/Loops/GRTOFS/currents/GRtofs_Curr_Pac_03_Day_flash.shtml
“..a quick update on the naturally occurring warming event in the eastern North Pacific known as The Blob”
Hmm…”naturally occuring”. Nice touch
“We first discussed an unusual hotspot in the sea surface temperature anomalies of the eastern extratropical North Pacific…”
Ok….so…an “unusual ..[but]…naturally occuring hotspot”
Seems the Paper highlighted in your post: https://bobtisdale.wordpress.com/2014/12/17/researchers-find-northeast-pacific-surface-warming-1900-2012-caused-by-changes-in-atmospheric-circulation-not-manmade-forcings/ managed to just miss the Blob! Wonder what the authors would make of it now!
Possibly what Dan Cayan of the Scripps Institution of Oceanography says holds true “there’s no doubt that this anomaly in sea surface temperature is very meaningful”.
The paper you so freely quote ( http://www.pnas.org/content/111/40/14360.full ) concludes:
“Further study may clarify the mechanisms behind the low-frequency circulation-temperature variability of the NE Pacific, so that a fuller understanding of natural and anthropogenic changes can be attained.”
The jury’s still out, watch this space
If i remember correctly, didn’t Steve McQueen freeze The Blob using CO2? 😎
That was that “other CO2”, Gunga Din – you know, the CO2 that cools.
I’m sorry. Every time someone reference to the Blob, my mind goes right to the movie “The Blob”.. Get out the fire extinguishers
Can’t remember if they froze it, electrocuted it, or burned it.
They airlifted it to Antarctica.
Bob, I have wondered for quite a long time if the warm Kuroshio current can carry at times over to/influences North America, a process similar to the Gulf Stream which keeps Britain and Europe warmer than if it had not.
Keep up the great work.
The Blob was around in 1917-1918
https://mobile.twitter.com/BigJoeBastardi/status/431519673541066752
Hah! I did not see this before posting below that it was very possibly a multidecadal oscillation itself. I can believe that they could resolve it by 1917-1918, because by then WW I had forced an increase in the size of all of the world’s navies, and navy ships actually patrol and follow protocols for measuring temperatures and logging them. Weather forecasting as a numerical discipline didn’t formally start until 1922, but the world’s navies (especially the British) had been forecasting weather since the mid 1800s and forecasts had been widely disseminated since the invention of the telegraph, so one imagines that by WW I the navy’s methodology was already pretty advanced and that the discipline of making accurate measurements and communicating them by means of the new wireless technologies that were emerging by the beginning of the 20th century was starting to fill in at least strategically important parts of the vast terra incognita of ocean temperatures as a field.
rgb
The blob could be linked to the repeated abortive el Ninos. Poleward heat transport is slowing. Thus the Pacific gyre has slowed. In the Atlantic similarly the Gulf Stream is slackening. This could represent AMO/PDO conditions preceding a period of cooling climate
I wonder if this is a multi-decadal pattern of the North Pacific Gyre Oscillation? This oscillation combines sea surface temperature, sea surface pressure and fluid dynamics related to the complex systems of gyres in the northern Pacific. I do know this. The drought we have experienced in NE Oregon has a familiar ring to it, with a 20 to 30 year period in-between occurrences in my memory.
As an aside, see the link below for information on the rapid pace of discoveries related to global and regional scale oceanic/atmospheric systems. I wonder which group of scientists are beginning to question global warming being anthropogenic instead of driven by natural intrinsic systems.
http://earthobservatory.nasa.gov/Features/WarmPool/warm_pool.php
The Blob might be named Prigogene’s Ghost. It very likely is caused by global warming, because one of the responses of a turbulent, chaotic system driven by heat transport to an increase in driving is to self-organize its dynamic dissipative mechanisms — e.g. turbulent rolls — to increase dissipative efficiency. This is clearly evident in lab experiments on heat transport through fluid systems from the simplest to the most complex. Just as thunderstorms are comparatively small and local manifestations of this process that spontaneously form and transport surface heat in the form of latent heat and convected heat straight up through the greenhouse layer to locally warm the upper troposphere where the heat can be lost to space via radiation at many times the rate it can be lost to space down at the surface, just as the multidecadal oscillations themselves are very large scale (spatially and temporally) versions of the same thing, the emergence of The Blob as a (comparatively) “hot” spot (the water there is probably still very cold, it is just a lot warmer than it usually is) is likely the fluid system self-organizing a mode that will cool the overall Pacific much more efficiently than the same amount of heat raising the temperature a much smaller amount uniformly distributed across the ocean. Like ENSO, it could emerge, produce an anomalous cooling rate that overshoots “equilibrium” as it is maintained by the momentum of the convection fields even after the driving forces that created them drop below the critical value at which it emerged, and become the The Cold Blob in a year or two, or it could be comparatively stable.
However, although it raises surface temperatures in a local patch of ocean, note that this simply increases the overall cooling rate of the ocean compared to uniform distribution of heat-linked temperature change, just as does ENSO.
There are lots of interesting questions one could ask about this on the side, BTW — if TB is truly a previously unobserved multidecadal oscillation (which I wouldn’t find at all surprising) but one with a period of a century or so, one wonders if there was a similar warming that occurred in the 1930s, or if this was a stationary pattern and not even an oscillation that might have persisted before that, perhaps back when California was all mostly stable desert as was the case back in the 18th century and earlier. We have almost no way of answering questions like this — ENSO itself wasn’t discovered and named until just about the beginning of the 20th century. Back in the mid-19th century and earlier, there simply were no observers armed with thermometers anywhere near the Pacific Northwest on the land side, and fewer still on the ocean side. Portland, Oregon (for example) wasn’t founded until 1851. There would have been so very little ship traffic through that part of the ocean prior to that, and even after that it probably hugged the coast and would not have observed an offshore warming of 4-5 F or notably resolved an onshore warming of 1-2 F as an anomaly as they had no basis for measuring anomalies and had nothing like a standard laboratory grade procedure for measuring sea temperature from a ship in the first place.
There would have been almost no actual shipping through The Blob before the 20th century. Japan was closed, China was nearly closed, and sailing ships hugged the coast for transport up and down the western coastline of the US. I have no idea what sort of basis there is for any temperature measurements or assignments of “anomaly” temperatures to this part of the ocean in the 19th century, but I’m pretty sure they are sparse, inaccurate, and nearly useless as far as determining whether or not this is a regular phenomenon or one that is truly in response to global warming. I have no trouble believing that it is the latter, but without data the former can hardly be excluded.
Note well that if it did occur in the 19th century, it would have been invisible. All of the computations of “anomaly” temperatures for the 1800s would be too low, as they doubtless krige land and near shore temperatures across the vast empty unmeasured space, and hence are subject to enormous errors when in fact the temperature maxima exist and persist in the middle of that unmeasured space. Oops. The Blob strikes, and the place it hits the hardest is the error estimates and excessive cooling adjustments made to the earliest part of the anomaly, where the error estimates are absurdly small and the cooling adjustments indefensible.
rgb
Nonsense. You ascribe a source that does not have the energy necessary, nor evidence of its migration there, to create the Blob. Anthropogenic sourced downwelling longwave infrared, given its weak W/ms strength, does not have the energy to create that blob. Rgb, do the math for that volume of water and you will have to come to the same conclusion.
i my be wrong pamela, but i did not see the phrase “man made” ascribed to the global warming part of the post by rgb.
As noted below, I wasn’t ascribing a cause to the warming, only describing a predicted effect of warming whatever the cause.
However, please note that I also don’t subscribe (lots of scribing, here:-) to toy cartoon pictures of the total greenhouse effect, some reasonable fraction of which can be attributed to human generated CO2. The greenhouse effect can IMO best be understood in terms of TOA spectrographs that allow one to — within reason — identify the temperature/height of the emissions from the planet which cool it to balance the mostly SW incoming sunlight that warms it and produce a dynamic equilibrium temperature that is distinct from what one would expect if the planet had no atmosphere and emitted all outgoing radiation from a solid heterogenous surface as approximately blackbody radiation at a local surface temperature. In this view, the ALR plays a key role, as does mere blocking/absorption of LWIR in the active greenhouse bands until the atmospheric density is low enough to permit LWIR photons to escape to space at the temperature of the emission height and consequently at an emission “temperature” in the band that is much lower, usually, than the surface temperature beneath.
So I’m not really concerned with the intensity of the “downwelling IR” at the surface, as this is just part of one of four local mechanisms that couple the surface temperature to the temperature of the atmosphere right above the surface — conduction, convection, latent heat and radiation all four contribute to bidirectional energy transport at the surface. Over the ocean this is almost never in “thermal equilibrium” — something is always heating or cooling, and the ocean and atmosphere just above (meters above) the ocean are almost never in good agreement in temperature — one or the other is warmer or cooler by multiple degrees C much of the year or much of the time, partly because the specific heat and specific gravity of the ocean are both much larger than that of air and so it takes a lot of heat exchange to heat it or cool it and because it takes a lot of force to make it change its pattern of movement (relative to air).
So what warms the ocean? Mostly sunlight. Sunlight is partially reflected and partially transmitted at the surface, and the transmitted fraction is almost all eventually turned into internal energy misnamed “heat”. A warm breeze over a cold ocean might warm the surface a tiny, tiny bit. Extra LWIR from the warm breeze might warm the cold ocean a tiny, tiny bit. But only sunlight is going to warm the ocean to any depth.
What, then, cools the ocean, how does it lose the heat added by sunlight? This is the big question, the one that I think Bob has been focusing on with almost all of his posts. The only means of energy transport from the surface of the sea to infinity (outer space at 3 K) are the usual ones — conduction (to sea bottom, to shore, to the atmosphere — to the physical boundaries of the ocean bulk volume), convection (technically heat transport rather than loss, but conduction plus convection allows a continuous exchange of heat at a boundary via conduction that is then moved away, and of course in the bulk ocean general thermohaline circulation redistributes internal energy/heat so that it forms a major component of the path followed from entry as (probably) sunlight and eventual exit to space, radiation — almost entirely LWIR if one follows custom and subtracts out the initially reflected fraction of SW via “albedo” as a non-blackbody, non-thermal process, and latent heat. Latent heat is a huge one — the ocean surface is nearly always evaporating water (cooling it relative to the air above) or receiving downfalling rainwater (or snow, or sleet) that is water that gave up its latent heat very high up in the atmosphere and is now returning, cooled.
If you look at TOA spectrographs looking down taken over (mostly) ocean water, you still see outgoing LWIR in bands associated with surface temperatures. That is, some of the radiation emitted by the ocean’s surface makes it straight out through comparatively transparent bands in the atmosphere. The air over seawater, however, is usually very humid, and water vapor is a greenhouse gas, so quite a lot of the outgoing LWIR is blocked by water, transferred to the atmosphere, and plays the usual role of moving the temperature of air and water closer together against whatever imbalance they might have. If the ocean is warmer, it warms the air. If the air is warmer, it warms the ocean, in this channel which is not the only channel active and hence may not actually warm or cool as in actually change the temperature in the indicated direction at all. Evaporation cools the water in a pot sitting on the stove, but that doesn’t stop the water from heating when the stove is turned on, it only means that it takes longer to bring it to boil than it might if you put on a lid. In any event, one sees LWIR emission in these bands from much higher, much cooler levels of the atmosphere where it becomes roughly transparent to the emitted radiation, and at these lower temperatures the rate of energy loss is much reduced compared to the rate of energy loss that would have occurred as LWIR directly from the surface at surface temperatures.
That means that independent of the details of energy transport underneath the particular patch of surface you are taking the spectrograph from, there is a greenhouse effect. One that if anything is enhanced by the presence of water vapor per se, although as has been observed and commented on repeatedly, water vapor that cools turns eventually into clouds, and clouds are enormously nonlinear factors in overall heating and cooling as they albedo modulate both incoming and outgoing shortwave (visible light) radiation and longwave radiation, and are large LWIR emitters up high and down low, and eventually they generate snow/rain that falls and cools the entire air column to the ocean or ground surface along the way, acting as “delayed” reservoirs of bulk cooling in between that are often moved long distances laterally (so we get rain in the middle of continents that is the result of latent heat loss from the middle of the ocean).
To summarize, the greenhouse effect at the surface of the ocean exists independent of attribution of warming to “downwelling LWIR. It is implicit in observed TOA spectrographs. It doesn’t “heat the ocean”, any more than the lid I put on a pot on the stove heats the pot, but it can easily alter a dynamical equilibrium temperature of the water heated some other way. Anything that slows net energy transport in a spectral band to eventual loss to space will raise the dynamical equilibrium temperature of a sun heated, open planetary system.
Appearance of the ‘blob’ would indicate reduction in the rate of the deep currents cold waters up-welling. One of possible (speculative) reasons is described in this comment.
Natural changes are not accidental; there is a reason to everything.
I’m not sure how long the Blob will persist, but Obama is headed there for photo ops in Alaska before it subsides and before the ice season starts.
http://www.wsj.com/articles/obama-to-visit-arctic-later-this-month-1439478165?mod=rss_US_News
I want to place Bob’s anomaly chart in the reference frame of actual Sea Surface Temp.
Bob’s Blob is 2 deg. above normal (not very large). The SST’s for the region range from 14 to 22 C (still pretty cold).
http://www.ospo.noaa.gov/data/sst/contour/uspacifi.fc.gif
Now compare the wind circulation patterns with the modeled ocean current speeds.
https://www.windyty.com/?38.100,-103.228,4
http://www.opc.ncep.noaa.gov/Loops/GRTOFS/currents/GRtofs_Curr_Wcst_03_Day_flash.shtml
A question for Bob T. Are the wind and current patterns and speeds also anomalous?
The wind patterns seem pretty organized yet the resulting ocean currents seem very chaotic.
(Always look forward to Bob’s updates.)
This Pacific temperature blob is just a kitten’s cough, mere 2C (real temperature about 19C).
Now young man, if you want to see ‘the blob’ head North into the Arctic and Чуко́тское мо́ре (Chukotskoye more) or as you may you know it Chukchi Sea
This blob has an anomaly of 8C (real temperature 9C), that is what I would call ‘The Blob’.
http://weather.unisys.com/surface/sst_anom.gif
and where would that blob be heading vukcevic ? it will not be therein january, that is for sure .i suspect neither will bobs blob, but time will tell.
No idea, I suppose the experts will tell us they know. I am a bit sceptical about all of the satellite temperatures measurements, land sea and lower troposphere. Not particularly confident in those measured by the surface based instruments either, knowing how many pre and post publishing.adjustments are made.
This is a really stupid question but could radiation from Japan cause anything downstream?
I go away for a while, and you boys are at it again (first few posts). Makes me sorry I came back for a look see. If you want an exclusive club with 30 people or 3 people in it, keep it up. You can’t make people do anything. All the bluster is wasted. Ignore bad behavior, and it goes away. Like me going away right now (almost).
But first, let me say I did like the RRR and Blob. Why can’t we have fun too? (Tschüß!)