Looking back at a recently published paper on ancient sea level and CO2, and noting that the most recent paper by Dr. James Hansen seems to be getting the cold shoulder, I thought it would be a good idea to have a look at both.
First, Hansen’s paper, which isn’t peer-reviewed yet, but is generating some media attention, and some of it isn’t so good. It is titled:
Ice melt, sea level rise and superstorms: evidence from paleoclimate data, climate modeling, and modern observations that 2 ◦C global warming is highly dangerous
Hansen, J., Sato, M., Hearty, P., Ruedy, R., Kelley, M., Masson-Delmotte, V., Russell, G., Tselioudis, G., Cao, J., Rignot, E., Velicogna, I., Kandiano, E., von Schuckmann, K., Kharecha, P., Legrande, A. N., Bauer, M., and Lo, K.-W.: Ice melt, sea level rise and superstorms: evidence from paleoclimate data, climate modeling, and modern observations that 2 °C global warming is highly dangerous, Atmos. Chem. Phys. Discuss., 15, 20059-20179, doi:10.5194/acpd-15-20059-2015, 2015.
Abstract. There is evidence of ice melt, sea level rise to +5–9 m, and extreme storms in the prior interglacial period that was less than 1 °C warmer than today. Human-made climate forcing is stronger and more rapid than paleo forcings, but much can be learned by combining insights from paleoclimate, climate modeling, and on-going observations. We argue that ice sheets in contact with the ocean are vulnerable to non-linear disintegration in response to ocean warming, and we posit that ice sheet mass loss can be approximated by a doubling time up to sea level rise of at least several meters. Doubling times of 10, 20 or 40 years yield sea level rise of several meters in 50, 100 or 200 years. Paleoclimate data reveal that subsurface ocean warming causes ice shelf melt and ice sheet discharge. Our climate model exposes amplifying feedbacks in the Southern Ocean that slow Antarctic bottom water formation and increase ocean temperature near ice shelf grounding lines, while cooling the surface ocean and increasing sea ice cover and water column stability. Ocean surface cooling, in the North Atlantic as well as the Southern Ocean, increases tropospheric horizontal temperature gradients, eddy kinetic energy and baroclinicity, which drive more powerful storms. We focus attention on the Southern Ocean’s role in affecting atmospheric CO2 amount, which in turn is a tight control knob on global climate. The millennial (500–2000 year) time scale of deep ocean ventilation affects the time scale for natural CO2 change, thus the time scale for paleo global climate, ice sheet and sea level changes. This millennial carbon cycle time scale should not be misinterpreted as the ice sheet time scale for response to a rapid human-made climate forcing. Recent ice sheet melt rates have a doubling time near the lower end of the 10–40 year range. We conclude that 2 °C global warming above the preindustrial level, which would spur more ice shelf melt, is highly dangerous. Earth’s energy imbalance, which must be eliminated to stabilize climate, provides a crucial metric.
Hansen’s paper is now open for public comment.
Meanwhile, Climate Depot reports: Former NASA lead global warming scientist James Hansen’s new sea level rise scare study gets ‘cold shoulder’ from climate establishment.
- Warmist AP climate reporter Seth Borenstein said he ‘would not cover’ Hansen’s paper.
- UN IPCC Lead Author Kevin Trenberth calls Hansen’s study ‘rife with speculation and ‘what if’ scenarios’ and based on ‘flimsy evidence.’
- NYT’s Andrew Revkin: “Associated Press, The New York Times, the BBC and The Guardian..among those who steered clear of [Hansen] study”
- Even Michael Mann admits Hansen’s sea level rise estimates are ‘prone to a very large ‘extrapolation error’
Marc Morano comments:
“James Hansen’s new paper ratcheting up future sea level rise numbers is consistent with the new strategy of the global warming activists. Given that current sea level rise rates are not alarming, the only way climate activists can claim anything is ‘worse than we thought’ is to make more dire predictions of the future.
Simply making scarier predictions of the future in order to alarm policymakers is not ‘good science.’ Claiming that climate change impacts are ‘worse than we thought’ because predictions are now more frightening is a well worn playbook of the climate movement.
Simply put, when current reality fails to alarm, make scarier and scarier predictions of the distant future.
It seems even some of the worst offenders in alarmism, including Michael Mann, consider Hansen’s claims “over the top”. This may in fact be the first paper in recent times that Hansen has submitted that has a strong possibility of being rejected for publication. It appears he’s lost his mojo with his peers when they say thing like in the bullet point list above.
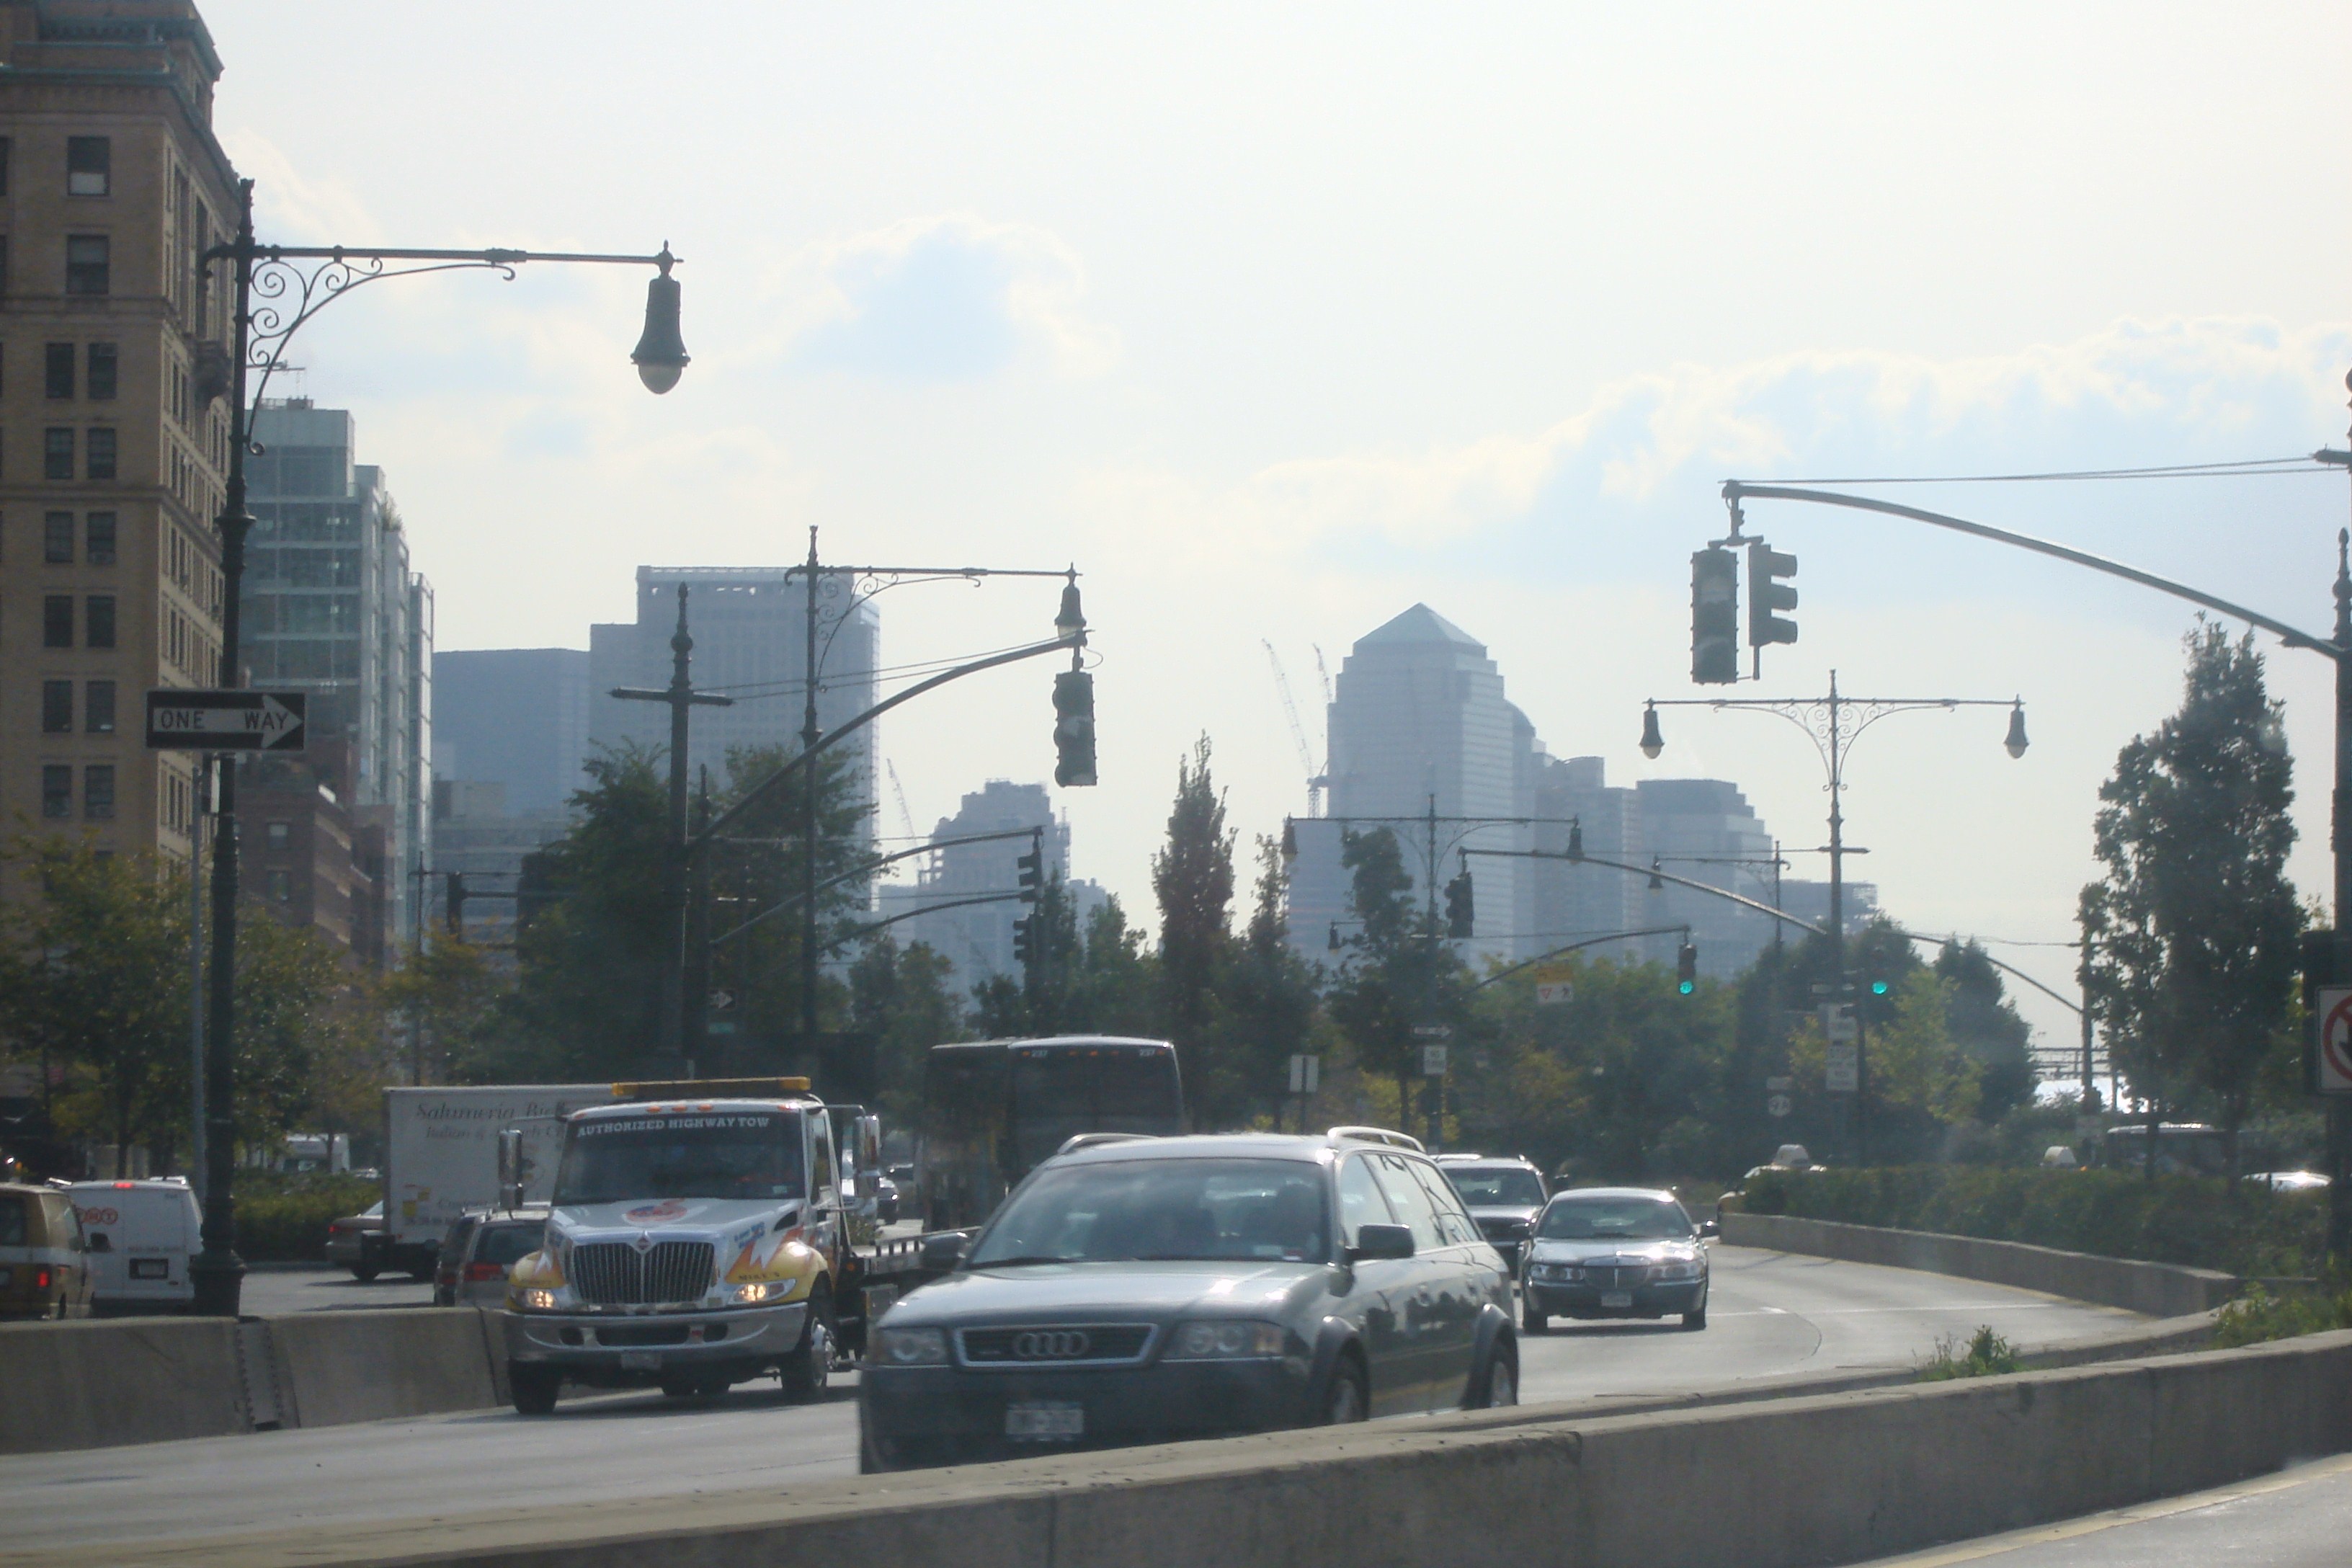
I’ll remind readers that one of Hansen’s most alarming predictions about sea level rise in New York City has yet to come to pass, looked to be falsfied in 2011, and so the goalposts got moved into the future, just as Morano says. Readers may recall our story about the claim Hansen made about the West Side Highway in New York city being underwater by now, due to sea level rise, visible from Hansen’s office at GISS.
I wrote then:
In a 2001 interview with author Rob Reiss about his upcoming book “Stormy Weather” Salon.com contributor Suzy Hansen (no apparent relation to Jim Hansen) asks some questions about his long path of research for the book. One of the questions centered around an interview of Dr. James Hansen by Reiss around 1988-1989. Red emphasis mine.
Extreme weather means more terrifying hurricanes and tornadoes and fires than we usually see. But what can we expect such conditions to do to our daily life?
While doing research 12 or 13 years ago, I met Jim Hansen, the scientist who in 1988 predicted the greenhouse effect before Congress. I went over to the window with him and looked out on Broadway in New York City and said, “If what you’re saying about the greenhouse effect is true, is anything going to look different down there in 20 years?” He looked for a while and was quiet and didn’t say anything for a couple seconds. Then he said, “Well, there will be more traffic.” I, of course, didn’t think he heard the question right. Then he explained, “The West Side Highway [which runs along the Hudson River] will be under water. And there will be tape across the windows across the street because of high winds. And the same birds won’t be there. The trees in the median strip will change.” Then he said, “There will be more police cars.” Why? “Well, you know what happens to crime when the heat goes up.”
And so far, over the last 10 years, we’ve had 10 of the hottest years on record.
Didn’t he also say that restaurants would have signs in their windows that read, “Water by request only.”
Under the greenhouse effect, extreme weather increases. Depending on where you are in terms of the hydrological cycle, you get more of whatever you’re prone to get. New York can get droughts, the droughts can get more severe and you’ll have signs in restaurants saying “Water by request only.”
When did he say this will happen?
Within 20 or 30 years. And remember we had this conversation in 1988 or 1989.
Does he still believe these things?
Yes, he still believes everything. I talked to him a few months ago and he said he wouldn’t change anything that he said then.
I’ve saved the Salon.com web page as a PDF also, here, just in case it should be deleted. So not only did Dr. Hansen make the claims in the late 1980’s, he reaffirmed his predictions again in 2001.
When we reported the story in 2011, saying Hansen’s prediction was falsified, it made some waves, and lo and behold, the reporter comes to the rescue of Hansen, by moving the goalposts out another 20 years.
See the relevant excerpt below:
Michaels also has the facts wrong about a 1988 interview of me by Bob Reiss, in which Reiss asked me to speculate on changes that might happen in New York City in 40 years assuming CO2 doubled in amount. Michaels has it as 20 years, not 40 years, with no mention of doubled CO2. Reiss verified this fact to me, but he later sent the message:
“I went back to my book and re-read the interview I had with you. I am embarrassed to say that although the book text is correct, in remembering our original conversation, during a casual phone interview with a Salon magazine reporter in 2001 I was off in years. What I asked you originally at your office window was for a prediction of what Broadway would look like in 40 years, not 20. But when I spoke to the Salon reporter 10 years later probably because I’d been watching the predictions come true, I remembered it as a 20 year question.“
Source: this update on Dr. Hansen’s personal web page at Columbia University. In my original story, I quoted from Reiss here in the Salon interview.
But here’s the thing, whether its 20 or 40 years, it makes no difference. Hansen’s claim of the “The West Side Highwaywill be under water.” is still falsified by actual data.
Let’s look at the tide gauge in New York and see what it says.

Here’s the PSMSL page that is the source of the above graphic and data http://www.psmsl.org/data/obtaining/stations/12.php
You can see the terrifying surge of acceleration in the sea level due to increasing GHGs in the 20th century. Willis downloaded and plotted the data to see what the slope looked like, and then plotted a linear average line.
Here it is overlaid with the Colorado satellite data. Note the rate of rise is unchanged:

At 11 inches per century, there’s a real problem with Hansen’s claim of sea level rise covering the Westside Highway. He’s betting on acceleration of sea level rise due to increased CO2, but the trend is clearly linear, not exponential.
Additionally and inconveniently, this peer reviewed paper from the Journal of Coastal Research says: “worldwide-temperature increase has not produced acceleration of global sea level over the past 100 years”
The results are stunning for their contradiction of AGW theories which suggest global warming would accelerate sea level rise during the last century.

“Our first analysis determined the acceleration, a2, for each of the 57 records with results tabulated in Table 1 and shown in Figure 4. There is almost a balance with 30 gauge records showing deceleration and 27 showing acceleration, clustering around 0.0 mm/y2.”
…
The near balance of accelerations and decelerations is mirrored in worldwidegauge records as shown in Miller and Douglas (2006)
As of this update in July 2015, we’re 27 years into his prediction of the West Side Highway being underwater. From what I can measure in Google Earth, Dr. Hansen would need at least a ten foot rise in forty years to make his prediction work. See this image below from Google Earth where I placed the point over the WestSide Highway, near the famous landmark and museum, the USS Intrepid:

The lat/lon should you wish to check yourself is: 40.764572° -73.998498°
Here’s a ground level view (via a tourist photo) so you can see the vertical distance from the roadway to the sea level on that day and tide condition. Sure looks like at least 10 feet to me.

According to the actual data, after 27 years, we’ve seen about a 2.6 inch rise. There’ s still a very long way to go to ten feet to cover the West Side Highway there.
To reach the goal he predicted in 1988, Dr. Hansen needs to motivate the sea to do his bidding, he’s going have to kick it in high gear and use a higher octane climate driver than CO2 if he’s going to get there.
Problem is, here it is some 27 years later, and people still drive that highway today without the use of Jet-Skis.
Of course when you live in a modeled world of the future, rather than the real world of the present, anything is possible.
Now for part two.
I recently highlighted the press release and paper from Dutton et al. titled “Sea-level rise due to polar ice-sheet mass loss during past warm periods” in this WUWT story:
Claim: 20-foot sea-level rise in our future (except nature isn’t cooperating so far)
They had this graphic to ramp up the correlation fear of rising CO2 and rising sea level:

In that story there is this interesting statement that appears on the AAAS/Science website about the paper, emphasis mine:
ADVANCES
Interdisciplinary studies of geologic archives have ushered in a new era of deciphering magnitudes, rates, and sources of sea-level rise. Advances in our understanding of polar ice-sheet response to warmer climates have been made through an increase in the number and geographic distribution of sea-level reconstructions, better ice-sheet constraints, and the recognition that several geophysical processes cause spatially complex patterns in sea level. In particular, accounting for glacial isostatic processes helps to decipher spatial variability in coastal sea-level records and has reconciled a number of site-specific sea-level reconstructions for warm periods that have occurred within the past several hundred thousand years. This enables us to infer that during recent interglacial periods, small increases in global mean temperature and just a few degrees of polar warming relative to the preindustrial period resulted in ≥6 m of GMSL rise. Mantle-driven dynamic topography introduces large uncertainties on longer time scales, affecting reconstructions for time periods such as the Pliocene (~3 million years ago), when atmospheric CO2 was ~400 parts per million (ppm), similar to that of the present. Both modeling and field evidence suggest that polar ice sheets were smaller during this time period, but because dynamic topography can cause tens of meters of vertical displacement at Earth’s surface on million-year time scales and uncertainty in model predictions of this signal are large, it is currently not possible to make a precise estimate of peak GMSL during the Pliocene.
Even with the uncertainty factors, a conclusion we can draw from that is that CO2 at present day levels seemed to have no significant effect on sea level rise in that era.
It is clear from that statement that despite no help from greenhouse gas levels, past interglacial periods had higher temperatures than the present and sea levels were significantly higher. The new study in Science magazine shows that in previous interglacial periods, some shorter than our present interglacial, sea levels were as much as 20 to 42 feet higher than during the present interglacial period, and temperatures were also consistently warmer, yet carbon dioxide levels were the same as or lower than they are now, suggesting atmospheric greenhouse gases have not been drivers of significant sea level rise during that period.
 Like with this scary claim from National Geographic even if we do see sea level rise continuously, we may very well be into the next ice age before it happens:
I wrote then:
How long will it take to reach the NatGeo waterline in the cover photo?
The mean sea level trend is 2.77 millimeters per year. At that rate we have:
65.2 meters = 65200 millimeters / 2.77 mm/yr = 23537.9 years
That’s right, 23 thousand 500 years!
A new ice age will likely be well underway then, dropping sea levels. The water would never get there. That’s assuming the statue still exists there at all. Ironically, Liberty Island is a remnant of the last ice age:
Liberty Island is a small 12.7-acre island in New York Harbor. As a remnant of last glacial age, it is composed of sand and small stones deposited as the glaciers retreated.
Even if we believe that sea level will accelerate to 2 or 3 times that rate (as some proponents would have us believe), we are still looking at thousands of years into the future. At a 3x rate, we are looking at 7846 years into the future.
And then there’s this story I wrote back in 2010, Freaking out about NYC sea level rise is easy to do when you don’t pay attention to history
It was about this image:

Turns out it will take about 26,000 years to reach that level.
As I said in the title, the fears of catastrophic CO2 driven sea level rise seem to be little more than a spurious correlation in the minds of alarmists.
I think that climate is influencing ocean levels and, in the same time, oceans are influencing climate. To see a bit from the past century’s sea levels and ocean evolution, you can go to http://www.arctic-warming.com and read a bit about the way the oceans have influenced climate in the past and how they can influence the climate in the future.
I think that the oceans are a part of the climate.
It would be more correct to say that climate is part of the oceans.
That’s good.
He could have just got it peer reviewed on the backscratching merry-go-round.
Credit where credit is due. Such crowd-sourced wisdom can only improve the paper.
It won’t be easy to find anyone to review it. It’s 121 pages and parts of it are plain loony.
Heck, the abstract was loony.
Well the old gentleman is getting on in years now.
“At 11 inches per century, there’s a real problem with Hansen’s claim of sea level rise covering the Westside Highway. He’s betting on acceleration of sea level rise due to increased CO2, but the trend is clearly linear, not exponential.”
There is no trend IN THE DATA.
remember your briggs.
Data have no trends, The data is just the data.
you MANUFACTURE trends by ASSUMING a data generating process. you create trends by “applying”
a model to the data and asking the question ‘does this model fit the data” is this model consistent with the data.
In a nutshell Hansen is arguing this. he is arguing that the data generating process— THE PHYSICS– underlying sea level rise is NOT linear, but rather is non linear.
of course if you look at any exponential rise you can pick out a segment that looks linear, but hansens argument is that the underlying process is non linear and consequently we will see rapid increases
in the future.
You cant argue against this by showing the linear segments. You have to go deeper.
Put another way. the fact that you can fit a linear model to past data tells you ZERO about the future.
you need more argument than that.
all that said.. I dont buy Hansen’s work but it does focus research.
And you need more argument than what you offered. Hansen can’t claim that the underlying process is non-linear without offering evidence to support this claim. This article is showing evidence to the contrary. If Hansen doesn’t like it, then he can offer evidence of his own.
Additionally, the article then goes on to say that, regardless of trend, Hansen has only 13 years for his “adjusted” prediction about the West Side Highway to be accurate.
I find it funny that this is the best thing you can say about Hansen’s preposterous predictions – it focuses research.
Steve,
Your comments are not unreasonable, but many others that worry about AGW often use linear or assumed accelerating temperature and sea level increase projections without any basis from data. There is NO evidence that CO2 is causing a significant portion of any rise the last century (it surely has some effect, but not known, and very likely small), and no significant or unusual rise the present century. Why do you think there is so much worry by CAGW supporters about the “pause”, that makes them try to make it go away. How do you plan to “go deeper” to better understand this issue? Do you trot out models, which have shown no skill. There is no need for, or available “more argument” by skeptics. Future data will tell the story. Hansen’s data and analysis does not focus anything but his opinions.
“There is no need for, or available “more argument” by skeptics. ”
I got more argument. Plenty more.
Just let me know how much you need .
And I suspect I am far from alone.
“You cant argue against this by showing the linear segments. You have to go deeper.
Put another way. the fact that you can fit a linear model to past data tells you ZERO about the future”
We don’t have to argue against anything. The burden of proof is and should be on those who say the future will be different from the past.
Amen brother, amen.
Mosher:
Mosh, I’d like to applaud you for producing a rare reasonable post. Of course, I’d also like to point out the ‘data generating process’ is not physics, but climate models and assumptions used to produce temperature data products. Ideally we would be doing science, but for now we’ll all have to wait.
you MANUFACTURE trends by ASSUMING a data generating process. you create trends by “applying”
a model to the data and asking the question ‘does this model fit the data” is this model consistent with the data.
If you are talking about climate science you have this ass backwards.
You MANUFACTURE data by ASSUMING a model. You build the desired trends into the MODEL. You discard ACTUAL OBSERVATIONS that disagree with the MODEL.
of course if you look at any exponential rise you can pick out a segment that looks linear, but hansens argument is that the underlying process is non linear and consequently we will see rapid increases
in the future.
If it is non-linear you are more likely to see decreases in the future. Otherwise, the system would be inherently unstable. The analogues in classical physics and chemistry are Newton’s Law of Inertia and Le Chatelier’s Principle.
“it does focus research.”
No it doesn’t.. It is so bogus as to be anti any focus what-so-ever.
Even you can’t pretend to sell it !!
The purpose of a “non linear model” is to be able to get a claim accepted or published without having to support it with pesky observations. This way an endless stream of speculative junk science can make it into the literature. If Mosher doesn’t get that, he is being intentionally thick.
Aaahhh, so post quantum, you create the trend by identifying it.
Sorry, the trend is just the trend. You can manipulate it by choosing the start and end points. Everything in between those points is just the data.
When does Hansen suppose this non linear response will be noticeable? It’s always some day in the future. It seems that the levels he predicts would be evident in the data by now. He apparently believed this as well considering his early predictions.
Mosher said
“you MANUFACTURE trends by ASSUMING a data generating process. you create trends by “applying”
a model to the data and asking the question ‘does this model fit the data” is this model consistent with the data.”
When you do so the answer is clear. The data shows NO sign of any acceleration as predicted by the model. The analysed trend line is clearly linear. The test YOU suggest clearly falsifies the theory put forward.
Well when you have evidence that the linear historical model has morphed into a non-linear model, let us know. Until then I think the linear model for future outcomes is a good bet.
Not sure how someone blowing hot air focuses research.
Sorry Steve, while you have good points in theory. In practice, your point would only be valid if this was an insignificant subset of the data such that the change in slope cannot be seen. Given the wide length of time and space of these measurements that seems highly unlikely. So while your points are technically correct, they are non-applicable.
Now, Is is technical PROOF that sea level rise cannot accelerate. No. That’s not possible in the real world.
However, it is a statement that it has not noticably accelerated. Either sea level rise is not accelerating at all or it is happening on such an small scale that it is not apparent.
So either Hansen’s prediction is completely wrong (his mechanism is wrong) or just mostly wrong (it’s orders of magnitude slower than what he is claiming). Personally, I lean towards the second because the foundation seems decent. However, it is horribly wrong to claim that sea level is rapidly accelerating becasuse we can plainly see that it is not.
Look on the bright side.
Increased habitats for marine life & sea birds.
Cant wait to see Al Gore’s new house outside Santa Barbara under water!
From the abstract (Caps mine):
‘We focus attention on the Southern Ocean’s role in affecting atmospheric CO2 amount, WHICH IN TURN IS A TIGHT CONTROL KNOB ON GLOBAL CLIMATE.’
Trouble is, the knob is so ‘tight’ it just won’t turn!
Here is a video that shows ALL of the PSMSL tide gauge data (as of 2009). Maybe I’ll update to the 2015 one of these days, but it won’t make much difference.
https://climatesanity.wordpress.com/2012/01/29/sea-level-data-set-to-music-yeah-thats-right/
You can stand find people in tie-dyed t-shirts carrying signs at a street corner protest who is sure there is an obvious acceleration in sea level rise. Take a look at the video and look for this acceleration. I can’t see it.
This is precisely the kind of material that falls out the end of the digestive tract of large male bovines when zealots take over science and play to the [scientifically] uneducated masses
It is almost as if Hansen wants to discredit the CAGW media campaign by repeating/rehashing outrageous claims.
Dr. James Hansen played the same role in the “CO2-Global-Warming” hype as Dr. Ancel Keys did in the “Saturated-Fat-Heart-Disease” hype, which begins to crumble just now. Watch the following highly interesting analysis of the latter topic and you will find lots of quite striking parallels of these two “zeitgeist” ideologies:
https://youtu.be/nhzV-J1h0do
It is interesting how studies that went against the “consensus” on saturated fats and cholesterol were either ignored or didn’t even get published. It seems that a scientific consensus that forms too soon, before there’s enough data to form a solid conclusion, is very hard to overturn. Even when later studies contradict earlier conclusions, it is usually the new studies that get questioned, not the consensus. History seems to be repeating itself in this regard when it comes to climate change research. So I have to ask, when science advances to the point of being able to study some question or idea, are the first conclusions ever right? Are there any examples where the first scientific consensus was correct right out of the shute? Or does it almost always take years of scientific research to overthrow the early consensus and get it right?
Amen.
Excellent to see someone saying what I have been saying for years.
When I was in graduate school, I wrote a paper on the flaws in the Ancel Keys studies, and several of the studies cited in this presentation, and pointed out their flaws. Particularly, I made a point of drawing attention to the conclusions of the studies, and their lack of correspondence to their own data.
My supervisor was not impressed, and I had my knuckles firmly wrapped.
Besides which, this vindicates my eating at “The Heat Attack Grill”.
But the broader issue here is that this is yet another example of the corruption of science. Whether it be “The Great Global Warming Scam” or the diet/heart disease scam, it is frightening how some “scientists” will suspend ethics and go with the flow in order to get those grants.
How much of what we think is “settled science” is really BS?
Actually, Hanson’s purpose is to get alarmist headlines in the press. It doesn’t matter whether his claims can be supported – it’s just to put the kernel in the public psyche. This is why the advantage in the court of public opinion is always in the warmist camp – particularly with the near total support of the media complex – it only takes a second to make an outrageous accusation, while it may take weeks, months, or years to responsibly disprove it – and the average person doesn’t know the difference anyway. And even if his statements are discredited, all he has to do is simply repeat them – as he is doing now – and you get a whole new batch of headlines.
I couldn’t agree more, unfortunately… 🙁
Sounds like you’re saying that Hansen is the Donald Trump of climate.
Even with the uncertainty factors, a conclusion we can draw from that is that CO2 at present day levels seemed to have no significant effect on sea level rise in that era.
Am I right in thinking that , if sea levels rise significantly, and cover a large enough portion of the land, CO₂ would rise as a result of less being taken up by plant-life?
I would not say that. Evaporation (along with outgasing of CO2) from the oceans would increase, leading to further greening, leading to further decaying, leading to organic CO2 increase. The increase in CO2 due to warming would stay ahead of uptake in CO2 leading to increased greening. Generally speaking, the Earth would be in an increased productive stage.
Probably not, as plankton would increase & sequester more Carbon.
The major flaw in the whole analysis is the assumption that things are driven by CO2 and CO2 alone. The models are far too simplistic. We can not even figure out how total atmospheric CO2 responds to CO2 from burning fossil fuels.
In any complex system, for instance the stock market, there are thousands of factors that interact with each other that may or may not cause changes in stock prices. However, to pick one, such as corporate tax rates and claim that it is the sole determinant of changes in stock prices would be ridiculous.
I do not imagine that the climate system is so simplistic that it can be described by a single factor. We already have ample empirical data that would contradict such a hypothesis.
Bottom line; science must have predictive value. If there is no predictive value, the assumptions are incorrect.
Also, are there not consequences for shouting “fire” in a theatre that is not on fire? Hansen has been doing this a long, long time now.
James Hansen is a Relativistic Chicken Little.
He used to shout:
the sky is falling, the sky is falling
Now he is shouting:
the sea is rising, the sea is rising
There just may be a few of the elite of the political power about to be forced into a change of position on this worlds largest lie.
“We argue that ice sheets in contact with the ocean are vulnerable to non-linear disintegration in response to ocean warming…”
Sorry, but ice in contact with the ocean means it is floating on it.
Even if all of it melts, there will be no rise in sea level.
Donald Trump made just one media comment on “Climate Change” and the ones running for Pres. on both sides ran for cover as they covered up their private parts knowing he is ready to kick them where in hurts.
They all know it is a lie. For sure the Democrats as they invented it, paid for it, gain power with it.
But once one with Trumps money and media savvy takes it on and confronts them all with the truth of the size and danger of the lie. They will see the loss of votes, the loss of power, the loss of office, and then they will cut and run.
Like a bolt of 1,000,000 volt lighting in the top of their heads it will come.
He will most likely use the Earth First, Green Peace, and others to goad the want to be Pres. D’s and R’s to come out in support of Climate Change rules, laws and energy cut backs. Once any of the D[s or R’s come out full or even half way supporting this lie, Trump will bast them out of the deal.
He has the money, the resources and ego to just lay it all on the line.
He and his advisers can see that it will gain him another 10% or more in the polls and they will go for it.
Hansen was just interviewed by Fareed Zakaria on CNN GPS program. The point he made regarding the source of sea level rise is Antarctic melt.
Did anyone keep a copy of his “Boiling oceans” Powerpoint presentation? I can’t find it. Last time I looked, I could find some of the slides, but the boiling oceans ones had been disappeared.
When his former sycophantic media stooges are too embarrassed to cover it, I guess that’s a new low for him.
I read a couple of articles recently by Seth Borenstein on the AP Big Story page and he took a shellacking in the comments section. The paid trolls couldn’t even rescue him. Maybe he’s seeing the light ??
No slides, but clear Hansen video with boiling oceans. http://www.youtube.com/watch?v=1uxfiuKB_R8
Our man in New Zealand , Richard Treadgold, just posted an article regarding that boiling seas quote: http://www.climateconversation.wordshine.co.nz/2015/07/yes-dr-hansen-says-our-oceans-will-boil/comment-page-1/#comment-1351981
From the abstract:
How the f@@k do they know there were ‘extreme’ storms? That’s editorialising rubbish. Hansen couldn’t stick to the facts even if the were attached with super-glue.
There is some geomorphic and paleontological evidence for at least one hurricane (or tsunami) stronger than any during the present interglacial from Jamaica, Bahamas and Bermuda.
However it (or they) occurred during MIS 5a-d, after the end of the interglacial (MIS 5e) when Earth was sinking into an ice-age. Which is only to expected as it is temperature differences that drive storms, and at that time lower latitudes were still warm, while glacial ice was already growing at higher latitudes.
I would suggest that a gigantic flood would be more likely to be caused by an earthquake induced tsunami than a hurricane. In other words, nothing to do with weather or climate.
And there is the rub..
Higher sea levels, extreme weather.. assumed..
BUT THER WAS LOWER CO2 !!!
Hansen and always has been a zealot and an extremist and his logic is impaired by it. It’s embarrassing and astounding that this man was put in charge of anything let alone GISS. But the politically motivated will always cover the buts of the terminally wrong to forward their agenda. Just as FDR deepened and worsened the depression and who’s policies prevented a recovery, but is considered a hero still today, Hansen will never change his view, no matter the evidence presented to him and his acolytes will continue to quote his rubbish. He is no different than the other lunatic standing in the street with a sandwich board proclaiming that the end is near.
Yes, Paul Ehrlich is a good example of someone who has been wrong for nearly 50 years but is still ‘revered’ as a some kind of ‘guru’. The left are deluded.
When “missing heat” Trenberth distances himself, its a clear sign Hansen has jumped the shark– just like Wadhams has. Their predictions have failed and are subject to increasing derision. The increasingly irrational desperation (remanufactured ocean data, bumblebees, this absurd paper) is an unexpected benefit of the run up to the looming Paris failure. Even the Pope gambit is backfiring, as Cardinal Pell has commented.
The original Hansen claim was CAGW accelerated SLR. It didn’t. Essay Pseudoprecision. So warmunist fear mongering morphed to abrupt future SLR from ice sheet collapse. But Greenland’s geology prevents it, EAIS is stable and gaining mass, in WAIS both Ronne and Ross (ANDRIL program) proved stable. RIgnot (Hansen’s co-author here from NASA JPL) turned attention to the Amundsen Embayment and PIG, raising alarm last year. He and NASA JPL previously estimated that if the entire Amundsen Catchment basin ice was lost, it would result in about 1.2 meters (4 feet) of SLR. Despite the NASA PIG alarm PR, Rignot’s 2014 PIG paper actually surveyed the entire catchment. The interior half is fairly stable, and a portion is even gaining mass. Essay Tipping Points in ebook Blowing Smoke has all these details.
The two papers attempting to show abrupt SLR during the Eemian (MI5e) are geologically flawed; the one from Australia also contains proven academic misconduct. Essay By Land or By Sea.
The Westside Highway was demolished in 1989, the one you see today is not the one that existed at the time of that interview.
Did they elevate it higher above sea level or just widen/improve it? Or both?
I don’t know new York but there’s a good description here of the road changes. I don’t know of it affects the specific piece under review
https://en.m.wikipedia.org/wiki/West_Side_Highway
Tonyb
The old one was approved in 1927, construction began in 1928, closed in 1973, demolished in 1989. It was called the West Side Elevated Highway, and was 6.1 meters above the ground level to allow truck access to the docks along the river. If referring to it, Hansen was even more wrong than the post calculations would indicate.
Anthony, the West Side Highway is elevated above the elevation you show in your picture. You are showing the highway in the area of 42nd Street – which is at ground level. The elevated portion of the highway starts around 60th Street. The GISS offices are on 112th Street. So, it can certainly be argued that sea level rise would need to be even higher than what you are estimating in order to cause a traffic problem around 112th Street – depending on when that section was actually elevated.
I should have started out saying, “…a portion of the West Side Highway is elevated above…”
GISS offices are at the corner of 2880 Broadway and 112th. If that’s where Hansen works then he was looking at the Henry Hudson Parkway, not the Westside Highway.
According to Google Earth, the parkway at that point is 13 feet above sea level. There’s a bike path between the parkway and the river.
http://www.biking-in-manhattan.com/uws2/IMG_1391wh224-HudPath108.jpg
Source for above image:
http://www.biking-in-manhattan.com/u210-96125green.htm
Phil. injected just enough information to cloud the issue. Skillful.
Is the new one higher or lower than the old one?
The Highway at 112th street was not demolished. It was and is not elevated. It’s presumed to be about 10 feet above water level, but that’s a guess. I’ve e-mailed both Hansen and the nyc Highway or Transportation dept. for the data, but neither has responded.
If the rubble was dumped into the ocean then Hansen was correct!
When “the land is sinking” is mentioned as a factor in local sea level rise I’ll listen to what the alarmists have to say. It will be a cold day in hell when they mention any of the 20 other factors affecting local sea level change. Why is it only skeptics know It’s a lot more complicated than increased ocean volume?
Hansen has been on the outside looking in since he rejected wind and solar renewable energy strategy in favour of nuclear. He’s right about the strategy in that nuclear is the only real way to decarbonize our electricity use, but it’s off message.
The fact he’s being shunned can tell you a lot of who the masters of the movement are, and what their goals are. Hansen’s comments about nuclear threatens their subsidy gravy train.
FOLLOW THE MONEY. Excellent read is “CRAPITALISM” Liberals Who Make Millions Swiping Your Tax Dollars, by Jason Mattera NY Times Bestseller read in a couple of nights—compelling available at Amazon about $15. Jason also wrote OBAMA ZOMBIES–haven’t read.
CAGW is the perfect refuge for rogues and nut cases of every persuasion.
Fear, Greed and Fame fuelled by a potentially unending money supply by tapping into new taxation resources.
It makes “reds under the beds” AKA the cold war and “the war on terror” pale into insignificance as a form of political control.
Bringing down this wall will require constant and continued effort from sane minded individuals united in their contempt for this “fear game”.
Keep up the good work, I reckon we are reaching a real “tipping point” in the wholesale rejection of this odious game..
I think we should be more concerned about sharknados. Supposedly there was a third one last week (once is accident, twice is coincidence…).
Right on! And because of Sharknados, I’ve suddenly come to fear Prognados, like when Progs all jump the shark, then have to ride it out in a Sharknado of unprecedented power! Or we’ve all seen when some Progs gather to attack, say, Capitalism then run around screeching like rabid Parrots, while managing to give true rabid Parrots a bad name. But if they all mass together, it’ll be worse than we ever thought!
Let’s have fun!
Dr. Hansen: Let’s assume a multi-meter rise in sea level accompanied by “Mega Storms” will happen.
Would you please rush to President Obama and ask that the spent Uranium rods be moved to Yucca Mountain, before it’s too late. These rods are still have 10% to 15% hot stuff in them.
You can remind him that the Washington Court of Appeals issued a rare Writ of Mandamus ordering the President to follow the law. We were taxed more than $10B for the construction. The good citizens of South Carolina and Washington led the suit. They agreed to let their land be used to develop nuclear weapons as well as nuclear energy. Here in Delaware, we are within 80 miles of two tidal influenced nuclear sites. Heading north, the most densely populated portion of our country are at risk.
So, Dr. Hansen: move that Uranium. Go get them!
http://legalinsurrection.com/2013/08/d-c-circuit-obama-cant-ignore-legislation-just-because-he-doesnt-like-the-policy/
PS. Attorney & Professor W1ll1am Jacobson’s “Legal Insurrection blog is a great resource for lay folks like me.
Regards,
Actually, Hansen should’ve qualified “crime” with “violent,” in which case there have been studies that show a relationship. So let’s look at the trend in violent crime…
The rate has fallen every year since at least 1994, the earliest year for readily accessible FBI data, and the 2013 figure was about half the 1994 rate.
By Hansen’s reckoning, summers in the U.S. must be getting colder.
… or more people have AC.
… or more people have AC.
Irrelevant to Hansen’s reckoning.
The trend in Jun–Aug high temperatures in Central Park from 1989–2014 is −0.3°F. Record high was July 3, 1966.
Correction: trend is −0.-0.3°F per decade.
One more try: −0.3°F per decade
Personally I think Trenberth is pretty rational about the climate. His “missing heat” is missing — it hasn’t appeared as warming, it has disappeared into the deep ocean. If true (open to discussion, but in Trenberth’s case I really think it is honest discussion) it’s great news. The deep ocean can warm by 0.001 or 0.002 C/year for a long time before it is an issue. As Bob points out repeatedly, the warming trend in SSTs is underwhelming, and the atmosphere and land surface temperatures are in some way tied to that.
Hansen, OTOH, IMO long ago lost any semblance of scientific objectivity. If there is one single person to blame for the entire climate “catastrophe” meme, it is him. Five meter SLR, increased drought and flood and storm all at the same time, boiling oceans — there is no horrific picture, no matter how irrational or extreme, that he has not invoked to push his personal fantasy of disaster onto a hapless world. And nobody in the mainstream media ever calls him on it.
Even now he’s not being called on it. They’re just ignoring him as an embarrassment and hoping nobody notices. Hansen is to the (legitimate) warmist case as Dragonslayer are to the (legitimate) skeptical case.
rgb
I cannot cede your position on Trenberth. In regards to the Boston snow he was quoted at WaPo as saying:
“Heavy snows mean the temperature is just below freezing, any cooler and the amount would be a lot less,” adds Kevin Trenberth, a climate expert at the National Center for Atmospheric Research. “Warmer waters off the coast help elevate winter temperatures and contribute to the greater snow amounts. This is how global warming plays a role.”
This is patently false. The snow was the result of extremely cold conditions which resulted in amplification. Boston meteorologists melted the snow to determine its water content and found the moisture content to be mundane. It was the cold PERIOD. To claim otherwise is either propaganda or incompetence.
http://www.washingtonpost.com/news/energy-environment/wp/2015/02/10/what-the-massive-snowfall-in-boston-tells-us-about-global-warming/
“It was the cold PERIOD. To claim otherwise is either propaganda or incompetence.”
I go with propaganda. Trenberth is not an incompetent man, it is that he has only a nodding acquaintance with ethical behavior.
I would concur that it was propaganda, as Michael Mann contributed a quote about the SST around Cape Cod being 21 degrees F above the anomaly and not providing a scientific rationale for that – he just let it be implied that the warmer waters were due to an extra CO2 molecule per 10k atmospheric molecules.
http://www.myfoxtwincities.com/story/24167100/wet-snow-vs-dry-snow-there-is-a-difference
If we are to expect that this basic fact about snowfall characteristics is outside the skills and knowledge of a “climate expert” at the National Center for Atmospheric Research and lead author for the IPCC, it raises questions about the entire climate science field.
Where’s he get 15 co-authors for this drivel?
Good afternoon Professor Brown,
“Hiding in the deep ocean.” and, “open to discussion.”
The discussion needs a good starting point. How do you explain the heat taking the plunge? Trenberth’s efforts leave me cold. It is very difficult for me to accept that the themohaline circulation is capable of transferring that amount of heat, particularly with the ice extents around Antarctica in recent years. Also, you believe in the Second Law, so you’re not susceptible to the type of reasoning that led Professor Trewhall to predict that the heat would bob up from the ocean deep, and melt Antarctica in 10 years. You have a way with explanations, so would you like to give it a try?
Eda, +10. A further observation. ARGO did not detect Trenberth’s missing heat before it snuck into those thermodynamic depths from which it could never emerge anyway. That leaves two logical possibilities. ARGO is so sparse as to be useless catching those sneaky Trenberth decending heat vortices (so useless generally?). Or Trenberth was just stupidly wrong. A layman’s jury suffices to decide this question beyond any reasonable doubt.
Hell Trenberth has no good reason to assert that we even know the heat is missing. We do not have the accuracy to assert that as a fact. It is likely gone to space.
Ristvan,
With respect to Argo being usless … no. Argo will be able to tell us where the “backwaters” and the “eddies” are because the majority of the instruments will end up in these areas.
Argo will be able to tell us the approximate temps of these areas.
Question is, will the collected data be extrapolated appropriately when it then used for its intended purpose.
“He uses statistics as a drunken man uses lamp-posts… for support rather than illumination.”
― Andrew Lang
Hansen really let it all hang out when he preached that increasing CO2 from burning fossil fuels, carried in boxcars to the incinerator, would bring about “the destruction of Creation!” I liked the sound of it so much, I didn’t know whether to say Amen, BS, or Sig Heil!
With the comments like Trenberth and Mann, Hansen et al. must be saying, “Et tu, Brute?”
After all Hansen et al. give the “dagger” for their slaying in the lead sentence of paragraph 2.1: “Eemian sea level is of special interest because Eemian climate was at most ∼2◦C warmer than pre-industrial climate, thus at most ∼1◦C warmer than today.”
Ah Ha! Since the Eamian, global temperatures have decreased (a decreasing, i.e. cooling trend)! The 150 year statistical anomaly of +0.6 ◦C, which has such a great uncertainty as to render the “+” as moot and unfounded, means their supposition of a +2 ◦C, by humanity, is a fantasy. The Earth is cooling and there is no God to save them; not even the UN or the Vatican.
Perhaps it was Hansen’s death wish to put the dagger in his paper. Now, the public assassinations will begin as in the Roman Senate, lead by Marcus Junius Brutus, during the Roman Optimum.
On the floor with his life bleeding away, Hansen might look to Trenberth and Mann and say, “How could you! I made YOU what YOU are! Your careers belong to ME!”
Ha ha What Fun!
wait … If NYC is flooded, where will all those hipsters and intellectuals go?
Gaia … no!
oh the humanity!
climate change must be stopped at all cost!
“if you are going to San.. Fran.. Cisco..”
Brooklyn Heights?
In this paper
http://www.columbia.edu/~jeh1/mailings/2011/20110118_MilankovicPaper.pdf
by Dr. Hansen from a few years back, he claims that five meters of sea level rise is possible by the end of the century. See figure 7. If you follow his reasoning then, it comes to a millimeter per day by 2100.
The man has no shame when it comes to making stuff up. He never learned the lesson from Dr. Seuss and his “And to Think That I Saw It on Mulberry Street” tale.
http://covers.booktopia.com.au/big/9780007169924/and-to-think-that-i-saw-it-on-mulberry-street.jpg
https://mrshenson.files.wordpress.com/2010/11/mullberry-street.pdf
This is the last sentence of his abstract. And this is precisely where he departs from any pretense of scientific objectivity. This isn’t about the science. This is about saving mankind! He doesn’t even address the question of whether, or how much, CO_2 causes warming. In his own mind that isn’t even a suitable matter for discussion. It is given. It is a simple fact. He then goes off on a tangent about “reaching the Holocene optimum” temperature (unproven, and frankly unprovable) and how we will any day now trigger runaway positive feedback warming, the long awaited “collapse of the ice sheets” with strong positive feedback.
Hansen has been unable to separate his own opinion from science pretty much from the beginning. He decided — personally — that we were en route to a catastrophe thirty odd years ago. He has subsequently and without hesitation advanced any claim, no matter how extreme, to force the rest of the world to act on his own personal judgment. If Feynman’s cargo cult talk laid out the case and nature of scientific honesty — the need to clearly state all the reasons to doubt your own conclusions, the places where your argument is uncertain, the places where there is no real evidence to support them — Hansen has been the world’s poster child for scientific dishonesty. He repeatedly states things as simple fact that are, in fact, the result of a tangled web of unproven (and often overtly contradicted) hypotheses, and uses them to conclude that we are doomed unless we decarbonize, literally at all costs. He would — as far as I can tell — cheerfully condemn the poorest people in the word to fifty more years of 18th century poverty if that’s what it takes to decarbonize “rapidly”. If ten, fifty, or a hundred million of them die needlessly as direct or indirect consequences of this poverty, what does it matter? It’s all about preserving the planet, and humans if anything are part of the plague upon it.
And this is who ran NASA GISS for what, almost thirty years! With this utter lack of objectivity, with the gall to insert a purely political statement into a scientific abstract, with his utter willingness to hide any uncertainty whatsoever from his presentation and present it as revealed truth not subject to any sort of scrutiny or question or possible error, is there any reason to doubt that his beliefs and opinions influenced absolutely everything from his hiring practices to his expectations concerning the “results” obtained by his subordinates for his entire tenure at NASA?
We might as well install a born-again young-earth biblical literalist as the head of the NSF, and a Jehovah’s Witness as the head of NIH. What could go wrong?
rgb
and, from your quote choice, has not contemporary civilization been developed through fossil fuels?
The Earth is not Venus. Ridiculous zealotry by Dr. Hansen. But instead of kicking him out of the NAS, they’re making another zealot their president. Sad. Lysenko plus Goebbels with social media to spread, encourage and enforce. Truth (and science) be damned. But it plays so well into the politicians’ needs. As Mencken said, “The whole aim of practical politics is to keep the populace alarmed (and hence clamorous to be led to safety) by menacing it with an endless series of hobgoblins, all of them imaginary.”
“born-again young-earth biblical literalist as the head of NSF”
Hmmm, Forest Mims would probably make a dandy head of the NSF – though I don’t think he is a young-earther.
As McIntyre says, a “Jor-El” complex.
How stupid is to visualise 20 feet sea level rise and have water in streets? So for 100 years, everybody will just watch, and do nothing? Nobody will increase land level in lowest parts of the city?
“Do you get the impression, as I do, that the staff gathers in a room and decides what the results should be, and then tortures the model (or just uses fudge factors) until they get to the results that they were determined to achieve? Why bother with extensive, complicated models if you are just going to manipulate the results,” Stanley wrote. “Because the model provides at least the illusion of rigor and objectivity.”
This relates to the Fed and its Models. You can just substitute Global Warming wherever appropriate
http://www.marketwatch.com/story/here-are-the-staff-forecasts-that-the-fed-accidentally-leaked-2015-07-24?dist=afterbell
Serious question for James Hanson: How do you know that slightly warmer waters around land based ice sheets won’t actually lead to lower sea levels due to higher deposition over land? What if a moderate warming helps sea levels to fall? It’s SO DAMN cold over Antarctica, the world’s largest desert, that at the edges, a little extra heat might mean a bit more transport of water vapor into the inner continent, to places where it will fall as snow and be practically sequestered for a very long time. Is it a ridiculous question?
In any case, I think the main body of the world’s ice, the East Antarctica ice sheet, will not melt until plate tectonics moves the Antarctic continent away from the Southern pole.
Hansen isn’t stupid, and yet persists with this somewhat more tolerable nonsense. The CO2 gas may do something, but must be so minute that in practice makes no difference, since no one has yet conclusively proved its responsibility for the temperature rise, but hey, the geomagnetic field can and does move small chunk of magnetised steel.
I look at data for fun of it, often nothing better to do, find a correlation (real or spurious) plot a graph and tell ‘the world’ about it.
Do I believe in it, not in the slightest, but keeps brain cells working. I suppose people like Hansen, Mann, and co, know they are selling us a ‘dud’ but they have built their carriers on falls assumptions, and now it is too late and would be too costly to their reputations and pockets (possible legal consequences ?) to get out of the mess they created.
Hansen the cherry proxy picker? Why is one better than the other?
“There is evidence of ice melt, sea level rise to +5–9 m, and extreme storms in the prior interglacial period that was less than 1 °C warmer than today”
Remember Earth’s temperatures actually have to rise 1 c for this claim, not manufactured warming only caused by the result of adjustments to data.
Hanson’s main claim is based on proxies that he cherry picks for the sea level rise, but completely ignores them for the no temperature effect and CO2 cause correlation. Where temperature is the cause, rules and CO2 the effect and is just the passenger. The Earths temperature has never relied on the amount of CO2 in it’s atmosphere. The Earth has varied between 180 ppm and 7000 ppm CO2 over hundreds millions of years with temperatures between 12 c and 22 c. Almost any combination of these have occurred during this time.
A +5-9 m rise certainly relies on the Greenland Ice sheet and/or Antarctica melting considerably in such a short period. Evidence for both claims are greatly against with Antarctica far too cold, having increased sea ice and Greenland mass balance significantly gaining in larger areas than significant losses around some coasts.
Maybe Hansen is still hoping for a comet or super volcano to suddenly hit western Antarctica to achieve his view.
I first wanted to note that the last Eemian interglacial was about +2.25C higher than the today according to the ice core record (the only one we have). Hansen’s claim of +1.0C is just fake made-up garbage (which is all he ever does when the paleoclimate is in question).
On the second paper about sea level in the Pliocene, the values are just straight-up cherrypicking.
Here are the CO2 and sea level estimates over the last 8 million years. A person could quote any sea level number between +/- 50 metres in the Pliocene depending on the date. CO2 appears to have nothing to do with it.
http://s23.postimg.org/q98x9m34b/CO2_and_Sea_Level_Last_8_Mys.png
If I was a climate “scientist” I would start to worry. Now that the IPCC models are proving to be garbage and the temperatures look to be headed for an extended cooling period, the knives are sure to come out. Michael Mann who has the most to hide will be eager to throw Hansen under the bus to throw the scent off. I’m pretty sure once the congressional investigations begin the number of climate “scientists” point the finger at other climate”scientists” will increase. If it looks like a Republican is going to win the election it will turn into an outright purge. The Guilty Flee When No One Pursues. Climate “scientists” know what they have to hide, and they know they have done wrong, so their guilt will make them act in very paranoid ways. Michael Mann is classic. Why else would they avoid debates and releasing data? That is so uncharacteristic for a real science.
Gotta love little Jimmy…
Hansen has obviously never read Aesop’s Fables…..
http://i57.tinypic.com/mvj5gi.jpg
Ralph
Should Chicken Little be in there somewhere?
Hansen has always had a far greater need for attention than for science or facts, that from where I sit is pathological.
I suspect that part of “cold shoulder” has to do with the fact that they don’t want to call attention to just how wrong he was back when the CAGW ball started rolling.
What he claimed then got headlines. His hand on the adjustment knob then was useful.
But now?
So, predictions falsified. Now to falsify the Greenhouse Effect hypothesis once and for all!
They’ll get there,…. 🙂
Hansen come out pushing for nuclear as the solution, at least as a stop-gap until renewables took over. That might’ve done him in with some of the other activists in his field.
All of these reports talk about mean sea level as if that was what mattered, but where flooding is concerned it’s the peak tide level that matters. Who cares what the average seal level is? What we want to know, is will it come over the dykes within the next twelve hours?
Now, tidal ranges vary from place to place and with time of year, but in the UK they are typically 3-4 metres. Which, is about a thousand times the annual sea level rise. Then, any sea defences have to be high enough to cope with waves as well as tide, so they will be significantly higher than the highest expected tide. That, I think, puts the microscopic nature of this nonsense into perspective better than anything else.
Professor Humlum’s ‘Oceans’ page has a series of sea level trend charts dating back a century or so, all of which seem to be linear e.g:
http://www.climate4you.com/images/Sydney-NEW.gif
I expect the exponential flume on the IPCC predictions to continue to shift along with each successive report.
As I have mentioned before, the IPCC possess the ACME™ goal post mover.
insert a small section of every viewpoint regarding the climate debate in the volumes of beurocratese of the IPCC reports.Then you can then refer back to any speficic, tiny, vague morsel and claim you covered it thoroughly. Never actually having done so. Like having an “easy” button to attempt to dismiss.
I encourage those who haven’t, to try to read at least AR4. You can skip the summary for policymakers (SPM).
In other words, lots of people have claimed lots of things would happen unless something is controlled that caused whatever it is you want controlled. Discard whatever was claimed that doesn’t advance the the desire to control. Sometimes that means discarding the “claimers”.
Cherry picking at its finest.
If NASA had to employ and use such kind of Hansenian maths, physics and science in the Mars Rover missions, would be hard to believe that NASA will even have managed to have a Robot built in the first place, let alone the ability to deliver it from Earth to Mars and expect it to function properly.
Under such Hansenian.rubbish, the best expected in delivery systems would have been the delivery of a robot from the White House’s lawn to the W.H. gate………. with a lot of luck and hand-pushing and shoveling around.
cheers
Perhaps Hansen’s math’s will facilitate the prime directive for NASA from Obama, by making Muslim’s feel good about themselves. After all, the Middle east’s best math, borrowed from India, must look great in comparison.
Ah yes, but according to the models future robots are projected to be the hottest funkiest evah. Any screws that appear to be loose now are clearly outliers, and thus merely sensory illusions. Thus we should make as many of them now as possible, since there is overwhelming evidence that in the future children will not know what loose screws are.
Robots and climate models designed based Hansonian logic.
Reminded me of this old movie of robots designed to ‘help us’. (No, Yul’s character was not named “Sonny”.
When you have lost that moron Seth Borenstein on climate propaganda, you have really lost it. However I expect a quick call from the White House science adviser will soon change Seth’s mind.
Quite credible I would say! https://twitter.com/SimonFili/status/625406440006680577
But the West Side Highway probably is underwater. Or chunks of it, anyway. They tore it all out ages ago. Dr. Hansen is probably right. (Not about sea level, of course.)
I thought that they simply moved the West Side Highway inland a hundred meters or so between 52nd Street and 43rd Street to make room for the cruise ship terminals and docks. I have no idea what they did with the dirt. Probably used it for fill someplace else in the city.
The West Side Highway was supposed to be underwater by now, not due to sea level rise, but because it was planned to be put in an underwater tunnel. The original highway was a viaduct that ran overhead the current surface boulevard, and was torn down in 1989.
Reblogged this on kingbum78's Blog and commented:
Wow…Hansen just makes me sick there isn’t any other way I can put it..the feeding us lies for years upon years…ugh
Greetings from Seaotu.
Love,
Jimmy H.
[snip another unwelcome sockpuppet rant from Doug Cotton, who is banned. what will it take to convince the thickheaded Mr. Cotton that he’s unwelcome here? -mod]
I do not get any of the abstract…
========================================================
“Our climate model exposes amplifying feedbacks in the Southern Ocean that slow Antarctic bottom water formation and increase ocean temperature near ice shelf grounding lines, while cooling the surface ocean and increasing sea ice cover and water column stability. ”
========================================================
Antarctic bottom water is formed by the sea ice, thus more sea ice should equal more bottom water.
From wik “Surface water is enriched in salt from sea ice formation. Due to its increased density, it flows down the Antarctic continental margin and continues north along the bottom” Apparently the surface water, now more saline, is further cooled by high winds from the continent, then sinks.
Therefore an increase in sea ice should INCREASE the amount of bottom water via a greater increase in saline water, UNLESS there is a major reduction in Antarctic continental winds; apparently all caused by CO2. Is this MODELD reduction the mechanism by which the “model exposes amplifying feedbacks in the Southern Ocean that slow Antarctic bottom water formation.”?
The abstract continues;;;
—————————————————————————-
“Our climate model exposes amplifying feedbacks in the Southern Ocean that slow Antarctic bottom water formation and increase ocean temperature near ice shelf grounding lines, while cooling the surface ocean and increasing sea ice cover and water column stability.”
——————————————————————————–
Hum? Would have been nice to know what feedbacks increase ice (observations) INCREASE ocean T near ice shelf grounding lines, while DECREASING the rest of the ocean surface.
The abstract continues…
=========================================
“Ocean surface cooling, in the North Atlantic as well as the Southern Ocean, increases tropospheric horizontal temperature gradients, eddy kinetic energy and baroclinicity, which drive more powerful storms”
============================================
I am curious how cooler polar oceans increase horizontal troposphere temperature gradients. There is substantial evidence that colder global Temperatures drive more powerful storms.
Apparently the magic molecule is cooling the North Atlantic and Southern oceans, and warming the water next to the ice shelves, while decreasing the Antarctic winds that blow over an increase in forming sea ice causing bottom water, reducing bottom water while increasing the ferocity of global storms.
What did I miss?
Hansen and 16 co-authors. What is it that Willis says about the number of authors a paper has?
I bet he is chewing nails! Here is a reminder of who they are.
“Hansen, J., Sato, M., Hearty, P., Ruedy, R., Kelley, M., Masson-Delmotte, V., Russell, G., Tselioudis, G., Cao, J., Rignot, E., Velicogna, I., Kandiano, E., von Schuckmann, K., Kharecha, P., Legrande, A. N., Bauer, M., and Lo, K.-W.”
Maybe they ARE the 97%….
Given some information about the buildings in the picture of New York, and the average rates of ocean change that are shown in this article, I’m predicting that the Atlantic Ocean will reach those levels in the year 22,451 AD.
…in the year 22,451 AD, about the time Charlton Heston walks along the beach there with some babe while being chased by some monkeys.
[my emphasis]
Really! I just assumed that the charge that Alarmists claimed CO2 was the “control knob” for the Earth’s climate was a quick shorthand to characterize a ridiculous position. But here’s the infamous Hansen, putting it in black and white. It’s not a scurrilous slander at all—he actually believes it!
Professor Brown, rgbatduke is being too kind.
/Mr Lynn
I feel sorry for him as he needs to see a shrink very urgently before the men in white coats lock him up
Learning is a wonderful thing. I had no idea the statue of liberty was perched on a terminal moraine.
Dear old James Hansen,
Perhaps a charlatan of note?
His ranting on climate
He appears to learn them by rote,
By his own beliefs indoctrinated,
Completely radicalised,
So by his new proclamations
Why are we surprised?
http://rhymeafterrhyme.net/computer-models/
Nonsense remains nonsense, even if it is printed on Hansen’s best hand-made paper.
Hansen and his “et al’s” aren’t even worth their ‘grant’-ed money as fictionaires. They might be OK as distortionists in some goon show, but…the goons wouldn’t want him.
Hansen`s et als are only useful idiots
We are lucky to have oceans; if the comets that collided with us had been a bit smaller we would be really struggling.
“According to the actual data, after 27 years, we’ve seen about a 2.6 inch rise. There’ s still a very long way to go to ten feet to cover the West Side Highway there.”
I think people are being too hard on Hanson, his prediction for the West Side Highway based on current data puts him off by only about 1,250 years. Like we use to say in the consulting biz, that level of accuracy is “good enough for government work”.
The argument put forth by some that past linear sea rise does not mean future sea rise could become non-linear is unfortunately bankrupt of any evidence.
If I recall the IPCC scriptures correctly, a large component of sea level rise is thought to be thermal expansion of the oceans as warmer air warms the sea surface and the higher temperatures work their way ever deeper. I believe that it is also written there that that is a slow process requiring centuries, not decades. The 85 years remaining in the century hardly seem adequate for much thermal expansion. Could it be possible that Dr Hansen is not familiar with the basic tenants of his faith?
The failure of Hansen’s forecast is worse than you realize. At the time he made his original prediction, the West Side Highway was still an elevated viaduct along its entire length, requiring another 15′-20′ of sea level rise to submerge it.
‘Course, most of the viaduct was torn down in 1989 because it was collapsing on its own.
Also, plans to put the WSH in a tunnel under the Hudson were scuttled in the 80’s.
As I know from having driven it, it was NOT elevated above midtown. At 112th stree it was probably only five feet above the Hudson. (The Hudson rarely rises more than a foot or two.) It would advance the discussion if someone at Columbia would go and measure its elevation, even by eyeball, or just take a photo.
The science has failed. All that is left is intimidation. The Dutch capitulate:
http://www.climatecentral.org/news/should-countries-protect-citizens-climate-change-19270
Here’s my reply to the Hansens of the world and their apocalyptic bleatings: You First!
If the future is that tenuous, if CO2 is that dangerous, let us see you and your cohorts lead the way.
Let us see AlGore divest himself of his multiple “carbon footprint heavy” residences. Same with the Tom Steyers of the world.
Let us see all those “green” champions give up their private jets and fleets of gas guzzling automobiles.
Let us see the participants of all of these moronic conferences held all over the world, where combatting the horrors of climate future to come is cussed and discussed, use video conferencing technology and shelve their jets for all time.
In other words….when YOU act like it’s an imminent catastrophe, maybe, just maybe, we’ll listen, and maybe, just maybe, you’d have a little more legitimacy. (Nah…probably not)
So, the ball is in your court apocalyptos. Care to put your money where your mouth is?
Another approach would be to require them to bet 10% of their income every year on the RSS temperature, say, 10 years from the bet. If they are low or hit the number, pay them a 100% return. If they are high, they lose the money and it gets donated to, say, Heartland. Oh, and they have to publish their prediction when they place the bet.
Exponential projections of linear trends will seem a lot dicier when their, not our, money is on the line.
Pachuri Update:
http://wap.business-standard.com/article/current-affairs/pachauri-accused-of-sexual-harassment-sacked-as-teri-chief-115072301020_1.html
Pachauri ceases to be Teri chief
Nitin Sethi | New Delhi Jul 24, 2015 12:40 AM IST
Accused of sexual harassment of a colleague, R K Pachauri ceased to be chief of The Energy and Resources Institute (Teri), within days of resuming work after a court order had allowed him to physically attend the organisation’s offices. The environmental group’s governing council, meeting in Bengaluru on Thursday, announced that Pachauri would be replaced by Ajay Mathur, who is at present the director-general of the Bureau of Energy Efficiency under the power ministry.
Pachauri, who had proceeded on leave when the news of complaint broke out, in a sudden turn of events, took back charge again at the helm of Teri on July 17. But on Thursday, the governing council of Teri, which includes prominent names such as Naina Lal Kidwai, Kiran-Mazumdar Shaw and Deepak Parekh, met at Bengaluru to conclude that Mathur would replace Pachauri.
Business Standard also reviewed letters written by senior lawyer Vrinda Grover to the Delhi Police commissioner, pointing out that two former employees of Teri, too, wanted to give written complaints of sexual harassment against Pachauri but the police had for months not recorded their statements. She noted that she had repeatedly requested the Delhi Police over months to record their statements in confidentiality but the police had not acted upon the pleas of the two complainants. The letters date to March and April of this year…
26,000 years is fairly close to the amount of time it will take for the celestial pole to make a full circuit of the circumpolar stars. In simpler terms, in that time the spring equinox will migrate through an entire year.
James Hansen (and subsequently the whole AGW crowd) originally applied an algorithm which added back radiation to solar radiation (treating each the same) and used it in Stefan-Boltzmann calculations, showing that 390W/m^2 yields a black body temperature of 288K which is about 15°C, thought to be the mean surface temperature for the whole globe.
But nature always treats every single pencil of radiation such that it obeys the Second Law of Thermodynamics and some of the electro-magnetic energy is only converted to thermal (kinetic) energy in a target that has a lower Planck curve than the effective Planck curve of the source after any attenuation due to distance, reflection or absorption. The Sun’s mean effective radiation is like that of an extremely close black body that is at a very cold -41°C and Hansen realized its direct radiation to the surface could never explain the surface temperature. Such is even more obvious on Venus. Even at Earth’s Equator the mean solar radiation over 24 hours is only around 214W/m^2 for which the black body temperature is about -25°C.
Now, if you calculate a mean temperature using Hansen’s algorithm of adding back radiation into the calculations, then it is implicit that you are applying that algorithm to every location on the globe and determining a mean of all the temperatures thus calculated. You can see that the algorithm is incorrect, because there are regions on the planet which, on a clear day at noon in the tropics, receive over 800W/m^2 – maybe even 1,000W/m^2 of direct solar radiation. If you then add back radiation (probably far greater than the mean of 324W/m^2 in these locations) you get totally unrealistic temperatures often over 90°C. So it’s obviously wrong to do so, and physics confirms this.
Hence, because you can’t add back radiation you can’t deduce that the back radiation from increasing levels of carbon dioxide will cause warming. Furthermore, you have to go looking for a completely different algorithm – a wholly different paradigm, and you find that when you come to understand the process of entropy maximization, which is what the Second Law of Thermodynamics is all about.
Whilst we have to admit that the Sun’s direct radiation into the surfaces of planets like Earth and Venus is obviously insufficient to explain the observed temperatures, we do know that these planetary surfaces rise in temperature on the sunlit side and inevitably cool a little on the dark side. So we can deduce that the warming has something to do with the Sun.
However, for a temperature to rise there must be a net gain of mean molecular kinetic energy, which we will refer to as thermal energy. This can, and does come mostly via molecular collisions between the atmospheric molecules and the solid surface molecules.
But where does the new energy come from in the first place?
When we apply Stefan-Boltzmann calculations we see that the Sun’s direct radiation can usually only raise the temperature of IR-absorbing molecules in the upper atmosphere where the temperatures are low enough for this to happen.
In school-boy physics you probably learnt that heat only transfers from warmer sources to cooler targets. So you will be surprised to learn that there are exceptions to this rule when there is an external force field like gravity. That is because the Second Law of Thermodynamics is really about entropy maximization, and entropy changes when molecular gravitational potential energy changes.
This process has been described in recent publications like “Why It’s Not Carbon Dioxide After All” and there’s not space to elaborate here, save to say that this is indeed the new paradigm that James Hansen was not experienced enough to even contemplate
“So you will be surprised to learn that there are exceptions to this rule when there is an external force field like gravity.”
>>>>>>>>>>>>>>>>>>>>>>>>>
Wow, this guy invented his own physics all by himself!
After reading the observations of Kevin Trenberth, I doubt any sensible Journal publish such a hypothetical exercise as a scientific paper. Before going in to hypothetical exercise they should have looked in to two aspects — the natural impact on sea level rise and sea level rise associated with the global warming; and why there are differences in observed sea level changes [raise over some parts and fall in some parts] and look at some observational sites like San Francisco Airport and Roman Piscinos along the coast to understand the realistic change if any in sea levels. Without any such study simply dumping hypothetical study has no significance. Also, natural variability component play an important role in such studies. Finally, they should present their equation along with the constants that relates the global temperature rise in association with anthropogenic greenhouse gases under greenhouse effect — and its share in global temperature rise that include local and regional components. Without this, there is no use of talking temperature 2 oC or more and thus rise in sea levels in logical paleoclimate terms. The feedback sum – sensitivity factor is monotonically declining from SAR to AR5 [IPCC’s]. This may further decline in AR6, AR7, etc and thus change in temperature with increasing CO2 may reach a plateau like in ‘b’ that was given in below reference — figure 1, ‘a’ relates to naturally existing CO2 in the atmosphere component of relative temperature change:
Relative Stress: S. J.Reddy]- Agric. For. Meteorol., 1995, 77:113-120
In some areas sea levels present a rise, in some fall and in majority of the areas no change. These are associated with natural man induced variations as well as natural variations in climate. Man encountered several forms of natural disasters like earthquakes, volcanoes, floods, droughts, etc. We can see the destruction of civilizations with floods and droughts on the one hand and cyclonic activity/tsunamis on the other hand in the past as part of natural variation in climate, for example the Nile River in the Egypt. Modern man to meet their greed introduced new types of disasters with the destruction of ecology through urbanization, deforestation, mining for oil, gas, water and minerals on the land, in the ocean, along the coast lines. All these have introduced drastic changes on nature. Mangroves along the coast lines were/are considered as protective walls. These reduce the fury of cyclones/tides. When these were/are removed through the spreading of activities such as aqua farms, industrial belts, hotels/buildings, etc they help the destruction of mangroves and thus coast lines. Along the coast lines with extraction of oil, gas, water, helped the sinking of the coastal zones. At the mouth [place where the rivers join the Sea or the Ocean] of the rivers like Ganga, Brahmaputra, Godavari, etc the silt deposition over years helping the spread of mouth area. These are attributed to sea level rise. Tides/cyclones eroded islands.
Dr. S. Jeevananda Reddy
According to Hansen the problem with climate now is that
“… There is evidence of ice melt, sea level rise to +5–9 m, and extreme storms in the prior interglacial period that was less than 1 °C warmer than today. Human-made climate forcing is stronger and more rapid than paleo forcings,”
He is reasoning by analogy which does not lead to scientific proof but let us humor him and see where this will take us. His “prior interglacial period” would be the Eemian of which he has spoken before. According to Hansen’s argument, less than a degree of temperature rise should be enough to bring our temperature and with it sea level up to the present Eemian level. That means sea levels 5 to 9 meters higher than today. Before taking it seriously we should ask if there is a precedent for this. According to Hansen himself, global temperature increase for the entire twentieth century was 0.8 degrees Celsius. This should do as a stand-in for what this amount of warming can do to sea level. So what did happen to sea level rise during the twentieth century? Was the sea rise even close to 5 meters or to 9 meters? Or maybe it was less, like a meter or even less, a half meter? None of the above is true. Twentieth century’s sea level rise was ten inches which is one quarter of a meter. With this meager precedent, is it possible for sea level rise to speed up by a factor of twenty or more to achieve Hansen’s predicted Eemian targets? You don’t even need to be a rocket scientist (which he is not) to see that it is simply a complete fantasy. Obviously that part of his package that is supposed to deliver this miraculous flood is simply non-sensical. He spells it out when he states that “…human made forcing is stronger and more rapid than paleo forcing…” Delusions of grandeur describes this. He imagines that he can compare human made forcing with paleo forcing when they happened at different times in history when he could not even observe them. Paleo forcing certainly left its traces on the landscape. But human forcing according to Hansen requires the presence of the intermediary of carbon dioxide. And so far this gas has left no traces of itself, Hansen and others like him blame atmospheric carbon dioxide for global warming because in their theory CO2 absorbs outgoing long-wave radiation and thereby heats up the world. It works fine in the laboratory but it fails to work in the atmosphere. This is proven by the existence if the hiatus which their greenhouse theory has utterly failed to explain. The theory was conceived by Arrhenius in 1896 and is the theoretical justification for the greenhouise theory that Hansen and others use to explain global warming. Except that it does not do this any more. The story with the hiatus is that dozens of papers have attempted to prove it wrong. The latest one is by Karl et al. It is based upon a wholesale rewrite of global warming records that stinks to high heaven of scientific fraud. They have only two data points showing warming and yet they aim to challenge several decades worth of scientific researche. Not only is the hiatus real but there are two of them. The earlier one was in the eighties and nineties and and has been over-written with fake wqarming by supposed guardians of global temperature. There are three outfits involoved in this forgery – HadCRUT3 (Hadley), GISS (then under Hansen) and NCDC (IPCC). I discivered this in 2008 while doing research for my book “What Warming?” With the demise of the Arrhenius greenhouse theory the only way to understand the hiatus phenomenon now is by using MGT, the Miskolczi greenhouse theory. That is because there are other greenhouse gases present in air, most notably water vapor, that Arrhenius cannot handle. According to MGT, carbon dioxide and water vapor establish a joint optimal absorption window in the infrared whose whose optical thickness is 1.87. The latter value comes from analysis of radiosonde measurements. In a related paper Miskolczi proved the stability of the optical thickness of the Earth’s atmosphere. If you now add carbon dioxide to the atmosphere it will start to absorb in the IR just as Arrhenius predicted. But this will increase the optical thickness, And as soon as this happens water vapor starts to diminish and rain out, the original optical thickness is restored, and no Arrhenius warming takes place. We thus have an increased atmospheric carbon dioxide, still absorbing IR, but no warming because reduction of water vapor in the air balances out the absorption that Arrhenius predicts. And that explains exactly why there is no warming during a hiatus when carbon dioxide is constantly increasing, The numerous authors of articles looking for the lost heat of the hiatus can now be reassured that it did not dive down into the ocean bottom but left the atmosphere for outer space.
.
This paper of Hansen’s is actually pretty typical of climate change apocalypse papers. It is certainly not noticeably different from Dr. Hansen’s earlier papers for which he was lauded. .
Hansen never recognises or understands Freeman Dyson’s summation of climate change : “… The climate of the Earth is an immensely complicated system and nobody is close to understanding it.”
Even James Lovelock in The Guardian of 29 March, 2010 recanted his earlier alarmism; ” The great science centres around the world are more than well aware how weak their science is. If you talk to them privately they’re scared stiff of the fact that they don’t really know what the clouds and the aerosols are doing. They could be absolutely running the show. We haven’t got the physics worked out yet.”
My response above was based on the current article that includes Hansen’s abstract. I stand by what I said but was absolutely astounded at the original when I got to downloadeing it. It is a book-length Magnum Opus of 121 pages. It includes 26 pages of references, among them 14 written by Hansen himself.The article itself comprises more than 50 thousand words. For comparison, Science limits you to 4500 words per article and Energy and Environment gives you a generous 6000 words. Looking through his work I noticed sections that could have been individual articles themselves. He devotes much effort to justifying extreme events which I still find unconvincing. Will I read it? Not cover to cover but it will be useful for comparing this to other things he has said. I hope these monster articles do not become a trend.
RE: Turns out it will take about 26,000 years to reach that level.
Not sure there is enough supply of water to raise SL that much. Another notion to consider is the longer historical data set. Most of the rise that could have happened since the most recent glacial has already happened. The current rate of rise, on a grand scale, is asymptotic to zero. We are really in the tail end of a multi-thousand year rise. What goes up, must come down.
Well, this alarmist claptrap is getting an awful lot of attention in the MSM. Isn’t that all that really matters?
citation page 20115, line 18. “Figure 29 reveals an accelerating sea level rise, but it includes the effect of all processes affecting sea level and thus may understate the growth rate for ice sheet”
WRONG!
Hansen is carefully selecting the observation data that he likes to consider: in Figure 29 the graph curiously begins only in 1900.
Actually a compilation by Jevrejeva exists covering global mean sea level since 1750. When calculating the rate of rise (based on running average over 13 months) from this dataset and from the ones Hansen is also using, following picture is obtained:
http://bit.ly/1SQTpR1
For the Jevrejeva set the correlation coefficient R square is 0.0555, So, it is probable to the limit of certainty that no statistically significant acceleration has taken place over the pas two and half century. Te seas are slowly raising, but without acceleration, and this began well before the industrial era..
Error, omission, of outright lie?
We can dismiss the whole paper just on this basis; but there are more reasons.
To melt the amount of ice that is required to raise the global mean sea level by 5 to 9 m until the end of the century a lot of heat must be transferred from the atmosphere to the ice sheet. In the paper there is no discussion about the mechanism of this spectacular increase of the rate of heat transfer..
Incoherence or wilful omission?
it is possible that more ice will be lost by the Antarctic sheet, as it may have done during the late-Eemian age. But such possibility does not make it probable, and does not make it “near certain” until the end of this century.
Hansen is known for his exaggerations, this is one more.
The not yet peer reviewed paper is open to comments. I made one, with a few more points:
http://www.atmos-chem-phys-discuss.net/15/20059/2015/acpd-15-20059-2015-discussion.html,
look at SC C5401
and have a look at: http://wp.me/p4uV7N-E6