Guest Post by Bob Tisdale
UPDATE: It was pointed out in a comment that the model-data comparison in the post was skewed. I was comparing modeled marine air temperature minus modeled sea surface temperature anomalies to observed night marine air temperature minus sea surface temperature anomalies. Close, but not quite the same. I’ve crossed out that section and the references to it and removed the graphs. Sorry. It was a last-minute addition that was a mistake. (Memo to self: Stop making last minute additions.) Thanks, Phil.
The rest of the post is correct.
# # #
INTRODUCTION
The saga continues. For those new to this topic, see the backstory near the end of the post.
Grant Foster (a.k.a. Tamino and Hansen’s Bulldog) has written yet another post The Bob about my simple comparison of the new NOAA pause-buster sea surface temperature dataset and the UKMO HADNMAT2 marine air temperature dataset that was used for bias adjustments on that NOAA dataset. In it, he quotes a comment at his blog from Miriam O’Brien, a.k.a. Sou from HotWhopper. Miriam recycled a flawed argument that I addressed over a month ago.
In his post, after falsely claiming that I hadn’t looked for reasons for the difference between the night marine air temperature data and the updated NOAA sea surface temperature data during the hiatus, Grant Foster presented a model that was based on a multivariate regression analysis…in an attempt to explain that difference. Right off the get go, though, you can see that Hansen’s Bulldog lost focus again. He also failed to list the time lags and scaling factors for the individual variables so that his results can be verified. We’re also interested in those scaling factors to see if the relative weighting of the individual components are proportioned properly for a temperature-related global dataset. To overcome that lack of information from Grant Foster, I also used a multivariate regression analysis to determine the factors. I think you’ll find the results interesting.
Last, before presenting his long-term graph of the difference between the HADNMAT2 and ERSST.v4 datasets, Grant Foster forgot to check which ocean surface temperature dataset climate models say should be warming faster: the ocean surface or the marine air directly above it. That provides us with another way to show that NOAA overcooked their adjustments to their sea surface temperature data.
MORE DETAIL
Grant Foster began his recent post with a quote of a comment at his blog from Miriam O’Brien (Sou from Hot Whopper) of all people. That quote begins:
Bob has it all wrong in his now umpteenth post about this. HadNMAT2 is used to correct a bias in ship sea surface temps only. For the period he’s looking at (in fact since the early 1980s), they only comprise 10% of the observations. The rest of the data is from buoys, and HadNMAT doesn’t apply to them. They are much more accurate than ship data anyway. So much so that if ship and buoy data are together, the buoy data is given six times the weighting of ship data. So the comparison Bob thinks he’s making is completely and utterly wrong. And not just because the trends is actually quite close. He is not comparing what he thinks he is comparing.
Contrary to Miriam’s misinformation, I know exactly what I’m comparing. And as we’ll discuss in a few moments, I also know exactly why I’m comparing them. We discussed it a month ago, but alarmists are notorious for short memories.
The revisions to the NOAA sea surface temperature dataset are discussed in detail in the papers:
- Huang et al. (2015) Extended Reconstructed Sea Surface Temperature version 4 (ERSST.v4), Part I. Upgrades and Intercomparisons, and
- Liu et al. (2015) Extended Reconstructed Sea Surface Temperature version 4 (ERSST.v4): Part II. Parametric and Structural Uncertainty Estimations.
In the abstract of Part 1, Huang et al specifically state that there are two bias adjustments (both of which impact the pause):
The monthly Extended Reconstructed Sea Surface Temperature (ERSST) dataset, available on global 2° × 2° grids, has been revised herein to version 4 (v4) from v3b. Major revisions include updated and substantially more complete input data from the International Comprehensive Ocean–Atmosphere Data Set (ICOADS) release 2.5; revised empirical orthogonal teleconnections (EOTs) and EOT acceptance criterion; updated sea surface temperature (SST) quality control procedures; revised SST anomaly (SSTA) evaluation methods; updated bias adjustments of ship SSTs using the Hadley Centre Nighttime Marine Air Temperature dataset version 2 (HadNMAT2); and buoy SST bias adjustment not previously made in v3b.
So Miriam O’Brien is correct that the HADNMAT2 data are only used for ship bias adjustments. However, she incorrectly concludes that my reasons are wrong. Suspecting that someone would attempt the argument she’s using, I addressed that subject more than a month ago in my open letter to Tom Karl:

Figure 1
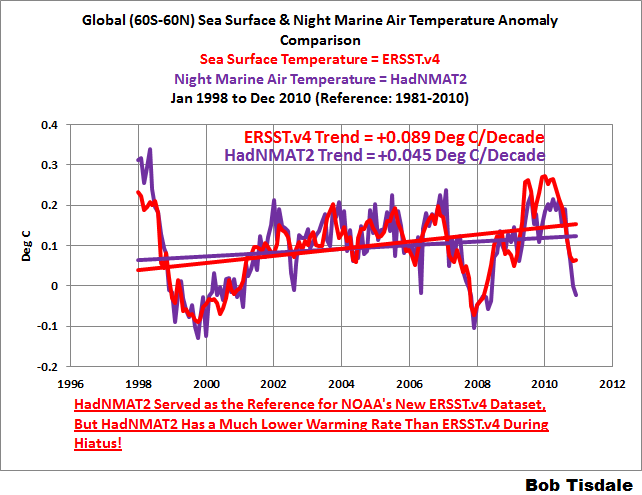
Someone might want to try to claim that the higher warming rate of the NOAA ERSST.v4 data is caused by the growing number of buoy-based versus ship-based observations. That logic of course is flawed (1) because the HadNMAT2 data are not impacted by the buoy-ship bias, which is why NOAA used the HadNMAT2 data as a reference in the first place, and (2) because the two datasets have exactly the same warming rate for much of the period shown in Figure 1. That is, the trends of the two datasets are the same from July 1998 to December 2007, a period when buoys were being deployed and becoming the dominant in situ source of sea surface temperature data. See Figure 2.

Figure 2
[End of copy from earlier post]
That text was included with my first presentation of the graph their they’re complaining about.
Grant Foster returned to Miriam O’Brien’s claim in one of his closing paragraphs:
Of course the salient point is what was pointed out by Sou, that the comparison Bob thinks he’s making is completely and utterly wrong.
As noted above, the comparison I’m making is not wrong. It’s being done for very specific reasons. Miriam O’Brien and Grant Foster might not like those reasons, but those reasons are sound.
ON TAMINO’S MODEL OF THE DIFFERENCE BETWEEN THE HADNMAT2 AND ERSST.v4 DATA
Grant Foster begins the discussion of his modeling efforts with (my boldface):
Here’s the data that has The Donald The Bob in a tizzy, where I’ve computed the difference between NMAT and ERSSTv4:
I’ve circled the earliest part, from 1998, where NMAT is higher than ERSSTv4. It’s one of the main reasons that The Bob found a lower trend for NMAT than for ERSSTv4 since 1998. The difference since 1998 shows an estimated trend of -0.0044 deg.C/yr, the same value The Bob found for the difference in their individual trend rates.
What The Bob didn’t bother to do is wonder, why might that be? Just because there are differences between NMAT and sea surface temperature, that doesn’t mean the people estimating SST have rigged the game; why, there might even be an actual, physical reason for it.
What’s so special about 1998? The Bob wants us to believe it’s because of that non-existent “hiatus”. But let’s not forget that 1998 was the year of the big el Niño. Which made me wonder, might that have affected the difference between NMAT and sea surface temperature? What about aerosols from volcanic eruptions? What about changes in solar radiation?

Contrary to Grant Foster’s claims, I not only wondered, I discussed that difference more than a month ago in my open letter to Tom Karl. In a continuation of my earlier discussion from that post:
In reality, the differences in the trends shown in Figure 1 are based on the responses to ENSO events. Notice in Figure 1 how the night marine air temperature (HadNMAT2) data have a greater response to the 1997/98 El Niño and as a result they drop more during the transition to the 1998-01 La Niña. We might expect that response from the HADNMAT2 data because they are not infilled, while the greater spatial coverage of the ERSST.v4 data would tend to suppress the data volatility in response to ENSO. We can see the additional volatility of the HadNMAT2 data throughout Figure 2. At the other end of the graph in Figure 1, note how the new NOAA ERSST.v4 sea surface temperature data have the greater response to the 2009/10 El Niño…or, even more likely, they have been adjusted upward unnecessarily. The additional response of the sea surface temperature data to the 2009/10 El Niño is odd, to say the least.
[End of copy from earlier post]
Back to Grant Foster’s discussion of his model. He continued:
To investigate, I took the difference between NMAT and ERSSTv4, and sought to discover how it might be related to el Niño, aerosols, and solar output. As I’ve done before, I used the multivariate el Niño index to quantify el Niño, aerosol optical depth for volcanic aerosols, and sunspot numbers as a proxy for solar output. I allowed for lagged response to each of those variables. I also allowed for an annual cycle, to account for possible annually cyclic differences between the two variables under consideration.
The available data extend from 1950 through 2010, but I started the regression in 1952 to ensure there was sufficient “prior” data for lagged variables. It turns out that all three variables affect the NMAT-ERSSTv4 difference. Here again is the difference, this time since 1952, compared to the resulting model:
It turns out that the model explains the NMAT-ERSSTv4 differences rather well, particularly the high value in 1998 as mostly due to the el Niño of that year.

Grant Foster didn’t supply the information necessary to support his claim that “It turns out that all three variables affect the NMAT-ERSSTv4 difference.” According to his model, they had an impact together, but he did not show the individual impacts of the three variables.
Contrary to Grant Foster’s claim, the extended Multivariate ENSO Index (MEI), the SIDC sunspot data and the GISS stratospheric aerosol optical depth data extend back in time to 1880. Then again, the farther back in time we go, the less reliable the data become. The 1950s were a reasonable time to start the regression analysis.
Looking back at Grant Foster’s first graph, he subtracted the ERSST.v4 sea surface temperature data from the reference HADNMAT night marine air temperature. However, it’s much easier to see the warm bias in NOAA’s pause-buster data, and the timing of when it kicks in, if we do the opposite, subtract the reference HADNMAT2 data from the ERSST.v4 data. See my Figure 3. That way we can see that the difference after 2007 had a greater impact on the warming rates than the difference before July 1998. Not surprisingly, Grant Foster was focused on the wrong end of the graph with his circle at 1998.

Figure 3
But for the rest of this discussion, we’ll return to the way Grant Foster has presented the difference. Keep in mind, though that a negative trend means NOAA’s sea surface temperature data are rising faster than the reference night marine air temperature data.
GRANT FOSTER LOST FOCUS AGAIN
While Grant Foster was right to use longer-term data (1952 to 2010) for his regression analysis, he only presented illustrations of the results for that period. But the topic of discussion is the period of 1998 to 2010, the slowdown in global warming. Looking at his model-data graph above, it’s difficult to see how well his model actually performs during the hiatus. He claims, though:
It turns out that the model explains the NMAT-ERSSTv4 differences rather well, particularly the high value in 1998 as mostly due to the el Niño of that year.
Rather well is relative. His model is based on a multiple regression analysis, which takes the data for the dependent variable (the HADNMAT2-ERSST.v4 difference) and determines the weighting of the independent variables (the ENSO index, the sunspot data and the volcanic aerosol data) that, in effect, provide the best fit for the dependent variable. (Grant Foster’s regression analysis also shifts the independent variables in time in that effort.) So we would expect the model to explain some of “the NMAT-ERSSTv4 differences rather well”. But we can also see that the model misses many other features of the data. Additionally, the regression analysis doesn’t care whether the relative weightings of the independent variables make sense on a physical basis. (More on that topic later.)
Grant Foster praised his model because it captured the 1997/98 El Niño. Of course the model makes an uptick in 1997/98. One of the components of the model is an ENSO index.
But what about the rest of the hiatus? Why didn’t he focus on that? He made a brief mention of it in his post, and we’ll present that in a moment.
His model also makes an uptick for the 2009/10 El Niño, but the data, unexpectedly, move in the opposite direction, indicating the NOAA sea surface temperature warmed more than the HadNMAT2 data, when according to his model, it should have warmed less…as noted earlier. (See my discussions of Figures 1 and 2 in this post again.)
GRANT FOSTER DIDN’T PRESENT THE SCALING FACTORS OR TIME LAGS FOR THE INDEPENDENT VARIABLES: THE SUNSPOTS, THE ENSO INDEX AND THE VOLCANIC AEROSOL DATA
As mentioned in the opening of this post, if Grant Foster had provided the scaling factors of the independent variables, we could check his results and see whether the relative weightings of the ENSO index, the sunspot data and the volcanic aerosol data make sense on a physical basis. Also of concern are the time lags determined by his regression analysis. Unfortunately, Grant Foster, as of the time of this writing, failed to provide any of that valuable information.
THE RESULTS OF ANOTHER MULTIPLE REGRESSION ANALYSIS
Because Grant didn’t supply that information, I used the Analyse-It software to perform a separate multiple regression analysis of the HADNMAT2-ERSST.v4 difference, using the same independent variables: NOAA’s Multivariate ENSO Index (MEI), the SIDC sunspot data, and the GISS aerosol optical depth data. The MEI and SIDC data are available at the KNMI Climate Explorer, specifically on the Monthly Climate Indices webpage, and the GISS aerosol optical thickness data are available here.
Unlike Grant Foster’s software, the Analyse-It software does not determine the best time lags for the independent variables. So I used the average of the time lags (4 months for the ENSO index, 1 month for the sunspot data, and 6 months for the volcanic aerosols) listed in Table 1 of Foster and Rahmstorf (2011), of which Grant Foster was lead author. If Grant Foster provides us with the scaling coefficients and time lags his model found, I’ll be happy to redo this.
Using EXCEL, I created a model for the period of 1952 to 2010, shown in Figure 4. The scaling factors and time lags are listed on it. Before determining their difference, I used the base years of 1952 to 2010 for the HADNMAT2 and ERSST.v4 anomalies, to assure that my choice of base years didn’t skew the results. You might get slightly different scaling coefficients using different base years, but the results should be similar.
Like Grant Foster’s model, we would expect the model to mimic parts of the data, because the regression analysis determined the weightings of the three variables (the ENSO index, the sunspot data and the volcanic aerosol data) that furnished the “best fit”. Example: Because my model, like his, uses the Multivariate ENSO index as one of its independent variables, it too creates an uptick at the 1997/98 El Niño, but it also shows the unexpected divergence between the model and data at the end in response to the 2009/10 El Niño. The monthly variations in the HADNMAT2-ERSST.v4 difference in my graph are not the same as Grant Foster’s, but that could be caused by the use of different base years for anomalies. Grant Foster’s model also appears to have greater year-to-year variations, but since he didn’t bother to provide the necessary information for us to duplicate his efforts, we’ll have to rely on my results.

Figure 4
But also like Grant Foster’s model, we can see that my model also misses many of the features of the data.
Keep in mind that everything shown before 1998 in Figure 4 has no real bearing on our discussion of the hiatus, which is the topic of this debate. I’ve presented Figure 4 to show that my results are similar to Grant Foster’s. Figure 5 includes only the results of the regression analysis we’re interested in…for the period of 1998 to 2010. The top graph presents the “raw” model and data, and in the bottom graph, the model and data have been smoothed with 12-month running-mean filters.

Figure 5
Based on the linear trend lines, it appears that a portion of the HADNMAT2-ERSST.v4 difference could be—repeat that, could be—caused by the impacts of ENSO, the solar cycle, and volcanic aerosols…assuming that the scaling coefficients of the ENSO index, the sunspot data and the volcanic aerosol data relative to one another are realistic.
And we can also see that the greater divergence between model and data occurs during the 2009/10 El Niño, not the decay of the 1997/98 El Niño. So, again, Grant Foster was looking at the wrong El Niño.
WHAT GRANT FOSTER HAS TO SAY ABOUT THE MODEL-DATA DIFFERENCE DURING THE HIATUS
Grant Foster went a step farther and subtracted the model output from the data to determine the residuals, once again using the longer-term results, not the results for the hiatus.
Here are the residuals from the fit:
If we study only the residuals since 1998, by golly the estimated trend is still negative. But only by -0.0018 deg.C/yr (not -0.0044), a value which is not statistically significant. So much for The Bob’s “much lower.”

But, as noted above, Grant Foster failed to show something about his model: whether the scalings of the ENSO index, the sunspot data and the volcanic aerosol data are realistic. So we have to return to my results.
THE RELATIVE WEIGHTINGS OF THE INDEPENDENT VARIABLES
Before we present the results for the difference between the sea surface temperature and night marine air temperature data, let’s look at the results for a global surface temperature dataset so we can see what we should expect.
I used detrended monthly GISS Land-Ocean Temperature Index data (from 1952 to 2010) in the multiple regression analysis, along with the same three independent variables. The time lags were the same, with the exception of the Aerosol Optical Depth data, which are shown as 7 months for the GISS data in Table 1 of Foster and Rahmstorf (2011). Figure 6 presents the three independent variables multiplied by the scaling coefficients that were determined by the regression analysis.

Figure 6
As expected, the two greatest sources of year-to-year fluctuations in global surface temperatures are ENSO (El Niño and La Niña) events and stratospheric aerosols from catastrophic explosive volcanic eruptions. (Note: The regression analysis cannot determine the long-term aftereffects of ENSO…the Trenberth Jumps…they only indicate, based on statistical analysis, the direct linear effects of ENSO on global surface temperatures. For a further discussion on how linear regression analyses miss those long-term warming effects of ENSO, see the post here.) As expected, according to the regression analysis, the eruption of El Chichon in 1982 had a slightly greater impact on surface temperatures than the 1982/83 El Niño. And as expected, according to the regression analysis, the effects of the decadal variations in the solar cycle are an order of magnitude less than the impacts of ENSO and strong volcanic eruptions.
We’ve seen discussions of the relative strengths of the impacts of those variables for decades. Of all weather events, El Niño and La Niña events have the greatest impacts on annual variations in surface temperature. The only other naturally occurring factors that can be stronger than them are catastrophic explosive volcanos. On the other hand, the decadal variations in surface temperatures due to the solar cycle are comparatively tiny compared to ENSO and volcanos.
That’s what we should expect!
But that’s not what was delivered with the regression analysis of the HADMAT2-ERSST.v4 difference. See Figure 7. The relationship between our ENSO index and the volcanic aerosols appears relatively “normal”. BUT (and that’s a great big but) the decadal variations in the modeled impacts of solar cycles are an order of magnitude greater than we would expect. According to the regression analysis, for example, the maximum of Solar Cycle 19 (starts in the mid-1950s) is comparable in strength to the impacts of the El Niño events of 1982/83 and 1997/98.

Figure 7
Maybe that’s why Grant Foster didn’t supply the scaling coefficients or the time lags so we could investigate his model. If his results are similar to mine, the trend of his model during the hiatus depends on unrealistically strong solar cycle impacts.
Note: You may be thinking that there might actually be a physical explanation for the monstrously excessive response of the HADMAT2-ERSST.v4 difference to the solar cycle data. Keep in mind, though, that the response to volcanic aerosols is solar related…inasmuch as the volcanic aerosols limit the amount of solar radiation reaching the surface of the oceans. You can argue all you want about whatever it is you want to argue about, but unless you can support those claims with data-based analysis or studies, all you’re providing is conjecture. We get enough model-based conjecture from the climate science community—we don’t need any more.
THE RELATIVE WEIGHTINGS OF THE INDEPENDENT VARIABLES DURING THE HIATUS
Let’s return to the what-we-would-expect and what-we-got format but this time zoom in on the independent variables for the hiatus period of 1998 to 2010. That is, the data are the same as in Figures 6 and 7. We’ve just shortened the timeframe to the years of the hiatus.
We’ll again start with the detrended GISS land ocean surface temperature data. Figure 8 presents those scaled independent variables for the hiatus, 1998 to 2010. Looking at the linear trend lines, we would expect the impacts of ENSO to be greatest, followed by the sunspot data due to the change from solar maximum to minimum in that timeframe. The volcanic aerosols are basically flat and had no impact.

Figure 8
Again, that’s what we would expect from a global temperature-related metric.
But that’s not what we got from the regression analysis of the HADMAT2-ERSST.v4 difference. See Figure 9. During the hiatus, the regression analysis suggests that the change from solar maximum to minimum had the greatest impact on the trend, noticeably larger than the trend of the linear impacts of ENSO.

Figure 9
If Grant Foster’s model has the same physically unrealistic weighting of its solar component, then his residuals during the hiatus are skewed. All things considered, it appears as though the only way to create the trend Grant Foster found is with a model that grossly exaggerates the impacts of the solar cycle.
MORE MISINFORMATION FROM MIRIAM O’BRIEN (SOU AT HOTWHOPPER)
On the thread of Grant Foster’s post The Bob, which as a reminder was the subject of this post, Miriam O’Brien graces us once again with irrelevant information. See her July 22, 2015 at 12:52pm comment here. It reads (my boldface):
Thanks, Tamino.
I removed some charts from the HW article before posting it, because it was getting a bit too long. However if anyone’s interested, the charts I took out were from a 2013 paper by Elizabeth Kent et al. Figure 15 had some charts that plotted the difference between sea and air temps (HadSST and HadNMAT2 and some other comparisons).
http://onlinelibrary.wiley.com/doi/10.1002/jgrd.50152/pdf
There’s no reason to expect night time air temperature would follow the same trend as the sea surface temperature exactly, though it’s fairly close. I also came across articles which discussed the diurnal variation – some places can have different trends in daytime vs night temps in sea surface temps. That is, other than the obvious where ships exhibit a maritime heat island effect during the day (which is why the night time marine air temps are used, not the day time ones).
More misdirection from Miriam. The topic of discussion is NOAA’s ERSST.v4 data, not the UKMO’s HadSST3 dataset, which differs greatly from NOAA’s ERSST.v4 data.
In fact, for the period of 1998 to 2010, the same basic disparity in warming rates (as HADNMAT2 Versus ERSST.v4) exists between the UKMO HADSST3 and NOAA’s ERSST.v4 data. See Figure 10. Now recall that the UKMO’s HadSST3 sea surface temperature data are also adjusted for ship-buoy bias. In other words, the UKMO’s sea surface temperature and night marine air temperature datasets basically show the same warming rate from 1998 to 2010, and those warming rates are both well below the warming rate of the overcooked NOAA ERSST.v4 data.

Figure 10
And while the HadNMAT2 data ends in 2010, the HadSST3 data are updated to present times, May 2015. So we can see that the excessive warming rate of the ERSST.v4 data continues during the hiatus.

Figure 11
My thanks to Miriam O’Brien for reminding me to illustrate that disparity between the two sea surface temperature datasets that have both been adjusted for ship-buoy bias.
Someone is bound to ask, who made the UKMO data the bellwether? NOAA did. NOAA used the HADNMAT2 data for bias adjustments since the 1800s. See Huang et al. (2015) Extended Reconstructed Sea Surface Temperature version 4 (ERSST.v4), Part I. Upgrades and Intercomparisons
Consider this: NOAA could easily have increased the warming rate of their reconstructed sea surface temperature data to the warming rate exhibited by the UKMO’s sea surface and marine air temperature datasets for the period of 1998 to 2012. Skeptics would have complained but NOAA would then have had two other datasets to point to. But NOAA didn’t. NOAA chose to overcook their adjustments…in an attempt to reduce the impacts of the slowdown in global sea surface warming this century.
(Side note to Miriam O’Brien: I was much entertained by the ad hom-filled opening two paragraphs of your recent post Biased Bob Tisdale is all at sea. And the rest of your post was laughable. Thank you for showing that you, like Grant Foster, can’t remain on topic, which, since you obviously can’t recall, is the hiatus. As a reminder, here’s the title of the Karl et al. (2015) paper that started this all Possible artifacts of data biases in the recent global surface warming HIATUS. <– Get it?)
ABOUT THE STATISTICAL SIGNIFICANCE, OR LACK THEREOF, OF THE HADNMAT2-ERSST.V4 DIFFERENCE
This post, like the earlier posts about this topic, is sure to generate discussions about the statistical significance in the difference between NOAA’s ERSST.v4 data and the UKMO HADNMAT2 data…that the difference is not statistically significant.
Those discussions help to highlight one of the problems with the surface temperature datasets. Every 6 months, year, two years, the suppliers of surface temperature data make minor (statistically insignificant) changes to the data. Each time, the supplier can claim the change isn’t statistically significant. But over a number of years, NOAA has done its best to eliminate the slowdown in global warming by making a series of compounding statistically insignificant changes. If the foundation of the hypothesis of human-induced global warming was not so fragile, NOAA would not have to constantly tweak the data to show more warming…and more warming…and more warming.
Regardless of whether or not the difference between NOAA’s ERSST.v4 data and the UKMO HADNMAT2 data is statistically significant, it is an easy-to-show example of one of the compounding never-ending NOAA data tweaks, so I’ll continue to show it.
ANOTHER EXAMPLE OF NOAA OVERCOOKING THEIR NEW SEA SURFACE TEMPERATURE DATASET
Grant Foster insisted on looking at data that extended back in time before the hiatus in this post and past posts. The slight negative trend in the HADNMAT2-ERSST.v4 difference since 1952, Figure 12, indicates the new ERSST.v4 sea surface temperature data have a slightly higher warming rate than the reference HADNMAT2 night marine air temperature data over that time period. In other words, according to NOAA, global sea surfaces warm faster than the marine air directly above the ocean surfaces.
(Graph removed)
Figure 12
And that reminded me of the climate models used by the IPCC. It’s always good to remember what climate models say, in theory, should be taking place, because they indicate the opposite should be happening. According to the groupthink (the consensus) of the climate modeling groups around the globe, known as the multi-model mean, the marine air should be warming faster than the ocean surface. See Figure 13.
(Graph removed.)
Figure 13
How could NOAA have overlooked a basic fundamental like that? Or is NOAA suggesting the ocean-warming physics are wrong in climate models?
In addition to overcooking the sea surface temperature data during the hiatus, it appears that NOAA has overcooked the warming rate of their sea surface temperature data since 1952 as well by a noticeable amount.
You may want to argue that the difference in trends (0.022 Deg C/Decade) is small. My responses: (1) It shows yet another unjustifiable tweak by NOAA, and (2) the HADNMAT2-ERSST.v4 difference contradicts physics.
And just in case you’re wondering, I also performed multiple regression analyses on the modeled marine air temperature-sea surface temperature anomaly difference, using the CMIP5 multi-model mean and a couple of individual models from that archive. The solar cycle components were smaller than the ENSO and volcanic aerosol factors, as they should be. But even more curious, they all showed a solar cycle component that was the opposite sign of the one based on the HADNMAT2-ERSST.v4 difference, meaning the solar cycle in the models decreased, not increased, the temperature difference between the marine air and sea surface temperatures during the hiatus. I’ll present those results in a future post.
Thanks, Grant. As soon as I saw your HADNMAT2-ERSST.v4 difference graph, I knew there was another problem with the ERSST.v4 adjustments.
BACKSTORY – THE EXCHANGE
- Grant Foster didn’t like my descriptions of the new NOAA ERSST.v4-based global surface temperature products in my post Both NOAA and GISS Have Switched to NOAA’s Overcooked “Pause-Busting” Sea Surface Temperature Data for Their Global Temperature Products. So he complained about them in his post New GISS data (archived here). And Grant Foster didn’t like that I presented the revised UAH lower troposphere data in a positive light.
- I responded to Grant Foster’s complaints with the post Fundamental Differences between the NOAA and UAH Global Temperature Updates.
- Obviously, Grant Foster missed the fact the focus of the discussion is the hiatus, because he replied with the post Fundamental Differences between Bob Tisdale and Reality (archived here), which also presented data leading up to the hiatus.
- I reminded Grant the topic of discussion was the hiatus in my response Tamino (Grant Foster) is Back at His Old Tricks…That Everyone (But His Followers) Can See Through.
- Grant Foster responded to that with The Bob, which is the subject of this post.
CLOSING
Over a month ago, we had discussed one of Miriam O’Brien’s arguments, which Grant Foster quoted and found noteworthy, and we determined the logic behind it to be flawed.
If the relative weightings of the independent variables in Grant Foster’s model are as physically skewed as those found with the multiple regression analysis I performed, then his modeled trend during the hiatus is meaningless. And looking back at Figure 9, the only way to accomplish the trend found by Grant Foster is to grossly exaggerate the impacts of the solar cycle in the model.
One of Grant Foster’s closing paragraphs reads:
I expect The Bob will post about this again. I expect he’ll repeat himself again. After all, the trend in NMAT is lower than that in ERSSTv4 since 1998, which can’t possibly have anything to do with el Niño or atmospheric aerosols or solar variations because that’s the time of the non-existent “hiatus”.
As discussed in this post, I had already considered and illustrated how El Niño events had skewed the HADNMAT2-ERSST.v4 difference. So yes, I repeated myself, but those repetitions contradicted his claims and his quote from Miriam O’Brien. But then Grant Foster introduced another topic…his model. And as I showed in my Figure 5, Grant Foster was focused on the wrong El Niño. We showed in Figure 9 that the stratospheric aerosols were a non-factor in the HADNMAT2-ERSST.v4 difference. That leaves the solar variations. If the weighting of Grant Foster’s sunspot data is as skewed as I found with my regression analysis, we can dismiss his model.
Also, because of the reminder from Miriam O’Brien (Sou at HotWhopper), I’ve shown that a disparity in trends similar to the HADNMAT2-ERSST.v4 difference also exists between the UKMO HADSST3 data and the NOAA ERSST.v4, both of which are ship-buoy-bias-adjusted sea surface temperature datasets, for the period of 1998 to 2010, Figure 10.
Last, the climate models used by the IPCC indicate, globally, marine air should be warming faster than sea surfaces since the early 1950s, which is the opposite of the relationship between the new overcooked NOAA sea surface temperature data and the night marine air temperature data NOAA used for bias adjustments.
Next in this series will be a more detailed look at the long-term data. The working title is, Did NOAA Destroy a Perfectly Good Sea Surface Temperature Reconstruction with the Latest Upgrade?
The hypothesis is proved wrong
And we mustn’t lose that focus
By trying to debate
All their charlatan’s hocus pocus.
We’re giving them more respect
Than their illusion deserves,
We need to remember
The master it serves!
http://rhymeafterrhyme.net/climate-science-is-surely-building-its-own-funeral-pyre/
rhymeafterhyme — like it — Eugene WR Gallun
rhymeafterrhyme
I second that
Cause they are just rats
but we gotta give ’em
a good tit for tat
Good on yer, Bob! I admire your patience; this one will run and run – gets popcorn.
As for Mr. Foster, anyone who quotes Miriam O’Brien surely forfeits the right to be taken seriously.
Oswald Thake, I hope people don’t stop reading the post after that quote from Miriam, because it gets more and more interesting as it progresses.
Cheers
As a layperson the question I would like answered is… Are the physics of CO2 as a “greenhouse gas” generally agreed upon? I mean outside of a test tube or a laboratory. Does science truly understand the actual effect of a rise in CO2 levels in the atmosphere on temperatures? It seems to me that the hypothesis- theory- whatever they want to call it- is not proven and actual observations seem to suggest that the physics are not completely understood.
daveandrews:
First of all, you have to understand that science is always simply ‘the best explanation we have at the moment’ for something. The physics of CO2 in its affect upon the atmosphere is understood, but there is no empirical evidence for how it will play out, simply because we do not understand the climate system yet – if we ever will. It is hugely complex, and we cannot even begin to understand positive and negative feedbacks. This is why the Met Office is absurd in thinking that they know with any certainty at all what the global climate will be like in 50 years.
Thanks for that perspective. I’ve often heard that CO2 levels lag behind temperature increases and therefore do not “drive” temperatures. Others say CO2 is a direct and most powerful driver. It’s hard for a non-scientist to have an informed opinion, but I tend to be skeptical of the worst-case scenarios that are being predicted. I agree that the climate system is very complex and many factors will influence future temperatures. None of us will be around in 100 years to know the answers… but such is life 🙂
Dave. There is no Greenhouse Effect. The reason both alarmists and “Luke Warmers” have so much disagreement over details is because they have no agreed upon mechanism to actually describe the hypothesis.
This website, and specifically this page of it, does a great job of explaining the history of the hypothesis and the mistakes that have been made in simple English
http://greenhouse.geologist-1011.net
There is no Greenhouse Effect
========================
It is well established that true greenhouses warm by limiting convection. This can be demonstrated by opening a window in the roof of a greenhouse. The greenhouse quickly cools.
However, it was at one time believed that greenhouses warmed by limiting outgoing IR. However, this is now known to be false because it can be demonstrated by building a greenhouse out of non IR reflecting material such as transparent plastic. The greenhouse still warms.
Thus, the fundamental scientific principle behind the greenhouse effect is the limiting of convection, not the blocking of IR. However, Climate Science claims that CO2 warms by blocking outgoing IR, and calls this the greenhouse effect.
Thus is fundamentally incorrect. Greenhouses do not warm as a result of blocking outgoing IR. Thus the claim that Climate Change is due to the “greenhouse effect” is false, because the mechanism is incorrect.
“It is well established that true greenhouses warm by limiting convection. This can be demonstrated by opening a window in the roof of a greenhouse. The greenhouse quickly cools.”
OMG! The same thing happens to my car on a sunny day when I leave all the windows rolled up! And when I roll down the car windows to allow fresh air from outside the car to replace the warm air that was trapped inside the car THE AIR IN THE CAR GETS COOLER!
This is amazing!
I’m with Dave here. Do any of you have knowledge of a paper or papers that claim to actually have measured the greenhouse effect of CO2 in the atmosphere? Also, are there any realistic, climate-related laboratory research papers demonstrating the greenhouse effect? As an interested, amateur observer of the greenhouse gas debate, it is puzzling to me that this kind of information is not easy to find. Probably, I’m just not very good at finding it. Thanks in advance for any help.
See this Jim Britton:
http://wattsupwiththat.com/2015/02/25/almost-30-years-after-hansens-1988-alarm-on-global-warming-a-claim-of-confirmation-on-co2-forcing/
fredberple said: “Thus is fundamentally incorrect. Greenhouses do not warm as a result of blocking outgoing IR. Thus the claim that Climate Change is due to the “greenhouse effect” is false, because the mechanism is incorrect.”
Dr. Roy Spencer did a fairly detailed analysis of this, and concluded that greenhouses do indeed warm as a result of blocking IR, and not as a result of limiting convective cooling: http://www.drroyspencer.com/2013/08/does-a-greenhouse-operate-through-the-greenhouse-effect/
So … so it’s not the nature of the gas (a greenhouse gas or otherwise) that makes up the air that is trapped in the car that causes the air in the car to heat up, instead it is the fact that that the gas is trapped in the car is what causes the air to heat up.
OMG! Another breakthrough! I must be … I must be a Climate Scientist!
The air in the car is going to heat up whether the windows are open or not because the sun will shine into the car whether the windows are open or not. So the difference when the windows are rolled up is the heated air inside the car cannot escape from the car so as to in turn be replaced by cooler air from outside the car!
Dave tells a porky. Longwave radiation is what the Sun-warmed Earth gives off. 1. Water vapor is an excellent source of extra heat caused by longwave radiation it absorbs and then re-radiates in all directions, including down. 2. Humid air holds more heat. Dry air holds less heat. 3. Earth is a wet world thus the greenhouse effect of its resulting humid (because of water vapor) atmosphere makes it warmer than if it were just plain ol’ dirt. 4. If water vapor molecules serve as a greenhouse gas, any other molecule with the same physical properties with regard to longwave radiation would also serve as a greenhouse gas. CO2, a relatively abundant trace gas compared to other trace gases, will function much like water vapor in response to upwelling longwave radiation.
The issue is whether or not CO2 significantly increases Earth’s temperature beyond what water vapor already does, in any beyond the noise of Earth’s weather pattern variations in a significant way. That I am not sure of.
Welcome Jim Britton! I hope you enjoy learning here as much as I have.
“As a layperson the question I would like answered is… Are the physics of CO2 as a “greenhouse gas” generally agreed upon? I mean outside of a test tube or a laboratory”.
Yes. There is general agreement about what the forcing effect of a given level or rise in CO2 ppm in the atmosphere.
“Does science truly understand the actual effect of a rise in CO2 levels in the atmosphere on temperatures?”
No. Because we do not yet properly understand what the response to forcing is going to be (whether from rising CO2 or some other reason). This is why we are obliged to predict positive feedbacks in order to forecast catastrophic levels of warming from rising CO2 ppm.
So the answer is, put another way, we are confronted with a car of unknown design and parameters. We know the energy content of a gallon of gas. What we do not know is how much of this energy it will take to move the car a given distance. We do not, for instance, know if it has regenerative braking, we don’t know its wind resistance…. and so on.
The basic physics, the energy content of the fuel, is not in doubt. What’s in doubt is how this particular vehicle works.
The alarmist method of argument consists in reasoning from our knowledge of the physics of CO2 which is certain, to suggest that we have an equivalent certainty about how the climate of the planet works. This is what leads to the ‘just physics’ argument. The sad fact is that there are lots of things we don’t fully understand, not because we don’t know the basic physics of the components, but because we don’t understand how they are connected in a particular machine.
Best analogy I’ve seen yet. Wisdom in action, sir.
I too am a layperson but if you think about it, the CO2 / AGW hypothesis has to be total BS.
Why?
Because prior to the industrial revolution the planet experienced lengthy periods in which it was much colder than today yet CO2 levels were HIGHER than today. This is a total contradiction of the CO2 /AGW hypothesis.
The only plausible explanation is that other factors , known or as yet unknown, have a far greater affect on climate than CO2. For example, I think (but I am not sure) than NONE of the computer models of climate account for the activity of the sun, yet to think the sun does not have some influence on climate is preposterous. Also, the most abundant greenhouse gas is water vapor, not CO2. How do the models account for water vapor?? Do they at all ??
If you look at graphs of CO2 levels vs. time going back hundreds of thousands of years or more, you will see that today CO2 levels are about as low as they have ever been. Yet, over the history of the earth, ice ages and warm periods trade places, IRRESPECTIVE of the level of CO2.
Lastly, CO2 constitutes about 0.04% (that is one part in ten thousand ) of the atmosphere, and we are supposed to believe that this, literally , trace gas constituent of the atmosphere controls the climate.
Give me a break.
One day it will be shown that the AGW / CO2 hypothesis is the greatest scientific scam in the history of the world.
P.S. CO2 is great for agriculture production !!!!
This might be helpful:
http://judithcurry.com/2010/12/11/co2-no-feedback-sensitivity/
At the link, read what Colose writes. The 1.0 C per doubling is somewhat agreed upon but I don’t see that we have our answer to plus or minus 0.1 C. Then there’s the question of are we talking about the surface or the TOA to the BOA?
Bob, I like many others here, love your posts. But you really have to understand that people like Grant Foster (I have come across SO many) will never accept that they are wrong, even when the case is laid out as simply as you can make it. There is something inside their heads that tell them they cannot be wrong – I really mean that. It’s a mind problem. I have witnessed contributors on ‘Open Mind'(!) explain to him why he is wrong. I have even done it myself a few years back. He cannot see that he is ever wrong. Even some of his followers hold that the levelling off of global temps is real, but he won’t have any of it. People such as this have a severe mind problem that must hamper them in life, because, when you are wrong, you learn from it – I know I have. Give it up, Bob. Even if the world’s most renowned expert came onto his silly little blog and told him that he was wrong, he would still say he wasn’t. Use your energy in continuing to post excellent stuff.
It is not the ones that refuse to admit error that this kind of post helps.
It is thier followers that look and start to ask questions.
When you are dealing with minds like Foster’s they define as an expert as someone who agrees with them.
Therefore anyone who disagrees with them can’t be an expert, musch less the world’s most renowned.
The Ghost Of Big Jim Cooley
You are perfectly correct.
For want of a better term I would call it a form of ego mania — and mania is really escape and avoidance behavior overriding an underlying depression. If the manic behavior ever stops the depression sets in.
(I really hate psych names because naming things does not explain something or even verify its actual existence. Does the tooth fairy exist? But the tooth fairy has a name! In psych there is this constant renaming and redefining — producing an endless series of papers and books. It is just so much pointless churning of words. It helps no one but keeps a bunch of useless people looking busy.)
Grant Foster spends all his time looking for reasons why he is right. A good scientist would spend a lot of his time looking for reasons why he might be wrong. A good scientist would listen carefully to the criticisms of others. (Thank god that caveat doesn’t apply to poets!) Grant Foster apparently can’t do that.
It would be easier to recognize Grant Foster’s problem if he were fixated on something easily seen to be loopy — (like paper money should be eliminated and replaced by coins, with high denomination coins being made out of uranium since it is so valuable). But he is fixated on rather obscure things that most people do not really understand so his bullshit seems plausible. Ever admitting to himself that he is wrong might cause this man to suicide! (I am sorta joking about that, mods, really I am.)
Many years ago I started to write a poem sort of on this psychological topic but never could finish it. I intellectualize too much to feel very deeply about anything. Here is the poem, uncompleted as I left it.
PORTLAND — IN THE TEST GARDEN
Mellow, yellow melon moon
Above the earthy garden
All was tinctured with your glow
Softened into tenderness
I am a minor port
Conveyor of little thoughts
In unremarkable words
Speaking only to myself
Yet I am as are all men
Iridescent in my soul
And transcendent in my dreams —
Therefore tragic in the world
My heart was burdened with shame
And I sought a lonely peace
High above the city lights
Among the perfect roses
Roses by moonlight outboast
The gloss of any poet
Exceeding the description
That terminal words allow
Roses to shame an artist
The palette wanting spectrum
The brush lacking skill to paint
Their unbearable lightness
Colors purely ethereal
Upwardly drawn by the moon
Oozing upon the petals
Softly bleeding into air
When the fantasy shatters
The mistakes of a lifetime
Confront us in a moment
Oh! There is no art in Hell!
Eugene WR Gallun
PS — That bit about colors bleeding into air — at the time I needed to get my contact lens prescription changed since everything was getting a little fuzzy.
You beat me to the psychosis Eugene! Clinical minds think alike I guess…
Eugene
wonderful words
artful expression
love it
Oh god! I am a minor port ! I meant poet! I meant poet!
Eugene WR Gallun
I agree, Bob really shouldn’t let these kids get under his skin. He is unintentionally rewarding them with the exact thing they seek: attention. [snip that’s a bit over the top – Anthony]
My apologies Anthony. I was actually trying to be as neutral and inoffensive as possible, but I will respectfully bow to your judgement.
TrueNorthist, they don’t get under my skin.
The Ghost Of Big Jim Cooley:
You say
Sorry, but there is a difference between knowing and accepting.
Foster knows that everything he posts as Tamino on his blog is ‘wrong’.
Foster is an academic so he benefits his career by publishing in peer reviewed literature. Hence, anything he posts on his blog under the name of Tamino is work he assesses to be not capable of obtaining publication in peer reviewed literature. Indeed, Foster proclaims he is not willing to put his own name to stuff when he posts it on his blog under the name of Tamino.
Richard
Sounds like a split personality, one a dishonest loon the other an academic. Put them together though and I think you end up with a crook.
Gradually over time all the data is being corrupted due to computer tampering, constant fiddling with incoming information, various schemes to make things ‘better’ which instead twists it further and further away from reality.
This is also how the human brain works: we exaggerate things over time. Anyone looking at the evolution of various human fashions can see this. Things balloon in size, get more elaborate over time and then a reaction occurs and the previous fashion is mocked as stupid and it is ‘simplified’ down and the cycle begins all over again.
This tendency to over-elaborate and exaggerate infects science because this is how our brains work insidiously. This is also why, looking at more and more details, we get more and more confused rather than clearer thinking.
If we add more and more information to any system, it gets more and more muddled, not clearer. The ability of computers to suck in near infinite information means all things it explains after crunching the data is murky and confusing, not clearer. This is why focus on just one or another element helps give us an idea about trends.
About trends: we are in an Ice Age Era. We know for certain there are previous Ice Ages and these are getting stronger, not weaker and all begin the same way and end the same way. The actual trigger is in debate but the fact is, we are not going to see a warmer and warmer earth, probably never again.
Keeping this fact in mind means not worrying about warming but worrying about how to possibly prevent the next Ice Age which is just about due to happen.
a series of compounding statistically insignificant changes
=========================================
Bob, you have hit the nail on the heat. Each of the adjustments individually is not statistically significant, but over multiple adjustments these add up to to create statistically significant bias.
The question that is never asked is this, if the specific adjustment is not statistically significant. why make it?
The second question never asked, is the net sum of ALL adjustments statistically significant? Is the trend the result of the raw data, or the adjustments?
In a dataset that ranges from 0 C to 32 C for SST collected sparsely over a vast globe, one might consider a 0.047 or 0.089 per decade trend as insignificant regardless of adjustments.
With the average temperature and heat capacity of the ocean vs. the atmosphere, all these gyrations on the oceans proving the warming is still happening are misguided by the warmist said. If the heat is in the ocean, the sun put it there and AGW theory is 109% false.
All the ERSST fudging is doing is disproving their own argument. Yet, The cult is too blinded to see that they are wielding the shovel to bury their own theory. Pathetic.
Thanks Bob, Grant Foster will never admit to being wrong [about this episode], it isn’t in his personality, which is why he’s such a loner. Ditto for Miriam O’Brien. They both seem to have the same issues: egos the size of a bus, inability to see where they’ve made mistakes, inability to put their own name to their words, and a mental fixation on what we write here. Miriam O’Brien must be so
dizzybusy these days writing hateful posts countering everything said here I have to wonder if her one-woman consulting business that she runs out of her house isn’t taking a hit. From what I understand of Grant Foster, he runs a consulting business out of his domicile as well.I think neither of them plays well with others, especially when they are challenged on their opinion. Must be tough to be a client of these folks.
While mildly amusing, I object to calling Foster Hansen’s Bulldog, since it associates the falsified hypothesis of manmade climate catastrophism with confirmed natural selection.
I agree.
Let’s make that Hansen’s Chihuahua.
Interesting question, how she earns her money. Is she sponsored by “big money” or is Maurice Strong among her paying guests? Normally, a hobby like the one she indulges in and that turned into a full-time job doesn’t pay for itself. OK, the quality of her blog is scientifically negligeable and it’s traffic is as well, but it takes some time to put all her name-calling profanities online.
She doesn’t transform waste to energy but her energy to waste.
Well he did recently:
I was wrong
Posted on July 11, 2015 | 45 comments
Not long ago I posted about results from Prashant Sardeshmukh of a study he and others did regarding the frequency of hot days, based on reanalysis data.
I considered the results so implausible that I concluded they had made a “rookie mistake” in using a different cutoff limit for the two time spans they compared, a mistake which would completely invalidate their results.
I haven’t seen the data, but I’ve heard enough testimony from credible sources that Sardeshmukh et al. are both honest and competent. I am now convinced, the mistake was mine.
Yes, just two weeks ago. And our fair host is criticizing other’s egos when he once claimed that he was a hero to thousands! https://twitter.com/wattsupwiththat/status/599205381882019840
“I haven’t seen the data, but I’ve heard enough testimony from credible sources that Sardeshmukh et al. are both honest and competent. I am now convinced, the mistake was mine.”
Note that he is admitting a mistake only because enough “credible sources” tell him so. If those sources were wrong about this, then those sources could be wrong about other things, and that would shatter the world of someone who deals with Truth-by-Authority.
Anyone that he DOESN’T respect is not going to get the same consideration. Note that he admits he’s wrong, not based on any evidence, but because of the opinions of others that he respects.
Thanks Phil. But I was referring to this episode, not in general….I’ll clarify. Good on him though, and good on Bob Tisdale for noting he made a mistake in this post too.
Maybe they really believe what they are saying – research shows that we can implant memories that never actually existed. “Brainwashing” is actually very easy. This research has shown it can be done in as little as three interview sessions and then let the brain create the virtual reality.
http://www.cbc.ca/radio/quirks/quirks-quarks-for-march-14-2015-1.2994209/creating-criminal-memories-1.2994220
Oh nooos. Maybe I have been brainwashed by this site!!
Ah, no, more like 50 to 60 years ago in school and University when we were actually taught about climate and weather.
Bob, all I can say is keep calling them out. You have obviously hit a nerve with them and sooner or later the really smart people will look at both arguments and draw the right conclusions.
These people have been going unchallenged for so long they are starting to panic, in my opinion, when an extremely well reasoned rebuttal to all their shenanigans is presented.
While it remains to be seen, historical analogs and cycles all point to a cooling cycle in the next couple of decades, and if that comes to pass some of these people may be run out of town in tar and feathers.
Anomalous cold is far more impactful than warming on crops, energy needs and human survival. You can run all the models you want showing warming, but when you have widespread killing frosts and rainfall pattern changes in our global growing areas and bitter winter cold, people actually die. You can’t hide this.
All last winter the media hid this fact! The NYT, for example, used the word ‘blizzard’ less than six times last winter and one of the times was them making fun of a blizzard that missed Manhattan but hit my own home very hard, just to the north of Manhattan.
There was zero discussion about the impact of these blizzards and the lower temperatures last winter. At no time did the President of the US mention blizzard deaths or offer any help whatsoever.
Figure 3 pretty much says it all. The adjustment are skewed at the end points, giving the appearance of a trend over the hiatus period.
The ERSST.v4 adjustments minimizes the 1998 super El Nino. It stands out like a sore thumb in all the datasets prior to ERSST.v4. After ERSST.v4, the super El Nino if 1998 is no longer super. It is simply average.
Which makes the ERSST.v4 adjustments unfortunate for science. A significant climate event took place in 1998. Something to this days climate science cannot explain. Rather than look for explanation, they are minimizing it away. Pretending it never happened.
The New Science. Don’t search for explanation. Adjust the data to fit expectations.
If you let someone get away with murder, the next murder becomes easier. Without any pressure of investigation, eventually the follow on murders will get sloppy and lead to conviction for the crimes.
The excellent work by Mr. Tisdale should be continued. The climate alarmist community is getting very sloppy and will hopefully lead to their downfall. I say hopefully due to the tremendous impact of government – it is very hard to defeat the Big Bully that has unlimited resources for its agenda.
I didn’t phrase my post correctly – a different shot:
“In a room where
people unanimously maintain
a conspiracy of silence,
one word of truth
sounds like a pistol shot.”
Czesław Miłosz
The climate alarmist community has always been very sloppy, but when someone yells “WATCH OUT!” most people tend to run for cover, first, and figure it out later. In this case the average person has little or no way to really figure it out, except that over time things “just don’t add up.” That’s what we’ve seen, slowly, in polling data. Fewer and fewer people believe the alarmist shtick. Right now the doubters are finally in the majority, and climate issues are not a significant concern. But it won’t take a narrow majority to make this go away. It won’t go away until the alarmists are a substantially small group. That will take time, and continued pressure from sane folks everywhere.
This debate is , interestingly , a test of John Cook’s thesis that exposure to sceptic sites makes one “dumber” , but with surprising results . Let me demonstrate :
Firstly by “dumber” JC does not mean nonvocal , because , if anything sceptics are too vocal for the likes of politicians and some Govt officials . No he means becoming more ignorant or dull witted with exposure to sceptic sites , so lets examine that :
More ignorant? not if my experience is a guide . From knowing little of the origin and existence of the global data , I can know look at the data, have, through contributions such as those from Bob Tisdale and many others and the ref pages here, become aware of the various ocean and atmosphere phenomena of which i was ignorant , and have invested in textbooks and down loaded papers .More ignorant with time? Definitely not.
More dull witted? Well if you are tempted to engage in the debates here you soon become aware that there are many people cleverer and more knowledgeable than yourself , and there are always the pro-AGW individuals who , nimble witted and knowledgeable , will take advantage of any weakness in your arguments , Consequently people will tend, in an evolutionary sense, to become more sharp witted with time if the sceptic site has a large number of members and is open to opposing views , as WUWT has and is.
There is however a situation where Cook may be correct , and that is the case of prowarmist sites closed to sceptic arguments , eg the Guardian and HotWhopper sites. Without the need to defend their arguments from opponents , Cook’s thesis may well apply and the consequence is that it is the WARMIST sites where exposure will lead inevitably to becoming dumber. Bob’s experience may be the proof of Cook’s thesis , but it applies to closed , ie warmist , sites , not to open , ie sceptic sites .
That was my surprising conclusion – JC is correct but not in the way he expected.
There is a very big industry in telling people they’re smart if they’ll agree with you/buy your product, given the current narcissism phase spurred on by social media. Combine this with very sophisticated mass sociology, advertising/marketing tricks, PR spin/manipulation and the greatest communications medium in history.
The real problem is that the NCDC can put out any crap paper rationalizing adjusting the temperature trend up, and the climate prophesy community and the Grant Fosters will back them up. This latest adjustment is only the 6th or 7th such step/new adjustment process.
The prophesy community just jumps on board with every new adjustment rationalization.
And then the NCDC goes on to make changes the temperature record by a larger amount than the new process actually justifies. The changes are implemented in Tom Karl’s office, not in a scientific journal. There is NO transparency in how these adjustments are actually implemented on the NCDC’s computer systems. It is essentially impossible to track how much all of the adjustments over time have added to the temperature trend. It changes every single month anyway.
Luckily ordinary people have no tolerance for any excuses to “adjust” data. Simply to show that it has been done renders everything else untrustworthy in the minds of voters. The same goes for Satellite data though too, so be warned!
Yes, ordinary people would be repulsed by the
cheatingadjusting going on if they knew. Ah, but how will they ever find out since the mainstream media is the propaganda arm of the state and is not likely to blow the whistle on any of the government funded agencies anti-science agenda.One hopes the internet is helping some.
I think it’s very important to hold scientists accountable for their adjustments to data so for that Bob I appreciate your efforts.
From a bigger picture perspective even if we take NOAA latest adjustment as fact its still does not meet the requirements of CAGW. The earth warming less than 1 C in a hundred years is not going to cause the devastations we have been hearing about for the last 30 years.
Anyone who questions the “science of climate change” is labeled a denier but the more I look this the more I think it’s the other way around. We are the ones who believe that climate changes over time do to natural causes. It gets warmer and it gets cooler regardless of anything we as humans do. This has been happening for millions of years.
AGW seems to feel that the temperature/ climate should not change up or down and that the current temperature needs to be maintained at all costs. In my mind they are the ones denying climate change.
An important distinction IMO. Also one of the easiest points to win when arguing with an open-minded “believer” of the new climate orthodoxy. I often gently rebuke anyone who hurls such nasty epithets my way and calmly take full advantage of the subsequent contrition. Most ordinary folks will shrink rapidly away from such language if called on it. Shame is an excellent motivator for most, but as the article ably demonstrates there are notable exceptions.
Where are the double blind experimental controls in these adjustments? Why does climate science continue to ignore the most basic data quality control requirements of science?
If the adjustment process was correctly designed, there would be no question over whether an adjustment was correct or not. Rather the discussion would be over whether the experimental design was satisfied.
There is a huge, fundamental flaw in the adjustment process. There is no single agreed 100% correct temperature sample to use as a baseline for comparison to judge the results of the adjustments.
Consider an industrial process such as refining gold. You would judge the quality of your process by comparing the quality of your results against a sample of pure gold. You would adjust your process to maximize the yield. In this sort of process the results control the adjustments.
However, since temperature data has no such “sample: to use as a baseline, you cannot know looking at the results whether an adjustment is good or bad. Instead, you should make your adjustment solely based upon the raw data, ignoring the results.
But this is not what has been done. Instead Climate Science has created a feedback loop between the adjustment process and the adjustment results, as though they were refining gold. This allows the results to drive the process instead of the raw data driving the process.
However, this is a nonsense because there is no way to assay the quality of your temperature result. It isn’t like gold. You can’t measure the quality of the result, so you can’t base your adjustments on the result.
As such, the adjustment process is fundamentally flawed. It is simply an exercise in methods shopping until the results match the expectations the person making the adjustments.
Totally agree, if a study of a new drug is not carried out on a double blind basis with a mixture of new drug, no drug and placebo, it cannot be published in a professional journal (at least not in the UK).
“Consider an industrial process such as refining gold. You would judge the quality of your process by comparing the quality of your results against a sample of pure gold”
==========================================
The closest thing to gold we have is the satellite data sets and the USCRN is (USA and a it of Canada) a network of around 115 ‘pristine’ weather stations designed to avoid the issues found by surface station project. They match each other fairly well, while the surface record is diverging from the satellites at two degrees per century.
http://realclimatescience.com/wp-content/uploads/2015/07/ScreenHunter_243-Jul.-24-19.38.jpg
The number of USHNC stations that are part of their data base, but not being used, is increasing dramatically. Up to 40% of the stations are filled in from stations each month now. It is not, IMV, a coincident that the rural stations are missing, being filled in from urban areas subject to UHI.
https://stevengoddard.wordpress.com/2014/12/13/ushcn-replacing-rural-temperatures-with-urban-ones/
The data was right in 1998, but not totally right an adjustment was needed in 2000. In 2002 they noticed the data needed some more tweeking to get it right. 2005 rolled around and once again they noticed the data was just wrong, some more tweeking was needed. The very next year in 2006 they notice the data was off so they adjusted it again. There all fxed in 2006. But 2009 rolled around and it wasn’t right so more adjusting was necessary. 2011, you guessed it more tweeking of the data to get it just right. 2013 yet again a needed adjustment of the data. 2015 well they needed to bust this hiatus, hmm adjust the data again.
Don’t worry in 2016, 2017 or 2018 they will make another necessary adjustment that will make the data correct. That is until 2020 when another adjustment is needed because they were not smart enough in 2016. lol
So basically, the data is worthless because it will never be “correct” and will always need adjustments.
Another post devastating to the AGW group and our government-funded NOAA. Took me a while to read it but well worth the effort. Thank you.
Meanwhile, Obama went to Kenya which just announced they will reduce their CO2 output by 30%…and Obama said they will get $40 billion for this.
The preparations to bring 3rd world nations aboard the Global Warming Express continues and if all these countries get $40 billion this will be more than $5 trillion over time…all of which will come from taxing the rest of us.
Interesting. Kenya promises to reduce CO2 30% and the US promises to pay them $40 billion. Kenya will ask for the money ahead of the reduction and the US will ask for the reduction ahead of the money.
In the end Kenya will not actually reduce, because once they reduce the US will have no reason to send them the money and the US will not send the money because once they do, Kenya has no reason to reduce.
However, as far as promises go, the mission is a great success. Both sides make massive promises, knowing they will never have to deliver. Instead it will be people years from now that suffer, as Kenya will claim the US has cheated them and the US will claim Kenya has not lived up to its promises.
Kenyans will hate the US and the US will blame Kenya. Kenyans will send “terrorists” against US interests and the US will respond by bombing Kenya. The bombing will cost the US $40 billion and reduce Kenya’s CO2 by 30%.
And there was much self-congratulation, high-fives, victory laps and self-patting on the back.
Kenya is (wisely) investing in geothermal plants: http://www.worldbank.org/en/news/feature/2015/02/23/kenyas-geothermal-investments-contribute-to-green-energy-growth-competitiveness-and-shared-prosperity
Thanks for showing to me as a layman the dirty tricks and shallow waters of this fascinating ‘hide and seek’.
It turns out that I’m the average height of a man, considering all of mankind. But as we know the Chinese aren’t terribly good at measuring things, I weighted their averages at 1/6th the rate of everyone else. Sadly, it turns out that I’m shorter than the average height of a man, considering all of mankind.
Jquip
You’re ok…When the worlds Mankind Height Authorities sent out their height questionnaire, the shortest of the worlds population overstated their heights in most cases. You are actually taller that the average Man.
So, at this time, no one really knows (and agree on) what the surface and near-surface temperatures have done over the last 10, 50, 200 or 1,000 years.
The only thing more powerful than The Blob… is The Bob!
Thanks for the reminder, Rick K. I wanted to post a “The Blob” update a couple of weeks ago, but this nonsense has eaten up a lot of my time.
Cheers.
Isn’t anybody else old enough to remember the “I wouldn’t be caught dead without my Foster Grants” sunglasses ad campaign? I think Grant Foster’s mama had it in for him from the begining!
Had the temperature trend done what it was supposed to do we would not be having this discussion.
That may be true, but certain things are affected. I do not have the numbers for NOAA, but for the latest GISS changes, the following occurred.
The period of statistically significant warming greatly decreased from May to June. In May, it was from November 2000, or 14 years and 7 months which is pretty close to NOAA’s 15 years. But now, it is from August 2003 or only 11 years and 11 months.
One side assigns a high level of certainty about a theory and spends a great deal of time trying to discredit those that question, not just the absurdly high certainty but the foundation of the speculative theory………to the extent that observational/empirical data is taking a divergent course.
Sometimes, time spent trying to discredit those with legit, skeptical questions/points is much greater than time spent evaluating the discrepancies between theory and real world.
This defensive, non scientific, closed minded posture is the recipe for leaving new knowledge and learning behind in pursuit of venues that provide assurances of being right and the feeding of ones ego.
Let me first quote that Hot Whopper said: “…HadNMAT2 is used to correct a bias in ship sea surface temps only. For the period he’s looking at (in fact since the early 1980s), they only comprise 10% of the observations. The rest of the data is from buoys, and HadNMAT doesn’t apply to them. They are much more accurate than ship data anyway. So much so that if ship and buoy data are together, the buoy data is given six times the weighting of ship data.”
Just precisely why are they giving buoy data six times the weight of ship data? Problem with buoys is that they are the cause of Trenberth’s missing heat, a technical question that is still unresolved. Trenberth and Fasullo, in their 2010 paper in Science, state that “…Since 2004, ~3000 Argo floats have provided regular temperature soundings of the upper 2000 m of the ocean, giving new confidence in the ocean heat content assessment—…” If you then look at their data you find that in the five years following the introduction of the buoys 80 percent of “..Total net energy change including melting Arctic sea ice, Greenland, Antarctica, glaciers…” has simply disappeared. If I had been the reviewer I would have sent them back to check the buoys but they did not do that and chose to publish it as “missing energy” that his now famous as Trenberth’s missing heat. The technical question of how the buoys managed to abscond with this energy is still unresolved and until that is settled I would not depend on buoys for any critical measurements such as correcting data taken by other means. For one thing, calling them “much more accurate than ships’ data” is inappropriate for a technique capable of losing track of eighty percent of total energy in the oceans in only five years.
In other words, according to NOAA, global sea surfaces warm faster than the marine air directly above the ocean surfaces.
No, according to NOAA, global sea surfaces warm faster than the night-time marine air directly above the ocean surfaces. Why do you suppose that shouldn’t be the case?
Thanks for catching that, Phil. I’ve crossed out the text and the references to that discussion and eliminated those two graphs.
True, and according to my experience living on the coast, the local day time air T is consistently warmer then the local SST.
No need to refer to a “hiatus” to show that something went terribly wrong with climate science.
Trend of UAH 6.0 beta over oceans, between December 1978 and June 2015 is 84 mK/decade. During the same timespan ERSST v4 gives 106 mK/decade.
Now, the latter rate is 26% higher than the former one.
According to theory it should have been the other way around, rate of warming in the troposphere is supposed to be some 20% higher than at the surface.
If satellite measurements of lower tropospheric temperatures are correct, that means sea surface temperature rate of warming should be 70 mK/decade, not 106 mK/decade. That is, ERSST v4 overestimates this rate by 51% in the last 36 years and 7 months.
Alternately, it is also possible, that even basic theory is flawed. That is, with increasing sea surface temperatures average tropospheric lapse rate is not decreasing, but increasing. That’s a devastating blow not only to sophisticated computational general circulation climate models, but even to simple ones.
It can only be the case, if increasing humidity in the boundary layer, which follows from the fact, that equilibrium vapor pressure is a steeply increasing function of water temperature, is decoupled somehow from humidity of the upper troposphere. To maintain an increasing trend in lapse rate, the upper troposphere should get ever drier, even as column integrated precipitable water content is increasing.
If that’s so, contribution of water vapor (and high level clouds) to the overall greenhouse effect should decrease with increasing sea surface temperature, which means a negative feedback.
As in the no feedback case warming effect of CO2 is calculated to be 1.1 K/doubling, with a negative feedback like that it should be less, perhaps substantially less than that.
So, it boils down to either-or.
Either ERSST v4 is overestimated vastly, in which case climate sensitivity is actually low, or theory is flawed, warming sea surface produces less moisture in the upper troposphere, not more, perhaps by making precipitation more efficient, in which case climate sensitivity is — you guessed it — low.
I always wandered how much of the additional energy from increased DLWIR when into accelerating the hydrological cycle, vs. heat.
Bob Tisadale:
There seems to be a minor typo. that you may want to correct.
Where you write
“That text was included with my first presentation of the graph their complaining about.”
I think you intend
“That text was included with my first presentation of the graph they are complaining about.”
Richard
Thanks, Richard.
The quote from Sou in the head post seems to be out to lunch (bold mine):
10% of the observations? In Kennedy et al. in JGR (2011), we find Figure 2: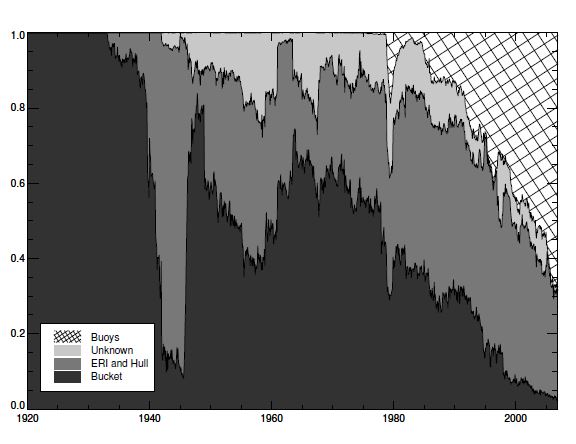
with the caption
It is not difficult to see that from 1998 to 2006, the buoy percentage increased from somewhat less than 40% to almost 70% with the corresponding drop of ship measurements from slightly more than 60% to 30%. The only figure resembling 10% refers to the bucket measurements whose numbers have indeed declined more dramatically in the last thirty or so years but do represent the totality of the ship measurements. The split in the corresponding percentage weights for buoys:ships in ERSSTv.4 would have gone from 82:18 to 94:6 during the same time period.
oops!
Correction: … “do NOT represent” the totality of the ship measurements.
Also, the “bold” does not appear very bold in the Sou quote for some reason. Should be on the sentences:
“For the period he’s looking at (in fact since the early 1980s), they only comprise 10% of the observations. The rest of the data is from buoys, and HadNMAT doesn’t apply to them.”
Thanks Roman, so the percentage for the period of the pause is what is cogent.
What is the unknown?
The “unknown” refers to those ship measurements for which the method used in obtaining the measurement is not known. The paper describes that in many cases a method has been assumed from the nationality of the ship.
Section 3.3 of the paper containing Figure 2 indicates the variety of assumptions made in assigning metadata is quite wide. If the same “correction” is then applied to all members in a group, this can introduce unknown biases so the uncertainty bounds not only become wider, but also more difficult to estimate properly.
Or it could be: “of the graph they’re complaining about”
Interesting how often research results from climate scientists cannot be readily replicated due to lack of providing important information. Maybe climate science has added an addendum to the scientific principle stating to the effect, “What others don’t know can’t hurt me”.
Thank you again for another fine post Bob. I occasionally read Tamino and am puzzled and shocked that he too often displays an inability to compare apples to apples. It would be interesting to hear of his credentials.
It is all quite simple really.
If SST’s really are rising, this heat will quickly transfer to the atmosphere via evaporation. Satellites show no sign of this since 1998 .
Unless Foster can show a fault in the satellite measurements, he cannot defend Karl’s fake results.
Kudos to Bob Tisdale for very productively tying these people in knots by use of facts and science.
Debating an alarmist is like this…
While he is playing pea thimble con games, his sponsor (the government) is picking your pocket.
Humans not so smart ?