This is funny:
“According to a Coast Guard officer, the icy conditions “are the “worst he’s seen in 20 years“

“A carefully planned, 115-day scientific expedition on board the floating research vessel, the CCGS Amundsen, has been derailed as the icebreaker was called to help resupply ships navigate heavy ice in Hudson Bay.“Obviously it has a large impact on us,” says Martin Fortier, executive director of ArcticNet, which coordinates research on the vessel. “It’s a frustrating situation.”During the summer, the Amundsen operates as a floating research centre with experiments running 24 hours a day. This year it was scheduled to reach North Baffin Bay.But the icebreaker has been rerouted to escort commercial ships en route to resupply communities in Northern Quebec on the eastern side of Hudson Bay.Johnny Leclair, assistant commissioner for the Coast Guard, said Tuesday conditions in the area are the worst he’s seen in 20 years.”
Full story: http://www.cbc.ca/news/canada/north/ccgs-amundsen-re-routed-to-hudson-bay-to-help-with-heavy-ice-1.3162900
There is a still a lot of ice up there:
![N_bm_extent[1]](https://wattsupwiththat.files.wordpress.com/2015/07/n_bm_extent1.png?resize=720%2C778)
http://nsidc.org/data/seaice_index/images/daily_images/N_bm_extent.png
h/t to WUWT reader “catcracking”
More ice in Hudson Bay?
But it’s supposed to be warming,
Yet another part of the world
That is not conforming;
These real world observations
We will have to curtail,
Or the whole global warming scam
Is likely to fail!
http://rhymeafterrhyme.net/real-world-observations-a-threat-to-us-all/
The anthropogenic warming will put on brakes
to the great ice express
at the the southern shore of the Great Lakes.
More ice in Hudson Bay?
Damn, thought we’d saved it for another day.
We planned and planned to study melting,
Alas we found the weather pelting.
But have no fear my reader dear,
Yes ice has collided
But the world’s still frieded.
Pamela Gray — frieded? Now that took courage. — Eugene WR Gallun
Pamela Gray
had her day
lamenting the nice
ice.
(Look up ‘clerihew’ in your dictionary.)
Geir:
Fun form of poetry
To misspell a wordy
But courage it apparently
takes of an Edmund Clerihew Bentley
Ordinary in no way is the Grand Old Hudson Bay
the centre of the ancient Laurentide
climbing up the isostatic stairway
in adulation of the sun, from Akhenaten to Svalgaard
the incontestable ruler of the North Atlantic Oscillations
for centuries past, the host to the true magnetic pole
boasting the lowest of the low in the gravity computations
with mystifying Nastapoka’s arc perfection
no other place on this beautiful blue globe
can equal the splendours of nature bestowed onto you
We salute you the Grand Old Hudson Bay.
Vuk, not even poetry makes your “Solar drives NAO” thesis smell better!
Ms Grey, quite so
analysing data and hypothesising possible causes, in no way is a match in the quality for the empty adulations professing the stagnate science stuck in decades old gramophone groove.
Good night, and an enduring good bye to you!
Theory says very low solar geomagnetic activity causes more negative AO and negative NAO… The Great Lakes should ask Santa to bring bigger icebreakers for Christmas
They are. Congresswoman Miller from Michigan has introduced a number of bills in Congress seeking funding for new icebreakers.
Russian Solar scientist working in Scotland, Valentina Zharkova, claims to have discovered two out-of-phase cycles of Solar activity, “inner” and “outer,” roughly but not exactly 11-year-long each, which produce maximums and minimums when they coincide and become opposite.
Zharkova and her co-workers warn that we are going to have a prolonged Solar, Maunder-like minimum for a couple of decades, which would mean very cold winters and cool summers. It has been all over in the news, don’t understand why WUWT is not interested.
not all over in any news in Aus … will check with European contacts … as I read it [Royal Astrnmcl Soc -Maunder minimum] she/they warn that there MAY/ COULD be a Maunder like minimum in the 30’s and 40’s … but not at all surprising in this inter-glacial period
They’ve given it a very brief mention in the news round-up bit, Alexander. But I’m not surprised that they’re making little of it as it goes against their belief system. Or, should I say, their ‘Lief system’? 🙂
Even if they did get stranded in pack ice, you think you’d hear any horror stories on the evening news about their dire situation?
Thought not.
And yet, not two days ago, polar bear biologist Andrew Derocher assured twitter folks that the ice on Hudson Bay was “almost gone.”
My take here, with some flash backs to the heavy ice around Newfoundland in late February this year that also required icebreaker assistance and map of where the communities mentioned in the story are located:
http://polarbearscience.com/2015/07/22/heavy-ice-in-hudson-bay-derails-arcticnet-global-warming-research-plans-irony-bites/
Dr. Susan Crockford, zoologist
Arctic ice ‘grew by a third’ after cool summer in 2013
The volume of Arctic sea ice increased by around a third after an unusually cool summer in 2013.
Researchers say the growth continued in 2014 and more than compensated for losses recorded in the three previous years.
http://www.bbc.com/news/science-environment-33594654
There are precious few high level scientists who publicly speak against the wild claims made by degree-d and even tenured scientists. You are bold and I love it!
I often check out your site, Susan, even though I’m not deeply interested in polar bears, because you often have great collections of maps. Also I learn surprising things. One of my favorites was when they put radio collars on the bears, to see when the bears came to shore, and the collars were indicating the bears were still out hunting on the ice even when the “official” map said there was no ice. (Obviously there was ice, as the bears don’t hunt in open water.)
It is odd those fellows are withholding their radio-collar data this summer. I wonder if the people funding them get mad if they accidentally produce data that shows the bears have plenty of ice to hunt from, and have eaten so many seals they are downright fat.
One of the more interesting things I learned at your site was that too much ice is actually bad for both bears and seals. If the ice is too solid there are no air-holes for the seals, and without the seals the bears go hungry.
I’m glad your site is there. A scientific voice is needed, for all I do is poke fun at the situation.
https://sunriseswansong.wordpress.com/2015/06/26/barely-bearable-media-silliness-regarding-polar-bears/
Thanks for that Caleb – it’s exactly why I do it!
The more you know, the better your BS metre works. You don’t have to know it all, you just have to know enough to say to yourself, wait a minute. I need to check this claim more thoroughly before I accept that it’s true.
all the best,
Susan
My BS metre has been going off like ten ambulances for years, but I do have some pity for young fellows just getting out of college with degrees in biology, as my son is one. With college loans the size of a mortgage, so far he’s worked a summer job as a park ranger and a winter job in a coffee shop. He is far more honest than I was at his age, but I wonder how badly he would be tempted to BS, if he had the chance to roam the tundra shooting giant bears with darts.
This is a disconnected piece of a poem which was published in 2015. It was written by an English professor named Nicolas von Maltzahn who lists his intellectual interests as — “seventeenth-century literature”, “literature and religion”, “scholarly editing” and “history of the book” — all of which go far in explaining the language he chose to use. I abuse him by bringing this piece of his poem to this crowd who I think will find it amusing.
An excerpt from the poem entitled “From Hudson’s Bay”
He had met with white Bears
40 Leagues out at sea
and had seen one of that sort of Animals,
which though by reason of its shape,
it did not appear so much bigger than
a large Smithfield Oxe, (for that was his Phrase)
yet he judged it to exceed it very much in weight
for having cut off one of its Paws,
they found that (without the Leg)
to weigh about 50 lb.
By posting this part of his poem here do you think I have put this man’s job in danger? Will the green hounding begin?
Eugene WR Gallun
That’s a poem? It sounds like it might make a PBS documentary, if read in an English accent. Here’s a poem:
I think that I shall never see
A bear reciting poetry.
They are a poem; their looming awes
Their massive handshake gives you pause.
Caleb — Bravo! — Eugene WR Gallun
Caleb, new franchise to found – that photograph with youre text
‘our bears have plenty of ice to hunt from, and have eaten so many seals they are downright fat.’
raising
‘polar bears arctic seals to go’ fastfood.
collar data accepted.
What makes bears fat is not fast food, but slow seals.
Actually, the st photo shows hudson clearing up nicely.
This is the slowest melt of the Hudson Bay ice in many, many years.
And the melt season is rapidly ending. All Ice Ages start in the Hudson Bay region, not the North Pole.
Gums….it’s almost August
There’s six or seven more weeks before minimum Arctic ice in mid-Sept. I think NSIDC (which has been “improved” to the point where navigation of the site has become quite difficult for me. I do not think I am javascript compatible.) NSIDC has graphs as does DMI and so does WUWT http://wattsupwiththat.com/reference-pages/sea-ice-page/
Don K,
While that may be true on average, it is not necessarily true for any particular year or specific location.
Cold there now, and more cold in the forecast:
http://realclimatescience.com/wp-content/uploads/2015/07/ScreenHunter_9953-Jul.-20-08.25.gif
Have a look at the Canadian ice report for a very different view
Got a link, Wayne?
WUWT sea ice page or see comments below.
“Actually, the st photo shows hudson clearing up nicely.”
I guess you better get up there and explain that to the Coast Guard, huh?
My take on it? You are some guy (whom I suspect may be a warmista) sitting in his living room looking at a computer screen, and the people manning the icebreakers and resupply ships are on site in the frozen Hudson Bay, and just maybe have a better understanding of the actual situation…”actually”.
“Actually, the st photo shows hudson clearing up nicely.”
So, you up to a swim in the “bay” Gums? Good way to win a “Darwin award”.
michael
It is not “clearing up nicely” at all. First, the last bits of ice are suppose to be in the south and west of the bay, not over on the east side. Second, the longer the ice floats about the slower the water is to warm up, and the quicker it chills in the fall, and the quicker it chills the quicker the ice forms.
Most people in the northeast USA have little idea what a buffer Hudson Bay is, when the first arctic blasts come south. It is amazing how that water warms the air crossing it. Once it is frozen (usually in late November), the air crossing the bay stays much colder. Often you can notice the temperatures in the northeast get sharply colder, as soon as the bay is frozen.
To have so much ice hanging around this late is not “nice” at all. I don’t want another cold winter. Heck, the snow-pile in Boston only melted away a week ago. If Hudson Bay freezes up early, the only hope is a rip-roaring El Nino, and Pacific winds blowing west-to-east right across the USA, and no north winds at all.
Most frustrating is the NRL ice-concentration map. If you check out the Sea Ice Page and run the 30 day animation, you’ll notice the animation ends with an extended forecast. For a month now that extended forecast has been showing Hudson Bay’s ice swiftly melt away, and the bay become ice-free. But the ice just lingers and lingers.
https://sunriseswansong.wordpress.com/2015/07/04/arctic-sea-ice-hudson-bays-slow-thaw/
speaking of cold winds, here in scotland the wind has been much colder this summer when coming off the atlantic than i can ever remember,maybe just my memory though.
In this case your memory is working, as the Atlantic is colder than it has been between you and Iceland. The Atlantic seems to be showing the signs of a change from “warm” AMO to “cold”. The complete change isn’t expected for a few more years (by Bill Gray) but the NOAA graph is starting to show a wobbling back and forth between the two phases.
http://stateoftheocean.osmc.noaa.gov/atm/images/amo_short.gif
In Upstate NY, it has been a cold, wet summer, too. This week is normally the hottest of the year and our highs will be below 75 degrees F and nights at below 55 degrees F. Not one day in the 90’s this summer, much less any 100 degree days at all.
So much for Warmest Year Evah.
Keep your fingers crossed. Sometimes these cool summers give way to really lovely and balmy Septembers.
‘ Second, the longer the ice floats about the slower the water is to warm up, and the quicker it chills in the fall, and the quicker it chills the quicker the ice forms.’
While this is strictly true, this is usually a warmist argument. In fact the chiller the water is, the /slower/ it further cools down. When it freezes, the cooling basically stops. The /air/ keeps cooling down much faster after the sea is insulated by ice and snow cover.
Quite true, Hugh. Open water leads to more cooling of the water through all sorts of dynamics. Just the power of cooling-caused-by-evaporation is boggling. Then the fact the water gets mixes by wind and waves keeps warmer layers from sneaking in under the ice.
However I confess I was being completely selfish, and rather than focusing on the cooling of Hudson Bay waters, I was focusing on the cooling of backyard tomato plants.
If you run the NRL 365-day-animations of sea-ice concentration and sea-ice thickness, available under the daily maps on the WUWT Sea Ice page, you can see how swiftly Hudson bay froze over, north to south, last autumn, and then see polynyas form on the northwest coast as the winds shoved all the ice to the southeast.
Most people in the northeast USA have little idea what a buffer Hudson Bay is, when the first arctic blasts come south.
********************************
many of us in NE US (like eastern maine) affected more by the gulf of maine. can really tell how the water warms the air.
north/northwest not affected by gulf and can see huge differences after bay freezes over and ability to warm removed.
How do you get that way off base idea Gumz?
Looks to me that the orange markings are for ‘average ice extent’ for July 21st. Hudson Bay has way more ice than the average.
Of course, you could always go and personally check the ice, take pictures, feed the bears, and then show us proof that Hudson Bay is almost clear.
Not fair. Gumz can’t first feed himself to the bears and then deliver a proof. Chronology matters.
Caleb
July 25, 2015 at 10:26 am
What makes bears fat is not fast food, but slow seals.
____
yes, ON the ice seals are culturized slow food for distinguished polar bears.
Beyond, THE SEALS are fast predators feasting on fastes fish, their fast fish food.
Hans
The problem with changing temperature data sets to meet the agenda doesn’t actually change the energy properties of the Earth. It only leads to bigger problems in future when things like Arctic ice don’t match their warming because the actual planet doesn’t match their manufactured warming.
A cold North Atlantic ocean leads to a cooler current flowing towards the sinking zones in the Arctic. The result is less warming of the ocean and less melting of the sea ice. What can be expected from this is more ice during the summer season surviving and this will be reflected in the ice data if this continues over future years. The North Atlantic Ocean has been cold for long enough now to believe it maybe a change in the AMO to the future negative phase.
Forget the icebreakers, we’re going to need ironybreakers!
Plus bullshitbreakers when they tell us its all due to global warming. Wait! They already have!
Snowtedo I, II, and III coming to a theater near you!
http://phys.org/news/2015-03-snowfall-antarctica-affecting-global-sea.html
All this talk of ice and global warming is giving me the urge to engage in some human trafficking.
no problem , global warming causes an increase in the ice in the Arctic , thanks to the magic of CO2
so there no end to the things this ‘all-powerful ‘ gas can do ?
So, much like last year’s Antarctic Expedition of AGW Alarmists, this year another group is stuck because of the “Worst Ice seen in Decades”. Wasn’t it predicted that there would be no ice in the Arctic Sea by 2010?
Shouldn’t that be “the best he’s seen in 20 years”?
Yes…..but irony is lost on these tunnel-visioned zealots.
Good point!
Which is it, more ice bad, or more ice good?
Personally, I fail to see the advantage of large stretches of the planet being inhospitably cold, and frigid weather and ice filled seas hindering commerce and life in general.
In the first 6000-7000 years of the Holocene, the Arctic had winter perennial sea ice only.
Sea ice, as is ably shown in this topic, is actually a real pain in the butt !
Those people living around the Arctic sea area would be far better off without it.
Pity its increasing again.
Not to a CG. Their business is getting shipping where it’s needed. Ice gets in the way. The CCG can plan research in the summer because the ice melts – usually. This time the ice breakers are still busy breaking ice for shipping.
…Or, we could look at the WUWT sea ice page instead of using a single anecdotal report:
http://wattsupwiththat.com/reference-pages/sea-ice-page/
which shows current Arctic sea ice coverage close to the dread 2 standard deviations under the 30 year average.
That isn’t to say that Hudson bay doesn’t have excessive ice, but according to the NSICD, the Arctic in general is not covered in an excess of ice. It isn’t even covered with a “normal” amount of ice. So why put up an article that suggests that it is?
rgb
” So why put up an article that suggests that it is?”
Where in the article did it say an ice breaker was needed for lack of ice?
And just how much is a “normal” amount of ice?
How long do we have records for?
Don’t you know how ‘normal’ is defined here?
rgb is quite right and it is bit sad to see the mudthrowing start here.
Perhaps we should look into the information from the NSIDC. The Canadian imagery tells a different story, at least around Hudson Bay. For example (from WUWT’s sea ice page) this image:
http://ice-glaces.ec.gc.ca/Ice_Can/CMMBCTCA.gif
That shows a lot more ice cover than the NSIDC page.
Also, the navigation charts reflect that image, from http://northwestpassage2015.blogspot.com/ there are charts at the bottom, in particular
http://1.bp.blogspot.com/-rlinDW-CmVg/Va_SZfbIOQI/AAAAAAAAxRs/BIi1GIqIb9E/s1600/20150721180000_WIS30CT_0008377623.gif
nsidc do not count modern rotten ice 😉
Yes, well done to put up these Canadian maps which are correct, not the false NSIDC-sourced ones. As I’ve frequently posted, NOAA treat melt ponds as open water so Arctic ice is always underrepresented. Use the Canadian ice maps for Canadian regions, and the Anchorage Ice Desk (http://pafc.arh.noaa.gov/ice.php) for Alaskan waters to get the true ice, and use the Danish DMI/OSISAF charts (http://osisaf.met.no/p/ice_extent_graphs.php) to get the true global ice cover. The USA institutes are infested with AGW zealots.
I should have given a link to the Canadian Ice Service: http://ec.gc.ca/glaces-ice . You will be presented with a map showing 5 regions. Click on the “Hudson Bay” region, you are then presented with a long list of Hudson Bay ice maps. Scroll down to the near bottom where there are “Weekly Regional Ice Charts” dated the 20th July, and just above them there is a map labelled “Regional Ice Chart – Departure from Normal Concentration” — this is an absolute eye-opener to how much ice there is still in Hudson Bay, and worthy of a “Chart of the Month” for WUWT.
Ah, here is that “chart of the month” for WUWT: Departure from normal ice concentration of Hudson Bay for 20 July 2015, from Canadian Ice Service:
http://ice-glaces.ec.gc.ca/prods/WIS54DPTCT/20150720180000_WIS54DPTCT_0008379069.gif
@NZ Willy 5:04 pm.
What a great chart.
And what a lousy color scale! Correct me if I am wrong….
Deep Blue is 90-100% MORE ICE than previously.
Ok… maybe blue for cold, red for warmer….
But blue also means water and red for danger.
This color scheme is counter to the Canadian Ice Survey ice condition charts where bright RED is 90%+ ice, as in “Don’t go there.”
Perhaps an explanation is in order.
You are, I’m sure, aware that dire predictions have been made that by now there would be NO ice in the Arctic this time of year, right?
Really? I don’t recall any.
http://wattsupwiththat.com/2015/07/23/throwback-thursday-2-al-gores-arctic-facepalm-forecast/
But I can understand. The “forgetting” of inconvenient facts seems to be becoming epidemic. We often refer to it as a “memory hole”.
TomB
Memory hole? I call it the forgetory 😉
Because, given the warmist claims over the last 10-15 years, this kind of event should not happen. It’s not what one would expect if the Arctic ice had been a “death spiral” for the last 5-10 years. (Read that line again about conditions being “the worst he’s seen in 20 years” and try to fit it into the AGW narrative.)
Dead right.
rgb,
An inquiring mind can look at both the WUWT sea ice page as well as the actual observations and reports from Ice Breakers on the Hudson Bay and become better informed as to what is going on in the Arctic which might lead to a better understanding. Some people (think Administration) have a closed mind and still claim that the Arctic Sea Ice is declining despite significant growth over the last several years, because they don’t want the public to know about the recent recovery.
Also some might be disappointed that Arctic Research has be curtailed.
It isn’t even covered with a “normal” amount of ice. So why put up an article that suggests that it is?
rgb
=============
Arctic ice ‘grew by a third’ after cool summer in 2013
The volume of Arctic sea ice increased by around a third after an unusually cool summer in 2013.
Researchers say the growth continued in 2014 and more than compensated for losses recorded in the three previous years.
http://www.bbc.com/news/science-environment-33594654
Yep, more older thicker multi year ice, another cold summer in the arctic.
It’s the ironing.
Check Susan Crockford’s Polabearscience. The issue is ice cover in Hudson Bay, not the rest of the Arctic. See also the Canadian ice page. Eastern Arctic has unusual amount of ice as of yesterday. Note the pic of the icebreaker may be from 1993 when similar ice conditions existed.
Oops. 1992
Wonder what I put in there to invoke moderation this time.
Mods.?
Oh, well…all things in moderation.
Wayne, are you telling me that although they dated the picture July, they deceived the reader in the paper, and the CCG is quoted in the story, the ice in Hudson Bay is from another year?
I think there is a notable increase in ice extent volume, and thickness in the past few years, and there is little sign that this snap back will end this year.
I do not think every source can be counted on for 100% reliable info.
I like real time photos…they convey information that can not be gleaned by looking at charts and graphs.
I large ship having to smash through large floes of ice in the middle of July is a striking image, IMO:
http://realclimatescience.com/wp-content/uploads/2015/07/ScreenHunter_237-Jul.-21-21.09.jpg
http://realclimatescience.com/wp-content/uploads/2015/07/ScreenHunter_2571-Jul.-20-18.19.gif
http://realclimatescience.com/wp-content/uploads/2015/07/ScreenHunter_9960-Jul.-22-11.04.gif
http://realclimatescience.com/wp-content/uploads/2015/07/icecover_current-73.png
http://realclimatescience.com/wp-content/uploads/2015/07/ScreenHunter_9949-Jul.-19-11.36.gif
Greenland is Ground Zero for warming isn’t it? (At least when it’s not Antarctica, Australia or wherever is hot this week.)
Yes, Greenland was very much a subject of Warmista handwringing in years past. Summer melting was highlighted with no context, leaving out the part about how every winter massive amounts of snow fall there.
But like everywhere else, there are warm years and cold years, and snowy years and not as snowy ones.
I large ship, and a large ship, too.
RGB: Seems to me: ice has been within or close to 2SD over the ‘warmist’ years, especially in toto. With scientific honesty, I couldn’t ever say anything has been very unusual. The admiralties of northern nations, with long records, know this. Also, like Menicholas and icebreaking skippers, early and late ice at the very least, is not favoured by the sensible!
It is wrong to dismiss anecdotal evidence. It must be put into context. For example, for the past 2 years two fifths of the world’s fresh water (the Great Lakes) has been essentially frozen solid in winter. Very unusual. This spring was cool for almost one quarter of the Arctic with unprecedented snow (in decades) in the Ungava, a blocked Frobisher Bay and an ice-chocked Hudson Bay. These are very large regions of the planet exhibiting evidence that is very inconsistent with the theory of global warming. Are these anecdotal stories a sign of a changing Arctic?
I would not say the Great Lakes (or Niagra Falls) froze solid last winter. I would say they froze over. Or completely froze over.
Phil.,
One might suppose you are being sarcastic, but your other remarks make me suspect you are serious, and that you do not “recall” any such dire warnings.
No need for me to expound on a sampling of alarmist scare stories and predictions of a catastrophe of melted ice, as everyone who spends any time at all reading and/or commenting on warmista jackassery is all too familiar with an entire litany of such failed predictions.
So, I can only conclude that a person who asserts that he does not recall any is either spectacularly uninformed, the possessor of an exceptionally poor memory, or just saying things in a comment bomb style for the purpose of inciting others…an M.O otherwise known as a trolling.
I wonder which is worse, being lazy, being stupid, or being a…well, everyone knows what? No need to say it.
Menicholas July 22, 2015 at 9:52 pm
Phil.,
One might suppose you are being sarcastic, but your other remarks make me suspect you are serious, and that you do not “recall” any such dire warnings.
The statement to which I was replying was:
You are, I’m sure, aware that dire predictions have been made that by now there would be NO ice in the Arctic this time of year, right?
I repeat I am unaware of any predictions that there would be ZERO ice in the Arctic by July 2015.
Perhaps you can give a reference?
Even Wadhams hasn’t gone that far.
Phil:
http://www.politifact.com/truth-o-meter/statements/2009/sep/02/john-kerry/kerry-claims-arctic-will-be-ice-free-2013/
and
http://news.nationalgeographic.com/news/2007/12/071212-AP-arctic-melt.html “Arctic sea ice gone in summer within five years?” — from a 2007 article
These from the first page (of many) of a search on “arctic ice-free by 2013”. Where have you been?
This was one of the more widely quoted ones:
http://www.naturalnews.com/042074_Al_Gore_global_warming_predictions.html
“Arctic Ice
Perhaps nowhere have the alarmists’ predictions been proven as wrong as at the Earth’s poles. In 2007, 2008, and 2009, Al Gore, the high priest for a movement described by critics as the “climate cult,” publicly warned that the North Pole would be “ice-free” in the summer by around 2013 because of alleged “man-made global warming.”
Speaking to an audience in Germany five years ago, Gore — sometimes ridiculed as “The Goracle” — alleged that “the entire North Polarized [sic] cap will disappear in five years.” “Five years,” Gore said again, in case anybody missed it the first time, is “the period of time during which it is now expected to disappear.”
The following year, Gore made similar claims at a UN “climate” summit in Copenhagen. “Some of the models … suggest that there is a 75 percent chance that the entire north polar ice cap, during some of the summer months, could be completely ice-free within the next five to seven years,” Gore claimed in 2009. “We will find out.”
Yes, we have found out. Contrary to the predictions by Gore and fellow alarmists, satellite data showed that Arctic ice volume as of summer of 2013 had actually expanded more than 50 percent over 2012 levels. In fact, during October 2013, sea-ice levels grew at the fastest pace since records began in 1979. Many experts now predict the ongoing expansion of Arctic ice to continue in the years to come, leaving global-warming alarmists scrambling for explanations to save face — and to revive the rapidly melting climate hysteria.
Gore, though, was hardly alone in making the ridiculous and now thoroughly discredited predictions about Arctic ice. Citing climate experts, the British government-funded BBC, for example, also hyped the mass hysteria, running a now-embarrassing article on December 12, 2007, under the headline: “Arctic summers ice-free ‘by 2013’.” In that piece, which was still online as of July 2014, the BBC highlighted alleged “modeling studies” that supposedly “indicate northern polar waters could be ice-free in summers within just 5-6 years.” Incredibly, some of the supposed “experts” even claimed it could happen before then, citing calculations performed by “super computers” that the BBC noted have “become a standard part of climate science in recent years.”
“Our projection of 2013 for the removal of ice in summer is not accounting for the last two minima, in 2005 and 2007,” claimed Professor Wieslaw Maslowski, described as a researcher from the Naval Postgraduate School who was working with co-workers at NASA to come up with the now-thoroughly discredited forecasts about polar ice. “So given that fact, you can argue that may be [sic] our projection of 2013 is already too conservative.” (Emphasis added.) Other “experts” quoted in the BBC article agreed with the hysteria.
In the real world, however, the scientific evidence demolishing the global-warming theories advanced by Gore, the UN, and government-funded “climate scientists” continues to grow, along with the ice cover in both hemispheres. In the Arctic, for example, data collected by Europe’s Cryosat spacecraft pointed to about 9,000 cubic kilometers of ice volume at the end of the 2013 melt season. In 2012, which was admittedly a low year, the total volume was about 6,000 cubic kilometers.
Indeed, in 2007, when Gore and others started making their predictions about imminent “ice-free” Arctic summers, the average sea-ice area extent after the summer melt for the month of September was 4.28 million square kilometers. By 2013, even on September 13, the minimum ice-cover day for the whole year, ice levels were way above the 2007 average for the month — by an area almost the size of California. The lowest level recorded on a single day during 2013 was 5.1 million square kilometers. By late July 2014, Arctic sea-ice extent was almost at its highest level in a decade, and scientists expect even less melting this summer than last year.
Despite parroting the wild claims five years ago, the establishment press has, unsurprisingly, refused to report that Gore and his fellow alarmists were proven embarrassingly wrong. No apologies from Gore have been forthcoming, either, and none of the “scientists” who made the ridiculous predictions quoted by the BBC has apologized or lost his taxpayer-funded job. In fact, almost unbelievably, the establishment press is now parroting new claims from the same discredited “experts” suggesting that the Arctic will be “ice-free” by 2016.”
http://www.thenewamerican.com/tech/environment/item/18888-embarrassing-predictions-haunt-the-global-warming-industry
And from this site:
http://wattsupwiththat.com/2014/04/02/the-big-list-of-failed-climate-predictions/
Anyone could search and quote all day long.
if you consider yourself informed, and truly have no knowledge of these…you may want to read up.
I would hazard a guess that most every skeptic knows of these predictions, and such mindless tripe is one reason for the mindset of those who wish to call out the alarmists for their nonsense.
Wouldn’t you just know it? Same day Hansen has an article in the Daily Mail, UK – “Sea levels may rise by 10 FEET in the next 50 years: Climate change targets could still lead to ‘highly dangerous’ global warming, warn scientists.” I quote: Climate expert Dr James Hansen says paper is most important of his career.
Does it get any better than this?
No it doesn’t and not everyone in their play area agrees.
The Washington Post’s Chris Mooney asked other climate experts to weigh in on the paper. While many said it raised key discussion points, Kevin Trenberth of the National Center for Atmospheric Research called it “provocative and intriguing but rife with speculation and ‘what if’ scenarios.”
I quote: Climate expert Dr James Hansen says paper is most important of his career.
Hmm, True but still irrelevant.
michael
Hansen has just come out saying that, knowing what he knows now about the spectacular failure (my words, not his) of any f his dire predictions to come true in any way or even slightly…even knowing how wrong he has been, he would not change any of his warnings or predictions!
At some point, one needs to really wonder if another person has misplaced his marbles.
Hansen seems a few ice cubes short of a tray full.
Or he caught the same bug that breached the brain barrier in Tim Wirth.
Brain sublimation?
Are you sure that any cubes are left?
Yeah, I know, all of Hansen’s cubes were left; but, have they left? (If they were ever really there to start with)…
Menicholas — Hansen seems a few ice cubes short of a tray full — Perfect — Eugene WR Gallun
Dr. Hansen is a 100% believer in the Nobel Cause.
It sounds like communities being impacted by climate change in the quote. They sure slipped up on that one.
If the research vessel could not get on station in a heavy ice year, then maybe it never really happened and all of the productive science data years are warm.
The way I read it, The vessel does double duty as an icebreaker and research vessel. In a normal year, it would be available for research by now and the small communities along the coast of Hudson Bay would be serviced by commercial craft cruising through more or less ice free water. But this year, the Hudson Bay ice pack is taking its own sweet time about melting, so the ship has been pulled off its normal research role and is being used to get the supply boats to their destinations.
I could be wrong. If I am, I imagine some one will correct me.
‘Researching’ the ice in an icebreaker means going round smashing it up into smaller pieces so it melts quicker.
Don that is exactly the way I read it.
Interesting point Billy – is there enough icebreaker traffic to actually be material?
Andrew,
21st century …
… By September 2007 the North Pole had been visited 66 times by different surface ships: 54 times by Soviet and Russian icebreakers, 4 times by Swedish Oden, 3 times by German Polarstern, 3 times by USCGC Healy and USCGC Polar Sea, and once by CCGS Louis S. St-Laurent and by Swedish Vidar Viking.
https://en.wikipedia.org/wiki/North_Pole
From the article….
“A carefully planned, 115-day scientific expedition on board the floating research vessel, the CCGS Amundsen, has been derailed as the icebreaker was called to help resupply ships navigate heavy ice in Hudson Bay.”
The vessel cannot support a research expedition and break heavy ice to help resupply ships at the same time.
Mr Watts, I wonder if the Sea Ice page might start at 1974 when actual satellite data was acquired? I understand that data is now available.
Dang it!!! I was going to go up there for some snorkeling and bikini-watching. My plans are ruined.
But I was promised that it would all melt away quit suddenly!
Arctic summers ice-free by 2013:
Professor Wieslaw Maslowski told an American Geophysical Union meeting that previous projections had underestimated the processes now driving ice loss.
“Our projection of 2013 for the removal of ice in summer is not accounting for the last two minima, in 2005 and 2007,” the researcher from the Naval Postgraduate School, Monterey, California, explained to the BBC. “So given that fact, you can argue that may be our projection of 2013 is already too conservative.”
And later, to the BBC, Dr Serreze added: “I think Wieslaw is probably a little aggressive in his projections, simply because the luck of the draw means natural variability can kick in to give you a few years in which the ice loss is a little less than you’ve had in previous years. But Wieslaw is a smart guy and it would not surprise me if his projections came out.”
Former US Vice President Al Gore cited Professor Maslowski’s analysis on Monday in his acceptance speech at the Nobel Peace Prize ceremony in Oslo.
Source: http://news.bbc.co.uk/2/hi/7139797.stm
I want my money back!!
Thanks rgb for trying to keep it sane here . .
RGB was not correct on this one. Arctic sea ice is in its third year of increase in volume, thickness, and extent, and the summer is again cold.
what more ‘proof’ do you need of global warming ?
I agree. Not one of RGB’s finer posts. Hudson Bay is a pretty big place. When its clogged with ice in July something is happening.
RGB is correct about this one.
He advised us to not stray too far from the WUWT sea ice page’s graphic evidence.
Hudson Bay still has substantial ice along with other portions of the Arctic causing distress to alarmists and Arctic adventurers who believed a frolic or two in the Arctic during summer would be a pleasant summer holiday.
Those who study Arctic ice should take these signs as worrying. Especially the bureaucrats who should plan and purchase ice breakers.
It takes years to plan, order, construct and christen an ice breaker. A worrisome consideration given that several countries have reduced or eliminated their ice breakers. Global balmy and all that.
If by keeping it sane, you mean closing ones eyes, putting fingers in ears and chanting “WA-WA-WA-WA-WA-WA”, then yes, ignoring the physical reality of the planet would count as keeping it sane.
*Sorry, RGB, you knows I still loves ya, right? Your post above does seem a little out of character though :-)*
Actually, Arctic sea ice this year is tracking closely to last year.
https://rclutz.wordpress.com/2015/07/20/arctic-ice-watch-july-20-2015-and-2014-virtually-tied/
looks like a big increase to me-
http://ocean.dmi.dk/arctic/icecover_30y.uk.php
richard, your link goes to a chart showing September minimums, so the last 2 data points there are 2013 and 2104. At the moment 2015 is tracking close to 2014 with September 2 months away.
whoop, 2014 not 2104
Ron Clutz:
“…with September 2 months away…”
What calendar are you using?
If one looks at thirty years of a sixty year cycle, and begins those thirty at the low point of the cycle, one may get the impression that an inexorable trend is underway, when in fact you are really just looking at half of a sinusoidal pattern.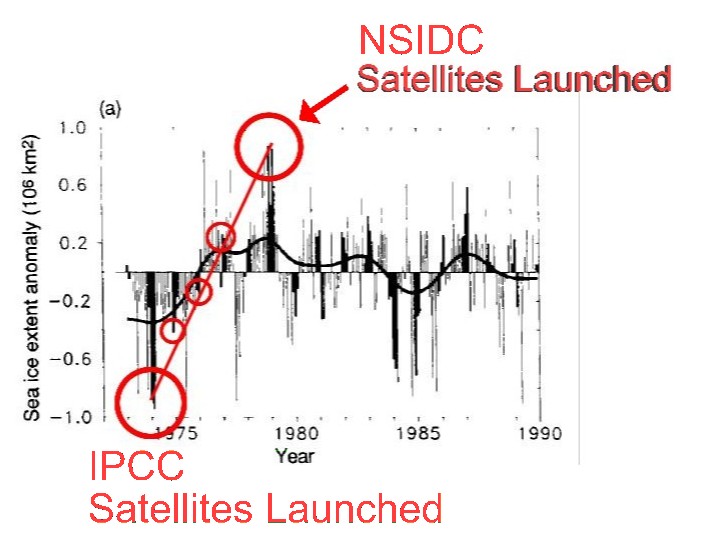 ?w=1280&h=982&h=982
Tony Heller explains it better than I ever could, but the gist of it is that history did not begin in 1979.
Starting in that year assures a downtrend…for now. But ignoring at least a hundred and fifty years of oscillations in arctic ice makes no sense, unless one is trying to advance a shady agenda.
https://stevengoddard.wordpress.com/2013/09/09/the-long-term-trend-towards-scientific-stupidity/
Oops, should have said ”’begins those thirty at the high point of the cycle…”
Because it is plainly the case that 1979-1980, smack in the middle of the global cooling scare warmistas like to pretend never happened, was a time of very high Arctic ice extent and thickness.
Any who doubt can speak up, and I will provide a continental icecap sized mountain of references.
Including interviews and articles by some researchers who warned that the Holocene interglacial is at an end, but who nonetheless were carrying banners at the front of the warmista parade a few short years and zero explanations later.
If you look at Cryosphere Today the sea ice area is below 2014 and 2015 and only slightly above 2012.
Yes, those are results from the passive microwave sensors which have trouble distinguishing melt water on top of ice from open water. That is why I am presenting results from NIC ice charts from which come the MASIE results. You will find that the microwave products are 300 to 600k km2 lower.
oh look,another cryosphere today fan. i will offer you the same bet i offer all arctic alarmists. £1000 that the arctic does not meet the minimum requirement for ice free definition as stated by cryosphere today area of below 1 million square kilometres . to date, the only person willing to take the bet is jim hunt . i thought wadhams would jump at the bet, but apparently his bold predictions do not have much confidence behind them.
oops,forgot to add when the ice free state must occur by. 2022 is the year.
Theo, last year minimum was day 262, 60 days from day 202 (July 21).
According modern Marxist theory, Horcheimer said that Logic is not independent of content ref 11:58 in the film below. That means an argument is Logic if it helps destroy western culture and capitalism and ilogical if it helps support it. This means that Data that are ilogical have to be adjusted tobecome logical. And 13:55 is a Jewel? Todays environmental and climate debate is a product of marxism and the debate is over(political correctness)? https://www.youtube.com/watch?v=EjaBpVzOohs
My point is that if there is a lot of ice in Hudson Bay its not helping Marxism and their agenda/The Plan. Therefore its ilogical and does not exist.
From Wikipedia –” NEWSPEAK is the fictional language in the novel 1984 by George Orwell. It is a controlled language created by the totalitarian state of Oceania as a tool to limit freedom of thought and concepts that pose a threat to the regime such as freedom, self-expression, individuality and peace.”
Orwell was as much a reporter as he was a novelist.
The English language has the largest vocabulary of all languages. “Politically Correct” people want to limit its size. They think that by ridding the language of certain words you can change human nature. People will no longer have the ability to “think” bad thoughts. In reality the only thing you create is a world filled with unnameable terrors, terrors which cannot be opposed because none know how to even name them.
Have you noticed that in dictatorships or authoritarian states all have laws against insulting the leader? To speak aloud the evils of the leadership is to commit a crime.
Here in America opposition to O’Bummer’s policies is designated as racism. Is there really any difference?
In the future that the left wants, mankind will become a herd of dumb cattle unable to even think much less say that their world is one gigantic slaughter house.
The useful idiots of the left have no idea what they are helping to bring down upon themselves and all others.
Eugene WR Gallun
Backing that thought up ..Oboma cannot even SAY the words “radical Muslim extremists” or “Muslim terrorists” … And does not permit his administration to say them either.
Speaking of banning words, here is the most incredible example I have ever heard of:
From the CBC news item:
Perhaps they meant, a carefully modelled…
They have made themselves look stupid in Antarctica (ship of fools), now it’s the Arctic’s turn! You could not make this stuff up “Carry On Up The Poles” “Arctic Towers” “Monty Warmists Icebound Circus”
We need comedy scriptwriters………………. on second thoughts this lunacy is beyond parody!!
“I finally found summer sea ice and my climate scientist told me it was the wrong kind.”
Alice and I just got home from a two-week Lindblad/National Geographic Arctic “expedition” that could not do the featured portion, landing on the east coast of Greenland, because of the heavy sea ice. It was ironic, since Lindblad and the National Geographic naturalists onboard the NG Explorer were all global warming alarmists, and part of the cost of our tour was the expenses of a journalist whose only contribution was an alarmist presentation on anthropogenic climate change that was devoid of any science (unless the repeated invocation of the sacred “97%” is considered science). It was similar to a Lindblad Antarctic expedition we took last year on the same ship, when James Balog of “Chasing Ice” fame was featured and subsidized by we paying passengers. Both expeditions mentioned Arctic sea ice retreat, neither that the Antarctic sea ice was far above average, as well as the global total. On Iceland we were shown beaches far above present sea level that were created during the Holocene Optimum sea level highstand of 8,000 years ago, but when I commented that this was clear evidence that it was much warmer then, the NG naturalists became very defensive. Apparently their “science” must serve their cause.
Its Marxist Logic and is not the same as Scientific Logic, look above and you will find a film explaining this.
I think RGBatduke has a point, but I’m not sure if it’s the one I’m taking from this. If the NSIDC is not showing ice that clearly exists, have they adjusted the ice extent to fall in line with the models?
The dread Gore Effect in action.
Dr. Brown, the NSIDC doesn’t present actual “data” but its own politically driven interpretation of observations.
I’ll bet posting this article was a serious challenge for the CBC, given their official position as CAGW true-believers. ;->
I have been repeatedly assured that the ice at the north pole was in a death spiral. This news leads me to wonder if the alarmists know what a “death spiral” is.
markstoval
I conclude that the ‘death spiral’ is dead, long before its appointed time, but will gain new life? Will the Death Spiral Zombie come back from the clutch of its icy grave? Stay tuned for “Death Spiral II – The Reenactment (this time without so much ice)”.
So the “too much ice” is in Hudson Bay not Baffin Bay and the asst comm for the Coast Guard Johnny LeClair was speaking of the ice in Hudson Bay as being the worst he’d seen in 20 years. So it has nothing to do with arctic sea ice. But I should ask, isn’t Hudson Bay usually ice free by now?
No, as shown in the OP (see yellow lines) and at Cryosphere today.
http://arctic.atmos.uiuc.edu/cryosphere/IMAGES/recent365.anom.region.13.html
interesting trend there the last 5 years 😉
Numbers from MASIE for day 202 (yesterday):
2014 Hudson Bay 271k km2
2015 Hudson Bay 512k km2
So a lot more ice extent right now.
2014 Hudson Bay minimum was day 262 with only 862 km2.
A more telling comparison is to the last late breakup year (2009), when on day 202 (21 July) ice coverage was 362 thousand km2 (according to MASIE) – in 2009, polar bears came ashore as late as they did in 1992. The pattern of remaining ice is different but there is still far more ice this year than 2009, perhaps rivaling 1992:
2009 Hudson Bay 362 k km2 [most recent late breakup year]
2015 Hudson Bay 512 k km2
http://polarbearscience.com/2015/07/21/alarm-over-future-summer-polar-bear-habitat-disguises-how-good-conditions-are-right-now/
Susan
Thanks for that confirmation. As I have often said:
No one what will happen with Arctic ice.
Except maybe the polar bears.
And they are not talking.
Except, of course, to the ad men from Coca-Cola
Thanks for that confirmation. As I have often said:
No one knows what will happen with Arctic ice.
Except maybe the polar bears.
And they are not talking.
Except, of course, to the ad men from Coca-Cola
If this “global warming” keeps up, we’ll be in an ice age soon.
Not so much Antarctic ice at the moment. There would probably be a bit more artic sea ice to if it weren’t for the current now moderate El Niño.
“Not so much Antarctic ice at the moment.”
Wait, what?
Seriously?
If by “not so much”, you mean les than at this time last year, then I agree with you.
But, although we are not setting another record this month, it is still the second highest evah measured for the month of June…EVAH!
(And by evah, I mean since 1980.)
There’s a 38% chance that it is the highest? 😉
True Dat!
Have no fear, though; Jimmy “Coal Trains of Death” Hansen sez the Antarctic and Greenland glaciers are gonna melt ten times faster than originally thought, with resultant SLR of “at least 10 feet in as little as 50 years”.
We’re doomed.
Any net loss year over year of North or South ice sheets result in a fear campaign. My brother and I debates briefly yesterday whether or not the Antarctic “melt” would be catastrophic. News on the street is that sea ice will rise drastically and this reported by the world’s best scientific Antarctic researcher. So hey folks, kiss your lives goodbye, a dude who is the very best of the best says its all over. Who are we simpletons to question?
“at least 10 feet in as little as 50 years”.
On a straight-line basis, this equates to 2.4″ per year. This rate was not recorded in 2014, and is unlikely to be recorded in 2015, so when is this rise supposed to start? There must be a start date that can be adopted as a benchmark – has it ever been set?
The climatastrophologists haven’t said yet. Soon though. Real soon, you betcha.
Here is a link to the tide gauge records for the US and other locations.
Due to geological factors and the many other reasons for varying sea levels in a given spot, the numbers for nearly every location are quite variable, but f one opens a whole bunch of the links and looks at data from many sites which are widely spaced, it becomes apparent that for over a hundred years, sea levels have risen about 2 millimeters per year, or 11 inches in a hundred years. And this is with lots of ground water extraction, the Aral sea being drained, the LIA ending and glaciers shrinking in places, etc.
Given that hour to hour variations are many times this amount, it seems almost trivial over that much time.
But another thing which stands out, to me anyway, is that for nearly every location one might pick, one can see that there are years back in the 1800’s during which the average sea level were equal to or higher than years in the past decade. In other words, the amount of total rise is less than the variations in annual mean for just about everywhere. In still other words, a person who was very long lived and has been watching the ocean from his beachfront home for the past 100 years would be hard pressed to even see any difference in sea level at all.
Predicting rates of rise to accelerate by a factor of ten is not based on any observations, that much is clear.
It is just a wild ass guess.
One thing it is not, is science.
Since when is guesswork worth a tinker’s damn?
Try to find even a single place where the trend is accelerating.
I can’t find any.
Besides for all of that, most places where tides may encroach have a much more realistic chance of being flooded by a storm event. Over a hundred years, any structure on the water may have a likelihood of flooding approaching 100%.
And anyone building on the water would do well to keep that in mind.
http://tidesandcurrents.noaa.gov/sltrends/sltrends_us.htm
Let me guess: Hansen sez ” It’s even worse than we thought…since the last time we said it was worse than we thought…even though we were wrong then, and instead it was nowhere near as bad as we warned. But this tiMe is different, because it is now, not then, and this is a fresh warning of doom, not to be taken lightly BECAUSE IT IS WORSE THAN WE THOUGHT!”
Thanks Anthony for this tidbit.
Couldn’t resist
Instead of the North Baffin Bay
the Amundsen did turn away.
“Too much ice in July,
all our models awry.”
Must break ice down in Hudson’s ice bay.
http://lenbilen.com/2015/07/22/global-warming-ice-breaker-rerouted-to-hudson-bay-to-assist-commercial-ships-rather-than-doing-research-on-global-warming-a-limerick/
http://www.snopes.com/politics/science/globalwarming1922.asp
Climate Change we can go midnight skinny dipping at the North Pole
Unexpected extreme weather events are predicted to happen more often with climate change. So this fits!
Dr Wadhams of the “Arctic will be ice free by 2016” fame should comment. (Cambridge University – God help us)
So as long as they keep getting blocked by the ice they can claim they’ve found no evidence to disprove global warming.
Keep in mind that Hudson Bay is right in the path of the cold air that brought the much below average past two winters to the NE US. While it is sometimes good to throw back failed predictions into the faces of the alarmists, we should realize there’s a good reason for the extra ice this year. It doesn’t really tell us much about the overall Arctic sea ice situation. Besides, it will probably all still melt before the summer minimum.
That said, it will be interesting to see if the past two yearly increases in Arctic sea ice volume continues in 2015.
Interesting, as in “Gotcha!”, or interesting, as in “Ice melts and then refreezes every year, and these fluctuations are highly variable, and always have been, and there are long term trends we have not been observing for even one cycle of yet, so we really cannot say with even a trace of certainty what will happen next, and it hardly matters, because if the past three years have demonstrated anything, it is that fears of “a one way death spiral and inevitable sudden collapse due to increasing albedo” are completely unfounded?”
I agree.
It’s still cold. In Newfoundland it was 10 degrees C today. It has been wet and cold all spring and summer. And dry and hot in the west. The same WEATHER pattern as has persisted for months.
You’re saying, basically, that we should count ice due to CLIMATE and ignore ice due to WEATHER. I think you didn’t actually mean that, though.
I think this is hilarious. To think, just a few years ago, these guys were predicting ice-free summers in the Arctic, almost for good. So much for that alarm.
Rgbatduke is quite right about the 2SD Arctic ice but has missed the direction of the story. It is not saying there is more ice in the Arctic, only that an expedition has been waylaid by the unpredictability of the ice distribution.
The irony is that they were not going to study ice melting, they were going to prove that it melts faster when watched.
There is a huge discrepancy between extent and volume at the moment.
If volume, read Piomas and DMI 30% ice is to be believed, in hand with the recent pronged negative AO then sea ice extent be quite higher than it currently is.
Melt pools, funny measurements?
Who knows.
The Antarctic is still freezing but the WUWT map from NSIDC is showing those little black holes along the coast again.
Cut and paste to reduce the Antarctic volume which was getting too big?
The NISDIC (sic) view of Hudson Bay is at an oblique angle. The Canadian Ice Service view is from overhead. The oblique angle will give a very different impression even if it were more accurate.
The total area of Hudson Bay is 1,230,000 km2
When Arctic ice hit it’s maximum on February 25, 2015, it was 14.54 million square kilometers.
…
So, we’re talking about an area that is less than 9% of the ice cover of the polar region.
…
How’s the other 90% doing?
The ice breaker and the ship behind in the picture dated July 17 tells the story in 2015. The article in the newspaper clearly states that the icebreaker was diverted in 2015. I see heavy ice in the picture.
Not that it matters but the photo is from north of Hudson Bay going into Iqaluit on Baffin Island. My company redid the runway there back in the 80’s.
Wayne,
Check out the post at the bottom of this thread, the photo is from the Hudson Bay and the year is 2015 July not decades ago as you try to claim.
Can you agree that your statements were wrong..
catcracking July 23, 2015 at 6:09 pm
Wayne,
Check out the post at the bottom of this thread, the photo is from the Hudson Bay and the year is 2015 July not decades ago as you try to claim.
Can you agree that your statements were wrong..
Wayne is correct, read the caption to the photo, it’s from Iqaluit not Hudson bay.
What it says is that the ship is being escorted TO Iqaluit. It does not say from where. Without knowing where the journey originated, and at what stage of the rip the pic is from, one cannot say that it is not Hudson Bay.
Since the Pierre Radisson was on escort duty in Frobisher Bay at the time (and still is), Wayne and I are correct about the location of that photo, it was not in Hudson bay.
Think these warmists might learn from their fellow scientists. Last year a bunch of Australian scientists when on an expedition to see how much the ice had melted in Antarticia, and they got stuck in the ice. Cost to Australian taxpayers million to rescue them.
http://www.weather.com/news/news/russian-ship-stuck-antarctic-ice-rescue-update-20140121
Too bad.
Would have made a fine meal for those poor, hungry wolves.
Here’s an amusing counterpoint. From March of this year.
Discussing the peril that awaits when there is no arctic sea ice in September 2015?!?!
And I think that they think that they are serious:
http://arctic-news.blogspot.co.uk/2015/03/september-2015-without-arctic-sea-ice.html
THE ICEBREAKER COMETH — my vision for a new play
I see an icebound ship of fools, the passengers deranged, frivolous, and utterly self-possessed.
The play opens with the passengers milling about on the deck of their icebound ship remarking to each other about the swift progress they are making — but their voices are too loud, too shrill and there are worried looks on their face. Soon someone shouts in a desperate voice — “There is no pause!” and one by one they take up the chant — There is no pause! There is no pause!
Then over a loudspeaker a nameless voice informs them that an icebreaker has been contacted and it is coming to save them.
Basically this will be a Christian religious play about mankind’s ambivalence towards salvation. One of the requirements for salvation is that you admit that you are a corrupt sinner. It demands the death of all that you have been before. So the icebreaker that is coming to save them represents “death”. But in Christianity death is really the beginning of life eternal — if you are saved.
The passengers will engage in many esoteric discussions while waiting for the icebreaker to arrive. Should they welcome it or send it away? Is the price of salvation to great — that being that they have to admit that they have been wrong?
On board there will be a murder and some suicides — for variety — to maintain interest and plot momentum.
The play ends when someone shouts “I think I see the icebreaker^ followed by a loud frightening off-stage scream. The lights go out.
If I work on this I think I might have something.
Eugene WR Gallun
This will also be good because these scientists on board will now be forced to see how much ice there is in the Hudson Bay, first hand — lest they have their own denial that such ice exists.
Hmm, on reflection, this may be a bigger deal than meets the eye. Now, NSIDC & NOAA can no longer wipe the Hudson ice off their Sea Ice charts while their scientific brethren are held hostage on icebreakers clearing paths through that ice to coastal towns. They will have to “turn the dials” on their software to start counting melt ponds as being ice instead of open water — else the Hudson ice would disappear off their charts. I’ve been suspicious that they are intending to not “turn the dial” this year in order to make the summer minimum as low as possible in preparation for Paris in November. If true, now they’ll have to change that plan. So possibly this icebreaker diversion will be a big deal.
Has anybody been looking at the delta between DMI and NSIDC lately (at the 15% reference level). Their numbers are now over 1.5M square KM apart. And the winter highs were pretty close together. DMI shows a recent slowing of ice loss, NSIDC shows acceleration. DMI within 1SD, NSIDC around 2SD. This is worse than the well-known deviations between land and satellite temperature data.
What’s going on? Who should we believe?
Taylor
Taylor I noticed this also. It seems in March NSIDC (NOAA) made adjustments to their algorithm which brings them closer now to what MASIE reports. I don’t know what DMI has done.
https://rclutz.wordpress.com/2015/07/13/arctic-sea-ice-uncertainties/
What’s going on is exactly what I wrote above your comment. DMI (actually OSISAF in Norway) is “turning the dial” to start counting melt ponds as ice whereas previously melt ponds were counted as open water. Look at their 2013/14 tracks — they do this at this time every year. But NSIDC hasn’t started this process at all yet.
This is an annual event designed to cope with satellite microwave sensors’ inability to distinguish between open water and melt ponds sitting on top of ice. The satellites measure both Arctic and Antarctic and up to 2006 the satellite polarizer filter was turned twice a year with the goal to better recognize the melt ponds in the summer hemisphere — these turnings were done on the 1st January and 1st July. This caused the notorious “bump” in the middle of the Arctic ice extent charts in the middle of the chart (on 1st July), so starting in 2007 the filter turning was replaced by a software algorithm which replicated the turning, and could be tweaked gradually to remove the “bump”. However, in the first year, 2007, they didn’t implement the software at all so the switchover never happened. The result was the record low Arctic ice extent & simultaneous record high Antarctic ice extent of 2007 — because the polarizer must be set opposite for the two hemispheres to replicate the physical instrument. Since then, the software is implemented gradually at the midpoint of each melting season (as you can see on the DMI chart) except it was once again omitted in 2012 — with consequent simultaneous record low Arctic extent and record high Antarctic extent in that year, again. I find it remarkable that no-one has questioned those simultaneous “record” low Arctic ice extent and high Antarctic ice extents which are so obviously an instrumental/software artifact.
So the consequences of NOT “turning the dial” are very clear. Looking at Hudson Bay, note that the Canadian Ice Service shows about 20% of it is still at 90%+ ice cover but the NSIDC chart shows only 40% ice cover max. This is the difference when you count melt ponds as ice or as open water. With the big climate conference coming in Paris in November, it’s clear that the alarmists want to present as dire a picture as possible to make their conference a “success” (for them that is, but a disaster for the rest of us), and the above shows how much of an effect they have to play with simply by not “turning the dial” when presenting their ice extent charts. Thus my suspicion that they’re planning to not “turn the dial” at all this year. The recent plunge in Antarctic ice extent (0.5 million km2 in one day) indicates the plan is to absolutely minimize the ice area extent in both hemispheres (i.e., count melt ponds as open water in BOTH hemispheres) which is counter to all previous work done and crosses the line into the unethical.
The above is my own interpretation of events from watching the global ice wax & wane over the past 15 years, so I’ve had a lot of time to think about what’s going on. I’ve used similar deconstruction to solve problems in my (engineering & software) work. Today’s prostituted science can be read in a simple way: the more they’re paid, the less they’re to be believed. So trust the USA charts the least, the Canadian & Danish & Norwegian charts more, and the best of all are the Russian charts whose authors are paid zilch. Apply to other disciplines & recycle. Cheers.
Willy says: “So trust the USA charts the least, the Canadian & Danish & Norwegian charts more, and the best of all are the Russian charts whose authors are paid zilch.”
Can’t argue against that. I do make an exception for NIC, who are Navy types just trying to accurately report daily the ice conditions for the sake of ships operating in these seas. However, they are under the NSIDC bureaucracy, and so their numbers are erased after 30 days.
Agreed, ice charts for boaties are most trustworthy, and includes the Anchorage Ice Desk at http://pafc.arh.noaa.gov/ice.php — which is a NOAA office. Click on the top map, see the huge swath of 80%-100% ice in the north. That same region is reported as 40% ice by the crooked NSIDC.
I think you’ll find it’s the difference in resolution between the sources. Higher resolution gives a more accurate value, deals better with the fragmented ice that exists at present.
It is a little difficult to believe that high resolution visible photos could not be taken, and a computer program used to discern the areas of white ice from dark ocean.
Or this: Take a series of such high resolution visible light pictures, and string them together in a video. Over a year, ten years, whatever.
The human brain is very adept at discerning trends in such visual imagery.
I am not at all surprised at the extra ice in the Arctic. According to Environment Canada data, the winter temperature departures from 1961-1990 averages for the Tundra , Mountains and Fiords which includes most of the CANADIAN FAR NORTH have declined steadily for 5 years in a row from 6-5.5 C in 2010 to 0.4 -(-0.2) C in 2015 , a drop of some 6 degrees C or 10.8 F. This extra cold will create a lot of extra ice . You will never hear about this from NOAA .
Here is another example of hiding declines in temperatures
NOAA recently reported on JUNE 2015 TEMPERATURES
“Most of the world’s land areas were much warmer than average, that is falling within the top 10 percent of their historical temperature range for the January–June period, as in dictated by the Temperature Percentiles map above. These regions include nearly all of Eurasia, South America, Africa, and western North America, with pockets of record warmth across these areas. All of Australia was warmer than average. The oceans were also much warmer than average across vast expanses, with much of the northeastern and equatorial Pacific, large parts of the western North Atlantic, and the Barents Sea notably record warm. Over land, only northeastern Canada was much cooler than average during the first half of 2015, as was the North Atlantic Ocean to the south of Greenland, with a region of observed record cold.”
Yet not a word about CONTIGUOUS US where the YEAR TO DATE temperature anomaly to the end of June was only the 10 th warmest and not a record at all. Everything east of the Great lakes was cooler than normal both in Canada and the US. When one considers that American tax payers fund NOAA entirely, the tax payers are getting very little value for their money as NOAA seems to have become more of an global warming alarmists than providing balanced analysis and information for all regions of United States . Hide the declines and emphasize the warming seems to be the main focus.
http://www.ncdc.noaa.gov/sotc/global/201506
June in England is the month of a rare property: 350 years with virtually zero temperature trend.
http://www.vukcevic.talktalk.net/CET-Jun.htm
2015 Great Lakes surface temperatures are tracking about the same as 2014 temperatures … VERY COLD … coldest in several years … some are slightly higher some are slightly lower, to me this is odd as the 2014/15 winter was less severe than the 2013/2014 winter (starting point for 2013/2014 lake temperatures was colder than for 2014/15). It can only mean the 2015 summer in the Great Lakes area is colder than the 2014 summer, which might have something to do with Hudson Bay being frozen.
http://coastwatch.glerl.noaa.gov/statistic/avg-sst.php?lk=m&yr=0
The Great Lakes were over 80% covered this past year and the year before. The last time for 2 years in a row over 80% was in the late 70s when it was over 80% for 3 years running. I think the way thing are going we will tie that record this year.
Taylor
Here’s the chart:
http://www.glerl.noaa.gov/data/ice/imgs/IceCoverAvg1973_2015.jpg
Taylor
A question that has been on my mind for a while, does anyone know if they throw the Great Lakes temperatures out of the “land area” temperatures summaries? 3% of the US land area constantly being 10F below normal has to be inconvenient and hurtful to the global warming moevment, heck that’s the same as 30% of the US land area constantly being 1F below normal, now that’s just plain unacceptable to a global warming data massager, I have a hard time believing they don’t throw that data out, call it part of the ocean or something, and ignore it.
Our very own Canadian weather network is also beating the drum on Global Warming, despite this being one of the coolest starts to summer that I have seen in fifty years. They say the this El Nino year will make 2015 the hottest on record after a record breaking June. No wonder people turn them off and tune them out, as I do, and don’t believe a word they say.
that last post by nz willy looks worthy of further investigation,possibly a topic all of its own.
Meanwhile back on the supply ship my step son is working on and running a couple of weeks behind his comment on global warming global warming is BS the ice is clearing up but not very fast even the ice breaker is stuck in the ice – 5 right now
See the latest from the scientific team on the icebreaker: http://blogs.ubc.ca/geotraces2015/2015/07/23/day14 — “ice for miles” says the caption to the bottom photo which is of ridged ice — not going to melt anytime soon.
They will not give up on the con. Everything else they have touched has turned to sh*t. They have one and a half more years to get their global taxation system in place.
“…global warming put on hold because of too much ice”
There, I fixed the title for you.
Last winter and to some extend the one before were not normal. The jet stream was way out of place which caused the Pacific coast of the US, Canada and Alaska to be so warm that there was hardly any snow, with record breaking temperatures. Ski area’s never opened, mountain snow pack was less than a third of average creating drinking water problems and a very active forest fire season of which we have only seen the beginning. By official end of winter there had been over 4000 high temperature records in the western US, compared to only just over 200 cold records in the NE. Even now the summer has been very dry and very hot. Eastern Canada and the NE US got cold air from Siberia…. not the typical central Canadian cold air. The Pacific Ocean has a big “blob” of very warm water that has never been there before, which is keeping the salmon away, playing havoc with Orca’s, sea lions and other wildlife. It is silly when the city of Forks, located in the rain forest of the Olympic peninsule of Washington and gets 21 feet of rain a year, needs to impose water restrictions because there is no water. It has not rained for a long time.
Just the fact that it is unusally cold in a small area, yet unusually warm in a large area somewhere else does not mean there is no global warming. All our weather is the result of temperature differences, and a jetstream that is way out of place is one of them. Because you are in a place where it is cold, somewhere else it is warm, maybe just too warm. Something happening half a world away from you can impact you in a strange way.
Opening your eyes and see what is happening in the rest of the world besides your little corner might give you a better perspective. Why was there no snow for the Iditarod sled race in Alaska, yet there is too much snow in Boston. Why did the ice cap disappear of Mt. Kilimanjaro, yet the Hudson Bay has more ice, and in Greenland ice caves are meling away. It is all connected.
Warmer than “normal” is what they have.
To call the water “very warm” without mentioning that it is simply not as cold as usual could be a bit deceptive to those who are not well informed.
If one looks at anomaly charts, it is all bright red, but if one looks at temperature charts, it looks less alarming.
Nick, you are making it sound like the water there has never been warmer than normal, or that large areas of above average anomalies are unheard of, or that temperature records for the sea surface are being set.
If any of those things are true, I would like to see the data.
Certainly there is a blob of warmer than normal water, but in most places off the west coast of the US, and unprotected person would freeze to death within a few minutes to a few hours.
http://www.ospo.noaa.gov/data/sst/fields/FS_km5001.gif
‘Scuse me, should be “an unprotected person…”
And I should say “die of hypothermia” not “freeze to death”, although if one found one’s self in that water, far from land, I do not think the difference would be worth pondering.
It is unusually dry o the Olympic peninsula this year, but it is normally far drier there in summer than winter.
Yearly rainfall pattern for Forks:
http://pics2.city-data.com/w3q/prcq27085.png
And hey, looks like the will get some much needed rain:
http://www.weather.com/weather/tenday/l/USWA0149:1:US
As for Mount Kilimanjaro, tale of the ice’s demise are much exaggerated.
Maybe it is you who needs to open your eyes…to the mindless hysteria and failed predictions of doomsday.
Besides, if the ice melted on that mountain, it would mean more water for those people that depend on it. If the glaciers advance, it means more of the precipitation stays locked up and unavailable. By definition, ice is not water, and glaciers are water that has not melted but accumulated in an unusable form for many years. Colder is usually drier.
The Serengeti has been doing better recently, not worse. One reason is that the plants there need less water due to CO2 being much higher.
Forgot the link:
http://wattsupwiththat.com/2014/04/07/kilimanjaro-glaciers-just-wont-die-nowhere-near-extinction/
BTW, Greenland had it’s latest melt season in recent memory. The Capital city there is having it’s coldest year in decades, ice gain for the entire Island since last September is in the hundreds of billions of tonnes, and overall, their has been no global warming for over 18 years, using data from the most accurate and complete instruments available:
http://woodfortrees.org/plot/rss/from:1995/to:2015
http://beta.dmi.dk/en/groenland/maalinger/greenland-ice-sheet-surface-mass-budget/
Menicholas,
Thanks for the outstanding correction to the false claims by Nick. Besides you provided several excellent links which substantiate your points. I knew as soon as he mentioned Kilimanjaro the post was mostly BS
Amusing, since it’s only weeks to the most navigable time of year there. (Resupply to Cambridge Bay and Resolute Bay is traditionally in August, many barges and ships.)
So reminiscent of the similar failed Antarctica expedition of Dr Chris Turney and his ship of fools who got stranded in December 2013.
I read a story last week that said there was a 33% increase in Arctic ice in 2013-2014. I don’t recall seeing this increase in the NSIDC graphs.