Guest Post by Bob Tisdale
As you are well aware, there is a very basic difference between the updates to the NOAA and UAH global temperature datasets: the NOAA update increased the warming rate of their product during the slowdown in global surface warming, while the UAH update decreased the warming rate of their lower troposphere dataset in that timeframe. We’ll discuss another basic difference between those updates in this post.
Some people, Tamino (a.k.a. Grant Foster) for example, believe my discussions of the recent changes to the NOAA and UAH global temperature products show bias on my part. He says I use insulting language when discussing the NOAA changes but that I choose flattering words for the changes to the UAH data. Tamino closes his post with, speaking of me:
The obvious conclusion is that when revision goes the way he wants it’s “much corrected” and “enhanced” but when it goes the way he doesn’t want, it’s “unjustifiable” and “overcooked.”
Thanks, Tamino, for the opportunity to present once more why I have stated (and will continue to state in the future) that the new NOAA ERSST.v4-based data are unjustifiably overcooked.
IT’S VERY EASY TO SEE THAT NOAA CAN’T JUSTIFY THEIR ADJUSTMENTS DURING THE HIATUS (HIATUS BEING NOAA’S CHOICE OF WORDS)
The biggest changes to the NOAA NCEI (formerly NCDC) data took place in the sea surface temperature portion (the change from the ERSST.v3b to the ERSST.v4 datasets) of their combined land and ocean surface temperature dataset. See Karl et al. (2015) Possible artifacts of data biases in the recent global surface warming hiatus (paywalled). NOAA used the night marine air temperature dataset (HADNMAT2) from the UK Met office as a reference for their new ERSST.v4 dataset. But the short-term warming rate of the new NOAA ERSST.v4 data during the global warming slowdown is much higher than the HADNMAT2 data. See Figure 1, which was first presented in my open letter to Tom Karl. That graph serves as the basis for my statements (1) that the recent update to the NOAA sea surface temperature data cannot be justified by the dataset that was used a reference for those adjustments, and, in turn, (2) that the NOAA adjustments are overcooked.
 Figure 1
Bottom line for the NOAA adjustments: I can support with data my statements about the NOAA ERSST.v4 sea surface temperature-based global temperature products being unjustifiably overcooked.
WHAT ABOUT THE TREND-LOWERING CHANGES TO THE UAH LOWER TROPOSPHERE TEMPERATURE DATA?
The changes to the UAH lower troposphere temperature data brought their short-term trends down into line with the product from RSS. Simple. Nothing controversial. The short-term trends of the UAH data are NOT lower than the RSS data. In fact, the UAH lower troposphere temperature data show slightly less cooling (not more) than the RSS data. See Figures 2 and 3.

Figure 2
# # #

Figure 3
(Figures 2 and 3 are Figures 7 and 8 from the most recent global surface temperature update, without the three surface temperature products.)
Bottom line for the UAH changes: unlike with the NOAA data, we can’t say the changes to the UAH data are unjustified because they are so similar to those of RSS, and, as a result, we also cannot say the UAH data are overcooked…or undercooked, depending on your point of view.
ADDITIONAL READING
We discussed the unjustifiable and overcooked changes to the new NOAA sea surface temperature data in the posts:
- NOAA/NCDC’s new ‘pause-buster’ paper: a laughable attempt to create warming by adjusting past data
- More Curiosities about NOAA’s New “Pause Busting” Sea Surface Temperature Dataset
- Open Letter to Tom Karl of NOAA/NCEI Regarding “Hiatus Busting” Paper
And because GISS has recently switched to the new NOAA ERSST.v4 data, see:
The Three Faces of the GISS Land-Ocean Temperature Index (LOTI)
I discussed the update of the UAH lower troposphere temperature data in the post:
New UAH Lower Troposphere Temperature Data Show No Global Warming for More Than 18 Years
CLOSING
I opened the post with a fundamental difference between the NOAA and UAH changes to their global temperature products: the NOAA update increased the warming rate of their product since 1998, while the UAH update decreased the warming rate of their dataset. The other fundamental difference: The changes to the UAH dataset can obviously be justified, while the changes to the NOAA data obviously cannot be.
Refering to another topic in Tamino’s post, I wonder if Tamino would prefer the term “hiatus busting” instead of “pause busting”, considering that Karl et al (2015) used the term hiatus, not pause, in the title of their paper Possible artifacts of data biases in the recent global surface warming hiatus. Mmm, probably not, because Tamino uses the same misdirection as NOAA did in Karl et al.
Again, thanks, Tamino, for the opportunity to once again illustrate how NOAA unjustifiably overcooked their adjustments to their ERSST.v4-based data. It has always been a pleasure responding to you. Welcome back.
What is pretty obvious is the quote by Tamino can be about himself.
It is not too difficult to change the slope of a flat line (with ~zero slope)
by changing the data at either end. Maybe that’s what Gavin meant when
he said it just shows how sensitive the “hiatus” is.
Well the key element as to “how sensitive” something is, is how big does it have to be to pass the smell test of “Statistically significant.”
The pause length that M of B computes each month is predicated on the trend slope not being statistically significantly different from zero.
The raw unexpurgated data is what determines what the statistical level of significance is; and of course the numerical origami rules of statistical mathematics. (which were made up by somebody else; not me. )
g
“The changes to the UAH lower troposphere temperature data brought their short-term trends down into line with the product from RSS. Simple. Nothing controversial. The short-term trends of the UAH data are NOT lower than the RSS data.”
Understood. However, who’s to say that RSS is any more correct than UAH? Why is RSS the “gold standard”? Did UAH find some reason why their satellite record contained a warm bias when compared to RSS?
If you checked Dr Spencer’s blog, he gives a number of reasons of why UAH ver 6 produced a cooler trend. Here’s one reason:
“After 25 years of producing the UAH datasets, the reasons for reprocessing are many. For example, years ago we could use certain AMSU-carrying satellites which minimized the effect of diurnal drift, which we did not explicitly correct for. That is no longer possible, and an explicit correction for diurnal drift is now necessary. The correction for diurnal drift is difficult to do well, and we have been committed to it being empirically–based, partly to provide an alternative to the RSS satellite dataset which uses a climate model for the diurnal drift adjustment.”
And here’s another:
“The LT retrieval must be done in a harmonious way with the diurnal drift adjustment, necessitating a new way of sampling and averaging the satellite data. To meet that need, we have developed a new method for computing monthly gridpoint averages from the satellite data which involves computing averages of all view angles separately as a pre-processing step. Then, quadratic functions are statistically fit to these averages as a function of Earth-incidence angle, and all further processing is based upon the functional fits rather than the raw angle-dependent averages.”
I think people have it wrong. Dr Spencer didn’t adjust UAH to fit RSS. He recalculated the diurnal drift as well as the LT per normal procedures. As he stated earlier in the piece, they are constantly working to improve the UAH product with every major version. The end result with Ver 6 is that it is closer to RSS than past versions.
There is no gold standard. RSS and UAH are different satellite sensors, each with their own problems. But, both products have a much higher degree of consistency compared to either NOAA or GISS. .
Thanks, JP.
Dr. Spencer’s blog article is at http://www.drroyspencer.com/2015/04/version-6-0-of-the-uah-temperature-dataset-released-new-lt-trend-0-11-cdecade/
NavarreAggie: “Understood. However, who’s to say that RSS is any more correct than UAH? Why is RSS the “gold standard”?”
Recall that RSS TLT data were first prepared to show that UAH had underestimated the warming rate. That doesn’t necessarily make them right now. They simply serve as a reference.
In my early research days, I was roundly chastised for including color commentary in my first journal-focused research article. My writing was redlined to the point it looked like someone had been murdered on it. So let me try a dry critique related to my incomplete understanding of the satellite record adjustments:
What we have regarding satellite derived temperatures are two different methods for presenting a global temperature average that attempts to represent the measurement of tropospheric heat conditions. That is a well accepted standard way of demonstrating observation robustness. Diurnal drift artifact is a mechanism well understood by many disciplines. It is a potential artifact in both types of satellite measurement methods being discussed here. One method to correct for it is partly derived from a climate model (dynamical or statistical version I do not know) used to adjust diurnal drift, the other method is partly derived from a physics-based mathematical mechanism calculation designed to accommodate the known physics of satellite diurnal drift. As to the effort made that resulted in the two methods showing close agreement, the two methods appear quite divorced from each other though I don’t know the particulars. I do not have first hand knowledge if conversations occurred between the two camps as to why their products differed so a double blind study cannot be affirmed by me. I am unaware of potential author bias so cannot speak to that issue in either camp as to any goal to get the two methods to agree closer (which would be a bias if that was the point of adjusting either method).
NavarreAggie: I am constantly surprised that this or similar questions are so regularly being asked.
Both RSS and UAH track so closely with the radiosonde weather balloon data, whereas the publisised surface temperature datasets diverge in the direction of warming.
It would be very interesting to see a graph comparing data from radiosondes over the continental USA and the USNCR network.
You’ll have to ask Roy Spencer for that.
It all just shows that none of the people publishing so-called data sets actually have much of a clue what the global average temperature is now, has been in the past or will be in the future. At which adjustment are we supposed to cry “Eureka! The science is settled. We know all the answers.”
They change the trends with every adjustment then claim to predict/postulate/indicate a trend for the future.
Nope. It does not work that way. Karl’s only contribution to the debate is to prove that it is all nonsense.
Ivor, data sets are not predictions, they are history.
Andres, NOAA “data” sets are history only in the sense of history as provided by the USSR or the Ministry of Truth. “Data” sets that are the results of regular, substantive revision are not history.
“Karl’s only contribution to the debate is to prove that it is all nonsense.”
I think you are more right than wrong. I would not make it quite so categorical, though, saying it is all nonsense. What I would say is that the results are significantly speculative, as the true error bars are large enough that there is ample room for statistical games to be played, and subjectivity to creep in.
I think Bob Tisdale has, however, made the point that the NOAA adjustments are arbitrary, with an end goal in mind, which is to eliminate the “pause” or “hiatus”. Conversely, the UAH adjustments are systematic, based on solid physics, without an end result in mind. Furthermore, they bring the UAH product into line with the other satellite processing used for RSS.
The NOAA adjustments are discordant with previous results and with the satellite data, while the UAH adjustments are consistent with previous surface results, and with the other directly comparable alternative.
I think Bob Tisdale has, however, made the point that the NOAA adjustments are arbitrary, with an end goal in mind, which is to eliminate the “pause” or “hiatus”. Conversely, the UAH adjustments are systematic, based on solid physics, without an end result in mind. Furthermore, they bring the UAH product into line with the other satellite processing used for RSS.
Actually they don’t, version 6.0 is a different product than version 5.6 or RSS TLT. In order to get the match with RSS version 6.0 has a larger contribution from the lower stratosphere, its profile is closest to the RSS TTT, not TLT. Rather an arbitrary change wouldn’t you say?
http://www.drroyspencer.com/wp-content/uploads/MSU2-vs-LT23-vs-LT.gif
Also, the satellites and the surface have always had a historic margin of difference with minor flux. Mainly the satellites were more sensitive to El Nino like in 1998. Now the divergence is at a record, the homogenization (elimination of perfectly good stations) of the surface record is at a record level, and the surface shows greater sensitivity to the current El Nino, contrary to known physics. (None of this supports the surface record)
“Same as RSS, so ok” is a weak argument. Skeptics putting all of their eggs in the hiatus basket should be prepared for UAH to be taken over and brought into line with the AGW agenda. All will match, so based on the above logic, they must all be right.
the correct scientific argument is that station/bouy data should be brought into line with satellite data, but this is not about science. it is about politics. Spencer wont fold, Mears may. UAH is pro sceptic, RSS is pro alarmist with Mears doing the right thing for the time being. all of the ground/sea datasets are pro alarmist.
“the correct scientific argument is that station/bouy data should be brought into line with satellite data”
…
I think you are confusing “opinion” with what a “correct” argument is.
UAH is not Grove City, so the Federal government has some control. UAH depends on significant funding from various agencies. One person can’t stand up to the Feds.
VikingExplorer says: “’Same as RSS, so ok’ is a weak argument…”
The same could be said about NOAA using a night marine air temperature dataset as a reference for a sea surface temperature dataset, especially when you consider the reasons why surface temperature data suppliers use sea surface temperature data instead of night marine air temperature in their combined land-ocean datasets. See:
http://www.cru.uea.ac.uk/cru/data/temperature/#faq4
“Over the ocean areas the most plentiful and most consistent measurements of temperature have been taken of the sea surface. Marine air temperatures (MAT) are also taken and would, ideally, be preferable when combining with land temperatures, but they involve more complex problems with homogeneity than SSTs (Kennedy et al., 2011). The problems are reduced using night only marine air temperature (NMAT) but at the expense of discarding approximately half the MAT data. Our use of SST anomalies implies that we are tacitly assuming that the anomalies of SST are in agreement with those of MAT. Kennedy et al. (2011) provide comparisons of hemispheric and large area averages of SST and NMAT anomalies.”
So did Karl et al. adjust the sea surface temperature data to an inferior reference?
>> The same could be said about NOAA using a night marine air temperature dataset
Right, so why are you making the same argument?
Is this the paper you are looking for Bob?
http://sciences.blogs.liberation.fr/files/noaa-science-pas-de-hiatus.pdf
Viking, it is not the same argument. RSS was not used to determine UAH, and RSS is an excellent data set. Both satellite sets are tested thousands of times with weather balloons. That is why independent methodology resulting in nearly identical results is cogent.
David A,
What will your argument be when RSS and UAH are “adjusted” to fit the AGW agenda?
My point is that skeptics need to stop playing their game and move on from the “It’s hot”, “no, it’s not” argument. Skeptics need to develop a more sophisticated scientific argument against AGW. In a chess game, do you anticipate the opponent’s move, or not? It’s a war, and the opponent is weak, should we stay on the defensive or attack?
Let’s face it, data should be data. Full stop. End of story. No excuses. No adjustments.
Once you adjust data, even once, for whatever reason, we are no longer doing science. We are doing opinion and personal bias.
Put everything back as it was. Show on graphs where instruments changed, or where airports were built, or where orbits declined, etc, etc, but let the data speak for itself and leave everyone the opportunity to interpret it as is.
This statement is very true. The only true data is that which was collected and recorded. Any change to the recorded data creates a fiction. If a site is no longer suitable for data collection, collection at that site needs to be terminated and data collected somewhere else. The collected data cannot be “corrected” to (hopefully) remove problems inherent at the collection site. Any such correction naturally introduces a bias.
Suppose you had a site that was measuring temperature.
…
You examine the daily high temps, and you see the following.
..
56, 62, 57, 63, 147, 52, 58
…
Now…..do you keep this data, or do you investigate and do something about the “147?”
Sure, tossing outliers is a normal process. Let us assume that the data providers have discarded outliers from their dataset. Now let’s assume that somone is using that dataset as input to a model. He, in his own way, tosses outliers from the dataset for the production of his data product. The next fellow uses the data product as input to his own model; and tosses outliers again. Repeat ad infinitum.
One can justify tossing outliers from the data; but can only justify doing it once during the entire chain of provenance. The large, and rather unresolved problem, about outliers is that we cannot distinguish between a ‘true’ data point and a ‘false’ one. It may really be that 147 was a correct instrumental reading that suggests a multimodal distribution. But should we toss it for the sake of producing a more convenient distribution then do we have data or a data product?
So long as we consider that the instrumental reading was correct, then our choice of outliers is a de facto construction a data product. For good or ill, and all that entails.
This is quite different than if we receive 147 and then use that as a suggestion to validate that the instrument is not failing. And if it is failing — and this can be shown — then the instrument’s data should be removed. But if just one instrument out of numerous makes or breaks your results, then there are larger problems in the study design.
Jquip: “One can justify tossing outliers from the data”
…
Thank you Jquip.
..
So, if you can justify the process, it is OK with you.
…
In other words, “adjusting” is OK if it is justified.
…
I see your point.
@joel D. jackson
“Suppose you had a site that was measuring temperature.You examine the daily high temps, and you see the following.56, 62, 57, 63, 147, 52, 58 Now….do you keep this data, or do you investigate and do something about the “147?””
If you’re a climate scientist, you adjust all the other numbers up to match the 147.
If any process can be justified, it is ‘OK’ as a process. What that doesn’t entail is whether the justification is valid and sound. Nor does it mean that your conclusions can ignore the process used to achieve it.
Note: It would help you, in considering this issue, to actually respond to what I wrote rather than half a sentence taken out of its explanatory context.
Now…..do you keep this data, or do you investigate and do something about the “147?”
=====================
you keep the 147 because it tells you loud and clear that you error bars are large. if you get rid of the 147 and recalculate your error bars they will now appear small, but that is a fiction.
for example. say my data set was 1,3,5 and I adjusted this to 3,3,3. Statistically, the average remains unchanged, but my standard error in the second set of data is reduced to zero!
So my adjusted data set looks very accurate with zero error. But that is pure nonsense. My standard error remains unchanged, but statistically that fact is now hidden from us. Whenever we use the second set of data we will believe statistically the result is much more robust than in fact it is.
If the adjustment is “valid and sound” then it is justified, correct?
Which then implies that a “justified” process, it is OK with you.
…
Right?
fred burple: “you keep the 147”
…
Congratulations Fred, you have now recorded the highest temperature ever measured on the surface of the planet.
Okay one and all; good o’l 147, do you toss it or not? First you must determine is the measurement real. Then why so outlandish. Simply tossing the reading is the lazy persons way of dealing with the problem, After all the “147” may be a warning that this individual station has something wrong or odd with it . or worst the entire system of stations is unreliable. The would render all the date suspect and require it’s exclusion.
Most likely the problem is simple and require a adjustment in hardware not just the data. you do not just willy- nilly discard data because gosh darn it looks funny.
snarl
michael
btw anyone out there familiar with “MIL i”?
Congratulations Fred, you have now recorded the highest temperature ever measured on the surface of the planet.
Ah Joel can we say Bikini Atoll?
michael
Joel:
Making a claim about an argument made does not produce a question by tacking a squiggly on the end of the claim. It’s the sort of dishonesty one finds in asking: “When did you stop beating your wife?” In your first response you discarded the context to make your claim. In your second response you have repeated the behaviour.
Once again, read what I wrote and address it. If you are unclear on any of the specific points I made, ask a question about those and I will clarify the issue for you. If you wish to rebut the points I made, then mention them and make your rebuttal.
1) “Sure, tossing outliers is a normal process”
…
2) “One can justify tossing outliers from the data”
..
You can dance around the words if you feel that will compensate for the fact that you accept justified adjustments to data.
..
Doesn’t bother me, because most of the “adjustments” I have seen are both valid and sound.
Joel D. Jackson:
You say
OK. Either you are – as you usually do – spouting nonsense or you are the man I have been looking for.
Please explain how it is possible for these adjustments to be “valid and sound”.
Richard
from Joel: “Doesn’t bother me, because most of the “adjustments” I have seen are both valid and sound.”
Could you please provide some examples of the valid and sound adjustments that you have seen? I’d be interested in seeing an actual example
Thanks
Joel:
I can hardly dance around the statements I have made. Despite this, you are refusing to acknowledge the statements I have made. After having been cautioned about quoting improperly and out of context, you have simply redoubled your efforts by repeating your improper quote without addressing at all why it is legitimate to take partial statements out of context. I can only assume that either you have never been in an educational environment, or that you are simply arguing in bad faith.
We are, of course, talking strictly about outliers rather than ‘adjustments.’ For those treatments of outliers that you consider valid and sound: Did all of them fall under one or the other — but not both — of the treatments of outliers that I outlined? And if they did, which?
And if they did not fall strictly under one of the two notions I mentioned, then what is your argument for valid and sound should they be the discarding of valid data that indicates multi-modal or other non-gaussian distributions?
1) Jquip…the last time I checked, throwing out an outlier was an “adjustment”
…
2) gbreton……UAH version 6
…
3) richardourtney….. see item number 2, or if you like, go visit Spencer’s site and read about it.
Joel:
One kind of triangle is a right triangle, therefore all polygons are right. Need I further explain the nature of the fallacy you are engaged in?
Sadly, I’m now faced with a difficulty. For if you had any interest in discussing the issues at hand you would certainly have addressed the points I raised. Or, failing that, have addressed the questions I asked of you regarding the conditions of the adjustments you find proper and adequate. It is always possible that you find this manner of fallacious reasoning sufficient as a guiding notion of reason in your life; but as it would prevent you from sorting out how to tie your shoes, I reject that you are suffering under such a mental defect. But if so, I must conclude that you are simply arguing in bad faith.
But then you are not here to either learn or teach, but to count coup. To approach the inhuman other and touch him with a short stick. So allow me to applaud your bravery, you did indeed approach someone over the internet and get close enough to throw keystrokes at him. But such primitive rites of manhood have little to do with a discussion about statistics.
” Need I further explain?
…
No, nothing you say will change the fact that throwing out the outliers is an adjustment.
…
There are countless other valid and sound reasons for adjusting the raw data. I don’t need you to explain any of them to me.
“There are countless other valid and sound reasons for adjusting the raw data. I don’t need you to explain any of them to me.”
No Joel there are not. The data is ether valid or not. If valid in its entirety. If not, then entire station is unreliable. You do not adjust, bend crumple or mutilate. Nor substitute But rather as of old list, “here there be monsters,” its unknown country. Anything else in just the flavor of the week.
michael
Mike the Morlock says:
…
” You do not adjust, bend crumple or mutilate. Nor substitute .”
….
So Mike, which version of UAH do you consider “valid” version 5 or version 6 ?
Joel:
Save the one case, I highlighted, sure. But if you either never read my statements, or you’re continuing to pretend that you haven’t.
Well sure, we’ve already established that you’re simply counting coup. But I asked you to explain to me the valid and sound reasons with respect to the conditions I laid out in my statements. That you have not done so continues to carry the charge of bad faith against you. For either you do not know and are speaking from faithful adherence to a religion you don’t understand, or you know already that you cannot prevail if you address the issue, or — again — your whole purpose to to enact a primitive rite of manhood.
I look forward to your next refusal to converse in good faith, to educate, to illuminate, or to learn.
1) “we’ve already established that you’re simply counting coup”
…
WE’VE? Really? You and who else?
…
2) ” For either you do not know and are speaking from faithful adherence to a religion you don’t understand, or you know already that you cannot prevail …False dichotomy
…
3) Lastly, you should not use the term “good faith” when you characterize something as a “religion” when it is not.
Joel:
The two of us, obviously. Unless you consist of a multiplicity of people, that is.
…
Well, it certainly is if you truncate the quote to remove the third item listed. And certainly, if you were arguing in good faith you would have began by claiming a false trichotomy. But it’s not sufficient for us to accept an accusation from known child molesters as yourself without a demonstration of the assertion. For if it is sufficient then it has been shown that you are child molester. Again, I should think I hardly need to explain the failures in your reasoning to this degree since you’re obviously able to operate a keyboard.
If you think this one of the dichotomous trichotomy was in bad faith, simply make your argument. Though, really, I’m uncertain as to why we should trust a child molester such as yourself on such matters. (I trust this suffices to educate you on the need for more than raw assertion.)
And yet again, I admire your bravery. Your fellow primitives must have appointed you the tribal shaman by this point. But if you had intention to converse in good faith it remains that you keep wasting opportunities to show it by refusing to deal with the answers originally provided to your question, or the questions asked about your conclusions.
“The two of us,” …. a swing and a miss….don’t count me.
..
” known child molesters as yourself ” …..wow… you think that comment bolsters your argument?
…
That remark ends this as far as I’m concerned.
Joel:
What an unsatisfactory conclusion to this exercise. I cannot tell if you have admitted that you are a child molester, or admitted that you have erred in not making and supporting arguments.
“So Mike, which version of UAH do you consider “valid” version 5 or version 6 ?”
Sigh, same problem. Why change from UAH5 to version 6 “if it’s not broke don’t fix it”!
What it boils down to in the end Joel is that we have no real way to measure temp accurately. not surface, nor troposphere. At best we merely have several guessing sticks. Our problem is that we have means of calibrating any of these tools.
we are arguing in circles.
I’m probably going to catch it for this but what the hay.
michael
Oops I meant ” we have no means of calibrating”
Arguing with Goo Goo Ga Joob is a total waste of time. He is a time wasting troll.
“data should be data” Weather data is surprisingly tricky to gather, even with the fantastic equipment available these days. Try it for a few years yourself and you’ll see what I mean. I can only imagine how messy the data from 50-100+ years ago is since it is based on more primitive equipment and human effort rather than automation. Something needs to be done to make the data sets cleaner, although I agree with Mr. Tisdale about not “overcooking” things….
I would argue that the subset of weather data (temp) is not tricky at all to gather. What is tricky is trying to divine a .05 Celsius trend in a globally distributed sensor grid that records ranges of data from -87C to +55.
Madness is trying to control a trace gas through taxation based on the failed correlation between CO2 and this “calculated trend”.
Data never speak for themselves. It’s impossible. Rocks don’t speak for themselves, though geologists can work on them to construct an understanding of the earth.
The mind boggles, though, at the graph that your process would result in for something with as few data points (only a few thousand per day, only once a day, only for a few decades) as the surface temperature. Overlay the few thousand lines, complete with every annotation (battery changes, birds nesting, changing instruments, insect nests, the weekends the fans broke, the times the observer simply repeated a number from one day to the next, …) on every one of those lines.
And somehow you think that graph would be readable, and your eyeball corrections for the effects are better than any quantitative correction by scientists in the field.
Mike the morlock writes:
Wow. One day where the fan stopped renders the other 10,000 days of data from a station invalid.
I’ve seen some bad numbers come from satellites. Does that mean all (those at least) satellite data should be thrown out?
Bob
The NOAA data shows that global warming is real and that man is responsible . That man is KARL et al . who by the stroke of his pen doubles the recent rate of ocean warming. If his work were scientifically valid or correct a rise of this magnitude( doubling of temperatures ) would show up on the satellite data too.. But it did not . For NOAA to continue with the data manipulation is puzzling The game of “hiding temperature declines” and exaggerating the warming is still going on full blast.
NOAA in their article posted at their NATIONAL CLIMATE DATA CENTER entitled The RECENT GLOBAL SURFACE WARMING HIATUS claim that their recent study “refutes the notion that there has been a slowdown or hiatus in the rate of global warming in recent years
https://www.ncdc.noaa.gov/news/recent-global-surface-warming-hiatus
Yet NOAA’s own records show this to be incorrect. The hiatus is still happening despite NOAA gyrations to hide it.
• There is clearly very little if any record global warming happening since 2005 when it comes to global land area.
• Global land area temperature annual anomalies during the last 10 years show a flat or negative( cooling )trend of -0.02 C / decade according to NOAA own Climate at A Glance data. UAH satellite data confirm this
• Northern Hemisphere land area 12 month temperature anomalies during the last 10 years show a flat or slightly negative or cooling trend -0.05/ C/decade respectively according to NOAA own Climate at A Glance data.
• In North America, Contiguous US annual temperature anomalies show a negative or cooling trend since 2005 at -0.69 F/decade and a cooling trend of -0.48/decade since 1998 according to NOAA own Climate at a Glance data
• A similar pattern appears to be in Canada where 7 out of 11 climate regions show declining annual temperature departures since 1998; one is flat and 3 show warming . In other words 70 % of North American climate regions are not experiencing global warming but cooling.
• So how could global warming HIATUS be refuted when it is clearly still happening on most land areas globally or where people live.
The warmest year evah has not happened at any time in the last 1,000+ years, indeed, the hottest time in the last 100,000 years was long ago, way back to 10,000 years ago.
Pretending that this century is the warmest evah is insane. But it makes a lot of money taxing citizens!
It seems it is all to do with misuse or disregard of errors and failure to display the measurement errors and include them in calculations. Karl appears to have disregarded purpose built buoy’s with low errors and moved to the warmer ship inlet temperature measurements without regard to their errors. The error in measurements exceeds the claimed temperature change by probably an order of magnitude perhaps 2. So claims of 100th of a degree change based on averaging measurements with systemic positive errors in whole degrees is unscientific. But that is the ‘acceptable standard’ for climate science and now NOAA.
Quite frankly, making a ‘world temperature’ in the first place is a fraud. We can detect colder periods via increased glaciation across all zones that glaciate, for example. We can detect warming when oceans really do rise like they did after the last Ice Age ended. Measuring world ocean rises and falls that are less than a tenth of an inch is impossible as well as stupid. Just like claiming a climb of ‘global temperatures’ of 0.001 degrees is ‘warming’.
Opps. I must have used a verboten word!
“Opps. I must have used a verboten word!”
Yes, you did. You wrote, “… in the first place is a fr**d …” and that f-word is not allowed here. I did the same a couple of days ago and got a post put into moderation.
I would really, really like someone to tell me what it is with the f-word. We describe behavior here all the time that is fr**dulent but you can write that here without being sent to moderation. Then the mods approve the post later. Seems to be a waste of moderator’s time to me.
The only thing I can come up with is that this is a legal issue and the site is protecting itself from lawsuit. Am I close?
Everyone assumes measurement errors are random and average away, Ian. It’s in their papers. The assumption in the literature is as universal as it is unjustified.
Everyone assumes measurement errors are random and average away
=================
time series data almost never has random noise. instead, the noise is typically pink noise (1/f.). Pink noise does not average out because it is increasing with time. The reasons are fundamental to the Law of Large numbers.
As a result, no one can outperform the stock market index or forecast climate successfully. What you think is a trend may simply be noise from a very long period cycle. And we know from the paleo data that climate has cycles of 100k years or more, and thus also has very large noise. There is no known method to separate this noise from the signal, or even to identify what is signal and what is noise.
Thanks Bob, “Tamino” aka Grant Foster is essentially a nobody, since he’s too much of a coward to put his words to his posts. I generally ignore him because people like him that don’t have integrity seem to be a dime a dozen in the climate debate. When Grant Foster gets enough integrity to put his name to his words, maybe then he’ll be worth paying attention to.
But in this case, I’m glad you did.
UPDATE: For those of you following the link that Grant Foster made from his Open Mind (yes, really!) blog made to this comment, you might also like this one.
” I generally ignore him”
…
Maybe you should remove the link to his site from your list of links in “Pro AGW Views”
‘Maybe you should’ note how many alarmist sites link to skeptical ones. This is a big tell, but do I need to tell you that?
=============
“Maybe you should remove the link to his site…”
Why?
Thanks Bob Tisdale. Thanks Anthony Watts.
____
since Karl et.al. we now it never was about ‘settled science’.
It was about a new Doomsday Book:
after depopulizating, decarbonizating of Essex, Sussex, Wessex bring your own Gang to fester on the new ‘organized’ remnants.
AND fix YOURE DATA in – the doomsday book.
Hans
Another government group that is putting out questionable climate science
June 22, 2015
EPA Report: For the US, Global Action Now Saves Lives and Avoids Significant Climate Change Damages
From Section -Temperature Change in the U.S.
Under the Reference scenario, the largest increases in average temperature across the contiguous U.S. by 2100 are projected to occur in the Mountain West—up to a 14°F increase from present-day average temperature (Figure 2). The northern regions are also likely to see larger temperature increases than the global average (up to 12°F, compared to a global average of 9.3°F), while the Southeast is projected to experience a relatively lower level of overall warming (but comparable to the global average increase).
Yet regional trend of US Annual temperature anomalies since 1998 shows a different trend the last 18 years
8 out of 9 climate regions show a cooling trend
• OHIO VALLEY -0.9 F/decade
• UPPER MIDWEST -1.5 F/decade
• NORTH EAST -0.1F/decade
• NORTHWEST -0.1 F/decade
• SOUTH -0.5 F/decade
• SOUTHEAST -0.4 F/decade
• SOUTHWEST -0.1 F/decade
• WEST +0.7 F/decade
• NORTHERN ROCKIES & PLAINS -1.0 F/decade
•
• These temperature anomaly trend declines are similar to past temperature declines in United States during 1895-1920 and again 1953 -1979. A similar cool period seems to have started during the current decade. So the EPA projections are doubtful.
Mountain West—up to a 14°F
===============
According to the IPCC’s own figures, US action on climate will reduce this to only 13.9985°F.
ferd berple
I think you misunderstood what EPA is saying . They are not saying that the temperature is going to 14 F but “up to a 14°F increase from present-day average temperature “
I’ve said it before but I will say it again- adjusting the best quality data we have (thermometers and their descendants) using worse data quality is ludicrous.
If we have better data than the data being adjusted, then let’s use that – but we don’t do we?
The best quality data is simply that – the best quality.
Yes, Tim. Common sense is the correct scientific approach.
Honesty helps too.
TLDR: We can only adjust better towards worse, and not worse towards better, in the general case.
Adjust, how? Take the latest Heath row as an example. The modern thermometers are so quickly sensitive that they apparently recorded a new high for being downwind of jet exhaust. But if that counts as a valid environmental measurement, then we ought just paint the stevenson screens black and station them in the basement of New York City tenaments, right next to the boiler.
But is it valid to use a mercury or alcohol thermometer in the same enclosure as a backstop or sanity check for the hi-tech instruments? Well, no, fundamentally. They’re simply not commensurate. Each has a different response time and so they each act as a smoothing filter against instantaneous temperature. But they are different time scales. And it would seem neat to say that we could add extra smoothing to make the fast one match the slow one. But it’s not simply smoothing but a case of thermal inertia, if you will. Such that we cannot say a priori which one shows greater highs, or lows, in any given case. While we can certainly model the issue, and perform smoothing, unless we have an exhaustive quantitative model, mapping of the better one to the worse one, we simply have nothing at all. But even if we have such a model, then how closely does it match the experimental data? What are the statistical bounds and variances established in a lab?
So far as I know, these notions are unanswered. But assuming they are and that the known laboratory experiment uncertainties are being propagated and dealt with responsibly, then there’s not much of an issue. But what we cannot do is make the slower of the instruments match the faster. It’s simply impossible as we don’t have the transient data available from it with which we can adjust it to match an instrument that does have the transient data.
But this isn’t, per se, the problem. Just as the Heath row shows. The question with the Heathrow airport is not whether the instrument produced a correct reading, it’s whether using the extremums of range over a day is a useful measurement. The answer is that it simply is not. The extremums are subject to all manner of transients that cannot be captured by unattended operation of the instrument. The temperature distribution over a 24 hour period is not Gaussian. And so the midpoint of the high and low cannot be said to be the mean, median, or mode of the temperature over that period.
Which is not to say that we cannot make use of such readings. But that they are impossible ‘dirty’ and filled with non-climate transients in their readings. That if we took an honest and responsible experiment as to the range of uncertainty between an actual and continuously measured temperature and the high/low midpoint that the noise would so swamp the signal that we’d have nothing here to speak about. That while the hypothesis of GW, AGW, CAGW, CC is all very interesting — that it is impossible to test. And, by consequence, has not been tested and found consistent or falsified on the basis of the instruments that can’t measure what we’re looking for.
“Heath row as an example. The modern thermometers are so quickly sensitive that they apparently recorded a new high for being downwind of jet exhaust.”
Apparently you’re completelty wrong. The rise of radiance at the same time was due to what? Why there’re so few spikes on such busy airport?
Jquip
Your comment raises an issue I have wondered about for years.
I have downloaded quite a few temperature series for locations from 49N to 82N in Canada and there is little or no trend in the highs (in fact many are declining) but an upward trend in the lows (less cold) resulting in an increasing “average”. But in fact, it isn’t really getting warmer.
The in the shape of the daily temperature curve that you refer to (and the above) is why I really wonder what meaning a “global average” temperature has. I guess it is an indicator of something, but I really wonder what?
Apparently different countries use different methods. Is there a standard method that perhaps BEST or others use?
http://www.nrcse.washington.edu/NordicNetwork/reports/temp.pdf
Since it is clear that different methodologies give different results, how meaningful is a global average?
Since a “Heath Row” type spike can affect the high/low average, a functional mean or median would be more appropriate. The Eureka temperature differential caused by a wind direction change a few years ago is similar. A “record” can be established by a simple wind direction change and anomalous equipment in the region of the recording device.
http://wattsupwiththat.com/2010/04/24/inside-the-eureka-weather-station/
So, what is the standard being used? What does the land record use versus the satellite record?
I have been meaning to ask this for years. I started my engineering career in the era of max/min thermometers and manual step adjustments to controls and ended it in the time of continuous data logging and computerized control feedback adjustments. However, comparing max/min data to continuous data must give different results so comparing historical data to current data must be close to impossible depending on the choice of the “averaging” technique.
Just curious.
I should add that I think I know what Canada does and they say it is in accordance with WMO standards but within their commentary, the WMO is a recommended standard and there are inferences that other countries do things differently. They also caution that their meteorological data is “unadjusted” and may not be suitable for climate studies or may contain “errors”.
http://climate.weather.gc.ca/climate_normals/normals_documentation_e.html
But it still leaves the question of what it all tells us.
The WMO position is that 30 years of records will smooth out the short term changes and that an average of daily highs and lows and averaged by month and years gives us “climate”. Thing is some of us have memories that are more than double that.
NOAA is to temperature data like Photoshop is to photos.
Climate truth is to Tamino, as Hollywood is to historical accuracy.
As a Photoshop expert, I kinda resent that: Photoshop, in the right hands for the right reasons, actually improves a photo. But, as Ansel Adams said, you have to start with the best photo.
NOAA seems to start with a slightly out-of-focus photo, then oversharpens…
Karl et al. (2015) Possible artifacts of data biases in the recent global surface warming hiatus
http://sciences.blogs.liberation.fr/files/noaa-science-pas-de-hiatus.pdf
The range of of values in a common empirical item , indicates just how ‘settled ‘ the whole thing is in reality .
For if something like that cannot have a common definition, what is the chance more complex values/questions are anywhere near has ‘settled’ has claimed ?
Thanks, Bob. This is yet another excellent post.
As always, you present the data to support what you argue.
The land-thermometer data clearly shows the drastic slope change in the global temperature graphs, all but the Met Office HadCRUT4 show global temperatures peaked and then flattened after the great 1998 El Niño. The Met Office HadCRUT4 shows a big spike in 2014, but GISS has the years 1998, 2005, 2010 and 2014 indistinguishable in temperature due to the 0.1°C measurement uncertainty.
The HadCRUT4 time series from the Climatic Research Unit, University of East Anglia (UK) shows little warming since 1998, after warming some 0.6°C since 1975.
The satellites’ global temperatures show a much more transparent story since 1979.
I show all the original graphs in my “Climate Change” page.
Creative science is the best form of propaganda. I tip my hat to the creative folks at NOAA.
http://notrickszone.com/wp-content/uploads/2015/07/ncep-2005-2015.png
NOAA’S own NCEP data does not support what they are saying. This is updated every six hours while using a finer grid.
The NCEP data is really all you need, to put people to shame. That is the “real” data, as opposed to the “adjusted” data.
If you want your short-term forecast to be correct, what data are you going to plug into your GISS model, “real” or “adjusted”? Of course you are going to use “real” data, which you will strive to make as accurate as possible, because even a “butterfly flapping its wings” can throw a model way out of whack, and the errors swiftly get worse as you forecast further out into the future.
The fact NOAA doesn’t use its own “adjusted” data shows that they themselves know how utterly worthless it is.
NCEP’s CFSR/CFSv2 is a data assimilating model. If you object to ‘adjusted’ data, then you cannot use CFSv2. Data assimilation is a process of globally adjusting data the best way possible, including (especially) filling in the gaps between observation.
It’s done under definitions of ‘best’ and ‘possible’ that the locals would almost certainly reject.
http://www.coyoteblog.com/wp-content/uploads/2014/06/1998changesannotated.gif
An example of the manipulation that is going on.
…and it continues .01 degrees at a time here and there, for NO EXPLAINED reason…
per Bll Illis post…
========================
“Here are the changes made to GISS temperatures on just one day this February. Yellow is the new temperature assumption and strikeout is the previous number. Almost every single monthly temperature record from 1880 to 1950 was adjusted down by 0.01C.
I mean every freaking month is history suddenly got 0.01C colder. What the heck changed that made the records in 1880 0.01C colder. Did the old thermometer readers screw up that bad?
http://s2.postimg.org/eclux0yl5/GISS_Global_Adjustments_Feb_14_2015.png
“GISS’ data comes from the NCDC so the NCDC carried out the same adjustments. They have been doing this every month since about 1999. So 16 years times 12 months/year times -0.01C of adjustments each month equals -1.92C of fake adjustments.
Lots of opportunity to create a fake warming signal. In fact, by now it is clear that 1880 was so cold that all of the crops failed and all of the animals froze and all of the human race starved to death or froze to death and we went extinct. 135 years ago today.” end of Bill I post.
====================
The question is do either UAH or RSS show any year close to as warm as 1998. The answer is no, they do not. Both show 2014 as nowhere near 1998, and both show 1998 as the “warmest year ever” to quote the CAGW phrase.
Both UAH and RSS are ballpark .3 degrees below 1998, both show 2010 and other years as warmer then 2014 and 2015. Schmitt proclaimed a what, 34% chance that 2014 was the hottest year ever based on what.04 degrees. By that measure there is a 100 percent chance that RSS and UAH show that 2014 was not the warmest year ever.
One of the big differences between the NOAA and the UAH updates is that one has justified its changes in a published article whereas the other just talked about it in a blog post and won’t release its code.
But, the “published article” makes plain that they substituted less accurate data for that with greater accuracy, with the specific goal of eliminating inconvenient trends. Just saying something is “published” provides no information on the quality of the work. There are reams of published works that are not worth the paper they are written on.
Figure 1 has no error bars on the data points nor an error on either of the computed slopes. What are they?
Neither a 0.5 nor 1.0 C change in temperature in a century means squat compared to the daily and annual variation in temperature that we all experience.
The problem is a combination of: a) a president seeking a legacy, namely saving the world from ‘global warming’, b) fuel in the form of tortured statistics to justify the idiocy of the Paris wonkathon later this year, and c) the grant addiction of second rate ‘climate scientists’.
What is a NOAA to do? Well, you have now got the answer.
Joel D. Jackson
“Suppose you had a site that was measuring temperature. You examine the daily high temps, and you see the following. 56, 62, 57, 63, 147, 52, 58. Now…..do you keep this data, or do you investigate and do something about the “147?””
As someone who has worked with data in a number of different fields for many years (albeit not with climate data). You investigate. If you could see no good reason for the outlier you would not use it. Occasionally, however, the very existence of an outlier is a key statistic. But you would still not use it.
The golden rule except, apparently, in climate science, is never to adjust an outlier and certainly never to replace it. Note it but leave it out.
An important point, and one that would prevent the recursive homogenization to which Jquip
@ July 20, 2015 at 9:51 am referred.
Occasionally, however, the very existence of an outlier is a key statistic. But you would still not use it.
====================
You most certainly do use the 147. If you remove the 147 your statistics are shot to hell. The 147 is telling you that your data has wide error bars.
The basis of statistics is that you don’t tamper with the sample after the collection. You don’t filter, you don’t average, you don’t adjust. Because the second that you do none of your statistical analysis is worth a crap.
You can of course still use the adjusted data, but any statistics you draw from the data is worthless. Worse than worthless, it will be misleading.
The 147 tells you your data collection is not accurate. It doesn’t tell you that ONLY the 147 is not accurate. It tells you that ALL the readings are suspect.
ferd berple YES! Have you ever worked with simple “spc” s? if you should get something like the “147” it means “you are not in control of your process” Its open season on all of your measurements.
michael
” You most certainly do use the 147. If you remove the 147 your statistics are shot to hell. The 147 is telling you that your data has wide error bars.
The basis of statistics is that you don’t tamper with the sample after the collection. You don’t filter, you don’t average, you don’t adjust. Because the second that you do none of your statistical analysis is worth a crap”
While I agree with ferd berple on most of his comment, I think he goes too far in saying that you don’t filter. All outliers have to be examined individually. Just because one outlier is suspect it does not mean that all the data is suspect.
Many years ago I was examining data for trial of a new treatment for glaucoma. One pair of readings obviously lay far outside the known acceptable range. It turned out that there had been human error. Instead of using thirty pairs of eyes we used twenty-nine. You don’t average and you don’t adjust but you do not include data which are obviously incorrect. You do filter. Unless, of course, you cannot ascertain why the outlier exists in which case you have a problem, as you may be chucking out the most important piece of evidence.
For the Terminal 5 Inquiry at Heathrow, the CAA expert on third party risk ran an intricate model composed of two stochastic sub-models and one deterministic model. The historic data used was based on Western-built and operated aircraft and excluded accidents at third world airports.
Since most aircraft accidents, in those days, occurred on take-off or landing, the model excluded accidents that had occurred more than seven miles from a runway. But while these were few relative to those that wereretained, they did represent those accidents which, for an airport such as Heathrow where more than 70% of landings come in over highly populated areas of London, were likely to cause the most deaths. To discard or overlook that data in calculating third party risk was inexcusable.
In that case you don’t filter.
As I said before, you do not adjust datum and you do not replace but you can and should often, but not always omit.
Climategate type temperature data manipulation does not change the reality of what did and what did not cause the warming in the last 30 years.
Regardless of what Tamino does or does not say, the planet is about to abruptly cool, due to the abrupt change to the solar cycle. What is currently happening to the sun and what will happen to the earth’s climate has happened again, again, again, and again. 23 cycles is the technical limit of how far one can look back with the proxy analysis that found the cycles have a periodicity of 1470 years plus or minus 12% in the Northern hemisphere. The Antarctic peninsula ice core analysis found 342 cycles in the last 240,000 years for example, same periodicity as the cycles in the Northern hemisphere. There is observational analysis that supports the assertion that the same cycle has been around for millions and millions of years.
http://www.pik-potsdam.de/~stefan/Publications/Journals/rahmstorf_grl_2003.pdf
http://wattsupwiththat.files.wordpress.com/2012/09/davis-and-taylor-wuwt-submission.pdf
While we wait for observational evidence of in your face cooling the following is interesting and supports the assertion that the majority of the warming in the last 30 years was due to solar cycle changes rather than the increase in atmospheric CO2, the corollary of that the planet will cool.
As the planet had warmed, we all assumed the cult of CAGW’s fundamental calculation (done more than 20 years ago by a half dozen specialists led by the founding father of CAGW, Hansen) of how much surface forcing a doubling of atmospheric CO2 will produce without ‘feedbacks’ is reasonable, in the right ball park. We all assumed the problem of why the IPCC’s general circulation models (GCMs) predicted warming does not agree with measured warming is due to incorrect modeled cloud feedback, incorrect assumed water vapor amplification of the forcing, and delay in forcing response not the fundamental AGW calculation, itself.
The without ‘feedbacks’ cult of CAGW’s calculation (this is the calculation that predicted 1.2C to 1.4C surface warming for a doubling of atmospheric CO2) incorrectly held the lapse rate constant to determine (fudge) the estimated surface forcing for a doubling of atmospheric CO2. There is no scientific justification for fixing the lapse rate to calculate the no ‘feedback’ forcing of greenhouse gases.
Convection cooling is a physical fact not a theory and cannot be ignored in the without ‘feedbacks’ calculation. The change in forcing at the surface of the planet is less than the change in forcing higher in the atmosphere due to the increased convection cooling caused by greenhouse gases. We do not need to appeal to crank ‘science’ that there is no greenhouse gas forcing to destroy the cult of CAGW ‘scientific’ argument that there is a global warming crisis problem to solve.
There is a surface forcing change due to the increase in atmospheric CO2 however the surface forcing change is almost completely offset by the increase in convection. Due to the increased lapse rate (3% change) due to convection changes (the 3% change in the lapse rate, reduces the surface forcing by a factor of four, the forcing higher in the atmosphere remains the same) therefore warming at the surface of the planet is only 0.1C to 0.2C for a doubling of atmospheric CO2, while the warming at 5 km above the surface of the planet is 1C. As a warming of 0.1C to 0.2C is insufficient to cause any significant feedback change, the zero feedback change for a doubling of CO2 is ballpark the same as the with feedback response.
http://hockeyschtick.blogspot.ca/2015/07/collapse-of-agw-theory-of-ipcc-most.html
https://drive.google.com/file/d/0B74u5vgGLaWoOEJhcUZBNzFBd3M/view?pli=1
Long-term records of sunspot number and concentrations of cosmogenic radionuclides (10Be and 14C) on the Earth reveal the variation of the Sunʼs magnetic activity over hundreds and thousands of years. We identify several clear periods in sunspot, 10Be, and 14C data as 1000, 500, 350, 200, and 100 years. We found that the periods of the first five spherical harmonics of the slow magnetic Rossby mode in the presence of a steady toroidal magnetic field of 1200–1300 G in the lower tachocline are in perfect agreement with the timescales of observed variations. The steady toroidal magnetic field can be generated in the lower tachocline either due to the steady dynamo magnetic field for low magnetic diffusivity or due to the action of the latitudinal differential rotation on the weak poloidal primordial magnetic field, which penetrates from the radiative interior. The slow magnetic Rossby waves lead to variations of the steady toroidal magnetic field in the lower tachocline, which modulate the dynamo magnetic field and consequently the solar cycle strength. This result constitutes a key point for long-term prediction of the cycle strength. According to our model, the next deep minimum in solar activity is expected during the first
half of this century.
http://cc.oulu.fi/~usoskin/personal/2041-8205_805_2_L14.pdf
The 1470-yr “precise clock” of Rhamstorf is far too sporadic to be reliable for forecasting. And the 342 cycles in the last 240,000 yrs gives a “period” of only 702yrs. Such are the travails of “cyclical analysis” without recourse to proper spectrum estimation methods.
Peter – IMO you nailed the drivers of this climate change nonsense. Also, IMO proof that CO2 has no effect on climate trumps all three.
Changing the reported temperature anomalies hasn’t hidden the proof that CO2 has no effect on climate. Only existing data [Phanerozoic (last 542 million years) and current ice age] and a grasp of the fundamental relation between math and the physical world are needed or used.
Proof that CO2 has no effect on climate can be expressed in steps as follows:
1) Atmospheric CO2 has been identified as a possible climate change forcing. Forcings, according to the ‘consensus’ and the IPCC, have units of J s-1 m-2.
2) A thermal forcing (or some function thereof) acting for a time period accumulates energy.
3) If the forcing varies (or not), the energy is determined by the time-integral of the forcing (or function thereof)
4) Energy, in units J m-2, divided by the effective thermal capacitance (J K-1 m-2) equals average global temperature (AGT) change (K).
5) Thus (in consistent units) the time-integral of the atmospheric CO2 level (or some function thereof) times a scale factor must closely equal the average global temperature change.
6) When this is applied to multiple corroborated estimates of paleo CO2 and average global temperature (such as extant examples from past glaciations/interglacials ice cores, and proxy data for the entire Phanerozoic eon), the only thing that consistently works is if the effect of CO2 is negligible and something else is causing the temperature change.
Three estimates of paleo temperatures are shown at these links:
Temperature during the Phanerozoic: http://mysite.science.uottawa.ca/idclark/courses/Veizer%20Nature%202001.pdf
Average global temperature and CO2 levels during the entire Phanerozoic eon (about 542 million years) http://www.geocraft.com/WVFossils/Carboniferous_climate.html.
CO2 & temp during glacial and interglacial periods of the current ice age: Figure 1 at http://www.skepticalscience.com/co2-lags-temperature.htm (Ignore the narrative nonsense at this site. SS has a poor grasp of the relation between mathematics and the physical world.)
For all time, atmospheric CO2 level must have been higher than 150 ppmv or so for life as we know it to exist.
We need to remember as well that UAH V5.6 increased the warming trend from V5.5. To an large extent V6.0 just takes us back to V5.5.
Of course, what Tamino needs to do is show how the UAH change is wrong, just as Bob has done with NOAA. I wonder why he can’t?
“Tamino needs to do is show how the UAH change is wrong, just as Bob has done with NOAA. I wonder why he can’t”
As far as I can tell, Tamino accepts both not one over the other. But he normally concerns himself with the surface record when he is talking about the surface.
They can not both be correct. The divergence is simply to great. The satellite response to El Nino is far more sensitive normally then the surface for fundamental physics reasons, but now the surface is showing greater sensitivity then the satellites. The surface is using a record level of homogenization.
The question is do either UAH or RSS show any year close to as warm as 1998? The answer is no, they do not. Both show 2014 as nowhere near 1998, and both show 1998 as the “warmest year ever” to quote the CAGW phrase.
Both UAH and RSS are ballpark .3 degrees below 1998, both show 2010 and other years as warmer then 2014. Schmitt proclaimed a what, 34% chance that 2014 was the hottest year ever based on .03 degrees. By that measure there is a 100 percent chance that RSS and UAH prove that 2014 and 2015 are not the warmest year ever; not even close.
As I pointed out above (July 20, 2015 at 7:25 pm) the UAH changes alter the product so it no longer covers the same region of the atmosphere as RSS TLT or UAH Version 5.5, I have yet to see an explanation from Spencer why they did that.
Which one uses or is thinking about using tree rings?
Bob Tisdale and also anyone when we -on both sides of the discussion look at data, methods conjecture are we bumping into the following?
“Heisenberg’s Uncertainty Principle”
and no, I can’t say I fully understand it.
michael
Heisenberg’s Uncertainty Principle arises as to measure the tiny things in the quantum sphere, that we must actively interact with them by the use of large and blunt tools. Such that if there are two properties, and we measure one with a large hammer, it necessarily changes the state of the other. And so we’re out of sorts for measuring all things, with infinite accuracy, at the same time.
When people ruminate other the data involved, however, it’s very easy to get into what we may as well call Heisenberg’s Confirmation Principle. We have a habit of seeing the same data set and then claiming of it that it supports just our preconception; thus confirming the validity of our preconceptions. If this is a concern to you then find your preferred conclusion, then find the strongest arguments against that conclusion. If the arguments are legit, then your preferred conclusion cannot be supported; and must be discarded. If the strongest arguments cannot throw down your preferred conclusion, then it gets messy. But the rule of thumb and short answer is, your preferred conclusion isn’t ‘proven’ or ‘supported’ at all by this exercise, it’s still simply a preference.
All things are subject to interpretation whichever interpretation prevails at a given time is a function of power and not truth.
Friedrich Nietzsche
Read more at http://www.brainyquote.com/quotes/quotes/f/friedrichn109379.html#zg63oDPpQaky8hxH.99
Locking in Antarctica. Ice growth slows down.
http://www.cpc.ncep.noaa.gov/products/precip/CWlink/blocking/real_time_sh/500gz_anomalies_sh.gif
http://www.bartol.udel.edu/~pyle/thespnplot2.gif
Our current satellite technology is at least 20-30 years old. While it is fairly accurate, isn’t there something better that could be sent into orbit? Shouldn’t the end of the world be enough of a reason to try and get a better set of data? I would certainly suspect better technology exists. So, why hasn’t it been employed?
Only one answer I can think of off hand. The folks that control the money do not want better data.
The satellite data is checked thousands of times against the most accurate thermometers we have in weather balloons.
NASA (earth science program) is the source for developing improved instruments for NOAA’s later operational use.
Lamar Smith, chair of House Science committee, bragged about cutting NASA’s earth science bugdet 40% at the latest Heartland conference.
You’re right. The folks that control the money do not want better data.
So the “fundamental” criterion for whether a change is good or bad is whether or not its simple linear regression line over a small subset of the data resembles that of another data set?
This has to be one of the weakest arguments against the Karl et al changes that I have read on this site. (and there has been some stiff competition)
No, the criterion is whether a change in trend is towards cooling (good) or warming (bad).
Aran, well said (better than I did).
I already explained, that is a gross mischarterization of the message in this post.
Has Grant Foster ever been right about anything at all? At what point should one ignore people who have been serially wrong? It would be interesting to plug new data into his pause-explaining paper to see how it looks today.
Have you ever play poker all night and it was getting late and you pushed a connector stone bluff on the river with a flush, straight, full house and straight flush showing on the board with nothing in your hand? Then you go all in. that is cagw right now.
and then the skeptics with the good hands fold instead of playing their advantage…
Given completely unsupportable changes that the NOAA had put into it’s database, I don’t see how anything short of insulting words would be appropriate.
I recommend an unheard of adjustment to the surface record…The C.B adjustment. (Confirmation Bias.)
https://chiefio.wordpress.com/2010/12/13/the-rewritten-past/
Phil Jones, 1985, about the temperature decline after the 1930´ies:
“No satisfactory explanation for this cooling exists, and the cooling itself is perplexing because it is contrary to the trend expected from increasing atmospheric CO2 concentration. Changing Solar Activity and/or changes in explosive volcanic activity has been suggested as causes… but we suspect it may be an internal fluctuation possibly resulting from a change in North Atlantic deep water production rate.”
==============================
“So, Jones said in 1985 that: “the cooling itself is perplexing” – but why not say so today? And why don’t we see a “perplexing” cooling after 1940 in the IPCC graphic today? And furthermore, back in the early 1980´ies Jones appears to accept data as is at least to such an extent that he is considering how nature has produced these “perplexing” cooling data – like a real scientist should. (EM Smith)
===============================
bob, why are you only showing data post-1998? NMAT2 and ERSSTv4 agree very closely over the full UAH / RSS record (1979-present)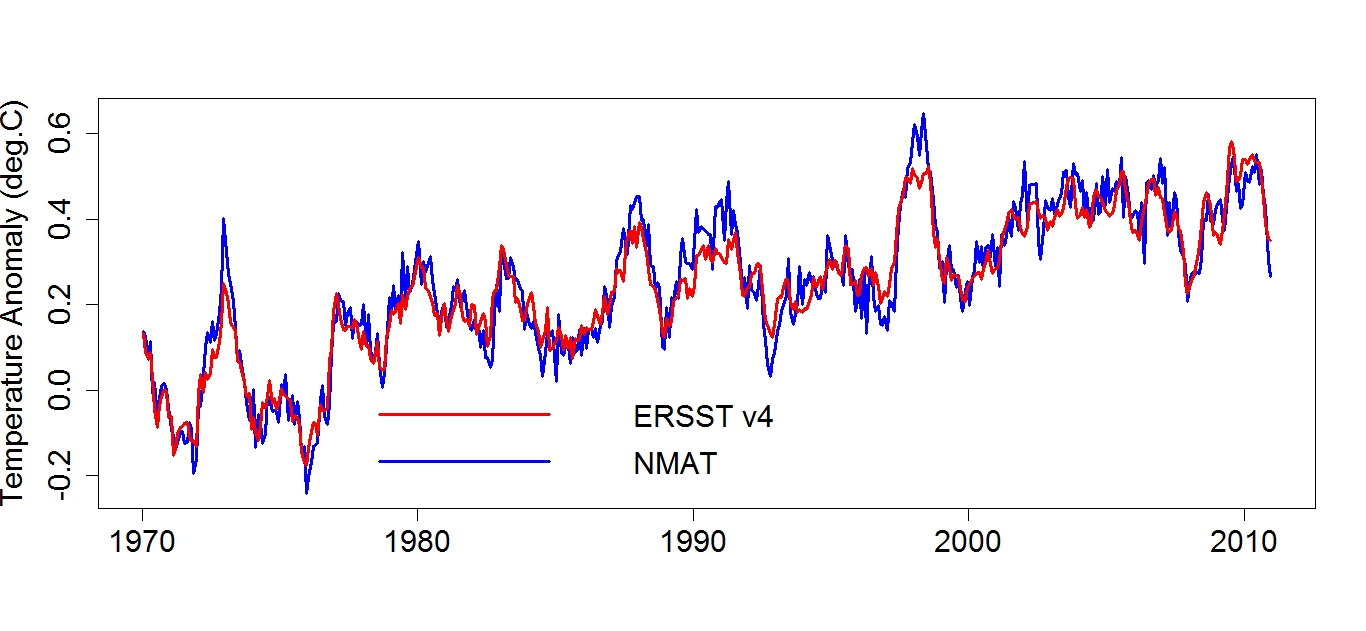
What about the other adjustments to the UAH data set?
Didn’t Kerl et al have a statistical significance of 0.10 or 10%?
Damn – Karl and it’s in the supplementary material.
Yes. When was the last time we saw accepting 0.10?
Dear Bob T: Thank you so much for digging into these things!!!! Extremely important.
K.R. Frank