Guest essay by Kesten C. Green
Global warming is a forecasting problem. The claim of the IPCC and sympathetic alarmists is that if we don’t stop emitting carbon dioxide, the Earth will be dangerously warmer in the future. How can they know that?
To put it another way, given the state of knowledge, are the IPCC using forecasting methods that are known to provide accurate forecasts?
In order to draw attention to this question, Professor Scott Armstrong in 2007 challenged former Vice President Al Gore to a bet on what would happen to global average temperatures over the next 10 years. Mr. Gore was getting a lot of media coverage at the time for his claims that temperatures on planet Earth were at a “tipping point” due to human emissions of CO2. He nevertheless declined, on the grounds that he does not bet.
With Scott Armstrong, I had published a paper evaluating the procedures that the IPCC were relying on for their scenarios of future dangerous warming[1]. We found that the procedures violated 72 out of 89 relevant evidence-based forecasting principles.
If you are not sure on whether that is bad or not, think of how many violations of evidence-based procedures by ground crew or pilots that are typically associated with a major airline crash. One or two, perhaps? Bear in mind, too, that commercial air travel is a much simpler, and better understood, situation than global climate change.
How would you react if the pilot announced before take off that he was sure that your flight was special, and so he would not be following the usual procedures?
With the draconian nature of climate policy and regulatory responses to the global warming alarm, getting the forecasting right would seem to be a fundamental requirement for avoiding making the wrong decisions. What if, as some scientists believe, we are in for another period of long-term global cooling?
With these concerns in mind, Scott Armstrong went ahead with the bet, in order to highlight the importance of using evidence-based (scientific) methods for forecasting. We set up theclimatebet.com site to monitor progress on “The Global Warming Challenge”.
The Global Warming Challenge is a notional 10-year bet between Al Gore—represented by the IPCC’s 0.03ºC per annum “business as usual” increase in global average temperatures—and Scott Armstrong—represented by the Green, Armstrong, and Soon no-change forecast[2]. Specifically, Armstrong bets that temperatures will equal the 2007 annual average against the scenario that temperature will increases from that level at a rate of one-twelfth of the IPCC annual increment per month.
The arbiter of the bet is the University of Alabama and Huntsville’s lower troposphere global mean temperature anomaly series originated and maintained by John Christy and Roy Spencer from satellite data. The final day of reckoning will be early in January 2018, when the UAH observation for December 2017 is released.
Is it really possible that the simple no-change forecast of 21st Century temperatures is better than the IPCC projections from expensive and complex computer models?
Yes, it is. That conclusion is consistent with the evidence Scott Armstrong and I present in our recently published review of evidence on the effect of complexity on forecasting[3]. We found that using complex methods increases forecast errors relative to the forecasts from simple methods that decision makers could understand by 27% on average. We expect that the results of The Climate Bet will increase that average.
Even more importantly, the IPCC has no regard for the Golden Rule of Forecasting[4]. The Golden Rule is to be conservative when forecasting by staying close to cumulative knowledge about the situation and about forecasting methods.
The IPCC scenarios are derived entirely in contravention of that fundamental rule of forecasting. The dangerous manmade global warming scenarios are premised on the unscientific (unconservative) assumption that “this situation is different”. Forecasting research tells us that ignoring the Golden Rule typically leads to an increase in forecast error of around 45%.
So how is the Global Warming Challenge progressing?
An up-tick in temperature anomalies in June saw Mr. Gore and the warming scenario score the first win against the no-change forecast since January of 2013, nearly two-and-a-half years ago. The outlook for the dangerous warming scenario remains bleak, however. Over the 7.5 years of the Armstrong-Gore Bet so far—we have now passed the ¾ mark—the errors that have arisen from projecting temperature to increase at a rate of 3°C per century are more than 50% larger than the errors from the no-change forecast.
The chart presents the entire history of the bet, to date, and the table shows the latest three years of data from UAH, and the Armstrong and Gore forecast figures.

[1] Green, K. C. & Armstrong, J. S. (2007). Global warming: Forecasts by scientists versus scientific forecasts. Energy & Environment, 18(7+8), 997–1021. Available online from http://www.forecastingprinciples.com/files/WarmAudit31.pdf
[2] Green, K. C., Armstrong, J. S., & Soon, W. (2009). Validity of climate change forecasting for public policy decision making. International Journal of Forecasting, 25, 826–832. Available online from http://www.kestencgreen.com/gas-2009-validity.pdf
[3] Green, K. C. & Armstrong, J. S. (2015). Simple versus complex forecasting: The evidence. Journal of Business Research, 1678–1685. http://dx.doi.org/10.1016/j.jbusres.2015.03.026.
See also simple-forecasting.com.
[4] Armstrong, J. S., Green, K. C., & Graefe, A. (2015). Golden Rule of Forecasting: Be conservative. Journal of Business Research, 1717–1731. http://dx.doi.org/10.1016/j.jbusres.2015.03.031
See also goldenruleofforecasting.com.
I suspect the current El Nino will help out Gore for awhile but the final date is far enough out to contain at least the beginning of the likely La Nina that follows.
What is your personal theory for why, if you break out the different types of ENSO years (El Nino, La Nina, neutral), you see an independent warming trend for each type of year? In other words, that La Nina that comes is likely to be warmer than past La Nina years, just as a mild El Nino this year is likely to set a new global temp record again, exceeding 1998 despite not being nearly as strong as that year.
AL Gore is a complete fraud…..”do as I do, not as I say” He also obviously has zero morals, ask Tipper.
Perhaps he meant to say TIPPER POINT rather than TIPPING POINT
I believe you meant “do as I say, not as I do.”
Honestly, I couldn’t do as Gore does even if I wanted to. Private jets, seaside mansions, electric bill of a small nation, bunch of kids. I don’t have nearly enough money to get up to Gore Levels of hypocrisy. >¿<
But why uah? Was it the troposphere that was challenged? I’m fairly certain Gore comes closer to losing with surface temperatures aswell?
Nasa spokesman Gavin Schmidt sums it up on twitter
https://mobile.twitter.com/ClimateOfGavin/status/621135215155650560/photo/1
“A model result is skillful if it gives better predictions than a simpler alternative.”
It is difficult to think of a model that is simpler than ‘no change’.
It would be hugely embarrassing if the billions spent, gave climate models that performed no better than ‘no change’ or callendar’s model from 1938 or linear extrapolation.
A friend of mine related a story he heard from one of his college professors regarding computer modeling. He said it was like masterbation, if you do it too often you think it’s better than the real thing.
What a jerk.
Very insightful.
He should give himself a big hand.
The audio/visuals can be interesting. If you like fantasy.
Well, forecasting is hard; especially forecasting the future.
Yogi Berra?
Forecasting the future is hard, but forecasting past is absolutely impossible.
“Forecasting the past” is a contradiction in terms but It is sometimes possible to “retrodict” the past. This is accomplished, for example, when the message that was sent is inferred by the decoder of a telecommunications system.
“Yogi Berra?”
In his memory at least. 🙂
I believe it was Neils Bohr of all people, later attributed to Yogi.
Chris y
“A model result is skillful if” ……. does not equal “no change” but rather a better prediction than the simpler alternative. That could be Lord M’s pocket calculator or me after a few beers.
🙂 michael
Here’s a link to why climate models don’t have to be validated that Gavin referenced on twitter: http://www.easterbrook.ca/steve/2010/11/do-climate-models-need-independent-verification-and-validation/
It uses the following assumptions: 1) The assumption there’s some significant risk to society associated with the use of climate models. 2) the assumption that the current models are inadequately tested / verified / validated / whatevered;(3) the assumption that our ability to trust in the models can be improved by an IV&V process; The article is filled with the usual nonsense. Basically, if the models don’t have to be validated because they don’t control climate policy, climate models don’t have “bugs”, and climate scientists are always validating the models through code rewrites using new information.
And, of course he will never say what “better” predictions are. “Better” than what???
In his remarks, Schmidt draws a conclusion from an “equivocation,” that is, an argument in which a term changes meaning in the midst of this argument; the term that changes meaning is “prediction.”
An equivocation looks like a syllogism (an argument that is known to have a true conclusion) but isn’t one. Thus, one cannot logically draw a conclusion from an equivocation. To draw such a conclusion is the “equivocation fallacy.”
One part of forecasting future climate which is never really talked about (in my opinion) is natural variability. If you think you know the effects of CO2 and make a projection based on estimated emissions, you still need to add in natural variability.
I’ve asked this many times with no satisfactory answer, where do the projections for future natural variaiblity come from? What are they? And when I ask about past natural variability the answer is just to subtract out the CO2 warming. This seems to be a circular argument to me. This is the kind of graph I am talking about: http://www.windows2universe.org/earth/climate/images/pcm_ensemble.png Where did that blue line come from?
yep…we can design accurate climate models….all based on something we don’t understand
“…we can design accurate climate models…””
Here, let me help:
“…we can design
accurateprecise climate models…”PiperPaul
No; you, me humanity in general, cannot …”we can design accurate precise climate models…”
At this time it is beyond us. To maintain such a view that we can and are, is folly. We are still in the learning phase.
Because of persons such as yourself trumpeting up models in this way people are losing all faith in them, in all areas of there use. This is a bad thing. It will probably be a generation before trust is restored to models by the general population.
michael
Pardon all, its “their use” not there
Mods please fix?
michael
Mike, did you not notice the word strikeout? And I submit that the climate models are indeed precise, that’s part of the problem.
@ Mike the Morlock July 18, 2015 at 10:36 am
You wrote:
You may have missed that PiperPaul used the stike tag to cross out “accurate” and then he used “precise” instead. PiperPaul makes a great point if you recall the difference in math/science in using “accurate” vs. using “precise”.
Accuracy is how close a measured value is to the actual (true) value you get.
Precision is how close the measured values are to each other.
It is easy to get precision since you just need all the runs of a model to yield results that are reasonably close to each other even if they are way, way, way off the mark as far as how close those results are to reality.
It is hard to get a model to be close to the real future value. Some say in regards to the earth’s climate that it is impossible.
I think you misunderstood PiperPaul’s point. He was saying that the models do not give us anything close to what the real temperature is going to be.
Correction accepted,
michael
They leave out the sun in their calculations. They pretend the sun never changes much and this has zero effect on climate. Utterly deranged.
Isn’t AGW a variation on the Anthropocentric Universe? I guess it’s an Anthropocentric Climate perspective. Anything to be important! Self-importance rules!
“This seems to be a circular argument ….”.
Exactly so, the “anthropogenic” component is merely an assumption therefore the graph proves nothing other than how sly (or stupid) the authors are.
You have pointed out a field of inquiry that is taboo for IPCC / alarmists. Best to say that we don’t understand natural variability and omit it entirely from models, making modeled CO2 sensitivity higher than in reality.
“The Neglected Sun” by Fritz Vahrenholt is essential reading on this topic.
al_a_gorical must be right, after all Obama agrees with him and both have grad degrees in climatology! DaveW
ps sarcasm
“al_a_gorical must be right, after all Obama agrees with him and both have grad degrees in climatology! DaveW
ps sarcasm”
Not at all, Obama’s field is Emperor. The world will do as he commands because he commanded it!
The other pertinent matter is Ivar’s question. What is the optimal temperature for the earth?
And what is the optimal variance?
yes
Severian
July 18, 2015 at 8:14 am
According to the academic assessment of the paleoclimate data, the optimal atmospheric variance is at about a range of 4C – 7C variation, if I am not wrong. the time period of such variation correlates only with the CO2 variation, ~120ppm variation . This is an estimated projection of the climatic swing,……… a projection.
As far as I can tell;, from my point of view, the GCM projections give a range of 2.5C-3.2C, related or in accordance with an ~200ppm variation of CO2.
No matter what circumstances or scenarios, what the GCMs simulate can not swing or vary outside and beyond that limit
And the GCMs, to me, seem very precise with the projections given,,,,and far more accurate than the academic climatic projections estimated through the assessment of the paleoclimate data..
hope this helps.
cheers
“What is the optimal temperature for the earth?”
Warmer.
I am partial to a low or about 55 in the morning, and a high somewhere near 80-85F.
Most plants like it that way too.
You opened the door for a lot of fun with that comment,but I will refrain. Personally I prefer a low temp of around 75 and a high of around 90, as long as it is moist, tropical air and not dry desert air.
mosquitos love those temps. I prefer a good freeze early in the fall, and kill them back until the spring.
Well, the best of all possible climates is just exactly what you’ve got.
===============
Before even answering that you should ask, “is there an optimal temperature of the earth? If so, optimal in what sense?” It is not uncommon to see the word “equilibrium” bandied about as if the user actually knew something. When it comes to climate, “equilibrium” appears to change with the time span of interest. At the longest scales, there is no empirical evidence that any climate equilibrium has ever been achieved. “Optimal” arguably is a meaningless term in climate unless it is directed to something, e.g. “optimal climate for North American grain production.”
Tipper who?
… and Tyler too.
Ah, the good old days…
I’d seriously considered posting this for those who don’t remember Algore’s ex, but it’s really too inappropriate. http://www.rockyhigh66.org/stuff/Al-Gore-Tipper-kiss_400.jpg
Quite so
November 7, 1811,
After enough “adjustments” to the raw data, I predict surface measurements from NASA will eventually match AlGore’s predictions, and he will eventually win the bet.
How could the global warming crown be wrong with the two best climate scientists in the world on their side (Al Gore and the Pope)?
Yes – but he will win historically – maybe 10-15 years after the date has passed when they can really massage the historical record.
“… the two best climate scientists in the world on their side”
You mean Al Gore and Bill Nye?
On the other hand, your choices are apt as both have divinity training, even if Gore ignominiously flunked out.
It does provide perspective when someone who was thrown out of graduate school for failing many of his classes is widely believed to be a climate change genius.
🙂
How interesting… I did not know about Gore’s experience in Divinity school. It’s almost as if he decided to make up his own religion to compensate for his failure, isn’t it?
This whole climate debate does have a conclusion. I have recently realized we have the data to compute what will happen in 2100 without climate models. The logic is unassailable. We have gotten 1/3 of the CO2 gain we expect in a doubling of CO2 that is expected to be about what we get by 2100. We know that CO2 is logarithmic in it’s effect. This means that we have gotten 50% of the temperature gain that we could expect from the remaining 67% of CO2 that we put in. Since we also have fully 70 years and one cycle of PDO/AMO data it is basically trivial to compute the additional temperature gain and does not need computer models anymore. If there was any non-linearity we would certainly have seen something by now to prove that. We have enough percentage of the entire curve that anyone would have to admit we cannot be far off with this calculation.
The gain in temperature since 1945 (roughly when CO2 output tripled compared to prior WWII) CO2 was 310. The temp was between 0.3 and 0.6C lower than today depending on if you use satellites and some land data or purely the adjusted land data. Therefore the additional gain from the remaining 67% of CO2 we put in should be no more than roughly another 0.3 to 0.6C or a total TCS of 0.6-1.2C/doubling of CO2.
Debate ended. End of story. I have been following this debate for decades and have debated all these factors one way or another, seen all the mistakes of the “science” community all the politics and everything and I feel like it’s at an end. I just don’t see how anyone can argue this point. We have the data, it’s 70 years by gosh. We have put in 1/3 of all the CO2. We have enough to easily see where this is going with some additional input. This isn’t rocket science anymore.
I believe the debate from this point is constrained to this 0.3 – 0.6C range for additional heat to 2100. Since everyone agrees and did agree a long time ago that a total temperature change under 2 degrees and this would then mean a total temperature change far less than 2 degrees possibly half that there is no concern for massive or significant impact that are negative. We have also seen that even with 1/2 the effect of CO2 in the system the “damage” is quite well restrained. Other than a few storms that have been accused of being caused by global warming the impact appears to be virtually zilch. 2 times zilch is still zilch.
Good post.
…. and you didn’t even subtract out the natural warming as we’ve been exiting the little ice age, so it’s even less.
Equipment and experiments could even be set up to test a lot of this, but climate scientists are too f-kin useless to contemplate such stuff, which is probably why they’re dipsh!t climate scientists in the first place.
Does ‘dipsh!t’ refer to their current state or their appropriate punishment?
Way too lenient a punishment (unless it was a penitentiary cesspit).
Smoko’s over; back on your heads.
And you don’t subtract out the clean air act; temperature dataset adjustments; the sun; and …….
This excellent article reminds me of how picking stocks via throwing darts consistently outperforms highly paid money managers.
Re: Green “losing the bet” 7/18/2015
Global warming is a forecasting problem. The claim of the IPCC and sympathetic alarmists is that if we don’t stop emitting carbon dioxide, the Earth will be dangerously warmer in the future. How can they know that?
Professor Lewandowsky tells us how.
During the last two decades, the scientific evidence for the fact that humans are interfering with the climate has become unequivocal. The vast majority of domain experts agree that the climate is changing due to human CO2 emissions. [¶] Given this broad agreement on the fundamentals of climate science, what cognitive mechanisms underlie the dissent from the consensus by a vocal minority of people? At least two major variables have been identified. The primary variable involves people’s worldview or “ideology”; that is, a person’s basic beliefs about how society should be organized. Lewandowsky, S. et al., Recurrent Fury: … , (2013/2015) pp. 142-3.
They know not by forecasting, but by ballot-free voting. Moreover, things are not as they are; they are as they seem to be – to the people they aim to convince.
We know life after death exists because the massive consensus of the men of cloth say it is so. We know God exists because the overwhelming consensus of Judeo-Christian-Islamic preachers say He does. Those unequivocal facts are confirmed by the people with their supernatural worldview or “ideology”.
That, forecasting-free, is the essence of scientific method foisted by the left and the Post Modern Scientists.
In an unfortunate collaboration with the increasingly uncomfortable religious establishment that is in direct conflict with actual scientific evidence and the methods of scientific reasoning taught in school and the misguided ideologues of the environment. It is a global partnership of many groups — the religious or spiritual who no longer can believe in religion and adopt the environment as a substitute, the actively religious who see in it the opportunity to destroy science, rabid environmentalists who view humans as a sort of plague attacking the planet rather than a part of the ecology of the planet that deserves consideration as well, and a large body of idealistic scientists who have let their idealism and perhaps a bit of self-interest suborn the requirement of science to be brutally objective even when the results one obtains are not the results one desires or that will guarantee future funding. And sure, the “commynists” masquerading as environmentalists, so-called “watermelons” that are green on the outside and red on the inside.
But even this collective would not succeed if it were not for the simple fact that people make ordure-piles of unearned moolah by promoting the illusion of future catastrophe. All one really needs to do to understand CAGW is to follow the money. Quite a lot of the trail leads back to Al Gore, or so I have heard — a major investor in carbon trading and alternative energy sources. But even this pales in comparison to the money made by the world’s energy companies from CAGW.
Who benefits from CAGW? The very companies that are demonized by the poor fools that are exploited to generate the “crisis”. Anything that raises the cost of energy raises their profits. The more artificial the better. What better way to make more money from coal in a totally inelastic global energy market than to artificially double the cost of electricity of all sorts? It doubles the net profit gained from selling the electricity to a world that will pay whatever it is charged for it but where it is also a regulated public utility. And do power companies care if they are required to use solar power or wind power to provide a fraction of the power they sell? Not at all. They’d sell us electricity made by harnessing hamster wheels if we passed laws requiring it. They’d make far more money selling hamster-power in a market heavily inflated by the scarcity of hamsters than they would make selling coal based power in a market dominated by an abundance of coal.
This is why it is nearly pointless to argue. The pockets behind this are infinitely deep, and we’re talking trillions of dollars in rake-off additional profits in the global energy marketplace over decades. If somebody were able to prove beyond any doubt that carbon dioxide is completely harmless, entirely beneficial, and that global climate is totally insensitive to it (whether or not that is plausible, just pretend) they’d be assassinated. Or, more likely, the record would be “adjusted” some more to disprove their claim. That’s a lot cheaper and safer than overt assassination.
rgb
How many hamsters do you figure would be needed?
Just one very large one.
There is a story running in WSJ.com today on the fleecing o f California driver with their much higher gas prices. Today, national average: $2.76 while Cal is $3.88/gal reg gas. LA prices are running $4.30/gal.
That price diff exists because special “moe evironmentally friendly” additives and blends that only Cal reineries make, additional taxes including the new Cal carbon tax.
http://www.wsj.com/articles/sky-high-california-gas-prices-have-a-green-additive-1437174504
A snippet of that article is below:
Who does that hurt most? Cal low wage families of course.
Who reaps the tax largesse? Moonbeam and his minions of course. They are using some for buying union votes with the highspeed jobs programs train from Fresno to Bakersfield, that no one will never ride.
(easy prediction: It will never be finished, the money wasted, with lost farmland to track right of way litigated for a decade or two. The next economic downturn will force Sacramento to use those monies to pay other bills, like deeply underfunded state employee pension-retirement benefits.)
rgbduke Re: “Anything that raises the cost of energy raises their profits.”
That presumes that people can and will pay for it.
Evidence is that rising oil prices raises unemployment.
See James Hamilton Oil History etc.
When oil prices rise too high, people can’t afford them.
See Actuary Gail Tverberg at http://www.OurFiniteWorld.com
PS Re theory and statistics are growing that evolutionary models cannot explain the origin of complex microscopic biolological “machines” from chaos or natural laws in the known life of the universe. Very detailed interacting microbiological “machines” are commonly understood to show evidence of design, not chaos. e.g., see publications at the Evolutionary Informatics Lab
Joel O’Bryan
That’s roughly $1 a litre, or 0.92€ per litre. Supermarket prices here are 1.178€ for diesel and 1.47€ per litre so Californians can expect more rises to reach European levels.
P.S. The UK is more expensive for diesel.
To David L. Hagan.
– biological evolution is not a random walk.
– natural selection (fitness) is *not* scale invariant.
-informatics may simulate linear time even to gigayears, but cannot simulate the near infinite execution threads of evolution of molecular machines, consider this an Avogadro’s number barrier.
If you are advocating an intelligent design theory of life, there are probably more receptive blogs on the internet than here at WUWT.
David, we see this now. Money making schemes tend to be short sighted and presume indefinite status quo. As gas prices increase fewer people take vacations, fewer drive at highway speeds, more people rely on public transportation. As it is, gas prices have pin-balled all over the place in California lately (currently heading up). Where I live, I see increased use of inadequate and poorly planned mass transit systems. I also increased use of trains since a diesel electric becomes increasing more efficient as you pile on more cargo. So I see highway cargo trailers piggy backing on rail flat beds and no truck drivers. Traffic experiences increased delays as more rail freight moves through town on a series of at-grade crossings over a century old.
Rgb
I am gratified to see that you have hilighted that CAGW alarism is about money and power not science. I dont remember you having this view in the past has something happened that has made you focus this way?
Double sigh. My comment addressed coal and electricity, not oil. Transportation is a different kettle of fish, largely because we do not have anything like parity between alternative energy sources for transportation. Gasoline (or diesel, or even ethanol) is king, at least in the US, because we have very little electric rail (none, really, outside of cities) and because everybody drives cars. Electricity demand is highly inelastic, and the high marginal cost of moving a business allows states like California to exploit price hikes via regulation in the short run before businesses decide it is cheaper to move to Georgia or North Carolina. Raising the price of gasoline, OTOH, adds directly to the cost of everything delivered using gasoline as part of the transport chain, built with raw materials delivered ditto, built by workers delivered to their place of work ditto.
Why do you think Obama has pushed the development of Arctic oil in the teeth of his environmental supporters? Because you can’t muck around with gas/diesel prices too much before you trigger an economic catastrophe. He knows this. Everybody knows this who matters. Electricity prices, however, are less nonlinearly inflationary and can be tweaked a bit as a sort of short run regressive tax. Changing from coal to a mix of coal and methane and solar also has a delayed, highly amortized impact as one borrows money and them makes additional marginal profit (with or without the sweetener of tax-funded government subsidy). One alters efficiency, perhaps, but supply and demand still have time to adjust and meet in a middle on a newly distorted economic landscape.
As far as your assertion that “evolutionary models cannot explain the origin of complex microscopic biological machines” — within the laws of the Universe, all I can say is Oh My God what sheer piffle.
First of all, science cannot prove a negative. The best one could say is that they cannot explain it yet, and not even that is actually true, it is just the fond hope of those that wish to persist in believing in complex antique mythologies in place of using their common sense. I have written genetic models and done this sort of simulation and it is incredibly powerful, there isn’t even a good reason to doubt that it is precisely what has produced both life itself and the evolution of species, especially given the mountains of radiometricly dated evidence for the latter.
But your real sin against reason is this. You assert without any real foundation that the laws of ordinary (if incomplete) physics is incapable of explaining the evolution of life and intelligence in a universe where we have never seen anything but these laws at play. What, then, is your plausible alternative? A supernatural Universe where an even greater and more difficult to explain supernatural intelligence did all of the heavy lifting, who carefully hid all evidence of its violation of the laws of chemistry and physics in a “created” reality?
Oh wait, no they didn’t. They arranged for the Bible (or Quran, or Mahabharata, or Book of Mormon, or…) to be written so we’d all be clued in. All we need to do is read the Truth in these books, we don’t need no stinkin’ evidence. We just need to Believe.
The Gods of earthly religions have always been Gods of the Gaps. They are necessary to the extent that there are things we cannot explain without gaps in our observational knowledge, gaps in the explanatory power of ordinary physics, chemistry and biology. Most of those gaps have long since been irrevocably closed, demonstrating in considerable detail that all world religions are pure nonsense dreamed up to explain ignorance and give power to a special class of particularly unproductive worker called “the priesthood” in all world societies and cultures.
Now you are publicly participating in an effort to try to wedge a gap back open by asserting that something “cannot be explained” without supernaturalism, without some transcendent supernatural unevolved “intelligence” (a.k.a. a thinly disguised God)?
Really? And your supernatural or intelligent design explanation is better how? The actual positive evidence to support it is what? Obviously you are perfectly happy to reject the entire dated fossil record and the collective conclusions of the entire field of genetics in your attempt to defend an indefensible myth, but what actual evidence do you have for a cause that fakes the fossil record and overwhelming laboratory genetic evidence? How can you prove that your supposed “statistical” anti-evidence is exhaustive or conclusive? That’s like proving that we “can’t” crack RCS encryption because there are too many possible keys to be exhaustively tried. Oh, wait. Yes we can, because we can crack it without trying all of the keys, and because we can actually try a lot more keys than you think we can. Your assertion of impossibility, in other words, cannot possibly be proven. You can’t even prove that it is probably impossible or unlikely.
What direct evidence can you offer for the existence of the super-universe with its super-physics and its super-still presumably non-evolved intelligences that did all of the intelligent design in this one, and how can you even think of justifying the assertion of something even more complex than the complexity you assert cannot be explained as the explanation of that unexplainable complexity? Should we believe that the dog ate your homework? It could be true, of course, but what is the evidence that it is true? What is the much, much simpler explanation?
There is no direct evidence for intelligent design, of course, any more than one can produce toothmarks and dog-slobber on the lack of homework in your bag when the teacher asks you to hand it in. There isn’t even any real motivation for looking for any. If it were not for the antique mythologies, there would be no reason in the world to even look for evidence of intelligent design in the heart of a fossil record so obviously illustrating unintelligent evolution. You are asserting the moral equivalent that we are all power units in The Matrix, that reality is not the way it actually and rather simply appears, that what we believe to be real and as plain as the nose before our face is all some sort of simulation, a fake nose, the illusion of a nose, that reality is one whole level higher up than we can see and hidden from our view. Sheer, unadulterated piffle.
Naturally, this sort of assertion can never be disproven — by hypothesis all of the fairies it depends on are invisible fairies, so of course we cannot see them, we can only tell that they are there because they make the world work out the way it does (however that proves to be) so absolutely anything you see is evidence that it is that way because of the Will of the Fairies. It could, of course, easily be proven; if the self-willed Fairies wanted to become visible one presumes that they could.
In the meantime, the one thing we can positively say is that a belief in the invisible as an explanation of the visible that requires no additional explanation beyond what we can already see is not the best thing to believe, in a mathematically quantifiable sense.
rgb
You’ve just missed it. I make this point all of the time, probably a dozen times this year alone. It isn’t entirely devoid of science, or entirely about money, but power companies hate and fear the catastrophic anthropogenic global warming hypothesis the way B’rer Rabbit hates and fears the Briar Patch.
As I have said before and will say again — follow the money. If CAGW hysteria causes electricity prices to hike by 20%, what do you think that does to the marginal profits of any power company? Go down?
Think again.
Power companies were born and bred in the Briar Patch of making and selling electricity. The last thing in the world that they want is for the cost of electricity to go down, for there to be real competition in the marketplace. Imagine what would happen — what will happen — if/when thermonuclear fusion is made commercially feasible at an amortized cost (say) 1/10th that of coal based electricity. Imagine the catastrophe of making it available via units that sell for $1000 and can be installed in your backyard and make power for your house for the next thousand years without refuelling. I imagine that they fear residential solar in exactly this sort of way, which is why they are building solar as fast as they can with far better economy of scale. Better for Duke Power to build a solar farm and sell you its energy at a markup than have you install rooftop solar and sell it back to them at an anti-markup — or just stop buying electricity from them, forever.
This is the fantasy that fuels a lot of CAGW enthusiasts, BTW. They imagine transforming electricity production into a delocalized cottage industry, the elimination of Big Energy altogether. The reality is Europe — giant wind turbines everywhere, and remarkably little solar, all knit together with subsidized conventional power because the darned wind just won’t consistently blow — it’s either feast or famine, and in famine you have to have just as much generation capacity as you always have had or people will die in the summer and winter time of extreme heat or extreme cold, or the general collapse of an electricity-based civilization deprived of its fundamental resource.
This is not a simple issue, and it has very little to do with rising oceans or shifting the entire planet one standard 5 degree F growing subzone equatorward (which is just about exactly what 2.8 C of warming represents). It is about big money, big power, big politics. It is about perpetuating global poverty and the disparity in wealth between the have countries and the have not countries. It is about holding back China and India. It is about global oil and both the former SSR and the middle east. It is about Islam vs Christianity. It is about environmental cynicism fuelled by some very real eco-disasters of years’ past (some of which persist today) driven by corporate greed.
Somewhere in there is some actual science. It does, in fact, suggest that we are likely to warm 1 C (or even 2 C) over the next century because of CO_2 in the atmosphere. Everything after that is pure politics, money, religion, and politics again.
rgb
rgbatduke,
I think you have confused higher energy prices set by a free market, one where supply and demand operates freely, with the higher prices simply due to a government tax scheme, be it excise, vat, or carbon-content based. Even in a regulatory scheme where say sulphur emissions are limited, the higher production costs are passed to the consumer, and that additional money goes to buy scrubbers or “better” low sulphur fuels, but the money stays in the free market..
Germany is a prime example of green energy cronyism at work to the detriment of everyone except Seimans, who makes big wind turbines, and the solar panel makers. Germany has mothballed nuclear plants that still had service life, and they still have decommissioning to deal with, a less reliable power grid supply, more burning of lignite coal, companies putting in onsite backup dieselfueled generators to ensure they will have power, and much higher energy costs for everyone with higher CO2 emissions.
Carbon taxes simply are money taken from the free market for efficient allocation, and spent by the government in usually quite ineffcient allocation in a regressive tax scheme hitting lowest income groups the hardest. Which the cynical believe is why the rich jet set liberals like Gore, Tom Steyer, and other coastal liberals with their yachts, multiple vacation mansions, and airplanes want to make the little people not use up their fossil fueled lifestyles.
Who benefits from CAGW? The very companies that are demonized by the poor fools that are exploited to generate the “crisis”.
The rubes can never figure out how Prohibition works despite numerous examples.
When doom has been but ten years in the future for the past thirty years is when you might think it’s not so. But then, why think at all when no number of wrong predictions is discrediting?
By their very essence, CAGW disciples remove themselves from any requirement for logic or debate. Rhetoric and blind faith is their standard.
“The Global Warming Challenge is a notional 10-year bet between Al Gore…”
Seriously? You make up a bet then say the person who didn’t take part in the bet has lost?
It’s a notional bet. “Notional” means “existing only in theory.”
Terry Oldberg.
Correct. It is a bet only in theory, that means Al Gore has lost the bet only in theory.
I have seen some bizarre articles in WUWT over the years, this one comes close to being the most bizarre.
No, Al didn’t lose and won’t lose. If Al were merely honest and willing to put his money where his mouth is/was, he would have made the bet. But instead he convinced the rest of the world to make a trillion dollar bet, one where he gets to hold the stakes and take a cut off of the top either way. Al is just a shill for the big money interests who profit from the bet.
We are the ones that lost the bet, just by making it. And many of us didn’t want to make the bet in the first place because it was so obviously a con.
rgb
rgbatduke.
Oh here we go again, the old straw man of saying what someone else was SUPPOSED to do.
harry says, “Correct. It is a bet only in theory, that means Al Gore has lost the bet only in theory.
I have seen some bizarre articles in WUWT over the years, this one comes close to being the most bizarre.
===========================================================
CAGW is a theory only. In theory, if your observations do not match your predictions, the theory is wrong.
Nothing is more “bizarre” then this theory which ignores all contrary observations.
Illustrating that the theory of CAGW cannot outperform the simplest model of “no change” is not ‘bizarre”.
Ignoring that message is.
“Mr. Gore was getting a lot of media coverage at the time for his claims that temperatures on planet Earth were at a “tipping point” due to human emissions of CO2. He nevertheless declined, on the grounds that he does not bet.”
.
He doesn’t have a single share on the stock market?
Wow…
with regard to real temperatures: What happened to Watts et al 2012 paper showing preliminary that most of the warming trend in the USA was artificial? Three years passed no news?
Natural cycles upon natural cycles upon natural cycles………
Why does no one check Gore’s bank accounts? You may have to beyond the U.S. But he will not be saying and talking lies unless money is swarming to him!
If there’s any individual to blame for for enabling political correctness to override the scientific method, its Al Gore.
Having read Jonah Goldberg’s book entitled “Liberal Fascism” I’m inclined to think that the scientific method is being overridden by political correctness matching the pattern that Goldberg calls “fascism.” Fascists seek to destroy the existing order and to build a utopia upon the ruins under which the power to make decisions is removed from those ruled and bestowed upon smooth talking pseudoscientists in the employ of the ruler.
Al Gore only bets with other people’s money.
It;s also important to remember that it was the Clinton/Gore administration that gave Hansen his soap box after the previous administration set him aside as a lunatic fear mongerer. Can you say sour grapes?
And rarely has any simple appointment cost the US, nay, cost the world, more money. In charge of NASA, free to tinker with the temperature record, hire people who were only interested in proving one thing in order to save the world, and pull off world-class con jobs like turning off the air conditioning in the Capitol building the day he first addressed them about global warming, so that they had to experience the sweltering DC summer just like it was experienced before air conditioning while he told them somberly that the entire world would be like the inside of an un-airconditioned building if they failed to give him a blank check to prevent catastrophe.
Not one single prediction of doom and gloom made by Hansen has come true. Even with the warming we’ve experienced over the last 30 years, it has followed the best case scenario temperature track from his early papers. CO_2 has not. It should have been obvious already that his estimates of climate sensitivity and feedback were over the top. Heck, it should be obvious now.
But do we see anybody racing out to correct them and trumpet the good news? Climate Catastrophe Averted! Early Estimates of Danger Greatly Exaggerated! News at 6!
rgb
Another good 2015 forecasting paper at Golden Rule of Forecasting:
Green, Armstrong, & Graefe’s response to commentators, titled “Golden rule of forecasting rearticulated: Forecast unto others as you would have them forecast unto you” is available as a working paper here, and is published online at http://dx.doi.org/10.1016/j.jbusres.2015.03.036
If you look at a basic atmospheric physics/climate text book, you will find that the dominate heat transport mechanism, in the troposphere (convection dominates up to 20km, transition zone is 20 to 40km, radiation dominates above 40km) is convection, water cycle latent heat changes/movement, and planetary cloud changes, not long wave radiation. As hot air rises, as greenhouse gases warm/heat adjacent molecules by collision (temperature/heat tries to equalize), and due to the lapse rate, greenhouse gases cool the troposphere, they do not warm the troposphere.
Comment:
The basic atmospheric text books all include a silly problem where one assumes there is no convection in the troposphere and then helps the student calculate how much greenhouse gases warm the troposphere. What is the point? Have people turned off their minds? Critical analysis looks at the observations to determine if they do or do not support a theory. How many paradoxes are required to invalidate the greenhouse gas theory and the theory that cyclic climate changes including abrupt cyclic climate changes are not due to solar cycle changes?
This paper uses basic standard physics to show, big surprise, that ‘greenhouse’ gases cool the troposphere, and that the temperature of the earth is higher than the temperature of a blackbody radiating in a vacuum, due to the lapse rate and the fact that there is an atmosphere about the earth. We are at the bottom of an ocean of air. If there was no ‘greenhouse’ gases in our ocean of air, using basic physics analysis for gas in a gravitation field, indicates the bottom of the troposphere would be warmer not cooler.
http://dx.doi.org/10.4236/acs.2014.45072
As one moves higher in the atmosphere there are more ions (conductivity of the atmosphere increases by a factor of 30 for example from sea level to 20km) and there is observational evidence of free charge (which is a paradox, there should be no free charge, as it is assumed the solar system is neutral) both of which inhibit/reduce the greenhouse effect.
We have all assumed that the cult of CAGW’s greenhouse gas theory/mechanism is correct and that their GCM (general circulation models) models are incorrect as they amplify (positive feedback) the CO2 forcing which is incorrect. Observations/analysis supports the assertion that the planet resists (negative feedback) a forcing change (Sensitivity issue).
We have assumed that the additional ‘greenhouse’ gases in the our atmosphere cause some warming and hence assume the majority of the warming in the last 30 years was due to increases in atmospheric CO2. The issue then is what is the sensitivity of the climate system to the increased forcing.
Observations indicate, however, that there are multiple fundamental errors in the basic greenhouse gas theory/atmospheric modeling, in addition to the fact that the planet resists rather than amplifies forcing changes.
Observations support the assertion that the majority of the warming (more than 75%) in the last 30 years was due to solar modulation of planetary cloud cover (cloud cover changes can warm specific latitudes and can explain why there is almost no warming in the tropical region) as opposed to the increase in atmospheric CO2. The CO2 mechanism, the same as an increase in total solar irradiation should cause the most amount of warming in the tropics not in high latitude regions.
1) Latitudinal Paradox: The most amount of greenhouse gas warming should have occurred in the tropics not in high latitude regions.
http://arxiv.org/ftp/arxiv/papers/0809/0809.0581.pdf
More to explain the latitudinal paradox. As the earth is a sphere, not a flat table top and as the greenhouse gases are evenly distributed in the atmosphere the most amount of greenhouse warming should have occurred in the tropical regions not in high latitude regions. The same comment/logic applies to how the earth would respond to an increase or decrease in total solar irradiation.
http://www.eoearth.org/files/115701_115800/115741/620px-Radiation_balance.jpg
2) Plateau of 18 years without warming paradox:
A plateau of 18 years without warming, is more difficult to explain and has different logical implications than a period with less than expected warming (a wiggly line that is gradually increasing). Less warming than predicted can be explained by less sensitivity to forcing or lags in the response of the climate to changes in forcing. The CO2 forcing mechanism is theoretically always present. As atmospheric CO2 has been gradually rising for the last 18 years, the CO2 forcing mechanism should if it was real, have increased and hence planetary temperature should have continued to increase.
3) No correlation Paradox:
There are periods in the paleo record periods of millions of years when atmospheric CO2 is high and the planet is cold and vice versa. During the recent glacial/interglacial cycle, planetary temperature increases (glacial period ends by some unknown forcing function, the forcing function is not insolation at 65N) and then 500 to 600 years later atmospheric CO2 rises.
As Humlum et al note (see link to paper above) 7 out of 8 times (last 30 years) planetary temperature rises and then atmospheric CO2 rises. Cause must lead effect, not follow effect. There is no correlation of planetary temperature with atmospheric CO2 rise (recent warming period) and there is curiously no correlation of anthropogenic CO2 emissions and the atmospheric CO2 rise. (The rise in atmospheric CO2 occurs in the low latitudes in the Southern hemisphere rather than in the Northern hemisphere where there is majority of the anthropogenic CO2 emission.)
4) Cyclic abrupt warming and cooling
There are cycles of small, medium, and super large abrupt cooling and warming that have a periodicity of 1470 years. The climate changes correlate with solar cycle changes. The past warming and cooling cycles are high latitude, same as the recent warming period.
5) No tropical tropospheric hot spot
http://wattsupwiththat.com/2013/07/16/about-that-missing-hot-spot/
GCM predict that there should be hot spot at 8km above the surface of the planet. This is not observed.
The paleo period pre-Panama Isthmus closing cannot be compared to today’ (or last 3Mya). Still there is ample evidence Earth’s climate regulation is robust with the 70% ocean surface, vast ocean depths, a vigorous biosphere able to sequester vast amounts of carbon, and 3 Mya that was mostly glacial and cold.
The Panama closure occurred 13 to 15 million years ago, rather than the assumed 3 million years ago.
The Panama closure had been invoked as the reason for the start of the glacial/interglacial cycle in the Northern Hemisphere 2.8 million years ago.
Both assumptions were incorrect.
https://news.wsu.edu/2015/04/09/new-age-for-panama-closure-challenges-long-held-theories/#.Vataz5XbKUk
Robustly bistable. Or wait, is that a contradiction in terms? Is “mostly glacial and cold” robustly glacial and cold, or is the current interglacial robustly warm and melty? There is ample evidence that the Earth’s climate regulation is not robust in an interglacial — in the Holocene we have had several 2-3 C swings in climate in addition to a 6-10 C very abrupt and bouncy swing associated with the Younger Dryas right before the start of the Holocene proper. Ice core records, to the extent that one can trust them to reflect global climate rather than local climate, strongly suggest that the Eemian was even less stable, with a warm spike at least 1-2 C higher than the Holocene climate optimum (so far). There is little consistency in the glacial temperature record or in the still earlier interglacials. Honestly, I would say that the global climate is multistable with multiple locally/weakly stable attractors distributed down from an interglacial and up from a glacial era, where it hops around among them during both either in response to small changes in forcings in ways we do not understand or understand only crudely (e.g. Milankovitch plus solar variability plus continental drift plus chaos, quite reasonable in my own mind) or as the result of pure chaos, nonlinear dynamical evolution in action. The two aren’t even mutually exclusive, but they do suggest that the only thing the climate is is robustly chaotic, robustly bistable on long time scales and robustly fractally multistable on shorter time scales.
But I completely agree that comparing pre-Pleistocene climate to the current ice age is probably not useful, as before it truly was robust and remarkably stable.
rgb
Wow are you easy to convince!
One paper asserts the contrary and you buy it? Why not provisionally reduce your degree of belief in the conclusions of the other umpty papers that conclude the opposite on many grounds accordingly, but take this paper with a grain of salt. Are there no other possible causes that could explain their findings? And what of the other evidence to the contrary — I’ve looked at a bunch of those papers and there is fairly substantial e.g. fossil evidence. The closing didn’t happen all at once, as well.
Not everything that is published is correct. It’s always lovely to be a maverick and embrace the iconoclast, but wisdom in science is to not be particularly hasty in jumping on an iconoclastic bandwagon. If they are correct, there will be further work that corroborates it. In the meantime, there will likely be some “robust” discussion about the apparently contradictory evidence and ways to explain the discrepancies.
So let’s soften this statement to “may not be correct”, shall we? Or not — of course you can believe whatever you like.
rgb
Greenhouse gases are indeed one of the mechanisms that cool the earth. A lot of the earth’s cooling comes from direct radiation from the surface, however, in LWIR wavelengths that are not blocked by the atmosphere.
The greenhouse cooling does occur high in the troposphere, at the height where it becomes approximately transparent to LWIR in the absorption bands due to the thinning of the atmosphere. As greenhouse gas concentrations increase, the emission height increases just a little. Because of the lapse rate, emissions from the increased height are a little bit cooler. Because the rate of emissions is proportional to the fourth power of the temperature, greenhouse gas cooling works slightly less efficiently. However, since the incoming radiation is not similarly modulated, the Earth has to get rid of just as much heat (per unit time). Consequently the surface warms, just a bit, to increase the rate of loss directly from the surface.
It really is pretty simple. Sure, there is more internal complexity. The CO_2 molecule has a very complex spectrum in the relevant bands. The absorption/emission lines are (predominantly) pressure broadened through most of the troposphere, and hence they become narrower with increased height and reduced pressure, density and temperature. This means that the entire atmosphere column has some differential transparency as lower heights radiate energy that can “bleed” through the opening gaps in the lines of molecules above, so the picture isn’t quite as simple as raising the emission height as if that is a sharp number. It also means that the atmosphere’s transparency in the absorption band varies with the weather — on a clear high pressure day, it actually is more opaque in the CO_2 band than it is on a low pressure day, so the emission heights themselves vary dynamically and locally. It also means that there is a complicated nonlinear relationship between places with uplifting air (possibly carrying energy as latent heat in water vapor), air pressure and density, relative opacity, emission height, albedo, back radiation, and more that it is difficult to even mentally form a model of even though any given piece is understandable.
This is why the climate problem is so difficult. We have no “rules” that function in some separable way so that we can say “If this happens, then this will happen.” Our best models say “If this happens, anything can happen” and then people assume that the statistical distribution of anything is somehow a predictor, in spite of the fact that direct evidence obtained by trying this refutes the assertion.
I can’t solve the coupled Navier-Stokes equations for the ocean and atmosphere in my head out to climate-relevant times. You can’t either. They can’t even be solved with world-class computers at a resolution that is meaningful or likely to be meaningful. So why assert that you know that CO_2 is no risk or danger at all, that it cools the planet instead of warms it, etc. The best that we can say at this time is that looking at the direct relationship between atmospheric CO_2 and global average temperature over the pitifully short length of time represented by the instrumental record, even allowing for a certain amount of well-intended fiddling with the temperature record by world-saving zealots with a vested interest in the catastrophe, it is most likely true that the simple theory of CO_2 caused warming is correct with little or no feedback, and with a very modest total climate sensitivity just about where theory says it should be.
The one thing that has proven to be incorrect in the work of Hansen and others who built the first climate models is the feedback. Without feedback, there has never been a risk of catastrophe. Feedback has always been a sketchy proposition (in my opinion) because positive feedback usually indicates instability in dynamical systems and there is no evidence of a serious climate instability outside of one triggered by long-time orbital stuff or perhaps shorter but still long time ocean circulation stuff. There is direct evidence that climate models overestimate the cooling effect of aerosols, and hence exaggerate the water vapor feedback to compensate, and that this may well be why they continue to diverge from the actual temperature as aerosols remain roughly constant but CO_2 goes up without this positive feedback. There is also direct evidence that the models are overwhelmingly off in their treatment of the ocean — again IMO unsurprising given that the ocean is an entire secondary set of Navier-Stokes equations that are if anything even more poorly understood and which are coupled to the atmosphere. It would have been surprising, and would still be surprising, if any of the GCMs actually worked.
Without strong positive feedback, the risk of catastrophe is greatly reduced. It is not zero, because it isn’t zero even if we do nothing — the climate is chaotic and could slap us around for a century on a whim (look at the climate history of e.g. California, which was a desert for most of the last 500 years pre-anthropogenic CO_2 and could return to being a desert starting two years ago and it would be a decade before we even could tell). We cannot tell even if we are increasing or decreasing the risk by adding CO_2 — both are plausible, and the models are no help at all.
Then one has to look at the benefits of the CO_2 (and the energy produced burning coal to make it). They are substantial. Indeed, they are both crucial to our civilization. A billion people dine every day on the increased plant productivity of the additional CO_2. Civilization itself was built on top of the burning of coal.
Is it wise to invest, perhaps even invest heavily, in alternative energy resources that do not rely on coal? Absolutely. A number of them require no fuel at all, or require things like Deuterium or Thorium that exist in such abundance that human civilization could continue, based on them as a fundamental energy source, for millions of years instead of (at most) hundreds of years, and with atmospheric CO_2 no longer being a concern either way. In fifty or a hundred years, we may understand the climate system and biosphere well enough to deliberately move atmospheric CO_2 towards some optimal concentration. That optimum could easily be higher than what it is now, even if it is lower than what it will be then. In the meantime, wise investment in the technology and science that might one day produce ways of generating energy that cost less than coal and hence are the obvious choice for a free society seems strongly indicated.
What is not indicated is nonsense like “Carbon Trading”, or treating CO_2 as the harbinger of a future disaster. It is most probable that it is no such thing, and it is absolutely certain that so far it has been an unmitigated blessing to the human species and general world ecology. It is rather likely that it will continue to be net beneficial for another 100 to 200 ppm. Beyond that it is difficult to be certain. We haven’t done the experiments or the science, and sometimes comparatively small changes in an ecology can have large effects. But there is every reason to think that a strong investment in the technology of alternate energy production over the 20 to 40 years required to reach these concentrations with no demonization of coal based power at all is sufficient to push us over the hump to where coal is deselected not because of CO_2 risk but because there are much cheaper alternatives that use no fuel at all or comparatively abundant and energy rich (nuclear) fuels.
Organic chemists I know despair over the fact that we burn oil and coal. They are so valuable as feedstock to the entire organic synthesis chains that make countless materials of great value to our society, feedstock that would be enormously more expensive to generate from raw CO_2 and water and air (or even from plant material where at least some steps have already been accomplished by nature). We are burning the wealth of the world when we burn oil and coal. So far, that burning has been an investment, one that has uplifted the human species from abject global poverty (even in the heart of pre-Enlightenment “civilization”) to a state where even the poorest amongst us in energy rich countries are wealthier than the nobility of the feudal world 400 years ago. It has been the basis for human freedom, as cheap energy reduces the incentive for human slavery by devaluing unskilled human labor. But we would be most unwise to continue burning our capital in this way indefinitely. We only get one shot at transforming global civilization to an energy basis capable of going the distance, or we risk falling back to comparatively primitive sources and which would almost certainly entail the death of enormous numbers of humans.
Imagine the die off if a coronal mass ejection of unprecedented magnitude slammed the Earth in two days and blew the entire continental electrical grids of the world by frying every single transformer in the system, so that it would take years to rebuild — no air conditioning or refrigeration or lights or heat in all of the world’s cities, no transportation into those cities, a complete breakdown in delivery and services. But at least in this case there would be light at the end of the tunnel and after several billion deaths, we would turn the lights back on. If we burn all of the coal and all of the accessible oil and do not have alternatives waiting in the wings or have any sort of CME-based event or nuclear war even that brings down civilization for a single decade, it might never rise again with all of the cheap and readily available carbon-based energy used up.
rgb
Because there is neither evidence nor precedent for warmer conditions or higher CO₂ concentrations having any negative effects for life on Earth, the entire CAGW argument must be dismissed as the logical fallacy known as Special Pleading.
Corporate gang green loves the green scams because they provide a convenient veil to mask their true motives:
“When General Electric blamed “a variety of energy regulations that establish lighting efficiency standards” for the closing of incandescent light bulb factories in Virginia, Ohio and Kentucky, its PR team left out a critical detail: General Electric and fellow light bulb manufacturers Phillips and Osram Sylvania had lobbied for those regulations.
Ignore claims that the incandescent light bulb ban was imposed to fight global warming. The motive behind the bulb ban is money: Incandescents have a low profit margin.”
–Amy Ridenour
http://www.nationalcenter.org/NPA628.html
Find the fallacies, and follow the money.
Green scams like wind turbines and vast solar arrays are bleeding wounds on the economies of those nations saddled with these monstrosities…
And where the blood pools, the vampires feast.
The IPCC RCPs are based on the notion that increased levels of CO2 will cause a RF of (421 ppm) 2.6 W/m^2, (538 ppm) 4.5 W/m^2, (670 ppm) 6.0 W/m^2, and (936 ppm) 8.5 W/m^2. Table SPM 3.
The impact of these RFs is minuscule in the overall climate picture, clouds, precipitation, ocean flux, volcanic, geothermal, etc.
From paper #2: “The benchmark forecast is that the global mean temperature for each year for the rest of this century will be within 0.5 C of the 2008 figure.” First of all, 0.5 C is a pretty large change in global mean temperature, as almost all annual global mean temperatures were within this range from 1860 to 1980:
http://www.cru.uea.ac.uk/cru/data/temperature/HadCRUT4.png
However, we’ve now seen an increase of about 0.5 C since then, over ~35 years. The author seems to be hopeful that things will “average out” and “return to normal”, but doesn’t have any physical evidence to indicate a reason to be so hopeful. Forecasts of a past climate (when things weren’t changing much) may have no relevance for today’s (or future) climate. Considering the 35-year trend, we’ll have about 1.3 C of warming above 2008 levels by the end of the century.
Hello!!! Does CO2 pool in the N Hemisphere? How can CO2, a relative constant in any model, cause a temperature differential between the N Hemi and S Hemi? Any real scientist would look for the differences between the N and S Hemisphere to expain the differential. That is why they are called differential equation. Here is a hint. 1) Ground based temperature measurements are manipulated and 2) H2O has increased in the N Hemi relative to the S Hemi. CO2 simply can’t explain the difference between the N and S Hemi, that chart demonstrates that something other than CO2 has caused a full 0.5 Degree C increase since 1980. Funny how Climate Scientists seem to overlook the real interesting questions. They simply don’t look for anything other than CO2.
http://www.cru.uea.ac.uk/cru/data/temperature/HadCRUT4.png
Hello Again!!! The trend in temperature in the S Hemi shows a near linear relationship since 1900, with a pause between 1940 and 1980. CO2 increase hasn’t been linear. Prior to 1980 the N and S Hemisphere were highly correlated, post 1980 the temperatures diverged. CO2 can’t cause the divergence. What is causing the divergence? That is the question. Most likely the divergence is due to a researcher that is manipulating the data, and not understanding how to perpetrate a successful fraud. His own actions created a smoking gun for his fraud. It is like a thief that didn’t have to break into a house. Clearly it was an inside job because he used a key.
http://www.cru.uea.ac.uk/cru/data/temperature/HadCRUT4.png
co2islife.
So you think both hemispheres should respond to an increase in forcing the same way?
“that chart demonstrates that something other than CO2 has caused a full 0.5 Degree C increase since 1980”
Ummm no it doesn’t. You really are just pulling conclusions out of your bottom.
“Funny how Climate Scientists seem to overlook the real interesting questions.”
Funny how some climate change dissenters make stuff up.
Someone is actually going to defend this garbage? Really? Yes, I do think CO2 “forcing” should be the same in both Hemispheres, care to explain why not? Are these “smart” molecules that known their location? Does N Hemi CO2 absorb at 10 Microns and S Hemi CO2 not? Given the climate “scientists” can’t even create computer models to demonstrate this “Forcing,” please feel free to explain how CO2, at 400 PPM in both the N and S Hemisphere, both absorbing IR at 15 Microns, have different “forcing” effects? I’m all ears.
Actually it is the Climate “Scientists” that are pulling conclusion out of their bottoms, their models prove it.
CO2 is a constant in both the N and S Hemisphere, 400 PPM, Absorption at 15 Microns. How can a constant cause a difference? How can 400 PPM CO2 impact the atmosphere in the N Hemi different from the S Hemi. Please explain. BTW, the average temp in the N Hemi is 15 degree C and S Hemisphere is 13 Degree C. CO2 is transparent for that range of IR, CO2 has an atmospheric window between 13 microns and 4.3 Microns.
http://itg1.meteor.wisc.edu/wxwise/AckermanKnox/chap14/climate_spatial_scales.html
The only CO2 absorption that matters to the atmosphere is 15 microns, or wave number 666. Please explain your CO2 “forcing” concept that creates a temperature differential using this graph. I’ll all ears.
http://www.ar15.com/media/mediaFiles/1334/37782.GIF
Nice try, I don’t make up the physics, I just understand them. I’m giving you an opportunity to demonstrate that you understand them as well. Once again, please explain how a very very very weak GHG that absorbs 20% of the IR at 15 microns (13 to 18 range) which is consistent with a black body between -50 and -110 degree C can warm an atmosphere of 13 to 15 degrees C? How can CO2, which is transparent to IR at 10 microns, warm the atmosphere? How can heat flow from -50 degree to 13 Degree C? Have we repealed the 1st Law of Thermodynamics? If so, why have there been no Nobel Prizes in SCIENCE been given to the Climate “Scientists?” Once again, please use this graph to defend your position.
http://www.ar15.com/media/mediaFiles/1334/37782.GIF
co2islife.
” Yes, I do think CO2 “forcing” should be the same in both Hemispheres, care to explain why not? ”
Ummm would you care to explain yourself first? Arguments from ignorance are lazy and dishonest you know.
While you are at it, go research “burden of evidence”.
Burden of the Evidence? Are you kidding me? I Win. Never in the history of science has there been so much evidence that a complete “scientific” theory is based upon 100% pure crap. Here is all the evidence a real scientist needs.
http://www.cfact.org/wp-content/uploads/2013/07/spencer-models-epic-fail2-628×353.jpg
Sorry, that should have read “Man’s production of CO2 hasn’t been linear, it has been logarithmic or exponential.” Atmospheric CO2 follows the relatively linear increase of the oceans/S Hemisphere. That makes sense given Henry’s Law. Warm the oceans, the oceans release CO2. The oceans are degassing as they warm.
My my my, the S Hemi shows a “pause” very similar to the satellite temperatures. Imagine that. More evidence of a fraud regarding the N Hemisphere data. Both show a pause since 2000 and maybe before. Something doesn’t pass the stink test regarding that N Hemi data.
http://www.cru.uea.ac.uk/cru/data/temperature/HadCRUT4.png
http://www.drroyspencer.com/wp-content/uploads/UAH_LT_1979_thru_June_2015_v61.png
Dear CO2, the global T graphics are completely different then the ones published in the 1980s. Those show a global drop in GAT of about .4 degrees ending in the late 1970s, at the peak of the “Ice age scare”. If we only had satellites going back that far,
The models were no better than a line drawn on a graph with a ruler from recent temperatures. Billions wasted.
To claim that temperature is at a “tipping point” as Al Gore did is just one example of the stupidities that constantly emanate from the climate modeling operation.They have gotten nothing right since Hansen started it in 1988 and the whole operation should be closed down. They were given hugely expensive supercomputers to play with and that is exactly what they did. An output consisting of fifty or sixty parallel “possible” answers as they are fond of doing is not science, It is a waste of machine time and a distraction for observers who need quantitative information. In any other technical field inability to produce required output is grounds for shutting down the operation. Apparently none of these jokers knows what quantitative measurement in science means. Their supervisors obviously are just as clueless but they love showing off the output and pretending it is science. Closing it down will get rid of the expense of all this and will let scientists do climate science without the distraction of useless computer models.
I just wrote a piece that summarizes what I believe reaching this halfway point in the climate future means and what went wrong. https://logiclogiclogic.wordpress.com/2015/07/18/the-climate-debate-is-over-we-know-whats-going-to-happen-why-did-it-happen-what-did-we-learn/
Maybe I’m wrong but I feel like reaching this halfway point really is a “change” in the debate. I don’t see how we can be debating many of the points. The data is in, well half the data. That’s good enough that all the debate of that effect or this effect is irrelevant. We have the data. It’s all included by now in the half and 70 years.
Yes, I agree there may be other longer wave phenomenon which might decrease the effect even more (or increase it) and I feel the 0.6C is impossible because satellites are much more likely to be right, so the total is more likely to be refined sooner to closer to 0.3 than 0.6 but I do feel a lot of the debate that we spent so much time arguing about is more or less settled.
I also have an article on the funk that climate team members are in : https://logiclogiclogic.wordpress.com/2015/07/15/pre-traumatic-stress-syndrome-judith-curry-on-michael-mann-gavin-schmidt-in-serious-depression/
and more science on the actual numbers here: https://logiclogiclogic.wordpress.com/2015/04/10/temperature-rise-by-end-of-century-cannot-be-significant/
“0.3 C” sounds like a value for “the equilibrium climate sensitivity” (TECS). The artful placement of “the” in the phrase “the equilibrium climate sensitivity” implies that TECS has a unique numerical value. However, there is no reason for belief in the proposition that it does. Thus, the issue of Earth’s atmosphere’s response to a change in the CO2 concentration cannot be settled by assignment of a value such as “0.3 C” to TECS.
Re: Terry Oldberg 7/18/2015 @ 2:03 pm
<i… “the equilibrium climate sensitivity” implies that TECS has a unique numerical value. However, there is no reason for belief in the proposition that it does. Thus, the issue of Earth’s atmosphere’s response to a change in the CO2 concentration cannot be settled by assignment of a value such as “0.3 C” to TECS.
You have made a mistake, common, I speculate, amongst the majority of physicists, practitioners of the poster child for Modern Science and the Scientific Method. You have conflated the Real World with models of the Real World. The Real World has stuff that impinges on our senses and instruments, but it has no coordinate systems, no variables, no parameters, no values, no numbers, no initial conditions, no algebra, no symbols, no measures, no units, no chaos, no linearity nor nonlinearity, no geometry, no statistics, no correlations, no equilibrium, no entropy. These are all properties of scientific models, all manmade.
The problem is even worse for the poor ECS. The definition begins,
In IPCC reports, equilibrium climate sensitivity refers to the equilibrium change in the annual mean global surface temperature following a doubling of the atmospheric equivalent carbon dioxide concentration. AR4, Glossary.
The problems of nonexistence in the Real World aside, and forgetting that the real climate is never in equilibrium, we can always measure the always-changing mean global surface temperature (GMST) and some coincidental change in atmospheric CO2 concentration, take the ratio, and adjust it to an equivalent doubling in the denominator. That will produce a number with the right units, but it’s not the ECS until one shows that the change in temperature followed, i.e., was caused by, the change in CO2.
We know from physics that atmospheric CO2 increases when GMST increases. That’s Henry’s Law. The public was just lucky that the latest measured changes in CO2 following the change in GMST turned out to be less than 1. If it had been 2 or more, say, it would have confirmed the AGW model instead of invalidating it. It would have done so despite being incompetent, that is, not according to the definition. What the climate community is doing is confusing the scientific principle of causation by simply ignoring it after defining it.
Jeff Glassman:
I’m not addressing ECS but rather its cousin TECS. TECS is implied to have a unique numerical value. If it is unique then we have only to multiply TECS by the change in the logarithm of the CO2 concentration to get the change in the equilibrium temperature.
TECS is the ratio of the change in the equilibrium temperature to the change in the logarithm of the CO2 concentration. Generally, the ratio of the change in one quantity to the change in another is not a constant. In this case, whether the ratio is or is not a constant cannot be determined as the equilibrium temperature cannot be observed. If we are scientists, we reject the hypothesis that it is a constant because it cannot be tested. If we are pseudoscientists we accept this hypothesis because we are “scientists.” This is my argument.
In truth it doesn’t matter what the warmest say. What matters is that we save their names and statements on thumpdrives. The earth is cooling from the top down. Soon, it 2ill be impossible to continue the charade. More important we will want to point hungry and cold citizens to the gov’the agencies, universities and professors, and pitiful parties that walked them I to a nightmare. I am sure they will not walk away as did the bankers who brought about the collapse of the economy. Hungry peple tend to err on the side of revenge. Starving people will not be amused learning warmests cooked the books.
Just as the failure of Lysenkoism undermined the authority of the Soviet state, so to, will the collapse of warmests undermine the authority of the U.S. government. I believe the political system we are under will be demolished along great with the Democratic Party or its’ core members.
Long term forecasts regarding temperature and weather can never be made. Caous Theory simply put means long term forecasts of complex systems that have feedback loops.will allay break down over time.
And, let us not forget that the forecasts models do not factor in cloud formation or where, when and length of coverage. Clouds make a difference.
Mods,
My July 18, 2015 post at 11:03 am continues to await moderation.
Im stunned liberals continue to espouse lies. I ‘m of the opinion they purposely choose insanity.
History books will be something like…Marxists were able to infect a whole country into believing falsehoods of their own free will.
Al Gore is correct in thinking a ‘tipping point’ maybe in the offing, it seems likely there will be a correction and global cooling will reign supreme for a few decades. A drop in temperatures of 0.5 C would claw back most of the increase since the 1970s.
Presumably all bets will be off.
“If you are not sure on whether that is bad or not, think of how many violations of evidence-based procedures by ground crew or pilots that are typically associated with a major airline crash. One or two, perhaps? Bear in mind, too, that commercial air travel is a much simpler, and better understood, situation than global climate change.
How would you react if the pilot announced before take off that he was sure that your flight was special, and so he would not be following the usual procedures?”
=============
Sheese, careful who you drag into your …..dramas.
how can Al Gore decline on the premise he is not a betting man?
He has been willing to bet the entire economy on this farse… suddenly is it not worth a few dollars of his own?
“Global Warming is a forecasting problem”. No, Global Warming is a fraud problem. The fraud begins and ends with the lie that there is something called the Greenhouse Effect.
http://www.planet.fr/environnement-la-terre-connaitra-t-elle-une-nouvelle-ere-glaciaire-en-2030.893490.1474.html
what bet? There was no bet, as Gore declined the offer. Gore hasn’t given an estimate for future warming, so someone chose 0.03C per year, which they claim is the “linear trend” predicted by the third IPCC report. The trend predicted by the IPCC is not linear. The trend is not 0.03C per year. The third IPCC report predicted a warming trend of 0.15C-0.30C/decade over the next several decades. Not only does the “bet” ignore the time frame (see #6), but rather than chose the middle of the range, the deniers have chosen to pretend the higher end of the estimate, the maximum possible, is the “projection” of the IPCC report.
As Dr Martin Hertzberg stated in an article titled ‘More Hot Air Than Science in Global Warming Theory’ (October 3, 2011):
“Knowledgeable scientists . . . know that changes in atmospheric carbon dioxide do not correlate with human emission of carbon dioxide, that human emission is a trivial fraction of sources and sinks of carbon dioxide, that the oceans contain about 50 times more dissolved carbon dioxide than is present in the atmosphere, that recycling of carbon dioxide from the tropical oceans where it is emitted to the arctic oceans where it is absorbed is orders of magnitude more significant than human emissions, and that the carbonate-bicarbonate buffer in the oceans makes their acidity (actually their alkaline pH) virtually insensitive to changes in atmospheric carbon dioxide.
The data for the glacial coolings and interglacial warmings for the past 500,000 years always show that temperature changes precede atmospheric carbon-dioxide changes by about 1,000 years. That indicates that temperature changes are driving carbon-dioxide changes and not the reverse as the Gore-Hansen-IPCC clique claims. As oceans warm for whatever reason, they emit carbon dioxide, and as they cool they absorb carbon dioxide.
The carbon-dioxide ‘greenhouse effect’ argument on which the fear-mongering hysteria is based is actually devoid of physical reality. The notion that the colder atmosphere above can reradiate its absorbed infrared energy to heat the warmer earth below violates the Second Law of Thermodynamics.”
Cold bodies radiate energy. Hot bodies radiate energy. The amount of energy radiated does not depend on the temperature difference. Only the net energy flow between the bodies is affected by the temperature difference. Raise the temperature of the cold body and the net flow decreases. Assuming the bodies are at constant temperature.
Correct. This was a hot topic in the blogosphere for a while because professional climatologists were calling the two energy flows “heat flows.” Bloggers pointed out that one of the two “heat” flows violated the second law of thermodynamics.
Wow, I’m not a Climate “Scientist” and I’ve made almost every one of those points in my comments from time to time. Funny how an unbiased, impartial, casual observer can identify the obvious flaws whereas the Climate “Scientists” just seem to overlook the obvious. That proves to be they simply aren’t looking. Climate “Science” is a fraud, and it must be exposed in a court of law for all to see how betrayed the honest tax paying public has been.
Pretty serious PITA to build, but here it is. I misunderstood what you were asking until I looked at the picture above in context. I made an executive decision to plot “the bet” (no growth flat vs 0.03 C/year linear) against HadCRUT4. Given the error bars, this is a nearly complete waste of time. However, here it is: would be lower so far for the flat/Armstrong assertion, but the outcome of the bet overall is very much in doubt with a strong ENSO underway. Flat overall would fail miserably extrapolated much farther to the left (not shown, but there is the 1997-1998 super-ENSO and then the curve goes down so that the 0.03/year curve would work much better back into the 80’s and beyond). Flat will almost certainly fail miserably in the future. But it isn’t too bad for a stretch now too short to be of the slightest predictive or discriminatory use.
 across the 2000-2014 interval and — unlike either of the others — it extrapolates all the way back to 1850 with very reasonable
  and substantial explanatory power. It can be further improved (as shown above) with a sinusoidal component of period 67 years and amplitude 0.1 C, but it isn’t terrible without it and since I have no physical model that can explain it I omit it in this comparison.
http://www.phy.duke.edu/~rgb/Toft-CO2-gore-vs-armstrong.jpg
Comments:
* Pointless exercise. Truly. Honestly it is a pointless bet without any scientific merit or any substantial argumentative merit running over only a decade with an error order 0.1 C in any given year. As one can see, even though the sloped curve is worse over the last 4 years of the 7 elapsed from 2007 and is only the best in one single year, since the overall temperature series has an autocorrelation time somewhere between 3 and 5 years this is only around 2 “independent” samples and hence is statistically meaningless.
* Note well that HadCRUT4 is an actual surface temperature anomaly, which is almost certainly the only fair bet. Betting the rate surface temperatures are supposed to go up against UAH/RSS is a complex form of cheating, IMO. Leaving off error bars is cheating. Failing to point out that there are only 2-3 “independent” samples per decade of the temperature record isn’t cheating, but it renders nearly all supposedly meaningful conclusions about the climate substantially less meaningful (basically meaningless so far in the “bet”) to those with the wit to notice it. But so what, let’s continue.
* The two curves are forced to be equal (to the HadCRUT4 temperature) in 2007. We don’t have a 2015 temperature yet.
* The blue curve (my own best fit to an actual physical model from 1850 though the present) has almost exactly half the slope of the supposed “Gore” curve, although I’m not sure this is the right name for it. It has an acceptable
In summary, this entire thread is largely a waste of time. The bet, if won by either side, has almost no statistical significance as a decade is far too little a time to have substantial statistical weight in climate science. Even a thirty year stretch doesn’t have that many independent samples in it, not according to the autocorrelation. We are barely reaching the point where we have a decent amount of reliable global data in the satellite era, and there are too many thumbs on too many scales and too small error bars on the result to place much weight on any fits or predictions of climate, simply because we have only a rather foggy idea of what the climate has been more than 35 to 50 years ago, and given an autocorrelation time of only three years there are less than 20 “iid” samples in 50 years of data, or would be if the distribution was likely to be stationary, which it isn’t.
As I’ve repeatedly pointed out, and will point out again — in my opinion — as well or poorly informed as you care to consider it, but I can also IMO adequately defend any or all of my assertions if challenged and have made the curves I’m presenting completely transparent and based on publicly available data — there is sufficient reason in the 165 years of HadCRUT4 data (and/or the related temperature estimates) even given the high probability of limited bias to strongly support the assertion that anthropogenic CO_2 has been responsible [for as] little as 0.4 C and as much as 0.8 C of warming from 1850 to the present. Even with a warming bias, there is no more warming than that to explain in the temperature record, so it seems unlikely that CO_2 is any more of a factor in the climate than it is in my curve. There is zero evidence of a time lag in the climate response to added CO_2, which makes complete sense given that fluctuations year to year and over the autocorrelation time greatly exceed any lagged equilibrium delta T so that warm fluctuations would put us back in equilibrium every 3-5 years (on average) along the way.
This fit over 165 years of data suggests strongly that the pause is indeed a pause and nothing to take to seriously from a statistical point of view, especially given the autocorrelation. It suggests that the MME mean and GCMs are heavily overestimating future warming and incorrectly characterizing past warming. It suggests that there is some point in looking for a robust cause for a 67 year period natural variation superimposed on top of longer term variation of unknown period and amplitude and cause and a probably anthropogenic warming that might well have added to, or subtracted from, natural warming or cooling that might have occurred without it. It provides no good basis for fearing a catastrophe should CO_2 run up to 600 ppm (the highest I think is particularly likely, personally), but is arguably “catastrophically” worrisome if it should run up to 900 to 1000 ppm.
It also very strongly suggests that people not get their panties into a knot over warming or cooling or neutral stretches of less than 70 years. With clearly visible secular time scales of 70 years in the data and insufficient data to tell if these variations are meaningful or part of an even longer timescale pattern we barely have the data to start discussing “climate” as opposed to weather. Even though the past (pre-1850) is even more poorly known than the last 165 years, there is substantial evidence that the climate varies by full degrees C on a century plus time scale. An increase of less than 1 C over the past 165 years is not really resolved from the probable noise of natural variability or variability from unknown and ill-understood forces (not that any are really needed in a chaotic system like the climate).
We know a lot less than we think we do about the climate. If people stated this uncertainty with anything like honesty, there would be a lot less anger and politicking from both sides. Yes, there is definitely global warming. Yes, some fraction of it is probably anthropogenic No, there is little reason to think that future anthropogenic warming will pass some arbitrary limit to “catastrophe”. And far from there being some obvious “global warming” or “climate change” signal, nearly all of the changes in global climate are still way, way down in the noise of the statistically indistinguishable even ignoring the possibility of non-anthropogenic, serious, secular variations.
rgb
Ignore the millennial at your perennial.
=========
Thanks for the work and for the long, eloquent exposition afterwards. I wish it were easy enough for this to be widely understood.
=================
Fortunately, this is not what happens. Instead the Earth is constantly heated by the sun, and cools by radiating heat away through the atmosphere. The atmosphere most definitely radiates some of that heat back down to the surface, effectively raising its temperature relative to what it would be if the atmosphere were perfectly transparent in the LWIR bands associated with the surface radiation temperature. Eventually a smaller fraction of the energy than would have been directly radiated away from the warm surface diffuses to the top of the troposphere and is radiated away via the greenhouse gases at a much lower temperature (because of the lapse rate).
There is nothing in this process that violates the second law of thermodynamics. You should trust me in this, as I’ve done the computation (which is bone simple) and you have not, and I teach this stuff to undergraduates and understand it pretty darned well at multiple levels. You completely misrepresent the process and hence end up spouting nonsense you’ve heard and half-understand.
This silly myth is one of the many reasons skeptics are frequently laughed at and generally ignored in the scientific debate. When you make such a ridiculous statement, you make it easy for warmists to use logical fallacy to advance their argument — if the skeptical argument is so obviously non-physical (when at least some people make it) should any of it be taken seriously?
The Greenhouse Effect is real. Carbon dioxide almost certainly is causing some all-things-equal warming of the Earth’s surface. What is at issue physically are the feedbacks and general failure of high feedback simple models and our lack of ability to solve the Navier-Stokes equations to predict the climate with more complex models. The simplest model — no-feedback or low feedback CO_2 only warming with no lag — actually works remarkably well to fit the last 165 years of global anomaly data. The excellence of this fit is hardly evidence against the GHE:
http://www.phy.duke.edu/~rgb/Toft-CO2-vs-MME.jpg
rgb
rgb:
How well does the no feedback model do against the Gore and Armstrong models?
Hi Terry,
I have no idea. I wasn’t even aware “Gore” had a model, given that he isn’t a scientist. As you can see, the no feedback, no lag model works pretty well against the MME mean from AR5 (which sucks anyway, so it is low hanging fruit). The real question is why one would want to trade the utter simplicity of this model for the insanity of averaging the average of averages of many non-independent models of a chaotic process that clearly indicate that the future climate can do pretty much anything if you look at the model spread independent of CO_2 level, even though the models are carefully overbiased to produce excessive warming while fitting as a reference period the worst possible stretch in the last 165 years, the stretch where the temperature went up the fastest for 20 years in phase with the apparent sinusoid. Do they not understand the first thing about building a reliable predictive model? If you direct me to the Gore and Armstrong data, I could try to plot it on top of the best fit model(s) above and we could see how it stands.
rgb
rgb:
That would be great! The Gore and Armstrong data are available in the graphic of Dr. Green’s article that is titled “Gore-Armstrong Climate Bet to June 2015.”
Global temperature anomaly progression during the last 150 years correlates well with some other natural processes. This could be causal or coincidental, both unlikely, leaving ‘commonality’ as the most likely outcome.
http://www.vukcevic.talktalk.net/GTvsGD.gif
Global Warming is more than a forecasting problem, it is a forecasting, modeling and fraud problem.
1) GIGO, the data sets they use or should use are either garbage, inadequate, non-existent, inconsistent, contradictory and/or manipulated.
2) The model it mis-specified. Temperature drives CO2, not vise verse. By what mechanism would CO2 increase to “force” us out of an ice age? No mechanism exists. Temperature has to increase first. Their model reverses the independent and dependent variables. It is similar to lung cancer causes smoking. Everyone one of these IPCC Models would get an F- in any elementary school econometrics course 101.
3) The models are underspecified, and lack significant variables, clouds for one.
4) The treatment of CO2’s impact on temperature is clearly linear, when it isn’t. CO2 absorbs between 13 and 18 microns IR. That range would impact the cold regions more than the warmer regions. As the earth warms, the amount of radiation absorbed by CO2 greatly decreases. There is a negative logarithmic relationship between temperature and CO2 for wavelengths above 15 microns. Heat literally acts as an off switch for CO2.
5) The modelers clearly cherry picked a period where temperature and CO2 were coincident, but applied a causative correlation to its relationship. They curve fit an unrepresentative short period of time on which to calculate the relational coefficients for the various variables.
6) The data sets are constantly changing, early data was mostly from the US, then US and Europe, then US, Europe and S America, then Russia fell out etc etc.
7) Data sets like the data used to construct the Hockeystick deliberately avoided using thermometer data, the most accurate form of measurement for the time period covered. How you can have a temperature construction that included tree rings, ice core and coral as proxies and ignore available thermometer data is way way way beyond me. I’d love to see that practice defended in court.
8) These models are differential equations, Delta Y = Function of m1X1 + m2 X2….+b+Error, they require variables to differ over time and space. Over the short run CO2 is a constant, it is 400ppm in the N Hemi 400ppm in the S Hemi, it is 400ppm at the surface and 400ppm at the top of the troposphere. CO2 simply should act as a constant in any models over the short run. There is a clear temperature differential between the N and S Hemisphere. That differential has to be caused by something other than CO2.
9) CO2 and H2O absorb the same IR spectrum over the relative temperature range, making CO2 largely irrelevant.
10) CO2 is irrelevant to day time temperatures. Only nighttime temperature sets or differences between day and night temperature sets should be used to measure the GHG effect. Once again, GHGs are transparent to incoming visible light. That is why it reaches the earth and warms it. GHGs trap outgoing radiation from the earth, not the incoming irradiation coming from the sun.
11) Anyone interested in the truth about these models simply needs to take an econometrics course. The flaws are obvious to anyone that knows where to look. If these practice were used by a Wall Street Brokerage House, Drug Company or Oil Company the executives would be behind bars, it is that simple. The fraud is obvious, and anyone with a statistics background would be able to replicate similar examples of fraud in a court of law. That is what climate scientists really fear, defending their practices in a court of law.
Example: Under Armor wants to make the case that Under Armor Shoes increase weight loss.
Everyone knows Weight Loss = a function of Exercise and Caloric Intake.
Population #1) Couch potatoes that don’t wear Under Armor shoes
Population #2) Athletes that have put on weight over the winter and wear Under Armor shoes.
The experiment would then put both Population #1 and #2 on a strict diet, and exercise would be completely ignored. The Couch Potatoes would go on a diet, but remain on the couch, and the top athletes would go off to exercise. Exercise however is not measured, it is completely ignored. Only the type of shoe and caloric intake are measured.
At the end of the experiment the athletes that wear Under Armor shoes would show a statistically significant level of weight loss compared to the Couch Potatoes, and the only thing that was varied in the model (endogenous) was type of shoe. The real driver of the weight loss was a factor not included in the model (exogenous), that being exercise.
Using that approach and that model, Under Armor could prove that wearing Under Armor shoes causes weight-loss, and they could claim to have the data and model to prove it. Problem is, to perpetrate that fraud, they know it won’t be reproducible, so they will only release the model and data to other Under Armor friendly peer review selected representatives that stand to benefit from the fraud. They may hold an internal investigation to create the appearance of credibility, but it is all done to perpetrate a fraud. That is climate change science in a nutshell. One giant fraud.
Wow!!! That article is a goldmine. So concise, direct and honest.
http://m4gw.com/vail_valley_voices_more_hot_air_than_science_in_global-warming_theory/
Note how it was censored:
http://wattsupwiththat.com/2011/10/02/thanks-to-michael-manns-response-a-newspaper-censors-a-letter-to-the-editor/
This really proves something is very very very very wrong with society and the scientific community. Here is a quote that exposes an outright fraud, and nothing happened. Evil will prevail when good men choose to do nothing. How can a credible scientist expose a fraud in a news paper and nothing happen? Silence in the face of evil is evil itself. This system is broken and something must will be done. These arrogant climate “scientists” seem to think they can act with impunity. That will eventually change with an election of when temperature takes a sharp turn down and society won’t be prepared. One simply needs to read how society reacted during the Little Ice Age. The terror of the French Revolution is a great case study of how starving people react to global cooling when the Government isn’t prepared. Just read this following quote. Someone is making a credible claim of fraud, and Penn State, the Media and the legal system did nothing. That is truly frightening.
BTW, here is how you test the data that goes into a climate model. I can understand why this guy got fired. He looked behind the curtain and detailed the fraud:
https://youtu.be/2ROw_cDKwc0
Here are the commonly known facts the Climate “Scientists” seem to ignore, and that is they the theory on which their models are based is flawed.
https://youtu.be/iEPW_P7GVB8
Freeman Dyson destroys the computer models.
https://youtu.be/BiKfWdXXfIs
How is that conclusion reached? How can a GHG, a weak non-bipolar GHG lead to warming when it is excited by IR between 13 and 18 microns? That means CO2 is trapping IR consistent with a black body of temp beween -50 degree C and – 110 degree C. CO2 doesn’t trap heat in the 15 to 18 Degree C Range or 10 microns. How can CO2 cause the warming if it is trapping only cooler temperatures? Can you warm a house by trapping the air conditioning? Doesn’t CO2 have to trap heat of shorter IR to warm the earth? Just how does a GHG that traps -50 degree C temp warm something that is 15 to 18 degree C? Also, how is CO2 warming the Oceans? Something is missing in the CO2 is causing warming conclusion. Repeat it as many times as you like, it just doesn’t pass the stink test.
Are you at all serious in these objections? Surely you jest. Or are simply ignorant, which is more likely given the language you use, “trapping only cooler temperatures” for example. Indeed, almost all of your language is literally unintelligible.
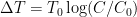
 is the log-linear response, and
  is reference concentration at a presumed “perfect equilibrium” where everything else is stationary (on average). Yes, such a thing doesn’t exist, but this function still describes the direct effect of CO_2 on temperature, all things being equal. A doubling of concentration (as any good engineer should know) increases the log by around 0.3. We expect a temperature change of
  per doubling of concentration. This works out to be a number in the ballpark of 1 to 2 C (the models cannot specify it much more accurately than that for a variety of reasons).
Look, the atmosphere is almost completely opaque with a damn short mean free path in the primary CO_2 absorption band inside the general blackbody radiation power curve associated with the Earth’s surface temperatures. There is absolutely no question that there is substantial power radiated away from the surface (say) outside of my window in the band absorbed by CO_2. This energy is absorbed within the first two or three meters of the surface and almost immediately is transferred to the surrounding air (N_2 and O_2) helping to keep it warm. The atmosphere itself reradiates this energy (Kirchoff’s law) in roughly the same band, and some fraction of this reradiated energy does indeed go back down and hits the surface of the Earth and counts as part of its total energy input.
However, a lot of the energy thermally radiated from the Earth’s surface goes straight up and out through the atmosphere. As the temperature rises, the rate at which the surface loses energy directly increases and the rate at which energy is absorbed and returned increases. Some energy is not returned, and diffuses up through the atmosphere to where it becomes transparent (enough) in the greenhouse gas bands to escape to space. It does this at much colder temperatures than the surface of the Earth because of the lapse rate, it does it from a comparatively narrow band, and hence is relatively inefficient as an energy loss mechanism.
Are you with me so far? Energy comes in from the sun, and some fraction of it is absorbed by the (say) land surface. On average, to maintain a constant average temperature, just as much energy has to be lost to space as comes in. Some of the lost energy is radiated away from the surface at comparatively warm surface temperatures. Some of the lost energy is radiated away from e.g. CO_2 at top of the troposphere temperatures. The total has to balance in order for the average temperature to remain constant, over however long a time you like. There isn’t the slightest doubt that this crude description is empirically correct because we have ample spectrographs of energy being radiated away from the Earth at the top of the atmosphere and its spectrum is entirely consistent with this description, quantitatively consistent with this description.
Note well that I haven’t said anything about “warming” or “cooling” due to CO_2. All I’m doing is describing a state of detailed balance in an open system. The split I describe doesn’t require me to refer to “back radiation” or to describe in any sort of detail internal heat transfer mechanisms, because it is a spectroscopic split that is clearly observable in the actual measured spectra of the energy that is actually being radiated away from the Earth to balance the energy delivered by incoming sunlight. I don’t care what’s going on with latent heat, with albedo, with lateral heat transport. They can certainly have effects, and those effects on the climate may dominate greenhouse gas modulation some or even all of the time, but the spectra are the spectra and there is absolutely no arguing with the split between LWIR surface radiation intensities at surface temperatures and greenhouse gas radiation intensities at top of the troposphere temperatures because we have numerous photographs of it, because we routinely measure it, because it has been verified in such a complete way that it is literally insane to assert that it doesn’t exist.
All that is then left is the need to assess the effect of an increase in CO_2 concentration on this balance. And we don’t need to work very hard — all we really care about is the sign of the effect. Does it a) increase the rate of radiation from the CO_2 absorption band (which means that there must be less energy radiated directly from the surface, which in turn means that the surface is relatively cooler in steady state); or b) decrease the rate of radiation from the CO_2 absorption band (which means that more energy must be radiated directly from the surface, so it must be relatively warmer in steady state). I don’t address in any way how the energy moves around in the meantime — it does not matter. All that matters is that ins must equal outs.
If you need a metaphor, imagine a hose with two nozzles. Water is being pumped into the hose at a fixed rate. The rate it comes in must equal the rate it comes out. The rate it comes out of either nozzle depends on the pressure inside the common hose and the aperture inside. We can label one nozzle “surface radiation” and the other “greenhouse gas radiation at the top of the troposphere”. Both rates depend on the pressure inside (the temperature) and the pressure/temperature itself is determined by the requirement of balancing the flow out of a fixed flow pump (the sun). If you reduce the aperture of the greenhouse gas nozzle, you will decrease the flow out of that nozzle, increase the pressure in the hose, and increase the outflow from the other nozzle. It is that simple.
So which is it? Adding more CO_2 to the atmosphere without any question at all reduces the mean free path of photons in the LWIR bands it absorbs in. This in turn without any question raises the average height where the atmosphere becomes sufficiently transparent for LWIR photons in the CO_2 band to escape to space. It is colder higher, so energy loss is less efficient. It reduces the outflow through the CO_2 mediated channel, and the outflow through the direct channel must increase to maintain detailed balance. And in order for that outflow to increase the temperature must go up, and does until balance is re-established.
This at no time violates any laws of thermodynamics, any more than closing a tap and raising the pressure in your house’s pipes does. Net heat flows from hotter to colder (on average). Entropy increases as net heat is transferred from the hot sun to the cooler earth, from the cooler earth to the still cooler atmosphere, and from the cooler atmosphere to cold outer space. Statistical mechanics is happy. There are microscopic quantum models for this entire process that are based on sound physics and that produce results that are in good agreement with observation. This isn’t even exciting science, it is well-known.
However, it is just one component in the enormously complex process of absorption, reflection, and heat transfer that determines the climate. It may not be true, for example, that energy input is truly constant, because albedo might vary in ways that are coupled to the CO_2 gas concentration. There can be negative feedbacks, positive feedbacks, and more in the many transport processes and processes that contribute to total energy outflow compared to total inflow (albedo determines energy outflow in the visible spectrum, not LWIR, and hence all by itself complicates things enormously). But the CO_2 component per se — indeed, the greenhouse gas component in general — is without any reasonable doubt a warming, not cooling, component, and one that causes an overall warmer average surface temperature as its concentration is increased, not cooler or neutral surface temperature.
Other things may well overwhelm it. We have good reason to believe — from direct computations not from complex climate models but from simple radiative transfer models — that the direct effect of CO_2 concentration on change of temperature in the vicinity of the current concentration and temperature is a function like:
In this expression,
This is certainly not likely to be a catastrophic number, especially if it comes in anywhere from the middle to the lower end of this likely range. The entire assertion of catastrophe comes not from the CO_2-based greenhouse effect and rising CO_2, but from hypothesized positive feedbacks in the highly nonlinear and complex climate system, primarily from water vapor. These feedbacks are supposed to multiply the direct warming by a factor that used to range from 2 to 5 — the latter a figment of Hansen’s “overheated” imagination and little else — and that now is believed to almost certainly be less than 2. The IPCC is trying hard to hold out for a value close to 2 so that they can claim a total warming order of 3 C per doubling, arguably damaging if not exactly catastrophic. Most current papers, however, are putting it down well below 2 simply because the data itself no longer supports the higher values.
There are a minority of papers that assert that it is anywhere from one (as a multiplier) to slightly less than one — net negative feedback. In my own opinion — based on actually fitting this function in a reasonable way to actual anomaly data — we can expect ballpark 1.5 C per doubling, very close to a no feedback result, but IMO the uncertainties are high in part because the data I fit almost certainly has a warming bias (p well over 0.95) and because the data I fit systematically underestimates past error bars in the temperature anomaly relative to errors in the current temperature anomaly (this is “certainly” true, not just probably true). As a consequence my best fits are corrupted by a systematic warming bias in the data and are less reliable in any event because we simply know past data a lot less precisely than is claimed. Even so they are pretty good fits, and the best fit yields a temperature increase of 1.8 C per doubling, which is likely an upper bound on the sensitivity.
Is this number correct? Who knows? The climate is enormously complex, and even if CO_2 does have a simple, direct warming effect that effect could easily be swamped, cancelled, augmented, altered etc by natural variations or by important nonlinearities that we do not understand (yet). The “pause” IMO is not an issue, because it is part of the 67 year sinusoid that best fits the modulation of the temperature around the CO_2 only curve for the last 165 years and whether or not that sinusoid has any causal basis we can understand, it is empirically a measure of the possible natural variation making the pause very reasonably a natural variation around the CO_2 warming curve. In any event, current temperatures are dead on my best fit with the sinusoid, and are remarkably close with it or without it since 1850.
So please, stop asserting that there is no greenhouse effect, or making the usual noises about how it is impossible for a “trace gas” to have an important effect on climate. Both are pure nonsense. There is, and it can, and it does, and we have direct spectroscopic evidence of the process in action whereby it does. It also fits the temperature data in a very believable way, although this is hardly conclusive or even strong evidence for any given estimate of sensitivity, it is absolutely not evidence against it.
rgb
Really? I’m not the one defending a “science” that can’t even produce computer models to make their case. You don’t get any more pathetic than that. Here, I’ll type slowly and avoid using big scary words so you can keep up This is the spectrometry of CO2, CO2 has a peak at 15 that is applicable to the earth. At 15 microns/666 wave number, CO2 is almost transparent to IR radiation. It absorbs 20% of the radiation. Given that ir re-radiates that IR over 360 degrees, at most 50% ir re-radiated back towards earth. That 13 to 18 micron absorption band is consistent with a black body of -50 to -110 degree C. Here is the calculator. Feel free to check my numbers. Please explain how a very very very weak GHG, that transmits 80% of IR at 15 microns can warm an earth of 13 to 15 degrees? Please answer the simple question using the following graph and calculator.
http://www.spectralcalc.com/info/CalculatingSpectra.pdf
http://www.ar15.com/media/mediaFiles/1334/37782.GIF
Uhhhh, maybe you don’t get the issue at hand. No one is arguing the GHG effect doesn’t exist. The problem is attributing warming to a very very very weak GHG that transmits 80 of the IR at 15 microns. CO2 has a atmospheric window over the temperature range of 13 to 15 degree C or, 9 to 10 microns. CO2 is transparent to the radiation being emitted by most of the globe. The question you must answer is how can a GHG that absorbs 20 of the IR at 15 microns, consistent with a black body of -50 to -110 degrees C warm a globe that is 13 to 15 degree C on average. Answer that simple question. Once that is answered, please explain how CO2 can warm the oceans. Once that is answered, please explain how we have 600 million years of history and temperatures never got above 22 degree C, even when CO2 was 7000 PPM. It appears that I have 600 million years of data that proves the theory you support is pure crap. Did I type that slow enough for you to understand? I’m eagerly awaiting your response.
http://www.paulmacrae.com/wp-content/uploads/2008/06/co2-levels-over-time1.jpg
1) “The problem is attributing warming to a very very very weak GHG that transmits 80 of the IR at 15 microns.”
…
Nobody says it is “warming” anything….the GHG’s effect is to SLOW DOWN THE RATE OF COOLING … Obviously you don’t understand what is happening.
..
..
2) “even when CO2 was 7000 PPM. ” ….Sorry, can you provide evidence of that instead of the graph produced by the GOCARB model ?
PS… co2islife
…
On your graph you show global temps from 500 million years ago.
…
Are you sure it was 22 degrees and not 24 ?
“Is this number correct? Who Knows?” Who Knows!!! I thought this was settled science? How can a settled science have unanswered questions? You can make as nonsensical a theory as you like. You can curve fit as many data sets as you like. Facts are, the curve fit cherry picked IPCC models prove this theory is pure garbage. Anyone can curve fit data sets. Curve fitting is garbage modeling. Sound models are based upon sound theory.
1) CO2 absorbs at 15 microns. It is transparent to IR consistent with -50 to -110 degree C. You aren’t going to warm a 15 to 17 degree C body trapping -50 degree C heat.
2) The oceans are warming. 15 micron IR doesn’t warm the oceans.
3) The IPCC models are pure garbage and demonstrate a non-existent linear relationship between CO2 and temperature.
4) The heat absorption of IR by CO2 isn’t linear over the ranges of temperature.
5) Satellite and ground measurements don’t match, and there are oddities between the N and S Hemisphere.
6) If CO2 was trapping heat it would be most likely to impact the extreme S Pole and the Stratosphere.
7) Over the range near 13 to 17 degree C, water vapor traps what heat CO2 would. Water vapor simply overwhelms anything CO2 could do.
8) Instead of curve fitting data sets to make them fit your theory, simply line up the various data sets and run a stepwise regression. A computer will never choose CO2 as a significant variable.
9) Just ask yourself by what mechanism does CO2 lead Temperature coming out of an ice age? What increased CO2 in the atmosphere to start the warming?
If you Climate “Scientists” would take 2 seconds to study the data, you will easily understand just how blinded you are by your bias and group think. You have 600 million years of data and never once did CO2 cause catastrophic warming? Never. Why try to make up a model that requires ignoring 600 million years of history? Note how temperatures never got above 22 Degree C, never (at least on a sustained basis)
http://www.paulmacrae.com/wp-content/uploads/2008/06/co2-levels-over-time1.jpg
Why would you never get above 22 Degree C? Because there is an atmospheric window. The GHG effect shuts off that range, and radiation simply transmits back to outer space. There is nothing to hold back radiation at 22 Degrees C. 22 Degree C is at the bottom of the atmospheric window at 9.5 microns. This graph comes from NASA. Clearly there is nothing between 9.5 and 6 microns.
http://earthobservatory.nasa.gov/Features/RemoteSensing/Images/atmos_win.gif
The GHG effect doesn’t start up again until 6 microns. 6 microns is consistent with 175 Degree C temperatures. The gap between 9.5 and 6 microns, the atmospheric window, is why never in 600 million years has CO2 caused run away global warming. That is why CO2 levels as high as 7000 PPM didn’t do anything to boost temperatures.
http://www.spectralcalc.com/blackbody_calculator/plots/guest417043385.png
Ooops, I misread this chart from NASA. The above quote should has said 15 microns to 8 microns. H2O Picks up again at 8 microns. 8 Microns is consistent with 75 degree C temperatures.
http://earthobservatory.nasa.gov/Features/RemoteSensing/Images/atmos_win.gif
Ooops, that is wrong as well. The atmospheric window is 15 to 8 microns. The GHG effect picks up again through H20 at 75 degree C. Temperatures have to go from 22 degree C to 75 degree C for the GHG to cause catastrophic warming. There is a huge buffer that must be crossed for GHGs to cause run away warming.
http://www.spectralcalc.com/blackbody_calculator/plots/guest1130467180.png
That isn’t true at all. The GHG effect changes EM radiation energy into thermal energy. The atmosphere is transparent to visible light, visible light doesn’t warm the atmosphere. Only when visible light reaches the earth does it warm anything. Once the earth is warmed, it radiates IR back. That IR radiation will travel through the atmosphere until the proper wavelength hits the proper molecule and is converted from EM radiation into thermal radiation. That is exactly why the atmosphere heats then cools than heats again depending upon altitude. Yes, the GHG does slow cooling, but it also warms the atmosphere where the IR excites the molecules. Energy is changed on form, and when it is changed from EM to thermal radiation it does warm the atmosphere. It doesn’t warm it above that of the radiation body, but the atmosphere around the excited molecules is warmed relative to what it would be if no IR excited the molecules.
Co2islife says: “The GHG effect changes EM radiation energy into thermal energy.”
…
I suggest you get an IR thermometer, and on a clear cloudless night, point it to the night time sky, and tell us what the reading is.
…
The green house gasses re-emit the EM radiation they absorb. You can measure it with an IR thermometer.
Maybe, but that difference would be immaterial given the context. 24 Degrees isn’t run away warming.
The relevant point is that CO2 and Temp don’t have a linear relationship.
http://www.paulmacrae.com/wp-content/uploads/2008/06/co2-levels-over-time1.jpg
No co2islife….The relevant point is that we don’t have a clue what the global temperature was 500 million years ago. Heck we’re still arguing about the MWP, and that wasn’t even 2000 years ago.
Houston, We Have A Problem!!!! If this chart of CO2 IR Spectrometry is correct, CO2 at 15 microns is insignificant. As I’ve been saying CO2 is a weak GHG because it doesn’t have a dipole. Here is a chart that demonstrates the various vibrations of CO2. Clearly at 15 microns the bending vibration only captures 20% of the radiation, and CO2 transmits 80%.
http://bradleydibble.authorsxpress.com/files/irCO2.jpeg
This graphic shows the same weak absorption at 15 microns/666 wave number.
http://2.bp.blogspot.com/-t03PRp2vByo/USH9yyxvYJI/AAAAAAAAA5U/LQAVJaorYxk/s1600/CO2+0.8+ABS+FTIR+Dec+2012.bmp
Why all these models are wrong, and why they will always be wrong, and why CAGW is 100% wrong is because they assume a linear relationship between CO2 and temperature. More CO2 by definition means higher temperatures. They have established a direct positive relationship between CO2 and temperature. That is 100% pure garbage, and it demonstrates an ignorance of biblical proportions with regards to the physics of CO2. Here is an absorption graph of CO2. Clearly it shows an exponential decrease in absorption once the IR passes 15 microns, and reaches near 0 by the time it reaches 13 microns. The earth emits around 9 to 10 microns, or 15 to 17 degree C. There is an atmospheric window with regards to CO2 when it comes to the average global temperature. The warmer it gets above -80 Degree C, the less heat is trapped until CO2 stops trapping hear around -50 Degree C. I’m 100% certain the CAGW “scientist” didn’t work that into their models. This chart alone proves CAGW pure manufactured garbage based on either an ignorance of physics on a biblical proportion, intentional deceit or both, and neither qualifies as sound or settled science.
http://members.casema.nl/errenwijlens/co2/co205124.gif
…and you are 100% wrong. Look, I don’t know where, or how, you decided that all of the people who have worked out the quantum mechanics of this are idiots, but most of them truly are not and most of them are not “climatologists” and have no dog in this race. I’m not a climatologist — I’m just a physicist and the climate is my current “hobby” — and I have no dog in this race. I think both sides that do seem to have dogs in the race are well represented by extremists far more interested in the politics or some a priori desired conclusion than they are in the conclusions the data and such theory as there is actually support. where the former is the dynamic equilibrium temperature that balances the input power and the net power lost to the fixed temperature cold reservoir.
My only suggestion to you is that you invest a paltry sum and purchase Grant Petty’s book “A first course in atmospheric radiation”. God knows you need a first course in it. Maybe even a second course, too.
The relevant spectrographs are actually already on WUWT here:
http://wattsupwiththat.com/2011/03/10/visualizing-the-greenhouse-effect-emission-spectra/
To anyone who can read a graph, the argument is over. You can argue all you like using words and misapplied physics about what CO_2 can and can’t do, and what must or must not be happening, but the graphs (figures from Petty’s book, actually) speak for themselves. They illustrate precisely the process I described above — emission in the CO_2 bands that is depressed in intensity to correspond quite accurately to the emission temperature at the emission height. That, plus the requirement for detailed balance, pretty much proves that you are wrong. Petty’s presentation of a simple one layer model for the warming proves that you are conceptually wrong, deeply wrong, wrong headed.
The fact that a lot of very smart people understand why you are wrong and have written code like Modtran that computes your wrongness and agrees pretty well with the observations is just one more reason you might tone down your rhetoric. Especially the bit about how a “cold gas” can’t cause a warmed surface in dynamical radiative equilibrium with a cold reservoir (like outer space) to become warmer. Of course it can. All it has to do is get in between the warmed surface and the even colder radiative temperature of outer space. Done. End of story. That’s such a simple, obvious, easily understandable and computable consequence of ordinary thermodynamics it truly amazes me that Dragonslayers are obviously completely incapable of grasping it, even when it is broken down to a single sentence.
Look you can try it for yourself. Imagine that you have some flat surface that you are heating with (say) an electrical resistance at a fixed power. It is insulated on all sides but one, which faces another surface maintained at 3 K. Wait a long time for the system to arrive at radiative equilibrium. That equilibrium is established by the requirement that the input power equals the net output power, which by construction is all radiative and proportional to
Now stick anything into the vacuum between the plates. Any matter at all. All it has to do is a) have a heat capacity; b) have an emissivity/absorptivity that is not zero. If you want to make the conclusion painfully obvious, make it a perfect absorber with unit emissivity — a flat “black body” plate. Now recompute the dynamic equilibrium temperature of the heated surface. Oh wow, look at that! It is warmer! And while the interpolated plate is cooler than the warmer surface (it has to be so net power is still balanced at the higher temperature) it is warmer than 3K which is all that matters. It could be 100 K and it would still warm the surface, even if the surface were originally at equilibrium at 200 K or 300 K.
This isn’t rocket science. Nor is it climate science. These are prelim questions for physics grad students. They just test whether or not you have a clue about energy flow, Stephan-Boltzmann, and detailed balance. There is an actual prelim question in a book of prelim questions that asks the same thing in the context of passive cooling times. Everybody who has actually studied physics and who works through this exercise will forever after know better than to assert nonsense about colder objects being able or unable to cause further “warming” of a warmed surface. Sure they can. That’s why we put on jackets when it is cold outside. That’s why/how space blankets work. They don’t warm an object, but they can sure as hell slow their rate of cooling and hence cause an increase in the equilibrium temperature of something with a heat source.
rgb
1) Is CO2 transparent to IR between 13 and 4.3 Microns? Yes or no?
2) If CO2 is transparent to IR between 13 and 4.3 microns, how does it warm the atmosphere between -50 and 200 degree C. By what mechanism does CO2 warm the atmosphere when it is transparent to the EM radiation passing through it?
3) How does IR at 15 microns warm the oceans?
4) Why over 600 million years has CO2 not caused catastrophic warming, even when it was 7000 PPM?
Answer those simple questions.
BTW, what is the real story of this chart?
http://wattsupwiththat.files.wordpress.com/2011/03/gw-petty-6-6.jpg?w=1050
1) A black body of 290k has a peak radiation of 10, not 15 as the chart implies.
http://www.spectralcalc.com/blackbody_calculator/plots/guest1598458569.png
That fact is also backed up by this chart.
http://2.bp.blogspot.com/-k7PZWFWcJ4E/USGAQg33x3I/AAAAAAAAA4o/73_JODiWwiU/s1600/Atmospheric_Transmission.png
2) What CO2 does isn’t to cause catastrophic warming, it prevents catastrophic cooling. As the earth cools, the peak moves towards the CO2 absorption band. Removing CO2 from the atmosphere would remove the mechanism by which heat is trapped as the earth cools. Once again, CO2 traps the colder temperatures. It looks to act as a buffer to stop run away cooling. CO2 doesn’t absorb any of the warmer temperatures. The tropics are transparent to CO2.
Here is the chart you are referring to:
http://wattsupwiththat.files.wordpress.com/2011/03/gw-petty-6-6.jpg?w=1050
1) The earth surface temperature is 15 degree C, so the proper curve is the one between 280 and 300 degree K.
2) Clearly CO2 absorbs at 15 microns…so what. That is consistent with a black body of -80 degree C. So we trap very very cold heat.
3) There is an atmospheric window between 13 microns and 8, with some absorption at 9.5 due to Ozone O3.
http://earthobservatory.nasa.gov/Features/RemoteSensing/Images/atmos_win.gif
Care to explain how CO2, using your chart, results in warming above 15 Degree C? Please explain that simple concept that violates the 1st law of thermodynamics. Enlighten me.
How can I, when you use phrases in your statement of the question like “we trap very very cold heat” that indicate that you are completely clueless about energy flow?
Let’s start with this. CO_2 traps radiation not heat. It doesn’t trap only radiation at some temperature, because photons don’t have temperatures, distributions of photons are characteristic of some temperature or are emitted by a body at some temperature. If you look at the BB curves in the blue side of the graph you posted above, you will see that the Earth’s surface emits plenty of its outgoing radiation in a band that substantially overlaps with, and is absorbed by, atmospheric CO_2.
This energy that is absorbed is just energy. Each photon in the absoption bands of CO_2 has a probability of being absorbed that is basically unity within the first few meters of the sea level surface. There are a lot of photons — there is a lot of integrated power in the CO_2-absorbed surface emissions. Note that again according to this graph, supported by the other graphs from Petty, 70 to 85% of the thermal radiation emitted by the Earth’s surface at typical surface temperatures is absorbed by the atmosphere. Let’s be generous to a fault and say it is 2/3.
The absorption by CO_2 is not scattering. The CO_2 molecule recoils (momentum is conserved in the absorption) and long before it can re-emit the photon in a different direction it collides with another molecule in the atmosphere transferring most of the absorbed energy to it. Since almost all of the molecules of the atmosphere are N2 or O2 (or even Argon) the radiation that is absorbed by CO_2 near the surface is mostly transformed into kinetic energy of the atmosphere, which we might call “heat” although it is really internal energy. This process does continue until the atmosphere and the surface are close to the same temperature — radiative coupling is as important as conduction in establishing a sort of equilibrium between the surface temperature and the surrounding air temperature. In equilibrium it is just as likely for collisions to transfer energy to CO_2 that then reradiates it as an in-band photon that has some chance (very near the surface) of making it back to the surface and a roughly equal but slightly larger and rapidly increasing with height) chance of being absorbed by another CO_2 molecule.
Is this clear? There is no trapping of “very very cold heat”. There is no such thing as “cold heat”. Temperature isn’t connected to heat, it is connected to internal energy (via equipartition) or if you prefer, to enthalpy. In the first law, heat is thermal energy in motion that is becoming unavailable for doing work. I don’t blame you for not understanding it — most people don’t unless they take a course in thermodynamics and work pretty hard at it — and it is an easy term to casually abuse (I’m guilty of it myself). In this case, there is just trapping and emission of radiation, in a quantum process where temperature is basically irrelevant, in a mixed gas that has a locally averaged temperature and heat capacity where the latter is defined only in terms of changes in heat energy, not some absolute amount. The photons absorbed and emitted by either the earth or the gas above it do not come with temperature labels. They do not come with labels that tell how they were produced. The process of emission and absorption do not care about, or understand, temperature. Temperature only characterizes the statistical mechanical probability distribution of energies in system or subsystem, and that is the outcome of many, many individual processes that themselves have nothing to do with temperature. That’s why temperature can be treated as a universal property associated with equilibrium (zeroth law) — even though a solid and a liquid and a gas all have very different characteristic interactions and internal microscopic physics, that doesn’t matter. Temperature is how energy distributes itself within the available degrees of freedom, given time to do so, due to pure chance.
The second law is all about probabilities. It isn’t impossible for net energy to be transferred between a cooler body and a warmer one in a purely thermal process. It is just improbable. Very improbable, if the temperatures are very different. However, we cheat the probabilities all the time, which is why the various heat engine and refrigerator statements of the second law have the codicil no other effect in them. It is impossible to build a heat engine that has no other effect but to absorb energy from some thermal reservoir and turn it into work.
That doesn’t mean that one cannot build heat engines! Or refrigerators! In my kitchen there is a machine that right now is heating the house with energy extracted from its internally colder temperatures. It isn’t just doing that, of course — it is being given extra energy from a wall socket and is rejecting both that energy and the energy from the interior into the room. There is another effect.
Open systems are even trickier. An open system is one where one inputs energy in some form or at some rate on one side (or in one channel) and removes it in some other side/channel. A rod heated at one end and cooled at the other is an open system. It is not in thermal equilibrium. It doesn’t have “a temperature” (although in this simple case it an be said to have a smooth range of locally averaged temperatures). Even though the average energy per unit volume is well-defined, the energy is not stationary, it is in flow through the rod. The temperature distribution in the rod is a function of the temperature difference across the rod and the thermal conductivity of the rod.
Here we start to see how easy it is for “cold stuff” to “warm” “warmer stuff” without in any way violating the second law or first law. Those laws in no way specify the thermal conductivity of materials — that is determined by the details of the actual interactions between the microscopic components that make up the rod. If we want to increase the temperature of a point 1/3 of the way from the hot to the cold end, all we have to do is tweak the conductivity of the rod 2/3 of the way down the rod towards the colder end. This part of the rod is colder! But by altering is internal properties — basically altering the probability or rate of energy transfer from one atom to the next — we will most certainly modulate the temperature of the warmer end of the rod.
This is really all that the greenhouse effect is. It is a modulation of the rate of transfer of energy up through the atmosphere in multiple channels from the radiation heated surface of the Earth to the cold radiation sink of outer space. Increasing CO_2 very slightly increases the radiative resistance of this channel, very slightly decreasing the effective “thermal conductivity” (not really the quantitatively correct concept, as radiative coupling is nonlinear and complex where Fourier’s law is comparatively simple, but still a good metaphor) of the atmosphere and hence raising temperatures on the warmed side of the system. Note well, actively warmed. This is not cold gas passively warming a warm surface with no other effect, it is a cold gas modulating the transfer of energy from the warm surface to infinity.
Nowhere in this is the first or second law violated. Indeed, the process is required by the first law and the need for energy to be conserved, and one can absolutely trivially show that the heat transfers involved all increase entropy or leave it unchanged, with a large overall net increase as energy flows from the sun to outer space through the Earth as an intermediate stopping point.
As you can see, you have a lot to learn before I can even start to answer your question. I’ve tried to keep the stuff above at a very simple level so that you can understand it (again) but I can’t teach you if you are going to persist in willful ignorance just so you can continue to trumpet how CO_2 cannot warm the Earth as it increases. Of course it can. It probably is. The process whereby it does so is pretty well understood and is confirmed by the very graphs you show up above. I don’t completely disagree with some of your statements, BTW — CO_2 is less about causing catastrophic warming at this concentration than it is about preventing the general collapse of the atmosphere into catastrophic cooling, but that doesn’t mean that it won’t modulate the temperature up further still with increasing concentration, only that it will do so logarithmically, not linearly (as I think you asserted somewhere above).
Hope this helps. But somehow I doubt that it will. In the meantime, I have to go teach actual physics to actual physics students, so it might be a while before I can reply further. We’ll see in your reply if you are interested in learning or are interested in SHOUTING your ignorance to the world with “interesting” dragonslayer-inspired turns of phrase.
rgb
It seems to me that it would be well if global warming climatologists were to replace their current, illogical process for building models by a logical process. “What’s this?” one might think, I had thought that the process currently being used was logical. Actually, it is not logical.
Logic provides us with means for drawing valid conclusions from arguments. In the classical logic propositions have truth-values. More generally, propositions have probabilities of being true.
Probabilities are defined on events but two decades and 200 billion dollars into their study of global warming climatologists have yet to decide upon what these events are. One result is for it to be impossible for one of today’s models to convey information to a policy maker about the outcomes from his/her policy decisions. The climate remains uncontrollable but policy makers persist in ultra expensive attempts at controlling it. This absurdity results from neglect of logic by global warming climatologists in building models.
Oh no, he is a Dragon Slayer. That explains a lot. Who else spouts the nonsense that the greenhouse effect violates the second law?
rgb
rgb.”we can expect ballpark 1.5C per doubling” CO2 absorbs all the radiation available to it about 3m above the surface. If you double CO2, the distance reduces by half. Reducing the distance does not change the heat. Where does the additional heat come from?
I don’t understand the question. First of all, if you double the concentration, you don’t reduce the distance by 1/2 as the concentration is quantity per unit volume. If you reduce the distance between molecules by 1/2, you have 8 times the concentration. Second, what “extra heat” are you referring to? Not that there isn’t an obvious source for all the heat in play — Mr. Sun — but I have no idea what extra heat you could be asking about.
rgb
Sorry,I missed this. As a layman I am trying to understand. LWIR travels a distance (the mean free path?) before absorption by a CO2 molecule. If you increase the amount of CO2 you change the location at which LWIR Is absorbed. Changing the location at which CO2 becomes saturated doesn’t change the heat. A doubling of CO2 causes(results in) an increase of 1.5C in heat?
I see what you are asking. Part of the confusion is that there is no such thing as 1.5 C “in heat”. What you are asking, I think, is why doubling the concentration causes surface temperatures to increase by 1.5 C. You are interpreting this as needing a new source of heat, but it doesn’t. The heat is coming from the sun. All that the extra CO_2 does is slightly reduce the transmittivity of the atmosphere that allows the heat of the sun, delivered to the Earth, to escape to outer space and maintain an approximately constant temperature. Because the CO_2 is transparent to visible light (where most of the Sun’s energy comes in you get a heat trapping — energy comes in easily, but has a hard time getting out. Making it harder causes the temperature to rise until ins and outs balance once again.
Does that answer your question? There is a fair bit of detail in explaining in detail why increasing CO_2 concentration increases the radiative resistance of the atmosphere between the Earth’s surface and outer space to LWIR in its absorption band, but surely that is intuitively reasonable.
Again the best metaphor is this. Your body produces heat at a certain rate. If you surrounded yourself with a perfect thermal insulator, your temperature would increase until you literally cooked in your own heat. You DON’T cook because your body loses heat at (on average) exactly the rate it produces it so that your temperature remains nearly constant.
If you put anything between your body and the surrounding cool environment, you heat up, at least until your body’s evaporative cooling mechanism (sweat) kicks in. If you are in warm air, you heat up even if the air is cooler than your body. If you put a space blanket around your body you warm up. A substantial fraction of the energy you lose to your surroundings is lost via radiation, not conduction or convection (although both conduction and convection and latent heat contribute as well).
Additional CO_2 acts crudely like a one way blanket, one that easily lets energy (in the form of visible light sunlight) but obstructs energy trying to get out (as LWIR in its absorption bands). Simply put, it reduces the efficiency of energy loss in its absorption bands in a way that varies monotonically with concentration, so the higher the concentration, the lower the efficiency of energy loss in its absorption bands. This forces the ground surface temperature to increase to increase the efficiency of energy loss in the rest of the (unblocked) LWIR radiated away at the characteristic temperature of the ground, with no additional heat source needed.
rgb
rgb:
It can be added that 1.5 C is the increase in the quantity that is called the “equilibrium temperature” and that the increase in it cannot be measured. Thus, the hypothesis that the value is 1.5 C (or any other value) has to be accepted on faith if it is to be accepted at all. Scientists do not accept hypotheses on faith. Priests, pseudoscientists and members of the “consensus” of global warming climatologists do.
There are only two things that can change the energy content of a system in a radiative balance. They are either a change in energy input, or a change in some aspect of the residence time of energy within the system. (our system is the earth’s land, oceans and atmospheres)
GHGs both increase and decrease the residence time of energy within the system. They increase the residence time of some LWIR within the atmosphere, thus input remaining constant results in some increase of total system energy which MAY result in an increase of thermal energy, and they decrease the residence time of some conducted energy (energy conducted to the atmosphere vs. radiated) within the atmosphere, which results in less energy within the system.
I do not believe we currently have the ability to quantify the effect of this increase in CO2, but observational evidence indicates it is primarily beneficial.
Well put. My problem here is the assertion that a doubling of CO2 results in an increase of 1.5C. It seems nothing else matters in the atmospheric heat energy balance except the “magic” molecule.
Nobody (certainly not I) said that “nothing else matters”, and CO_2 is not “magic”. Part of the problem is that you are used to thinking of the atmosphere as being transparent, because that’s what it looks like in visible light most of the time. It does not look that way in LWIR in the CO_2 absorption band.
I’m certain that you’ve been outdoors on a very foggy day, the kind of day where you cannot see things more than 20 or 30 feet away. That’s a fair metaphor to what things look like when seen through the atmosphere in the primary CO_2 absorption band. Very little of this long-wavelength “light” penetrates as far as ten meters. You would easily notice a qualitative difference in the transparency of the atmosphere in a light fog — where you can see the fuzzy outline of a tree 100 meters away, say — and a heavier fog where you can’t see the tree at all if it is 100 meters away. If you were tracking light energy through to the tops of clouds where it can finally “escape”, you wouldn’t be horribly surprised if making the fog thicker raised the cloud tops and made it more difficult for the light to escape, and in particular would make it colder where it finally DOES escape due to the lapse rate.
That’s all that additional CO_2 does. It makes the height where the Earth can lose energy in the CO_2 bands go up a bit if you increase its concentration. This means emission comes from a colder temperature. This means that less energy per unit time per unit area escapes in those wavelengths. Since the total energy lost still has to balance the net incoming sunlight, which is not substantively changed by the CO_2 increase, more has to escape in other wavelengths. Since loss is proportional to temperature in all wavelengths, the Earth heats until ins equal outs again.
It’s very simple, really. It isn’t a very profound effect. Note that doubling the concentration only increases the temperature by a couple of degrees, at most, and one has to double it again to get another couple of degrees, and double it yet again to get another couple of degrees. This is a very weak effect. We could increase CO_2 by a factor of 8 — cutting the distance between molecules at all heights in half — and only increase temperatures by 4 to 6 C if warming were only due to CO_2 with no feedbacks.
And I’m not addressing feedbacks. Maybe they augment the warming. Maybe they cancel part of it. Maybe they do both, at different times or under different circumstances or at different places. Land and ocean can be different. Spring and summer and fall and winter can be different. Arctic and equator can be different. It isn’t just CO_2 at all.
But that doesn’t alter the simple fact that yeah, all of those other things being equal, in ignorance of the possible feedbacks, we expect temperatures to go up by (say) 1.5 C per doubling of CO_2. And that very accurately reflects the observed warming since roughly 1850 as the CO_2 has increased from roughly 280 ppm to the current roughly 400 ppm, which if anything suggests that no, the other things don’t matter much, or haven’t mattered much for the last 165 years. But honestly, we don’t have a very sound basis for any such conclusion.
rgb
RGB says, “And that very accurately reflects the observed warming since roughly 1850 as the CO_2 has increased from roughly 280 ppm to the current roughly 400 ppm…”
=========================
I appreciate your time and patience. I have no issue with anything except the above. My issue is that all the old GAT graphic, cira about 1980, showed about .4 degrees drop. That has been erased from the surface record. I suspect if we get a definite negative AMO and a La Nina of strength, then potentially most of the satellite record since 1979 could become flat. At any rate the negative side of ENSO has not yet matched the very positive 1998 El Nino and positive AMO. I think when that happens then we will perhaps have a better feel for a more accurate C.S.
Do you have any idea how much of the energy in the atmosphere is from conduction from the surface vs. radiation, and bonus follow up, if the atmosphere had no GHG how would this ratio change?
Thanks as always.
I read the Armstrong paper when it came out and still have the same question(s):
How can you forecast something (future average temperature), when:
(1) You don’t understand all the causes,
(2) You don’t know 99.999% of historical data,
(3) You have not been able to forecast local temperature accurately more than one week into the future, and
(4) You have no control of many of the known variables, such as solar energy, cloudiness, cosmic rays, volcanos, etc. ?
When you add all this up, the only logical prediction of the future average temperature is:
“I don’t know, it might be warmer, it might be cooler, it might be the same … why would you care?”
Richard Greene:
Good question. We try to predict as when we are successful we gain a degree of control over the outcomes of events. Sometimes we are sucessful in doing though information needed for deductive conclusions is partially absent.
For global warming climatology the events have yet to be described. Thus, it is inappropriate to state that global warming models (including Armstrong’s and Gore’s models) “predict.” The correct term for what these models do is “project.”
If the climate models are based on the assumption that CO2 is THE “climate controller”, I’d say that assumption is wrong, so the models will be unable to predict, project, or wild guess, anything useful.
A “correct” projection would be a lucky guess.
.
Even if one could project the future average temperature, there’s always a chance the projection could be wrong, and even if the projection was correct, should people react to it?:
.
(1) There’s almost no historical data to determine a “normal” temperature (if normal even makes sense),
.
(3) No one lives in the average climate, so the number has no meaning to individuals, and
.
(3) There’s no agreement on whether people would prefer a warmer or cooler planet:
– Historical anecdotal evidence shows people strongly preferred the warmer centuries, but I think it would be safer to guess people living in cold areas would want warming, but people living in hot areas would prefer cooling — so who gets what they want?
So if humans could predict the future average temperature with accuracy, and humans knew how to change the number, it’s likely humans would not agree on how to change the number — there could be a World War Three over whether to turn up the thermostat, or turn it down, like a husband and wife arguing over whether the house is too cold or too warm.
Richard Greene:
One can judge the correctness of predictions but not projections. Predictions are correct only if the predicted probability values of the outcomes of events match the the corresponding observed relative frequency values. If there is a match the associated model is said to be “validated.”
As they make no predictions, the IPCC’s models cannot be validated. However, they can be “evaluated.” In an “evaluation,” projected global temperature values are compared to observed global temperature values by plotting them side-by-side. There are neither probability values nor relative frequency values and can be none for there are no events.
The probability values and relative frequency values that are associated with predictions but not projections provide the tie between a science and logic. By concentrating their efforts exclusively on making projections global warming climatologists have cut the tie between their field of study and logic casting it into the role of pseudoscience.
Models that make projections are scientifically and logically worthless but models of this type are the exclusive basis for governmental attempts are regulating our climate. That this is so is obscured by frequent applications of the equivocation fallacy on the part of global warming climatologists. I present my argument in the peer-reviewed article at http://wmbriggs.com/post/7923/ .
rgb @11.13…… Thank you for your patience. I have wrapped myself in a perfect thermal insulator. The thermal effect is obvious. The second layer thermal effect is not so obvious. I will now retreat and mull for awhile.
rgbatduke (July 19, 2015 at 3:20 pm) writes: “In summary, this entire thread is largely a waste of time.”
I count no fewer than 18 pearls of wisdom from RGB so far, so I would consider this thread pretty much the opposite of a waste of time. I’m definitely bookmarking this one. 🙂
I agree, not a waste of time. I pose one question: How can LWIR radiation at the TOA affect the surface? It cannot REACH the surface as it is thermalized miles above. CO2 absorbs LWIR between 13 and 17 microns, essentially capturing and thermalizing all of this radiation from the Earth’s surface, at less than 3 meters altitude. There is little if any water vapor high in the troposphere, so CO2 is the GHG preventing the atmosphere from radiating to space up there, until it thins out enough at altitude to permit LWIR to reach space. The fact that CO2 has increased in concentration, possibly due to us but possibly not, means that this happens at a higher altitude now than it did decades ago, hence colder due to the lapse rate. BUT, the atmosphere is bigger at higher altitude, hence more area to radiate. Just because there is more energy in the SYSTEM due to radiating to space at a higher altitude/lower temperature does not mean that there is more heat/energy at the SURFACE. How can CO2 re-radiating at the TOA, where it does not thermalize much as the pressure is so low, possibly heat the surface??? In other words, how does the surface know it is supposed to heat up?
I have asked this before…
Go to Willis’s “Steel Greenhouse” article, look at his two layer model, and ask yourself how the surface “knows” it’s supposed to “heat up” when the second layer is added, even though the surface doesn’t “see” the radiation from the second layer:
http://wattsupwiththat.com/2009/11/17/the-steel-greenhouse/
Willis, God love him, passed no Physics courses. If that marks me as reactionary, what can I say…
“Willis, God love him, passed no Physics courses.”
Interesting. So scientific truth is determined by what classes one passes? :-O
Well, Dr. Roy Spencer passed a few physics classes, and he agrees with Willis:
http://www.drroyspencer.com/2010/07/yes-virginia-cooler-objects-can-make-warmer-objects-even-warmer-still/
Help me understand this Nonsense. None of this data seems to make sense.
1) As I’ve pointed out countless times, the Earth has an average temperature of around 15 Degrees, the black body temperature used for all these IR charts is -18 Degree C. This is from the ACS, and it clearly shows the observed temperature to be 15, and the predicted to be -18. BTW, this following quote and graph is from the ACA, and Climate Change is a “settled science.”
http://www.acs.org/content/acs/en/climatescience/energybalance/predictedplanetarytemperatures.html
http://www.acs.org/content/acs/en/climatescience/energybalance/predictedplanetarytemperatures/_jcr_content/articleContent/image.img.jpg/1374177687088.jpg
2) Doesn’t this following quote ignore the energy that is changed in form? Plants absorb sunlight and change it into chemical energy. That energy never gets re-radiated. It can be stored as coal and oil for millions of years.
http://www.acs.org/content/acs/en/climatescience/energybalance/predictedplanetarytemperatures.html
3)
Why? Why not the observed temperature? This chart shows the absorption of the atmosphere as seen from space. I’m not sure the black body curves are correct. Note how the peaks are all behind wavenumber 666/15 microns. I don’t think that is correct.
http://www.acs.org/content/acs/en/climatescience/atmosphericwarming/_jcr_content/articleContent/columnbootstrap_1/column0/image.img.jpg/1374178157948.jpg
4)
I got criticized above for using heat instead of radiation. That is how the ACA describes it, see quote above. My question is what happens to this trapped radiation? It just doesn’t stay trapped in the atmosphere forever.My understanding of the GHG is that IR is radiated from the earth. The IR radiation will travel through the atmosphere until it hits a GHG molecule. That molecule becomes excited. The EM radiation is then converted into mechanical/kinetic energy, resulting in warming of the atmosphere. The molecule than drops out of the excited state and re-emits the EM IR radiation. BTW, read the above quote, H2O covers a lot more than just the ends, and it also overlaps much of CO2. BTW, look at the peak of the earth’s radiation. It is to the left of CO2 absorption. Why the differences?
http://theresilientearth.com/files/images/Greenhouse_Gas_Absorption-dlh.png
5) Here is a SB Curve for a black body of earth’s temperature. Clearly the peak at 10 microns doesn’t leave much IR out at 15 to be absorbed.
http://www.spectralcalc.com/blackbody_calculator/plots/guest410911159.png
6)
If the above quote is true, and all the IR at 15 microns is already absorbed and converted to heat energy, how does adding more CO2 trap more IR and create more heat? Can you absorb more than 100%? At best wouldn’t the CO2 simply lower the peak of the atmosphere it warms by capturing the IR radiation closer to earth? Once again, this “theory” doesn’t seem to make any sense.
Anyway, I think I have an actual experiment that might help shed some light on this issue, and I hope someone is a chemistry department might be able to run it.
Experiment:
1) Take an IR transparent container and fill it with 100% CO2. Shine an IR Light of peak wavelength of 15 microns through the container. Measure the temperature increase. Repeat using 200 PPM, 400 PPM, 600 PPM, 800 PPM, 1,000 PPM…7,000 PPM. Measure the temperature increase. Repeat using H2O saturated air. Measure the temperature increase.
2) Repeat the above experiment using IR of 10 Microns peak.
My bet is that you can shine 10 micron IR into 100% pure CO2 and its temperature won’t change one iota. I would love to see that demonstrated in front of Congress. I also bet that the H2O vapor filled container will absorb far more 15 micron IR than CO2, and show far greater warming.
Simply put, if this chart is accurate, there won’t be much heating due to CO2.
http://www.ar15.com/media/mediaFiles/1334/37782.GIF
BTW, the look at this chart. CO2 is blamed for the absorption out at 666 wave number.
http://wattsupwiththat.files.wordpress.com/2011/03/gw-petty-6-6.jpg?w=1050
Take a look at H2O, it is absorbing that wavelength as well, and H2O is far more abundant than 400 PPM. If the above experiment shows the H2O warming more at 15 microns than CO2, you can bet your bottom dollar this CO2 caused global warming is a hoax, and you can run experiments to demonstrate in front of congress.
http://scienceblogs.com/startswithabang/files/2011/08/molecular_absorption_spectra-739540.png
Here is a site comparing the UAH data from Jan 79 to present. Looks like pretty good agreement till after 2001. The site:
http://www.climate4you.com/GlobalTemperatures.htm#Comparing surface and sattellite temperature estimates
Click on the link labeled: Comparing surface and satellite temperature estimates
Seems like the bet would have been more meaningful if it started in 1979 and went for over 10 years.
Al Gore and Bill Nye FAIL at doing a simple CO2 experiment
http://wattsupwiththat.com/climate-fail-files/gore-and-bill-nye-fail-at-doing-a-simple-co2-experiment/
OK, I think I have an experiment that can actually settle this man made climate change nonsense, and I will use the Climate “Scientists” own data to expose them. Unlike Al Gore’s and Bill Nye’s experiment that was intended to decieve the ingnorant, this experiment will be designed to get to the truth.
Here is the much published atmospheric absorption graph. I will ignore the fact that it looks like the black body SB graphs are wrong. This is their data, and I will use it to expose this fraud.
http://wattsupwiththat.files.wordpress.com/2011/03/gw-petty-6-6.jpg?w=1050
Clearly CO2 absorbs at 666 wave number/15 microns. No one will argue with that. What the Climate Alarmists want you to ignore is that H2O also absorbs at 15 microns, as it does between 10 and 5,and 20 and 10.
http://members.casema.nl/errenwijlens/co2/h2oco2trans.gif
The experiment would be as follows:
1) Create a vaccuum in an IR tranparent container. Shine IR of peak 10 and 15 microns through it. The 10 is peak of the earth and 15 is the peak wavelength of CO2 absorption. Measure the change of the vaccuum temperature. It should be 0 Degrees.
2) Fill the IR transparent container with 70% N2, and 30% O2. Shine the IR lamp of peak 10 and 15 microns, measure the temperature change. This will be the control.
3) Gradually add CO2 in steps of 50 PPM up to 7,000 PPM. Measure the temperature. This will give a delta CO2 delta temperature graph.
4) Start again with a 70/30 mix, and add H2O just like was done with CO2. This will give a delta temperature delta H2O graph.
5) Start again with the 70/30 mix and saturate the air with H20. Gradually add CO2 like above. This will control for the H2O, and the graph created would be the marginal warming due to CO2. This part could be repeated for H2O levels of a desert, H20 Levels for the tropics, H2O levels for the arctic.
6) This experiment could then also be run at various room temperatures to measure the delta of the GHG gas effect for various temperate zones.
That experiment is so simple and common sense it could be given in front of congress to expose this fraud.The fact that climate scientists haven’t published research on such an experiment proves to me they don’t want to know the truth. They will support the crap Bill Nye and Al Gore, but they totally do a real scentific experiment that relies of differential calculus.
Facts are this experiment is already being run by nature. The coastal Antarctica is relatively warm, temperatures drop rapidly as you go inland. The reason being, as you go inland, the H2O precipitates out leaving very cold dry air, void of any H20. Plenty of CO2, but no H2O. Temperature follows H2O, not CO2. We already know this, well, we all except the Climate “Scientists” know this.
Funny how Climate “Scientists” can’t put 2 and 2 together. They simply can’t see the forest through the trees.
http://www.climatestotravel.com/Climate/Antarctica
http://www.climatestotravel.com/images/antarctica-precipitation.gif
“OK, I think I have an experiment that can actually settle this man made climate change nonsense, and I will use the Climate “Scientists” own data to expose them.”
Congratulations. You’ve just “exposed” the concept that CO2-induced warming should be most effective at higher latitudes, at night, and in the winter, which is–surprise!–exactly what those evil scientists on both sides of the CAGW issue have been saying all along.
Well done, sir, well done. For your next feat, perhaps you could “expose” an even more heinous conspiracy, perhaps the government cover-up of actual manned moon landings! 🙂
BTW, this image is a death sentence for CO2 caused warming. It clearly shows CO2 transparent at 10 microns, whereas H20 is absorbing 30%, but the key is that absorption by H20 INCREASES as the earth warms, and absorbs 50% at 9 microns and 100% at 8 microns. CO2 is transparent to the warmer temperatures. Clearly the climate “scientists” don’t understand the meaning of this chart.
H2O and CO2 fully absorb at 15 Microns, but CO2’s absorption rapidly decreases as you warm from 15 to 10 microns, and CO2 is transparent lower than 13 microns. Between the entire range of 15 to 8, H2O never absorbs less than 30%. This graph alone proves to me that this CO2 caused climate change is a pure hoax, either based upon a scientific ignorance of biblical proportions, or a deliberate fraud.
http://members.casema.nl/errenwijlens/co2/h2oco2trans.gif
Probably a waste of time, but you are doing it again. One doesn’t “warm from 15 to 10 microns”. This is a completely meaningless statement. Microns measure length, not temperature, and in context a sharp wavelength. One might, conceivably, talk about shifting the wavelength peak of the rather wide blackbody radiation curve by some length.

 K-m. To “warm from 15 to 10 microns” even if you are just talking about the shifting of the peak in a wide distribution that has plenty of integrated power in the wings one has to increase the absolute temperature by 50%. That is, you are talking about warming the surface from 288 K (average) to 288+144 = 432 C.
Look, for starters you need to learn about blackbody radiation in general, and in the context of your current nonsense, Wien’s Displacement Law:
https://en.wikipedia.org/wiki/Black-body_radiation#Wien.27s_displacement_law
To wit:
with
If you aren’t talking about shifting the peak via Wien’s Law, you aren’t talking about anything, because the Planck curve for thermal radiation from the Earth’s surface, as you show in numerous pictures above, easily runs from 1 to 50 microns. It already peaks in the ballpark of 10, but it has plenty of weight at 15 and 5 and shifting the peak by the tiny bit associated with a whole degree or even two of global warming won’t even make it worthwhile to draw new generic graphs.
Again, I urge you to stop your rants as the terminology you use in the is proof beyond any reasonable doubt that you need to go back and spend a LONG time at the wikipedia blackboard, invest in a copy of Petty for your Very Own, maybe buy a few books on introductory physics and work through the thermo sections and the electromagnetic radiation sections, you know, sort of learn some physics so that you can stop referring to lengths as if they are temperatures at an unbelievably absurd scale. You’d get laughed out of any physics department where you tried to explain this “theory” of No Greenhouse Warming because of some sort of shift in the BB spectrum.
Some of your ideas aren’t wrong, because you are, after all, pulling them off of perfectly good graphs that demonstrate the greenhouse effect overwhelmingly to anyone with the eyes to see it. Water is absolutely the most important greenhouse gas and everybody knows it and nobody denies it. That doesn’t mean CO_2 isn’t the second most important one, and it in no way proves that it isn’t still important enough to cause warming if you double its concentration. Indeed, the warmist camp claims that the CO_2-only warming is likely to be doubled or tripled by the strong positive feedback from still more powerful water vapor. Do you agree with this, because it sure sounds like you do! The thing about water, of course, is “it’s complicated”. Water in the form of clouds strongly cools during the day and can warm or cool at night. Water vapor is a greenhouse gas and pretty much warms. Water vapor also contains latent heat that lifts heat through the troposphere to warm the upper troposphere. This (by the very argument I give below) increases greenhouse-band outgoing radiation by raising the temperature at which it occurs, which in turn drops the surface temperature. All of this makes it difficult even to predict the sign of the total feedback to add or subtract from CO_2-only warming — it could alter it by a factor anywhere from 0.5 to 2 or even 3, although honestly I think the data already soundly contradicts even a factor of 2 at this point. A factor of one — basically no feedback — seems rather likely, actually.
Finally, remember that what matters it the double integral of the curves like the top of atmosphere curves, looking down that you insert above. They have to be integrated over all wavelengths or wave numbers, and they have to be integrated over all the surface area of the Earth (where the function being integrated changes constantly with latitude, longitude, temperature, cloudiness, time of day, etc, etc) and to be picky, one has to integrate over time as well to average out emissions. So you can’t argue that some bite out of the 300 K curve corresponding to surface radiation doesn’t matter because it happens at 15 microns instead of 10 or whatever — any bite implies less outgoing radiation from that part of the surface than one would get without it. Since it is the integral of this curve that has to be an approximate constant equal to incoming radiation similarly integrated, making any part of it lower forces the rest to become higher, and the only thing that raises the basic curve is raising the emission temperature of the surface.
rgb
BTW, the energy of IR 10 microns and shorter is much much much higher than the 18 to 13 microns CO2 Absorbs. H2O simply absorbs much much much more energy than CO2. Do the math.
http://www.1728.org/freq2.gif
http://chemwiki.ucdavis.edu/@api/deki/files/38305/BPOCchapter9-3-61.png?size=bestfit&width=500&height=328&revision=1
http://www2.chemistry.msu.edu/faculty/reusch/VirtTxtJml/Spectrpy/Images/emspec.gif
http://www.raysofhealinglight.com/images_ap/em_spectrum.jpg
What that means is that if I am correct in that the peak of the Black Body of 15 Degree C is at 10 microns, then this chart should have the black bodies shifted to the right, reducing the energy absorbed by CO2 and greatly increasing the energy absorbed by H2O. Once again, all signs point to H2O, not CO2.
http://wattsupwiththat.files.wordpress.com/2011/03/gw-petty-6-6.jpg?w=1050
Again, please, you are making my head hurt. It isn’t the energy of the individual photons that matters. It is the total power. And arguing that there are multiple greenhouse gases and that water is more important than CO_2 is preaching to people that know and understand this already much better than you do and doesn’t mean that CO_2 is not still important and that increasing it doesn’t still cause warming.
Try to read the wikipedia article on blackbody radiation, and learn what the power curve actually is and what it means and how to use it. Please? Do you want people to actively make fun of you when you ask them to do the math?
rgb
“doesn’t leave much IR out at 15 to be absorbed.”
Still a substantial fraction. Planck explains it, the Peak of Infrared, as well as all other, radiation, corresponds well to a certain temperature, but by no means All of the radiation from matter at a certain temperature, as the Planck distribution is always present.
Still, no one has answered my question, and I am thinking, 3 meters is 1 meter above the 2 meter mountings of almost all thermometers. Surface radiation is almost entirely absorbed just above the thermometers. At miles up, CO2 absorbs quite a bit of radiation as the temperature is more to its liking, and does not thermalize due to the lower temperature, instead re-radiating, half of which points down. But, this fraction can NEVER reach the surface as it is thermalized miles above.
Seriously, you big brains, how do TOA radiating gases, which are at around -70 to -80 Degrees Celsius and miles up, heat the surface? Thermalization, anyone? Bueller? Anyone???
I am coming to the conclusion that they do not…
“Still, no one has answered my question…”
Actually I did, or rather, Willis Eschenbach did some time ago. [shrug] You can lead a horse to water…
Actually no one ever has.
Again, Willis did, but Michael didn’t like the answer, although he failed to specify what exactly was wrong with it. There’s nothing shameful about ignorance, but willful ignorance is something else entirely.
And I did as well, two or three times, above in this thread. Not that it matters, As you say, you can lay it out but you can’t make them understand it if they don’t want to.
rgb
OK, back from class, bored, I’ll give you an answer directly.
a) Earth is heated primarily with the visible and near UV and IR band of ~6000 C blackbody radiation from the face of the sun. The cloud-free atmosphere is substantially transparent to this energy, transmitting maybe 2/3 to 3/4 of it to where it is absorbed by the surface. That which isn’t transmitted is predominantly REFLECTED by high albedo clouds, snowpack, and to a lesser extent land and water surface.
b) All of the heat it absorbs (as opposed to reflects without first “thermalizing” it in some inelastic degree of freedom(s)) must, on average, be lost as outgoing thermal radiation when the planet is in (approximate) dynamical equilibrium. If it absorbs more than it emits, it warms and output thermal radiation increases until ins balance outs. If it emits more than it absorbs, it cools until again, ins balance outs. The time required to achieve balance is not simple or necessarily small as the Earth is complex and stores and moves energy around in many places and ways.
c) Although it is vastly oversimplified, we can consider the outgoing thermal radiation to come from two sources:
d) One is direct outgoing thermal (250-320 K, average ballpark 288 K) radiation from the ground, that is not absorbed by the atmosphere and once emitted goes straight out to space. This outgoing radiation is emitted at integrated rates that are roughly proportional to the fourth power of the temperature of the surface in degrees kelvin or absolute.
e) The other is the outgoing thermal radiation from the surface that was almost instantly absorbed (within a few meters of the ground) by various greenhouse gases in the atmosphere, predominantly water and carbon dioxide but with additional, relatively insignificant fractions absorbed by ozone and argon and methane and so on. This energy is almost instantly shared with the surrounding N2 and O2 atmosphere. As always, if this atmosphere is not in thermal equilibrium with the ground temperature, it absorbs more than it re-emits or otherwise conveys both back to the ground or upward if it is too cool, absorbs less than it emits if it is too warm. Note well — some fraction is indeed returned to the ground, but the argument doesn’t really depend on this per se. Note that over 2/3 of the thermal radiation emitted by the ground is absorbed by the greenhouse gases, the opposite fraction to that which the atmosphere transmitted in the visible/6000 K band.
f) Eventually through many processes, heat is conveyed up through the atmosphere to where it finally becomes transparent to radiation emitted at its lapsed temperature. This temperature is, as you have so cleverly noted, much cooler than the ground. It therefore gives off less integrated energy per square meter in the absorption/emission bands of the greenhouse gases in these bands and doesn’t radiate at all in the bands where it is transparent (Kirchoff’s Law).
g) I reiterate — the total outgoing thermal radiation rate (power), integrated over all wavelengths and all the surface area of the Earth, must on average equal the total incoming thermal radiation rate (power) integrated over all wavelengths and all of the surface area of the Earth, and any imbalance causes heating or cooling until ins equal outs. That is specifically the sum of the outgoing thermal radiation from the surface that was not absorbed by GHGs plus the thermal radiation from the upper troposphere that is emitted by GHGs has to balance the total incoming power.
h) And here it is — the bone simple punch line. Anything that decreases the emission rate from GHGs in the upper troposphere must cause the surface to warm until emissions from the surface compensate, assuming constant input. Really. That’s all there is to it. The only question then is:
i) Does increasing the GHG concentration of the atmosphere on average, all things being equal, raise the emission height in the troposphere? The answer is almost certainly yes. Increasing the concentration of e.g. CO_2 reduces the mean free path of photons in its emission/absorption bands, and one has to go higher, to lower absolute pressures and atmospheric density, to reach the point where the mean free path for upward directed photons reaches infinity. Higher is higher up in the ALR, and colder. Colder means less integrated emissions. End of story
j) Of course one can say “Wait a minute, it absorbed LOTS of thermal energy in the CO_2 band down where it is warm, but only gives off a comparatively LITTLE up at 6 to 9 km. What happened to the difference?” You won’t like the answer, of course. It was returned to the surface by IR radiation from the greenhouse gases that are in rough thermal equilibrium with the surface temperature down at the surface. The net heat transfer to CO_2 at the surface in this (oversimplified) picture is equal to the rate energy is eventually lost to space at the top. All the rest eventually makes it back to the surface. But we already took that into account in the argument above by noting that it radiates so and so much energy, and thus and such of a fraction escapes directly and the rest is absorbed. The energy that escapes directly plus the energy that escapes from the GHG bands is what has to balance incoming absorbed solar — all of the backradiation bookkeeping is already implicit in this simple statement as it relies on the absolute loss rate, not the details of what happens to the energy in between. The latter simply doesn’t matter. Ins must balance outs, and the only way for energy to escape the earth (outside of a tiny loss to outgassing) is in the form of photons, electromagnetic radiation.
To conclude, all that matters is the spectra from Petty’s book that were reproduced above. Any physicist that sees those figures goes “yup, the GHE is real” because one can very clearly see emission from the warm ground more or less at the predicted blackbody intensities as a function of wavelength according to the temperature of the ground where the atmosphere is transparent, plus greatly reduced intensities that still follow blackbody curves, but ones corresponding to the much colder temperatures of the atmospheric height where it became transparent to the GHG absorption/emission band radiation. The fact that Petty also publishes bottom of the atmosphere spectrographs at the same locations/times looking up and observes the complementary pattern in the downwelling radiation representing the missing ground thermal radiation in the absorption bands is just icing on the cake.
So it is quite simple. Here’s your reading comprehension test. If one increases CO_2 concentration, will the effective temperature of the top of atmosphere outgoing radiation spectra in the CO_2 absorption band most likely:
i) increase
ii) decrease
iii) remain the same?
For bonus points, indicate why.
rgb
P.S. — by concentrating only on outgoing integrated power, one also trumps all questions of lateral and vertical heat transport. So I don’t care that there is latent heat transport vertically, or that heat absorbed at the equator might be lost near the poles, and only care a little bit about energy being stored in the vast heat capacity of the deep ocean, as this is a sign of disequilibration, but one that might take thousands to tens of thousands of years to have any noticable effect. It is the Earth viewed as a black(body) box that matters. Integrated, averaged, input solar power has to be compared to integrated averaged, output radiation. Truthfully all the way to raw TOA incident radiation and including all reflected energy from albedo. There isn’t the slightest doubt what the first order effect of increasing CO_2 should be. Sure, it could be (nearly) cancelled by nonlinear stuff — increasing albedo from increased cloud cover from increased water vapor from the increased temperature — feedbacks could be negative. Or positive. Or mixed, to some smaller net negative or net positive point. And whatever warming survives (or is augmented by) the feedbacks could still be overwhelmed by natural variations. I’m just explaining that the greenhouse effect is real, that increasing CO_2 almost certainly all-things-equal will raise average temperature, and yeah, pointing out that fairly reliable first principles line-by-line computations of the radiation physics suggest a warming per doubling ignoring all feedbacks of ballpark 1 to 2 C (with some slop due to the fact that we have to solve the quantum problem approximately and the fact that the Earth’s dynamical atmospheric state is not homogeneous or constant).
I truly do hope this helps. IMO the entire discussion and skeptical argument on WUWT is significantly improved (and more likely to be taken seriously) when it isn’t laced every ten comments with a comment that goes on about how increasing the concentration of a “trace gas” by 1/3 can’t possibly warm the planet by 0.4 to 0.8C. Yes, it can. It probably has. Increasing it more will probably warm it more. That doesn’t mean that we are due for a climate catastrophe. It doesn’t mean we can predict how much it will warm, or even if it will warm because we do not have any good way to separate out natural variability from CO_2 driven change either empirically or theoretically so our best attempts to assess past data are fraught with uncertainty (as is the past data itself from more than maybe 50 years ago if not even less). The actual physical models for the climate that try to use more detailed treatment of the physics are IMO both a complete waste of time and horribly biased (and diverging from observation as a double consequence). The skeptical argument is not ended by admitting that the greenhouse effect is real — it is made into something to take much more seriously. Even though the greenhouse effect is real, there is little to no evidence that we are headed toward a climate catastrophe!
Even though it is real, so far the changes it has caused have been overwhelmingly beneficial. One billion people ate dinner tonight courtesy of the extra CO_2 and its effect on agricultural plant growth. The world enjoys a very slightly longer, substantially more fruitful growing season pole to pole thanks to the almost unresolvably small warming observed over the last 165 years thanks to the extra CO_2. To be honest, no other climate changes are really resolvable in the data. Drought and flood, storm and nice weather, high and low pressure, heat wave and killing frost — all of this has changed so little that it is not resolvable from no change at all (if it HAS changed at all). Should we fear an extra 2.8 C globally? This corresponds to moving every growing subzone one notch north, so central virginia gets north carolina’s current growing conditions, and west virginia and pennsylvania get virginia’s over a roughly 100 year time span! Who cares?
That doesn’t mean that there are no risks, or that we should not be concerned. It’s just that the risks have to be pretty damned enormous to be even vaguely comparable to the benefits we already enjoy and might expect to enjoy even more should warming continue. Florida might not be plagued by frosts that wipe out the orange crop any more. Texas might not be so darned cold in the winter. England can grow wine grapes once again. Siberia might become even more productive and less deadly in the winter. Sea level rise might eventually be a concern, sure, but empirically it is completely ignorable so far and there is little good reason to think it is going to suddenly accelerate (none at all in the actual data).
And sooner or later, we will get fusion, or get off of our duffs and perfect LFTR, or drop the price per watt of solar power to $0.25 installed, or invent a cheap high density high capacity storage battery, and presto-chango, the miracle of modern capitalism and the pursuit of mere self-interest will guarantee that burning coal to make power is obsolete, almost certainly long before 2050. And then how silly will people feel, for wasting trillions of dollars and hundreds of millions of human lives and condemning billions of the poor to a life of continuing 19th century energy poverty in what should be the energy rich 21st century all because of the deliberate manipulation of the energy market using the specter or a global catastrophe that was never going to happen anyway twice over.
rgb
I have mulled. It does matter. I understand the analysis.
Super. I hereby declare you a Good Student. Now if I could only get a few others on the list to become Good Students…;-)
THANK you. Plenty good for someone who had forgotten he had once known Avrogodros (?) number.
OK, after further thought, this chart is a great example of just how pathetic the field of Climate “Science” truly is. This is what they use as their main piece of evidence.
http://wattsupwiththat.files.wordpress.com/2011/03/gw-petty-6-6.jpg?w=1050
Take a close look at that chart, it gives real scientists a way to debunk this CO2 nonsense. Here is the experiment that is needed.
1) That chart represents a snapshot of the earth for outer space. Look at what it is showing however. It shows that some of the the IR wavelengths that are absorbed by H2O don’t make it back to outer space.That is understandable given that 3/4 of the earth is covered in H2O, the atmosphere can have up to 4% H2O, and clouds also absorb and reflect the IR. My bet is that if you take an IR transparent container, fill it with H2O saturated 70/30 mix of N2/O2 with 0% CO2, shine IR of peak wavelength 10 and you get that exact chart. That chart reflects H2O absorbing IR at 15 Microns and below 8 microns.
2) Was that shapshot taken over the equator, the warm oceans? Where was that snapshot taken? My bet is if that snapshot is taken over an inland desert with extremely dry air you will get a snapshot with less absorption around 15 microns.
3) Was that snapshot taken over the S Pole? My bet is that if it was you will see much less absorption around 15 Microns.
4) Was that snapshot taken over an equatorial rain forest with dense clouds? My bet if it was there would be much more absorption near 15 Microns.
5) Facts are if the Climate “scientists” truly wanted to understand the climate they would show a whole series of graphs that control for H20. That is how a real science is done.
This chart clearly shows CO2 AND H2O absorbing 100% of the IR at 15 microns, H2O also absorbs down to 10 Microns. Why is there an absorption range for CO2 at 18 to 13, but not for H2O between 15 and 10? Why doesn’t H20 show the same absorption?
http://scienceblogs.com/startswithabang/files/2011/08/molecular_absorption_spectra-739540.png
As I said in an earlier post the climate “scientists” didn’t seem to use the proper black body curve on their chart. They deliberately misaligned them to make it look like the peak was over 15 microns. Well apparently someone didn’t get the memo and actually published a correct chart. Clearly the peak of the black body curves lay right on the 10 Microns of earth. CO2 is clearly trapping heat in the relatively cold tail of the distribution and H2O is trapping the high energy shorter wavelength IR in the left tail. Funny you can publish two wildly different charts in this “settled” science. No one seems to be concerned with the error and inconsistencies.
http://rammb.cira.colostate.edu/training/tutorials/goes_39um/images/irbnds1a.gif
Bingo!!! Look what I found. Take a look at this chart, it totally contradicts the chart I’ve been discussing, and they apparently did the experiment to control for H2O. As predicted the the cold dry air over Alaska shows an atmospheric window at 15 microns, unlike the other chart that you have no idea where it represents. Then tropics show far more radiation being absorbed. This is exactly how the climate “science” perpetrates their fraud. They simply produce inaccurate and misleading charts that simply don’t correlate with reality. This chart is game over for the CO2 driven climate change, and it totally debunks the other chart climate alarmists use as evidence. Once gain, look how there is an atmospheric window at 15 microns over Alaska as predicted above. Also look at the tropics, there is still an atmospheric window at 15 microns. That totally rules out CO2.
Ooops, that previous chart is from the earth looking up, not space looking down. It does however show that the graph from space would look wildly different depending on the location. Once again, CO2 in uniform, so CO2 can’t be causing the change.
Here is another chart challenging the CO2 as the cause theory. Bottom line, the chart the climate alarmists use doesn’t seem to be the only chart that can be used to argue the case, and its curves SB Graphs are almost certainly wrong.
http://www.nzdl.org/gsdl/collect/hdl/index/assoc/HASHedcc.dir/p143a.gif
This chart totally debunks CO2 as the cause of warming.Note: This graph is the inverse of the space snapshot, it is from earth looking up. ?w=700
1) Alaska shows an atmospheric window at 10 microns, the tropic region doesn’t. How could that be due to CO2? It can’t. Both the tropics and Alaska have 400 PPM.
2) The tropics absorb much much more energy than Alaska. That is almost certainly due to H2O.
3) The dry air in Alaska shows a blip for the CO2 absorption, but that it dwarfed by the absorption to the left of 15 microns by H2O in the tropics.
Bottom line, I challenge any climate “science” alarmist to explain how CO2 can cause the difference between these charts. If you can’t, you are admitting you are promoting a fraud if you continue to promote CO2 as the main driver.
“…you are promoting a fraud if you continue to promote CO2 as the main driver.”
[yawn] One of our alarmist blogger friends has already debunked this straw man by quoting a number of texts that say just what co2islife has re-rediscovered:
http://scienceofdoom.com/2011/02/24/water-vapor-vs-co2-as-a-greenhouse-gas/
See also RGB above.
Co2islife’s quarrel isn’t with scientists, but rather with politicians, Gaia worshippers, tree-huggers, etc.
So let’s hope he gets back to us when he’s “discovered” something a little more original, like the color of the sky or something.
These 3 charts should be enough to put 97% of consensus scientists behind bars. ?w=700
 ?w=700
This chart used by climate alarmists clearly has the SB Graphs and peaks wrong, at least according to SB Calculations from Spectral Calc, and the one size fits all absorptions clearly are not representative of observations. This chart must have been made from a model, or cherry picked to make a case. It is just too smooth to pass the stink test. Anyway, this chart is used all over the place to promote this fraud.
http://wattsupwiththat.files.wordpress.com/2011/03/gw-petty-6-6.jpg?w=1050
This is reality. This is an actual spectrograph. Yes it is the inverse of the above, but it clearly shows that there are large differences depending on where and when these spectrograph snapshots are taken. How can you reconcile this chart with the chart above? You can’t. There needs to be a congressional investigation into why a non-representational chart is being used to support the conclusions of the climate alarmists.
Results like this that have wasted trillions of tax payers’ dollars and destroyed countless lives and companies should have all these “consensus” scientists behind bars.
Lastly, this chart showing a differential between the N and S Hemisphere pretty much proves CO2 can’t be causing the difference given that it is a constant, and the above chart of Alaska and the Tropics proves that something other than CO2 is absorbing radiation in the atmosphere.
http://www.cru.uea.ac.uk/cru/data/temperature/HadCRUT4.png
The ACS even publishes that the models don’t reflect reality.
http://www.acs.org/content/acs/en/climatescience/energybalance/predictedplanetarytemperatures/_jcr_content/articleContent/image.img.jpg/1374177687088.jpg
These “scientists” simply need to be behind bars for defrauding the public and looting the public treasury. With evidence like the above charts I have to believe it is only a matter of time.
Jeeze, co2, lighten up. First of all, if you are going to use the graphs from Petty’s book, buy the damn book and read it already so that you know what you are looking at. Obviously you are just making stuff up as you go along because you don’t even know what you are looking at or bothering to read the captions. Putting up a bunch of graphs and charts isn’t anything like proof, not that you have asserted anything definite but that you want to go on a witch hunt for “scientists”, defined to be anybody that disagrees with you as far as I can tell.
You can start with me, since I disagree with you and think that your entire argument is nonsense — literally, I can’t make head or tails of most of it except that you seem quite angry all of the time and resent it in the extreme if anyone suggests that increasing CO_2 might cause actual warming of the planet (which is unfortunate since there is overwhelming evidence that it has in the past done so, is doing so in the present, and will do so in the future as well as a perfectly understandable and computable physical argument for the “direct” warming that one expects in decent agreement with observation so far). I think it is reasonable. So according to you, I need to be behind bars “for defrauding the public and looting the public treasury”.
Of course, I’m just a physicist, not a “climate scientist”, and haven’t received a single thin dime, ever, from my “defrauding the public”, and all I do every year is dump a rather large percentage of my income into the public treasury, I don’t take much out at all. I’m not breaking any law when I disagree with you; I’m exercising my constitutional right to free speech. If we judge which of us is more likely to have a well-informed opinion on the subject, do you really think you would win? If you were a prosecuting attorney trying to prove “fraud” — which I think is absurd in my case and probably in most others as well — do you really think that one single one of your misinterpreted graphs above would count as evidence? Expert witnesses — ones with PhDs — would rip them to shreds, since they obviously prove the exact opposite of what you claim, as I’ve now explained, patiently, to you what, two or three times now? You just skip down a bit further and put up the same figures and completely ignore what I’ve said and rant some more.
This is, sadly, typical dragonslayer activity. Mathematical incompetence. Scientific incompetence. But very, very loud rants, asserting all kinds of things that really demonstrate nothing but the ignorance of the speaker.
In any event, Grant Petty (whose book you are abusing in spite of not having read it or understood ten words in it) doesn’t deserve to go to jail either. Most of the scientists in the world — including most climate scientists — are honest people and really believe what they are saying. They may be wrong. They may well be overzealous. They may allow their opinion or beliefs to cloud their judgment or avoid complete scientific honesty in their assertions of proof or evidence. They may or may not be perfect scientists, or even very good scientists, but that doesn’t make them criminal scientists. And even the best scientist in the world, provided with the best existing evidence, can be wrong! It’s the name of the game.
Perhaps — and I say perhaps — there are some scientists who have departed from the path of objectivity and dipped into politics to the extent of falsifying data, hiding contrary results, exaggerating negative and downplaying the positive all to convince the public and/or politicians to select a particular political path. If so, there should probably be consequences, just as there were quite recently when a Duke medical center doc was caught out falsifying data to make a particular treatment look far better than it actually was. But putting them in jail for arriving at the wrong conclusion in good faith? Good God, man, if you did that you’d have no scientists at all in a decade. Why do you think we have things like the tenure system, a constitution that protects free speech and free thought, freedom from the kind of religious thinking your proposed witch-hunt exposes? Leave them the freedom to be wrong, even to be gloriously, badly, horribly, unfortunately wrong — as long as it is in good faith. For most people in environmental science, it is.
Just remember. It could be you that is horribly wrong. It could be me. We could be headed to a true climate catastrophe. Do you want to wake up some day in ten years with people banging down your door armed with pitchforks and torches because you publicly stated an opinion that sadly was horribly wrong, in good faith?
Save the pitchforks and torches for those that did not act in good faith. For those that falsified data, or “corrected” the data so many times that the correction was almost equal to the supposed effect. Save it for those that didn’t just make a living, but who got rich “selling” and idea that they knew perfectly well was wrong. Even save it for those that just made stuff up — made claims for “high confidence” or “medium confidence” or whatever in documents intended to sway public opinion when they hadn’t the slightest basis for making any such claim of “confidence” from the theory of statistics applied to the matter at hand, so that they were cloaking their own personal opinion in the language of science to deliberately deceive those who could not possibly know better.
In the meantime, whether or not you like it, CO_2 almost certainly acts as a greenhouse gas, is at least partly responsible for the existing average temperature the planet holds itself at, and is likely to cause that average temperature to rise if it doubles. Exactly how much the rise will be is open to considerable debate by well educated humans of good will because it is a hard problem. In my opinion, unsolvably difficult. Any answer no matter how well-founded or well intentioned can turn out to be radically wrong in fairly short order. That’s what science is all about — trying to boldly go and solve what has never been solved before, to explain what hasn’t been explained before, to discover the undiscovered. It’s a risk. Your best efforts can be wrong (and often are!).
But that, my friend, is not any sort of offense in the eyes of the law, and if you want to continue to reap the many benefits of the 10% or so of all ideas that survive the process of testing and analysis and end up as new knowledge, you will work to keep it that way instead of calling for jail for anybody who disagrees with you.
rgb
1) Why should 400PPM CO2 impact the higher latitudes more than the lower?
2) I agree on the Night one, care to provide the evidence that nights are warming relative to daytime? Is there evidence that we are actually narrowing the spread between day and night highs, low and average temps?
3) Have we been warming more in winter than summer? The S Pole has shown no warming in 50 Years.
Anyway here is just more evidence CO2 caused warming is a hoax and H2O is the true cause:
This is the American Standard Atmosphere for H2O concentration. Note gradually decreases all the way up to 10 Kilometers, or the upper troposphere. Note there is 0% H20 above 10 Kilometers.
http://www.spectralcalc.com/atmosphere_browser/plots/guest449540015.png
Note, this is CO2. It is CONSTANT all the way up to 80 Kilometers to the mesopause.
http://www.spectralcalc.com/atmosphere_browser/plots/guest1358869773.png
Care to guess which one temperature follows? CO2 or H2O? You got it, temperature follows H2O almost exactly. Note how temperature follows H2O up to 10 K, then it warms, and then between 50 and 80 K, with 400 PPM CO2 it cools. Imagine that. Atmospheric CO2 can cool, warm, and then cool again all with 400PPM. Basically CO2 does not correlate with temperatures, H2O does.
http://www.spectralcalc.com/atmosphere_browser/plots/guest1362795219.png
To address some of the comments above. Hot objects certainly do emit far far far more energy and shorter wavelength/higher frequency does contain far far far more energy. Just look at the relative energy output of the hot sun relative to the cold earth.
http://scienceofdoom.files.wordpress.com/2009/11/blackbody_curve-sun-earth.jpg
Note how the SB curve for 15 degree C peaks over 6.
http://www.spectralcalc.com/blackbody_calculator/plots/guest261968604.png
Note how the SB curve for -80 degree C, the peak of CO2 peaks at under 0.8. There is a whole lot more energy emitted from a body 15 degree C than -80 degree C.
http://www.spectralcalc.com/blackbody_calculator/plots/guest2074396910.png
CO2 would have the biggest impact on the colder climates, but at the colder climates there is simply less energy to absorb.
This chart shows that regardless of the latitude or season, the impact of CO2 is constant. The 15 micron absorption band remains unchanged. It is the other parts to the spectrum that change with latitude and season. Once again, where is the change in CO2 impact to change the temperature? CO2 is constant.
http://www.earthzine.org/wp-content/uploads/2013/12/6.1.jpg
This image clearly shows how CO2 can dramatically alter the radiance of the earth.CO2 isn’t changing the chart, H2O and clouds are.
http://www.mathstat.dal.ca/~folkins/Cloud-LWspectrum.jpg
My my my, H2O determines how much radiation reaches earth. CO2 doesn’t play a roll.
http://www.powerfromthesun.net/Book/chapter02/Image52.jpg
H2O can alter the temperature more in 3 days than CO2 is blamed for having changed it in over 100 years. What a joke.
http://www.greenmedinfo.com/blog/artificial-weather-revealed-post-9-11-flight-groundings
From this chart it is clear the impact of CO2 is constant. It is the other parts of the graph that change. Only in climate “science” can a constant be blamed for a change. Once again, the only part of this chart that changes is the part impacted by H2O and other GHGs. CO2 has a constant absorption.
https://directory.eoportal.org/image/image_gallery?img_id=217998&t=1339757099534
How can anyone look at this data and conclude that CO2 is the cause? H20 is clearly the cause of any variation. CO2 is a constant.
http://www.scielo.br/img/revistas/rbg/v21n1/a05fig03.gif
OK, I’ve finally found a chart to make my point. The chart most frequently used by climate alarmists is the “theoretical” chart on this graph. You can see that except for the O3 absorption at 10 microns the theoretical does come close to a black body of 288 Degree K under ideal conditions of clear skys and warm tropics. That however most likely represented one awfully cold night, and does not represent an average day. Note how the graph cuts off at 25 microns. Clearly CO2 absorbs an estimated 12% of the radiation causing that dip at 15 microns. The key point is that this chart represents CO2 absorption at its maximum impact, with minimal interference of other GHGs. The other key point is that this is taken from a satellite looking down. It is cherry picked data to highlight the impact of CO2.
http://www.john-daly.com/kunde74.gif
Here is the realty. The absorption per atmospheric layer is highly variable, and other GHGs pay a much much much more significant role at the earth’s surface where all the ground measurement equipment is. Note CO2 is constant, but all other GHGs absorb significant amounts near the earth’s surface.
http://www.hashemifamily.com/Kevan/Climate/Earth_Atmosphere.gif
More importantly, crystal clear skys don’t result in warming, those are the extremely cold nights when all the heat slips off into outer space. This chart shows that clouds and H2O can make CO2 absorption immaterial. Clouds can reduce the radiance of the earth from 288 K all the way down to 220 K, Now that he absorbing heat.
http://www.scielo.br/img/revistas/rbg/v21n1/a05fig03.gif
Same thing shown here.
http://www.mathstat.dal.ca/~folkins/Cloud-LWspectrum.jpg
This chart demonstrates that even at 8x the CO2 concentration of today the absorption of CO2 is basically constant. In other words CO2 is saturated at current levels. CO2 also only plays a major role during ereally cold nights when there are no clouds. CO2’s role is to prevent run away cooling, not to cause run away heating. CO2 is a safety valve that prevent the earth from freezing over nights with no clouds. It is a back up plan, redundant system to prevent an accident. It is not the lead system.
http://1.bp.blogspot.com/_nOY5jaKJXHM/TJe36s1JB0I/AAAAAAAABTE/kgD4VUKlyu0/s1600/Fullscreen+capture+9202010+123527+PM.jpg
Now the real story on why the N Hemi has been warming.
“Greenland ice cores show industrial record of acid rain, success of U.S. Clean Air Act”
http://www.washington.edu/news/2014/04/11/greenland-ice-cores-show-industrial-record-of-acid-rain-success-of-u-s-clean-air-act/
Note, how the N Hemi took a sharp turn upward about 1970. A real scientist would ask, “what changed in 1970?” You got it, the clean air act.
http://www.cru.uea.ac.uk/cru/data/temperature/HadCRUT4.png
We cleaned up the air so more irradiation reached the earth. Now, China started polluting again in about 1995, and we get a temperature stand still. It has nothing to do with CO2, China produces a whole lot of CO2. It has to do with the particulate matter identified in the ice cores. Imagine that, the Clean Air Act is causing global warming.
Lastly, if cleaning the air increased temperatures post 1970, the dirty air prior to 1970 would have been cooling the atmosphere. That means the real slope of temperature increase over the last 100 years would be lower, and we shouldn’t be adjusting downward historical temperature records, they should be increasing the temperatures pre-1970.
Re: Terry Oldberg 7/22/15 @ 1:00 pm
One can judge the correctness of predictions but not projections. Predictions are correct only if the predicted probability values of the outcomes of events match the corresponding observed relative frequency values. If there is a match the associated model is said to be “validated.”
Not so. Even IPCC managed to get this right in one place:
Science … advances through formulating hypotheses clearly and testing them objectively. … It is not the belief or opinion of the scientists that is important, but rather the results of this testing. … [¶] Scientific theories are … evaluated by comparison with physical reality. Each successful prediction adds to the weight of evidence supporting the theory, and any unsuccessful prediction demonstrates that the underlying theory is imperfect and requires improvement or abandonment. AR4, ¶1.2 The Nature of Earth Science, p. 95.
Models that predict probability distributions exist, but they are rare and usually statistical rather than scientific. In Modern Science, scientific models map facts onto facts, though the each prediction needs to have a probability distribution in order to decide whether new facts fit the prediction. In Post Modern Science, e.g., AGW climatology, models are subjectively valid (peer-review, publication, consensus); they don’t have to do anything objectively.
Terry Oldberg said,
As they make no predictions, the IPCC’s models cannot be validated.
IPCC’s models make lots and lots of predictions. When painted in a corner, IPCC weasel-words some of its predictions as projections. Another evasion by the Panel is that it predicts climate a full century. That way its work can’t be checked in our lifetimes. But not to worry; IPCC adds that man is at the tipping point so that climatologists will have no wait for their money, recognition, and power. Meanwhile, its models predict other things, none more important than equilibrium climate sensitivity:
The response of cloud cover to increasing greenhouse gases currently represents the largest uncertainty in model predictions of climate sensitivity (see Chapter 8). AR4, ¶3.4.3 Clouds, p. 275.
That prediction failed, invalidating the radiative forcing climate models. That it failed is a matter of luck for the public because what the climatologists estimate does not fit the definition. The EPS is the rise in temperature following a rise in CO2. What these climate scientists measure is the rise in temperature preceding a rise in CO2. They seem unaware of the scientific principle of causality and the necessity to measure leads or lags.
Terry Oldberg said,
However, [IPCC’s models] can be “evaluated.” In an “evaluation,” projected global temperature values are compared to observed global temperature values by plotting them side-by-side. There are neither probability values nor relative frequency values and can be none for there are no events.
Side by side plotting? Really? Sometimes IPCC is known to plot things side-by-side. Its called chartjunk. See III. Fingerprints, rocketscientistsjournal.com/2010/03/sgw.html#more. Here, though, IPCC discusses its climate predictions referring to their factual accuracy.
A specific prediction based on a model can often be demonstrated to be right or wrong, but the model itself should always be viewed critically. This is true for both weather prediction and climate prediction. AR4 ¶8.1.1 What Is Meant by Evaluation? p. 594.
However, a model that has been tuned to give a good representation of certain key observations may have a greater likelihood of giving a good prediction than a similar model (perhaps another member of a ‘perturbed physics’ ensemble) that is less closely tuned (as discussed in Section 8.1.2.2 and Chapter 10). AR4 ¶8.1.3.1 Parameter Choices and ‘Tuning’ p. 596.
In one place, IPCC thinks climate prediction works:
Note that the limitations in climate models’ ability to forecast weather beyond a few days do not limit their ability to predict long-term climate changes, as these are very different types of prediction – see FAQ 1.2. AR4 FAQ 8.1 p. 600.
Then engages in claims that climate is not predictable, accounting for the failure of its model to predict:
The climate system is a coupled non-linear chaotic system, and therefore the long term prediction of future exact climate states is not possible. Rather the focus must be upon the prediction of the probability distribution of the system’s future possible states by the generation of ensembles of model solutions. TAR, Technical Summary, G.2 Climate Processes and Modelling, p. 78.
One part is false and another part is contradicted by IPCC’s use of ensembles. The contradiction is this:
The equilibrium climate sensitivity … is not a projection but is defined as the global average surface warming following a doubling of carbon dioxide concentrations. It is likely [66%] to be in the range 2ºC to 4.5ºC with a best estimate [50%] of about 3ºC, and is very unlikely [10%] to be less than 1.5ºC. Bold added, AR4, SPM, p. 12
IPCC asserts its estimate of the ECS is not a projection. It is in fact a prediction, and the key value is the mean of 3ºC replacing the prediction of any single simulation. And that prediction is not a probability distribution. IPCC’s error is that the real world is not so uncooperative as to have the parameters of models, i.e., chaos, nonlinearity, initial conditions. Those features are defined for models, and only for models. But IPCC has a way around this dilemma, too:
Nevertheless, to be able to make reliable forecasts in the presence of both initial condition and model uncertainty, it is desirable to repeat the prediction many times from different perturbed initial states and using different global models. TAR, TS, pp. 49-50.
IPCC reports agencies named after their dedication to predicting climate. E.g.,
… the National Centers for Environmental Prediction/National Center for Atmospheric Research (NCEP/NCAR). AR4 ¶3.1 p. 240
National Oceanic and Atmospheric Administration (NOAA) Climate Prediction Center’s Climate Anomaly Monitoring System (CAMS), … . AR4 ¶3.3.2.1, p 254.
NOAA Climate Prediction Center (CPC). AR4 ¶3.3.2.5 p. 259
And here are a few of IPCC’s claims to successful predictions:
Many studies use climate models to predict the expected responses to external forcing, and these predictions are usually represented as patterns of variation in space, time or both (see Chapter 8 for model evaluation). AR4 ¶9.1.2 p. 668.
Climate models predict that human influences will cause an increase in many types of extreme events, including extreme rainfall. AR4 FAQ 9.1 p. 696.
Lopez et al. (2006) apply the Tebaldi et al. (2005) method to a 15-member multi-model ensemble to predict future changes in global surface temperature under a 1% yr–1 increase in atmospheric CO2. AR4 ¶10.5.4.6 p. 810.
Jeff Glassman:
Thank you for taking the time to respond. My heavily edited summary of our conversation to date follows.
Oldberg:
One can judge the correctness of predictions but not projections…
Glassman:
Not so…Science…advances through formulating hypotheses clearly and testing them objectively. Scientific theories are…evaluated by comparison with physical reality. Each successful prediction adds to the weight of evidence supporting the theory…
Oldberg:
As they make no predictions, the IPCC’s models cannot be validated though they can be evaluated. Validation is the mark of a scientific model. Evaluation is not such a mark.
Glassman:
IPCC’s models make lots and lots of predictions.
Oldberg:
In claiming that the IPCC’s models make predictions, Glassman is guilty of application of the equivocation fallacy. An “equivocation” is an argument in which a term changes meaning in the midst of the argument. In Glassman’s argument the term that changes meaning is “prediction.” An argument in which a term changes meaning looks like a syllogism but isn’t one. Thus, while one is on solid ground in drawing a conclusion from a syllogism, the same is not true of drawing a conclusion from an equivocation. To draw such a conclusion is the “equivocation fallacy.”
Glassman:
The equilibrium climate sensitivity (TECS)…is not a “projection”…
Oldberg:
Glassman is correct in stating that TECS is not a “projection.” In the climatological consensus’s theory of global warming there is a function that maps the change in the logarithm of the atmospheric CO2 concentration to the change in the global surface air temperature at equilibrium. This function is an example of a “projection.” TECS is not a projection but rather is the proportionality constant in the above referenced function.
Glassman:
Climate models predict that human influences will cause an increase in many types of extreme events, including extreme rainfall.
Oldberg:
So far as I am aware all such “predictions” are predictively useless “projections.”
Note: I’ve used the term “information” in the sense in which it is used in Shannon’s theory of information. That projections convey no “information” follows directly from this usage of the term.
Here is just another chart to make my point. What climate “science” needs is a control to isolate the impact of CO2. Then Sahara Desert is the ideal condition. There is basically zero H2O to impact the GHG effect. The Sahara Desert has no clouds to stop the irradiation of the earth by the Sun, so the days get piping hot, the sand absorbs a lot of the heat in a near black body manner, very little irradiation is reflected, and at night we get to see the true impact of CO2 isolated, and not impacted by H20. The Sahara Desert can go from above 100° to below freezing. Note the below quote “heat loss is rapid.” Evidence is all over the place that CO2 can at best prevent run away cooling, but in no way causes warming. Doubt me? Go sleep naked in the Sahara.
This is for the Sahara.
http://www.infoplease.com/encyclopedia/world/sahara-climate.html
Then look at the warm relatively humid Mediterranean. Note how the right part of the graph shifts down. That is the trapping of the heat by H20. Note how the relative impact of CO2 is reduced and the band widens out. The widening out of the CO2 band (15µ) is due to H2O. This is what they say about the Mediterranean temperatures. Note how there is plenty of mention of H2O and no mention of CO2. The H2O trapping heat is what moderates the climate which has 400 PPM CO2, just like the Sahara.
https://sites.google.com/site/climatetypes/mediterranean
Lastly is the Antarctic. It shows that CO2’s range is actually a window, and there is a blip up at 15&Micro; 100% of the Antarctic’s heat trapping is do to something other than CO2. If that chart is correct, how can CO2 be blamed for the warming of the poles? That last chart looks to be a smoking gun of all smoking guns to debunking the polar ice cap melting due to CO2 nonsense.
http://members.casema.nl/errenwijlens/co2/spectra.gif
I’m not sure these Climate “Science” Ph.Ds know how to read their own graphs. Look at the bottom chart of the IR radiance of the Earth over the Antarctic. The 220k° black body represents the radiation of -55° C, and the line represents what is seen seen from outer space. The gap between the black body line and the IR line is what is “trapped” in the atmosphere (assuming the earth is a perfect black body, which it isn’t). If the IR line touches the black body line, that represents 0% absorption and 100% transmission, and would be called a atmospheric “window.” Over the Antarctic there appears to be a window at 15µ or wavenumber 666, which is CO2’s peak absorption. H2O, O3 and other GHGs clearly absorb the majority of the heat over Antarctica, and CO2 appears to absorb basically 0%. H2O goes from being a near window in the longer IR wavenumber 400 to 500, to becoming a major contributor. Also, we know the warmer climates have H2O in the atmosphere, whereas the Antarctic won’t. That absorption band around wavenumber 666 may be due to H2O and not CO2 at all. CO2 clearly doesn’t absorb in the Antarctic. Also, CO2 absorbs 100% at 15µ, whereas H2O only absorbs around 50%. The IR charts show that only 50% of the radiation is absorbed at 15µ. That is consistent with H2O, not CO2.
http://members.casema.nl/errenwijlens/co2/spectra.gif
This chart shows the 50% absorption of H2O.
http://i787.photobucket.com/albums/yy154/RichardDH/AGW/emitt.jpg
http://earthobservatory.nasa.gov/Features/Iris/Images/greenhouse_gas_absorb_rt.gif
Also, I’m not convinced they are lining up the black-body charts correctly. They look to be curve fitting them to make the best case for CO2. A black-body of 288° K should peak over 10µ. If that is the case, the area between the IR and Black-Body graph would increase over the H2O range and shrink over the CO2. Something is simply funny with those charts, and they are tweaked to favor CO2.
Note how every chart you will find outside the field of Climate “Science” will show 288° K peaking at 15µ. Also the relative scales are missing on the Climate “science” charts so you don’t get how much more energy is under the warmer Black-Body Charts.
http://scienceblogs.com/startswithabang/files/2010/02/blackbody_emissive.gif
http://www.hashemifamily.com/Kevan/Climate/BBR.gif
More problems for the Climate “Scientists.’ This chart clearly shows that the hotter a black body gets, the more kurtotic (leptokurtic) or peaked they become. They are also positively skewed if you have Wavelengthµ on the Y-Axis. As the temperature increases the black-body shifts left. The energy of a black body of 210°K is about 1/5th that of a black-body of 290°K.

http://www.hashemifamily.com/Kevan/Climate/BBR.gif
Take a look at a Climate “Science” chart. The Black-Bodies are way off from what a calculator would give you. You can check this fact at SpectralCalc.
http://www.spectralcalc.com/blackbody_calculator/blackbody.php
The key is that the black bodies always are skewed towards the shorter, higher energy shorter wavelengthsµ. This chart clearly shows the black-body skewed towards the longer wavelengthsµ or smaller wave-numbers.
Both charts are skewed to the left, but one uses wavenumber and one uses wavelengthµ on the Y-Axis, They Can’t Both Be Correct
One of these charts must be wrong. My bet is the one published by the Climate “Scientists” is a lie.
http://www.hashemifamily.com/Kevan/Climate/BBR.gif
The implications on which one is right are huge. If the black body produced by a calculator is correct, and the black body distribution skews towards the shorter wavelengthµ, then the impact of CO2 is greatly reduced, and H2O is greatly magnified.
This chart shows the same thing. It shows the surface of the earth being 299°K, with a black body peak at 15µ A black body of 299°K is 26°C, or 80°F. A black body of 299°K has a peak of 9.5µ Either my calculator is lying to me or the Climate “Scientists” are. These charts are deliberately misrepresenting the impact of CO2 or the people that produced they are incompetent. Neither is good.
http://www.mathstat.dal.ca/~folkins/Cloud-LWspectrum.jpg
http://esrl.noaa.gov/csd/events/CT3LS/presentations/talks/50_Hintsa.pdf
This is mostly of interest, but if you look at the observed vs actual graph of Guam you will see that there seems to be an Ozone Window. In reality it looks like there is an “ozone hole” over Guam. BTW, that also implies that the Ozone Hole helps keep the Antarctic cold. Imagine that, the Ozone hold battles global warming. Maybe the banning of CFCs has resulted in the earth warming due to more Ozone?
There seem to be a lot of confusion about the greenhouse effect of doubling CO2. It might be illuminating to consider just what we are talking about. The IPCC AR-5 claims that the double CO2 15u sideband intercepts ~1.6 watts/m2 . The mean free path(mfp) of IR in this band at the partial pressure at sea level where CO2 is intercepting the IR from the earth surface is said to be ~33meters. Most ~90% of IR is absorbed by the CO2 in two mfp length (66 meters) Doubling the partial pressure (density) of IR this energy will be absorbed down to 33 meters in the next 100 years. As noted here and elsewhere this absorbed IR is immediately thermalized and raises the temperature of the air volume containing the CO2 thus 1.6 watts is being absorbed in 33 m^3 of air thus raising its temperature by 0.00002K/sec. This will go on for several seconds until this parcel of air is convected away (upward) and replaced with cooler air which will undergo similar heating. This is an ongoing (on the average) process world wide.
Note: No new energy is being introduced by doubling the CO2 density only the temperature distribution in the lower few meters of the atmosphere. Also note that if there might be additional downward IR radiation from this temperature increase location nearer to the surface it will contribute to additional water vaporization from the surface rather than affecting the surface temperature. Not that we would ever be able to measure any such theoretical change either in temperature of water vaporization rate.