Retreating sea ice linked to changes in ocean circulation, could affect European climate
From the UNIVERSITY OF TORONTO

Retreating sea ice in the Iceland and Greenland Seas may be changing the circulation of warm and cold water in the Atlantic Ocean, and could ultimately impact the climate in Europe, says a new study by an atmospheric physicist from the University of Toronto Mississauga (UTM) and his colleagues in Great Britain, Norway and the United States.
“A warm western Europe requires a cold North Atlantic Ocean, and the warming that the North Atlantic is now experiencing has the potential to result in a cooling over western Europe,” says professor G.W.K. Moore of UTM’s Department of Chemical & Physical Sciences.
As global warming affects the earth and ocean, the retreat of the sea ice means there won’t be as much cold, dense water, generated through a process known as oceanic convection, created to flow south and feed the Gulf Stream. If convection decreases, says Moore, the Gulf Stream may weaken, thereby reducing the warming of the atmosphere, in comparison to today.
Their research, published in Nature Climate Change on June 29, is the first attempt to examine and document these changes in the air-sea heat exchange in the region — brought about by global warming — and to consider its possible impact on oceanic circulation, including the climatologically important Atlantic Meridional Overturning Circulation.
Previous studies have focused instead on the changing salinity of the northern seas and its effects on ocean circulation.
Moore and his fellow researchers based their findings on wintertime data from 1958 to 2014 that was provided by the European Centre for Medium-Range Weather Forecasts and model simulations.
Traditionally, the Gulf Stream moves warm water north toward western Europe, says Moore, where it loses heat and moisture to the atmosphere, acting to moderate the climate in this region. The resulting colder, denser water sinks and returns south at a great depth eventually rising to the surface in the tropics, where the cycle, known as the Atlantic Meridional Ocean Circulation, begins all over again.
The Iceland and Greenland Seas are among the only places worldwide where conditions are right and this heat exchange is able to change the ocean’s density enough to cause the surface waters to sink. The largest air-sea heat exchange in these seas occurs at the edge of the sea ice.
In the past, this region of maximum heat exchange has coincided with the location where oceanic conditions are optimal for convection to occur. However, in recent years, the sea ice has retreated and with it the region of maximum heat exchange. As a result, there has been a reduction in the heat exchange over the locations where sinking occurs in the ocean. This has the potential to weaken oceanic convection in the Greenland and Iceland Seas.
“The heat exchange is weaker — it’s like turning the stove down 20 percent,” says Moore. “We believe the weakening will continue and eventually cause changes in the Atlantic Meridional Overturning Circulation and the Gulf Stream, which can impact the climate of Europe.”
The paper’s other authors are Kjetil V?ge from the University of Bergen, Robert Pickart from Woods Hole Oceanographic Institution and Ian Renfrew from the University of East Anglia.
###
Update: The original headline was unintentionally misleading, a product of travel pressures today back from the Kennedy Space Center where I witnessed the SpaceX launch and explosion yesterday. Thanks to free WiFi at Dallas Love Field, he headline has been corrected to accurately reflect the article. My apologies to readers for the error. – Anthony
Arctic sea ice retreat due to ocean circulation changes
and
Retreating sea ice in the Iceland and Greenland Seas may be changing the circulation
Don’t you have the title wrong? Cause and effect reversed?
Correct.
Hi Doc
Walking in the woods, came across some rather odd mushrooms… anyhow…
http://www.vukcevic.talktalk.net/SSN-60yrCycle.gif
Plain old cyclomania. Better not eat those mushrooms, they make you hallucinate…
Possible reasons for the temporal instability of long-term effects of solar activity (SA) and galactic cosmic ray (GCR) variations on the lower atmosphere circulation were studied. It was shown that the detected earlier ∼60-year oscillations of the amplitude and sign of SA/GCR effects on the troposphere pressure at high and middle latitudes (Veretenenko and Ogurtsov, Adv.Space Res., 2012) are closely related to the state of a cyclonic vortex forming in the polar stratosphere. The intensity of the vortex was found to reveal a roughly 60-year periodicity affecting the evolution of the large-scale atmospheric circulation and the character of SA/GCR effects. An intensification of both Arctic anticyclones and mid-latitudinal cyclones associated with an increase of GCR fluxes at minima of the 11-year solar cycles is observed in the epochs of a strong polar vortex. In the epochs of a weak polar vortex SA/GCR effects on the development of baric systems at middle and high latitudes were found to change the sign. The results obtained provide evidence that the mechanism of solar activity and cosmic ray influences on the lower atmosphere circulation involves changes in the evolution of the stratospheric polar vortex.
http://www.sciencedirect.com/science/article/pii/S0273117713005474
Been debating same kind of thing on another thread. Torture any wriggly noisy data enough and a child can find a match right at 12:00 every time. And then the child hopefully goes to school and learns how silly that is.
One side will make you grow taller, and the other side will make you grow shorter.
“The results obtained provide evidence that the mechanism of solar activity and cosmic ray influences on the lower atmosphere circulation involves changes in the evolution of the stratospheric polar vortex.
http://www.sciencedirect.com/science/article/pii/S0273117713005474”
Better to look at ozone changes in the polar stratosphere rather than cosmic rays since the former can alter the gradient of tropopause height between equator and poles leading to changes in jet stream behaviour and total global cloudiness.
Jetstream mileage varies depending on solar activity. Therefore, there is circularity temperatures in the Atlantic.
http://pamola.um.maine.edu/fcst_frames/GFS-025deg/DailySummary/GFS-025deg_NH-SAT1_WS250.png
http://www.woodfortrees.org/graph/esrl-amo/from:2009/to/trend/plot/esrl-amo/from:1950
Ren & Stephen Wilde
It might take some decades to find out if it the effect is related to the GCR or UV.
Geomagnetic balance between two focal points North East Canada and Central Siberia has altered around 1995 in favour of Central Siberia.
http://www.vukcevic.talktalk.net/AT-GMF.gif
a) if it is UV factor it will make no difference
b) if it is GCR than the Northern Hemisphere weather patterns (and eventually long term temperatures) trends will alter.
if the ‘18 year pause’ is related to it, not possible to say; if it is then the GCR effect is the determinant.
RoHa
Absolutely, one side is characterised by warmer climate, more vegetation, more food for the fauna and humans alike; and for the other side is exactly opposite.
The change cycle is also visible in the growth of ice since 2010.
http://www.woodfortrees.org/graph/nsidc-seaice-n/from:2010/to/trend/plot/nsidc-seaice-n/plot/none
Indices of the North Atlantic Oscillation and the Arctic Oscillation show correlations on the day-to-day timescale with the solar wind speed (SWS). Minima in the indices were found on days of SWS minima during years of high stratospheric aerosol loading. The spatial distribution of surface pressure changes during 1963–2011 with day-to-day changes in SWS shows a pattern resembling the NAO. Such a pattern was noted for year-to-year variations by Boberg and Lundstedt (2002), who compared NAO variations with the geo-effective solar wind electric field (the monthly average SWS multiplied by the average southward component, i.e., negative Bz component, of the interplanetary magnetic field). The spatial distribution of the correlations of geopotential height changes in the troposphere and stratosphere with the SWS; the geo-effective electric field (SWS∗Bz); and the solar 10.7 cm flux suggests that solar wind inputs connected to the troposphere via the global electric circuit, together with solar ultraviolet irradiance acting on the stratosphere, affect regional atmospheric dynamics.
http://www.sciencedirect.com/science/article/pii/S0273117713005802
Changes of troposphere pressure associated with short-time variations of galactic cosmic rays (GCRs) taking place in the Northern hemisphere’s cold months (October–March) were analyzed for the period 1980–2006, NCEP/NCAR reanalysis data being used. Noticeable pressure variations during Forbush decreases of GCRs were revealed at extratropical latitudes of both hemispheres. The maxima of pressure increase were observed on the 3rd–4th days after the event onsets over Northern Europe and the European part of Russia in the Northern hemisphere, as well as on the 4th–5th days over the eastern part of the South Atlantic opposite Queen Maud Land and over the d’Urville Sea in the Southern Ocean. According to the weather chart analysis, the observed pressure growth, as a rule, results from the weakening of cyclones and intensification of anticyclone development in these areas. The presented results suggest that cosmic ray variations may influence the evolution of extratropical baric systems and play an important role in solar-terrestrial relationships.
http://www.sciencedirect.com/science/article/pii/S0273117713007606
“We demonstrate that the detrended annual means of global surface air temperature in 1965–2012 show the maxima during CRs [Cosmic Rays] and Dst index [of the solar wind] minima. It proves that CRs [Cosmic Rays] play essential role in climate change and main part of climate variations can be explained by Pudovkin and Raspopov’s (1992) mechanism of action CRs [Cosmic Rays] modulated by the solar activity on the state of lower atmosphere and meteorological parameters. Following this we have to seek for another ways of looking for global warming reason, first of all, as a man impact on climate.”
http://www.sciencedirect.com/science/article/pii/S0273117714005286
What they show is that there is a small 0.1 degree solar cycle in the detrended temperatures, which is not a surprise [can be explained byvariations in TSI and not necessarily in cosmic rays], and they conclude that that ‘global warming’ which is ten times larger is not due to the Sun, but to Man, thus that there is AGW.
“Retreating sea ice in the Iceland and Greenland Seas may be changing the circulation of warm and cold water in the Atlantic Ocean, and could ultimately impact the climate in Europe, says a new study by an atmospheric physicist from the University of Toronto Mississauga (UTM) and his colleagues in Great Britain, Norway and the United States.”
Ahhh . . .
Retreating sea ice in the Iceland and Greenland Seas may be changing the circulation of warm and cold water in the Atlantic Ocean, or the distribution of A grades in Latvian education, and could ultimately impact the price of cheese on Svalbard or South Island New Zealand, says a new study by an adequately dischuffed – at ‘could’ & may, ‘might’, and ‘potentially’ – old fart who would like some ‘Yes’ or ‘No’ in published science.
Not sure if the rewrite really helps – it might do – but it gets a lot out of my system!
Smiles
Auto
That confused me as well.
What’s worse is the second line. Is that supposed to be a single sentence? If so, the comma is wrong. It should be:
“Retreating sea ice linked to changes in ocean circulation could affect European climate.”
Or is it two “headline language” clauses? If so, it would be better to link them with a semi-colon.
“Retreating sea ice linked to changes in ocean circulation; could affect European climate.”
That make the relationship clear.
more confirmation bias !
the text says: “Retreating sea ice in the Iceland and Greenland Seas may be changing the circulation of warm and cold water in the Atlantic Ocean”.
No tortured messing with commas or semicolons can change the meaning here.
The thing of it is, they may be on to something. Retreating sea-ice causes ocean circulation to change, which causes sea-ice to advance, which causes ocean circulation to change back. IE: A cycle.
Nature is full of cycles: Dawn, noon, sunset, midnight. Spring summer fall and winter. Sunspot cycles.
Why should oceanic cycles surprise anyone?
My favorite ocean cycle:
http://cliffsjournal.com/wp-content/uploads/2012/09/beachcruiser.jpg
Of course retreating sea ice in the Iceland and Greenland Seas may be changing the circulation of warm and cold water in the Atlantic Ocean.
Just as advancing sea ice in Antarctica may be changing the circulation of warm and cold water in the southern ocean.
Big deal, so what? If there is some global impact, prove it – put up or shut up. Oh, and please use empirical data, and NOT computer model BS. Computer models don’t even pass the smell test.
Caleb
June 29, 2015 at 5:53 pm
I had a manager who used to say:
Life is like being on a farm cartwheel, sometimes you’re in the warm sunshine and sometimes you’re in the sh*t. Make the most of the sunshine and remember it will be back again when you’re in the sh*t.
Same is true for climate
Might not this be part of how the AMO changes state? Didn’t the 30’s and 40’s have a lot of arctic melting, right before the Northern Hemisphere went into it’s cold cycle?
I think this is the abstract:
The air–sea transfer of heat and fresh water plays a critical role in the global climate system1. This is particularly true for the Greenland and Iceland seas, where these fluxes drive ocean convection that contributes to Denmark Strait overflow water, the densest component of the lower limb of the Atlantic Meridional Overturning Circulation (AMOC; ref. 2). Here we show that the wintertime retreat of sea ice in the region, combined with different rates of warming for the atmosphere and sea surface of the Greenland and Iceland seas, has resulted in statistically significant reductions of approximately 20% in the magnitude of the winter air–sea heat fluxes since 1979. We also show that modes of climate variability other than the North Atlantic Oscillation (NAO; refs 3, 4, 5, 6, 7) are required to fully characterize the regional air–sea interaction. Mixed-layer model simulations imply that further decreases in atmospheric forcing will exceed a threshold for the Greenland Sea whereby convection will become depth limited, reducing the ventilation of mid-depth waters in the Nordic seas. In the Iceland Sea, further reductions have the potential to decrease the supply of the densest overflow waters to the AMOC.
http://www.nature.com/nclimate/journal/vaop/ncurrent/full/nclimate2688.html#ref8
4 Authors:
G. W. K. Moore, K. Våge, R. S. Pickart, I. A. Renfrew
Pamela, quotes”Here we show that the wintertime retreat of sea ice in the region, combined with different rates of warming for the atmosphere and sea surface of the Greenland and Iceland ”
As the AMo turns, is this not likely to reverse, a it has before.
@ lsvalgaard
vukcevic
“Walking in the woods, came across some rather odd mushrooms..”
lsvalgaard
“Better not eat those mushrooms, they make you hallucinate…”
I was talking figuratively
translation : woods = NOAA and SIDC data files
magic mushroom = mysterious quasi-periodic 60 years
Metaphor or not, I think it’s sage advice not to swallow anything coming out of NOAA lately.
Hi Mr Harvey
Less of a metaphor more of data metamorphosis or more appropriate for the age of computer enumeration, unprejudiced data morphing.
Don’t forget the SIDC (‘historic’ sunspot numbers) too, may well not be tomorrow as it was a year, or a month, a week or even a day ago.
Fashion in data tailoring is changing; the long gowns of the Grand Maximum have been cut down to the mini-skirt size, more appropriate for the modern age of the catastrophic global warming.
Mind you, from yet another method using parallax magnetometer * metering the opposite side of the solar disk, there are already new estimates of the sunspot activity, that have not been witnessed before. Thus, another change is in the offing, and may be another and another and so infinitum. (*non est verum)
Seems that in some aspects of Climate Science the tail is really swinging the dog
The Day After Tomorrow….Again! Until it is discredited; again.
The earth’s “great thermostat” has many working parts. Man’s vain belief he has any ability to affect the workings of that massive thermostat is almost certainly foolish.
Claude, I’m pretty sure we don’t even understand the “great thermostat” at this point in time, much the less be able to control it.
Arctic ice melting increasing the cooling rate to space acts much like a thermostat in your cars cooling system.
micro6500,
My CO2 belching van only has one thermostat, but I am pretty sure the earth has many — perhaps some that we don’t even know about yet — but at the least several we don’t fully understand. I submit we don’t understand the system yet. Climatology is a very young science and it went off the rails into the CO2 delusion very early on in its history. That was darn unfortunate.
~Mark
But has the Gulf Stream been reduced by 20% at the same time?
??? Back up this drive by comment or be gone.
We don’t tolerate unsubstantiated BS here.
Well, it’s hot here in England! Some reports say we could hit 32c on Wednesday, that’s 90f for all you Americans who are still living in the century before the previous one!
Looks like we could be singing Bobby Goldsboro tomorrow here. If you are a certain age, you’ll know what I mean. I wonder if young boys still think the same things we did back then, with our Mrs Robinson thoughts. All cryptic stuff for anyone under 50 years of age!
Really like the way you are thinking, Big Jim.
“…could hit 32c on Wednesday, that’s 90f for all you Americans who are still living in the century before the previous one!”
————
Hey, we will adopt the metric system just as soon as you start driving on the proper side of the street!
We already do. When you’re driving your chariot, you hold the reins in your left hand, leaving your right arm – your sword arm – free to deal with the oncoming enemy traffic on your right. ‘Tis traditional, going back centuries.
The only reason anybody started driving on the wrong side of the road was that bloke Napoleon, and he only did it to be different from the traditional way, which he regarded as “English”. So, when you all come to your senses … and decide to spell litre and metre properly … 😉
You guys also used to drive on the correct side of the road before that unfortunate spat which led you to losing out on all the joys and benefits of colonialism.
In Hong Kong I have seen paper cars which are made to be burned at funerals, so that the deceased will have a car in the next life. The steering wheels are on the right, which shows that driving on the left is Heaven’s Way.
I believe England agreed to adopt the metric system in exchange for Greenwich Mean Time becoming the universal standard in the 19th century, rather than Paris time, or various other contenders.
A promise which apparently came without time constraints.
Actually, “Stay on the right” long predates that, Steve. It goes back to Rome in 1300. Dante mocked it in Circle 8.1 of Inferno, a good 5 centuries before Napoleon
You really think left hand drive (the proper way) had anything to do with Napoleon? Hah! It actually has everything to do with the decisions made by a guy named Henry Ford, you’ve heard of him? And actually it was the advice given to him by mechanical engineers and safety experts at the time. The model T was designed left hand drive and the rest is history.
90f? Heck, that’s tonight’s low…..
My commiserations.
Ghost: enjoy both your wit and insight. Here in Rockford, Illinois our record high is 112F and our record low is -27F. And my ancestors left England? Must have listened to that Hanson Mann who worked for George III.
No point, just an interesting difference.
Fahrenheit is still vastly superior to Celsius, since (a) the gradations are finer and (b) 0 F is the absolute freezing point of water, even in motion, as I understand it. Furthermore, 40 C doesn’t even sound hot, but it is. (The temp in the comment, 32 C, sounds freezing cold, as 32 F actually is for standing water.) Anyway, I like F and will continue to use it, employing those tiresome conversion formulae when necessary (F = 9/5 C + 32 and its arcane derivatives). So–the whole world can use C (or K), and I will still use F when I want to know what the C reading really actually truly means. Today we had 84 degrees F with moderate dew point and a light breeze; very pleasant. Tomorrow is expected to be more humid and to reach 90 F, so I will get my outdoor work done long before that time arrives.
Hear, Hear,
I agree. My nightmare is the conversions necessary to convert time. I am in CDT, I use CST to be consistent throughout the year, and I recently shifted the GMT/UTC to align with CST.
But now, no one knows what time it is when they enter my house….
Oh, BTW, now I am trying to align GOES 15, 13, and maybe another with DSCOVR. Getting correlations are getting tough. Now I understand why the big boys are so homogenic. I look at it as a fantsy way of filtering the data to express a point. I’ll stick with real data every cadence I choose. Some times it is 5min, and other times it is hourly. If I see something interesting it is easy to fill in to make hi-res comparisons.
That is when correlations get more complicated if not impossible. Metrick to me seems weak, like a #10. And the threads strip out so easily…. And, where is that d**n socket at anyway?
I am starting to go back and check the Temp vs Humidity records to get a grasp of the sharp changes in temperature. Im using 1minute cadence and there seems to be a really close connection (within 4 minutes or less). Any suggestions?
Why are you using metric money then? You should still be using Pounds and Pence.
Lee, the daily summary of dew point is fairly worthless, though from watching my weather stations, it does change rather slowly.
But remember nightly cooling removes water (most places anyways as rel humidity get up near 100%).
And I feel your pain with time adjustments, the data I work with is from local timezones, put the server is all gmt, and then there’s various date fields that have order restrictions, a pain.
Then there is this:
http://thevane.gawker.com/fahrenheit-is-a-better-temperature-scale-than-celsius-1691707793
“Well, it’s hot here in England! Some reports say we could hit 32c on Wednesday, that’s 90f for all you Americans who are still living in the century before the previous one!”
Summer there too, is it?
Not to worry, we have turned the corner, and winter is a-comin’!
Once we pass the Fourth of July, next thing you know it is Labor Day.
Better get up to the attic and dust off the ole’ Christmas lights.
http://www.askamathematician.com/wp-content/uploads/2010/12/analemma.jpg
http://borealis.astroclubul.org/imatis/_data/i/galleries/solarsystem/20140122_121110_imatis_analemma-me.jpg
Why would we want to be like the French? Look at what its gotten you?
Sorry, that was mean. ;>)
But the Met Office forecasts show the wind speed in miles/hour. Why?
And ask an English person how much they weigh, and they’ll give the answer, not in kilograms, but in Stones (whatever they are???)
There are apps that can convert. BTW a stone is around 14 lbs.
And isn’t the ice an insulator that prevents cooling, sinking seawater?
Did I read this right? Global warming is causing it to get colder?
It causes everything.
And a few extra things to boot.
No.
What is the “can, “may” “could” and “might” count in this latest bucket of bilge?
Look, as long as the government money keeps a-rolling in, why bother with absolutes. Gotta keep those hands waving.
There is also a
even though there are so many can/may/could/might that ‘believe’ has to be confirmation bias at its best (worst?).
Exactly which is what I have been saying for years as well as others. it is tied in large part to the phase of the AMO.
GHG’S have nothing to do with it.
These people know that because of the solar minimum which is ongoing, there will be colder winters than “normal”. They have to find some excuse and blame the cooling on global warming or climate change or whatever.
What will they say when the arctic ice grows at record rates after the AMO turns completely negative (as time goes by) and the cycle repeats it’s history by mimicking 1978? That’s not even taking into account the historical “writing on the wall” of a possible grand solar minimum that coincides.
sigh…
In places yes. The clue is in the A in AGW
This is hot on the heels of last week’s bad news for winters in Europe: http://www.independent.co.uk/news/science/natural-cooling-of-the-sun-will-not-be-enough-to-save-earth-from-global-warming-warn-scientists-10340067.html
It’s more complicated than that, with decadal and multidecadal cycles involved
https://rclutz.wordpress.com/2015/05/26/climate-on-ice-ocean-ice-dynamics/
They studied the 1958 to 2014 data. That’s a whole 56 years. Now they know all about it.
/s
But, but, but, I just finished reading in http://www.iceagenow.info the headline “Arctic sea ice as high for this date in a decade.” WTF
If it was well founded it would have been published in a better journal.
Nothing rational comes out of Nature Climate Change. They predict the end of the world twice a fortnight.
“Nothing rational comes out of Nature Climate Change. They predict the end of the world twice a fortnight.”
Given an infinite number of fortnights, they’re bound to get it right eventually. On second thought, they’ll probably still get it wrong.
If ever single prediction was wrong, in chemistry or electronics, you’d say I was using the wrong formula to the applied problem. The probability of getting so many things wrong is smaller than that of you reaching the wrong number but dialing the right digits.
But the world does end twice a fortnight.
So maybe this regional cooling will offset the global warming and Europe’s climate will remain unchanged.
they could almost be describing a negative feedback, almost.
The title of this post is not indicative of the content of the paper.
Could, may, we believe, is possible. Another faith based prediction to ignore.
Sounds like they are describing the AMO
So they’re rediscovering the AMO – again? How many paper is that already this year?
Why not? Trenberth rediscovered the PDO.
Let me get this straight:
as the climate changes, certain aspects of the climate change;
or is it
as certain aspects of the climate change, the climate changes?
Exactly
Thanks for the confirmation, Colin.
I feel so much less confused now.
Precisely so. Here we finally begin to unravel the ‘think of a number’ warmist game and realise that what causes Climate Change is…er…Climate!.
Overall negative feedback via non linear differential equations + time lag gives (apparently) random climate change.
A warm climate causes a cold one, eventually. Lack of snow cover causes snow, eventually. Snow changes ocean circulations that result in a warmer climate, eventually.
“Its all designed to blow your mind
but your mind wont really be blown
Like the blow that will getcha
when you get your picture
On the cover of the Rolling Stone”.
Or in this case, Nature presumably.,..
I BELIEVE…..I BELIEVE….I BELIEVE….(I need a paycheck)…I BELIEVE….d****r than rocks… My apologies to the rocks.
Retreating sea ice in the pond in my backyard in northern Wisconsin (USA) MAY be changing the circulation of warm and cold water in the Atlantic Ocean, and COULD ultimately impact the climate in Europe, says a new study by an atmospheric physicist from the University of Toronto Mississauga (UTM) and his colleagues in Great Britain, Norway and the United States, but I don’t think so.
WHICH IS PRECISELY THE REASON THAT THE EPA NEEDS TO TAKE CONTROL OF YOUR POND!!! Don’t you get it?
What is dollar value of a cause and effect reversal?
No data, no graphs, no statistical analysis? But at least they go allll the wayyyy back to 1958. Perhaps the warmer waters, which are making it colder are also producing more CO2? I had to teach senios in undergraduate school to obtain graduate school funding. Now just write a paper supporting consensus science and you get money. Maybe I’ll go back to school. Are they in need of old guys to fill some minority or cultural deficiency notch?
‘Norwegian observations confirms: The Gulf Stream has been stable over the past 20 years
Anthony Watts / May 23, 2015’
The above paper is based on empirical evidence and demonstrates clearly that the Gulf Stream is as strong as ever.
Did they utilize the actual temperature and sea ice data, the ERA model outputs, or both?
If they did not utilize actual data, it may be premature to accept their conclusions.
Eh, except it’s not working that way. Colder, denser water at the surface does sink, of course, provided its density is higher than that of water masses below. However, it never rises to the surface again on its own against the gravitational gradient, least of all in the tropics, where the surface is warm, therefore water masses above are buoyant. The next thing that happens is the abyss gets saturated with cold, dense water and the meridional overturning grinds to a halt. Water, even at the ice margin, can’t get dense enough to sink any more, because it is already cold and dense all the way down.
Clearly, one needs an active process somewhere else, which replenishes buoyancy at depth.
That “other process” is deep turbulent mixing, which is not driven by thermodynamic forces, but by pure (low entropy) mechanical energy input, provided by tides &. winds. It is most active not in the “tropics”, but at mid latitudes, mostly over the Southern ocean and to a lesser extent, over the Northern Atlantic, at specific sites, intermittently. That’s what makes room below for more cold dense water to sink at the ice / water interface.
That is, the overall flux of meridional overturning is not set by surface waters ready to sink in polar regions, but by tides and winds elsewhere.
Of course, once deep waters get diluted by deep turbulent mixing, downwelling will occur in regions with the highest water density. As density of seawater depends on temperature, pressure and salinity, it is quite difficult to predict where it would happen, but we are not entirely clueless.
As long as there is an interface between ice and water anywhere on the face of the globe, it will happen somewhere next to it, because density of seawater, unlike that of fresh water, is highest just above freezing. What is more, ice crystals do not like salt very much, so upon freezing brine exclusion occurs, that is, salinity of water not frozen gets even higher, than it was before freezing started and with it, its density also increases.
Around the North Pole ice is restricted to a thin layer close to the surface, so in this region pressure does not have a role. Downwelling will happen at sites where salinity is highest and temperature is below freezing (-1.9 C).
However, it is an entirely different game around Antarctica. The ice / water interface there goes down to considerable depth at many sites, several hundred meters, even a kilometer. Therefore liquid water next to the ice can have a high pressure, up to a hundred atmospheres. Melting point of ice decreases with pressure, so these water masses are cold indeed, their virtual temperature is well below freezing (but they are still liquid). What it means is that such a water mass, if it were instantly brought to the surface, would freeze immediately. However, usually it sinks instead, because, being cold, its density is high even at a lower salinity.
The net result is that Antarctic bottom water is colder and denser than Atlantic deep water coming from North, but the latter has a higher salinity. When they meet around the equator at the bottom of the Atlantic basin, the Atlantic deep water forms a layer above Antarctic bottom water, then they start exchanging salts (but not heat) through salt fingering. In this process bottom water becomes even denser.
The ice margin is long and it goes down to a considerable depth at some sites, so its surface area is high. Along this surface downwelling will happen where density is highest, that is, at a few sites at any specific time. Those sites and times are dependent on climate indeed, but the overall downwelling flux not so much.
That is, downwelling may decrease in the North, but it will increase by the same amount in the South and vice versa. However, I do not think it will happen. Salinity of the Arctic basin is high all over the Atlantic side and sea ice will not go away entirely, least of all during Arctic winters. That is, downwelling will still happen at the ice margin, even if it is displaced, sucking in somewhat warmer waters from the South at the surface.
What is still true however, is that only a slight displacement may have dramatic effects on regional climate, while next to none on global one.
But that’s not what they’re trying to tell us.
except that it isn’t…
http://polarview.met.no/regs/c_map1.jpg
I’m having a hard time, not withstanding all the fine print in the lower left corner, in identifying the coastline of this map – perhaps you can shed some light ?
Greenland on the left, northern Norway at the bottom, Siberia on the right.
Thanks Sir … popped right out of your reply .
Hmmm! I’ve heard of the Greenland sea but not the Iceland sea. Didn’t I read that there was more ice off of the east coast of Greenland and around Iceland than usual this past winter?
Darling?
Yes Dear.
Where’s the thermostat for the planet?
I think the last place I saw it was uh…near Greenland.
So…a strong Gulf Stream is putting more warm water into the Arctic Ocean, which is reducing ice cover, which will change the pattern of oceanic convection, which will weaken the Gulf Stream, which will cool the Arctic Ocean, which will result in more ice cover, which will change the pattern of oceanic convection, which will strengthen the Gulf Stream, which will reduce the ice cover.
Repeat as required.
I’d like Willis to have a look at this to see if we have another negative feedback providing self correction for the system.
hmmmm. I don’t think it matters which Arctic street corner evaporation and heat release occurs. The current will continue to bring warmed water into the Arctic pole area where it will eventually get cold enough to start the process, even in Summer. And without an ice cover, the more the better. I am thinking evaporation and sinking might even be faster. I would even guess that this already happens seasonally. The Gulf stream naturally meanders into the Arctic further in the Summer, cools off, sinks, and goes on its merry way, while in Winter it doesn’t meander quite as far, cools off, sinks, and goes on its merry way.
Idiots.
Since the big dogs have their paper behind a paywall, I want sloothing. I found a doctoral thesis. K. Moore, one of the authors of the above paper was a part of Marilena’s committee. Notice the connection to Woods Hole and the submission data. What do you want to bet she did some of the grunt work on the above study.
“Strong wind events across Greenland’s coast and their influence on the ice sheet, sea ice and ocean”
by Marilena Oltmanns
B.S. in Earth and Space Sciences, Jacobs University Bremen (2009)
Submitted in partial fulfillment of the requirements for the degree of
Doctor of Philosophy
at the
MASSACHUSETTS INSTITUTE OF TECHNOLOGY
and the
WOODS HOLE OCEANOGRAPHIC INSTITUTION
June 2015
https://www.google.com/url?sa=t&rct=j&q=&esrc=s&source=web&cd=10&cad=rja&uact=8&ved=0CGMQFjAJ&url=https%3A%2F%2Fdarchive.mblwhoilibrary.org%2Fbitstream%2Fhandle%2F1912%2F7353%2FOltmanns_Thesis.pdf%3Fsequence%3D1%26isAllowed%3Dy&ei=CcyRVZXZApetoQTQyoWIDA&usg=AFQjCNEld-Q7XPQBVWAwKaxqGL6dtaHaeg&sig2=puWRtuZ4JRXcd_T-J_e4GQ&bvm=bv.96783405,d.cGU
They seem to say that it matters where the maximum heat exchange happens.
You point out that there should be more total heat exchange. That’s true. Ice is an insulator and water below the ice loses heat much slower than it would if it weren’t covered by ice. With less ice, the system as a whole should lose heat more quickly.
We can’t see the paper so we can’t tell if they have dealt with the obvious problem that you point out.
This seems to be exactly what they did. They used a fixed distance from the sea ice extent to measure heat flux, giving them a fixed area that migrated over time for which heat transfer was measured. The heat transfer of this fixed area decreased as it migrated north, but they ignored the area where they were previously measuring as if it were insignificant because it was no longer the area of maximum heat transfer. Adding in the old areas would probably erase their 20% discrepancy. Or, maybe not, and this is the reason for the pool of abnormally warm water off the coast of Nova Scotia.
The articles’s claim is a gigantic stretch, to put it mildly.
“As global warming affects the earth and ocean, the retreat of the sea ice means…”
No point reading any further than that, it’s baloney. Increased forcing of the climate increases positive NAO, and that means a faster AMOC and a cooler Arctic and less ice melt.
That the AMO has warmed since 1995 nearly as fast as from 1925, shows how little increased GHG’s have inhibited that warming.
Maurice Ewing understood the Arctic better in the 1950s than most people do today.
He always asserted that low sea ice caused cooling.
He may have, without knowing it, discovered the AO. When the Jan Feb Mar indices is below climatological average, cold outbreaks occur outside of the normally constrained Arctic Circle making us shiver https://nsidc.org/cryosphere/arctic-meteorology/weather_climate_patterns.html. Then again, he may have discovered that weather pattern variation and regimes shifts are a wickedly complex problem to figure out https://www.ncdc.noaa.gov/sotc/synoptic/201505.
But let’s give him the benefit of the doubt. Notice that the AO may provide clues about sea ice buildup and sea ice being flushed South. http://www.cpc.ncep.noaa.gov/products/precip/CWlink/daily_ao_index/JFM_season_ao_index.shtml. When it is heading up, sea ice build up, likely because of a tight vortex and jet stream keeping cold air and ice building up in the Arctic circle. When it is heading down, sea ice decreases, likely because of a less tight vortex and jet stream sending cold air and ice out of the Arctic.
Pamela Gray: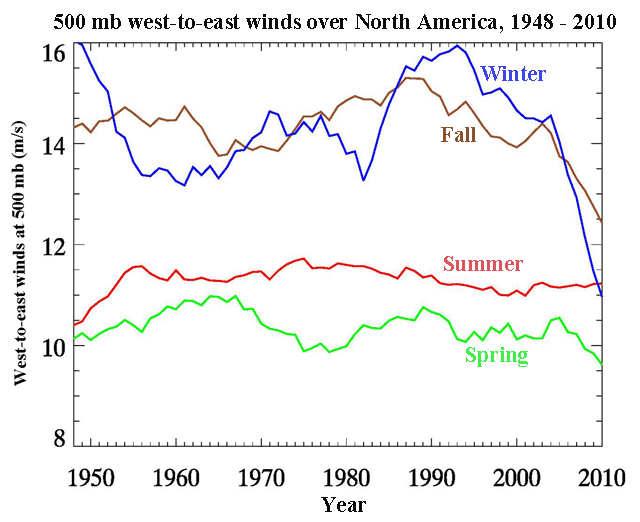
I see a similarity between your link:
http://www.cpc.ncep.noaa.gov/products/precip/CWlink/daily_ao_index/JFM_season_ao_index.shtml
JFM AO, and this one from Francis:
In her plot, Fall and Winter have fallen off the table, though I’d wish she’d update it. I think the NH jet stream patterns are telling us something. Meridional or wavy is mixing and atmospheric cooling, and zonal or rigid is atmospheric warming. I hadn’t connected that to sea ice until I read your comment. If the Arctic is cut off by zonal flow – building sea ice. If it’s mixing – losing sea ice. If JFM AO continues into negative territory, we should continue with a mixing air flow, the pause, yet lose NH sea ice. When we lose insulating sea ice, this not alarming, as the ocean would be cooling.
Yes. I have noticed several papers related to wind regime shifts.
“Meridional or wavy is mixing and atmospheric cooling, and zonal or rigid is atmospheric warming”
Correct. I’ve been pointing that out since 2008.
After a while, though, the cooling of the system allows an increase in ice despite increased air flows in and out of the polar regions.
Latest version of my hypothesis here:
http://joannenova.com.au/2015/01/is-the-sun-driving-ozone-and-changing-the-climate/
Stephen Wilde:
At your link there are two diagrams, inactive and active sun. I like to test my ideas against the glacial/interglacial cycle. What works now, should work on long time scales. What jet stream pattern do you think is predominant during a glacial and then an interglacial? My guess is that during a glacial we have zonal flow to preserve life towards the equator. During an interglacial meridional flow sets up to move heat to the poles and to prevent overheating of the equatorial regions. I am guessing ice expands to provide insulation for a glacial and contracts to provide cooling otherwise.
Ragnaar.
The ice age / interglacial transitions are driven more by insolation changes during the Milankovitch cycles than by insolation changes from variations in global cloudiness caused by solar behaviour.
Otherwise you make a good point in that once glaciations are in progress they push the jets so far equatorward that their ability to wave about meridionally is reduced so one would see a more intense zonal flow around the ice perimeter.
My hypothesis is limited to the effects of solar variability within the current interglacial.
“Maurice Ewing understood the Arctic better in the 1950s than most people do today.
He always asserted that low sea ice caused cooling.”
Certainly there is regional cooling for example in the northeast US and northwest Europe at the same time as low sea ice, that does not mean that the low sea ice caused the regional cooling though.
They are both the result of negative NAO/AO episodes, which are caused by short term episodes of weaker solar forcing. Increased forcing of the climate increases positive NAO/AO and cools the Arctic, which is what the Sun did though 2013-2014. But it won’t last, the next ten years will see the weakest part of this solar minimum, and a sharp rise in negative NAO/AO, and many summers with low sea ice extent again like 2007 and 2012 and worse.
Arctic amplification is bunkum, what explains the accelerated Arctic warming since the mid 1990’s, is the decline in solar wind pressure increasing negative NAO/AO, increased forcing of the climate cools the Arctic by increasing positive NAO/AO.
http://www.ipcc.ch/publications_and_data/ar4/wg1/en/ch10s10-3-5-6.html
Don’t these people know that much of the melt is from UNDERNEATH THE ICE, precisely because of the Gulf Stream waters and not CO2 and global warming from the top. If these currents are interfered with, it will be much more than the UK’s children continuing to see snow. The arctic ice will thicken rapidly, less seawater will be exposed and northern Europe will join Svalbard as ice bound land masses. Hey, climate scientists don’t know enough to be effective forecasters so they shouldn’t ignore what we do know.
Then why does Sept Arctic sea-ice minima strongly correlate with spring melt-ponds?
http://www.nature.com/nclimate/journal/v4/n5/full/nclimate2203.html
Gary Pearse is exactly right.
In fact, I would go further. In many places most of the melt is from underneath.
My previous organization camps on the ice in the arctic archipelago. The camp constructs an airstrip on the ice because it is much smoother than the adjoining land. The ice thickness is a ‘big deal’ because the airplanes won’t land if the ice is too thin. That means it is necessary to pack up and leave in early May. The temperature is still well below freezing but the ice has thinned enough that the plane is willing to make only one last flight.
By the time melt ponds appear a couple of months later, most of the ice thickness is gone.
I really don’t get all this Arctic sea ice panic and worrying.
Biological markers clearly indicate that during the first half of the Holocene, Arctic sea ice was seasonal at most. There are ports on the north coast of Russia, which haven’t been open of a long time.
The current level of sea ice is ANOMALOUSLY HIGH compared to the last 10,000 years, mainly because the planet is still only just above the coldest period in the whole 10,000 years of this current interglacial.
The AMO is flipping already. Cold N Atlantic and MDR are happening. Where is JB with the graphic? He has been talking about that for a while. I dont have the links in my phone….. dangit.
Dude, did you even read the first sentence of the press release before writing the headline? You’ve inverted the findings of the study.
Confirmation bias rears it head…
People see what they want to see, regardless of what is there…
…or family and/or business forced a cursory read and a quick post. Been there, done that.
If so, there is hope that the Tile will be revised …
But note how many commenters swallowed the title raw. [judging from only a handful complaining].
I forgive Anthony’s title mixup because I judge it might be closer to the truth than the press release about the paper.
Doc, Anthony did say he was traveling this weekend. Tired perhaps,
michael
glad U said that instead of me.
This place is more of a social hangout for many of the participants. Think many are aware of the bias (one hopes) but don’t care.
You are probably right. And many enjoy flaunting their bias, that is, after all, what we all have in common.
Headline fixed, tired, distracted, pressed for time. Sometimes it’s better to wait. Thanks to all who pointed out my error.
Leif writes You are probably right. And many enjoy flaunting their bias, that is, after all, what we all have in common.
Sarcasm? I’m here because I’m naturally sceptical and like to see what sceptical arguments are put forward. Pro AGW sites tend to make the supportive argument only. Some are better than others of course…but WUWT is the most popular for a reason…
Sea ice: it comes and it goes
Maybe they should find out what that big rift down the middle of the Atlantic ocean is doing, They are not above ignoring volcanic activity, specifically in areas of ice loss, especially when it suits their agenda. I see they do not note increased snow cover on land masses, increased ice in the great lakes.. ect ect. I see a lot of could, may, might and possibly but no has, did or even a solid will. Its crap science with enough outs to make it useless.
Off topic.
I think ISIS has been a blessing in disguise for conservatives here in the U.S. Obama really wants it to go away so he and his left wing cronies can get on with fundamentally changing us to a socialist hellhole. If it weren’t for the threat of ISIS, and people having that reality of the real world hanging over their heads, many would quietly go down that idiot path to socialist bliss.
“may be changing the circulation”
“could ultimately impact the climate”
“has the potential to result in a cooling”
Weasel words everywhere – that’s not science.
Science attributes probability and error bars.
Would you read that?
The AMO is currently at the tail-end of it’s 30 year WARM cycle (started in 1994) and is expected to switch to its 30-yr COOL cycle around 2022 (the same year the weakest solar cycle since 1715 starts).
The PDO entered its 30-yr cool cycle in 2008, and already Arctic sea ice is growing on the Pacific side of the Arctic.
The warmunists have to devise excuses now to account for the cooling that’s already started. That way, when a cooling trend becomes irrefutable even with the highly “adjusted” temperature datasets, they can point to these old silly pal-reviewed papers and say, “See, the cooling trend was predicted years ago– warming causes cooling….”
It’s like that old parlor trick, where numbers are pre-written on the bottom of various items on a desk, and when someone is asked to pick a number between 1 and 10, the person is asked to look at the bottom of the item that corresponds to the chosen number— Voila!, clairvoyance!! …
CAGW has become a cheap parlor trick to fool the foolish..
The Gulf Stream is primarily caused by the Coriolis Effect of a spinning Earth…. When the Earth stops spinning, the Gulf Stream will stop… I don’t see that happening anytime soon….
From the apparent period of the AMO alone, it would be cooling again in the mid 2030’s, and reach its coldest in the mid 2040’s. And if you could predict that the solar wind will be fast and dense in the mid 2040’s as it was through the mid 1970’s, then you could be certain of that being the next coldest point.
It’s very interesting then to see from the data that Arctic ice has become much thicker over a larger area as we enter the new Little Ice Age.
The proof is very simple: the onset of melting of thick ice, shown by a sudden fall in the rate of reduction of area, is a month earlier this year: http://ocean.dmi.dk/arctic/icecover.uk.php
^As global warming affects the earth and ocean, the retreat of the sea ice means………..”. With two decades of global temperature stasis, Arctic sea ice above its minimum and Antarctic sea ice above its long term average I would say the entire paper, and all the conjecture resulting from it, is irrelevant.
“The PDO entered its 30-yr cool cycle in 2008, and already Arctic sea ice is growing on the Pacific side of the Arctic.”
Really ?… well SST’s around the Bering sea don’t seem to agree with you.
http://www.ospo.noaa.gov/data/sst/anomaly/2015/anomnight.3.30.2015.gif
http://www.ospo.noaa.gov/data/sst/anomaly/2015/anomnight.6.29.2015.gif
In the past many scientific papers used SIDC’s sunspot numbers, thus to reproduce results of their findings access to the ‘old’ uncorrected SIDC’s sunspot numbers is essential, but they may (or may not) be available from the 1st of July.
For time being the ‘old’ uncorrected SIDC’s sunspot numbers may be found HERE
Except it seems ocean currents have not changed in any significant way……
It seems to me the currents change naturally. How much ice there is does not affect the current. Probably the current is about to change — not as much warm water flowing into the arctic ocean and the ice will return. Amount of ice in the arctic is cyclical based upon where the current is flowing. England will probably warm a bit as the arctic ice increases.
It is too late and I am falling asleep. good night all.
Eugene WR Gallun
But I thought Britain was going to get a Mediterranean Climate. I wish these “science is settled” chaps would make their minds up.
travel….. back from the Kennedy Space Center where I witnessed the SpaceX launch and explosion yesterday.
Anthony, I watched it online, it must have been awesome in person. It’ll be even more spectacular when Musk gets all the pieces in the right place at the right time. I’ll bet those guys up on the ISS will be wondering what happened to their pizza order that they placed a while back.
Bar a blip in March, when all the cold air slipped down over Canada and the northeastern US to cause the unusually long, cold winter, Arctic sea ice is recovering impressively
http://ocean.dmi.dk/arctic/plots/icecover/icecover_current_new.png
Arctic temperatures are currently running below normal
http://ocean.dmi.dk/arctic/meant80n.uk.php
Where do these stories about Arctic warming and vanishing sea ice come from?
Look it’s quite simple – because you are looking at weather. Climate has to be measured on a decadal scale.
The Arctic has “weather”. It has warmer than ave and colder than ave season. The NSIDC forecast some time ago that the Arctic melt this year would not be a record low, as the spring melt-pond was cold.
Cold is weather, Warm is climate change, got it.
I appreciate that the March blip was just localized weather. My first point was that he climate alarmists didn’t recognize that, or at least they didn’t present it that way. My second point was that the trend in Arctic sea ice coverage has been upwards for the past two years. Currently it’s the best it’s been for a decade. That looks like climate, not weather.
funding
Most folk saying that the AMO is moving into its cold mode without bothering to look what it was doing through the Gleissberg solar minimum in the late 1800’s. It stayed largely in its warm mode, it didn’t cool well until solar activity picked up again.
Agree. The AMO is not the only factor, atmospheric pressure in the sub Arctic is also a critical factor. As far as the 19th century is concerned the AMO (aka 60 year quasi-periodic) as reconstructed HERE see the lower graph,
from 1810 to 1895, out of 85 the AMO was negative for only 25 years, and even so only up to half or less of the depth of the two recent lows.
AMO variability is wind driven by NAO/AO variability.
Intensity of the westerlies is directly related to the atmospheric pressure around Iceland (northern leg of the NAO). They strip warm saline North Atlantic Drift current of up to 2kW/m2 of heat.
Deprived of its warmth buoyancy, the salty water then sinks to depths of at least a mile (AMOC). Current turns southwards creating the return part of the ‘oceanic conveyor belt’.
The North Atlantic ‘Achilles Heel’ just south of Greenland is the key overturning region. I doubt that the low AMOC events that occur during negative NAO episodes are purely density driven.
Oh dear, so global warming causes regional cooling in one the main regions where the warming is happening. Sound like a dangerouly heretical negative feedback process.
The corrolary is that perhaps they have not yet understood the process at all and it is changes in atlantic overturn currents that are the reason of the main 1997-2007 loss of ice and warming in Europe.
Thank goodness, all those kids in England no longer have to worry about never seeing snow again as previously predicted.
I don’t know how they are going to model ocean circulation properly when they don’t even understand how the AMOC works and where the Arctic bottom (sinking) water originates from.
It comes from the entire Arctic ocean under the sea ice (not from the Greenland and Iceland seas next to the sea ice as they promote).
Not surprising I guess since this myth is wide-spread in the climate science community given that they don’t care about facts but more about whatever fits their global warming conviction.
The AMOC bottom water flow comes out of the entire Arctic ocean basin and, technically, overflows from the basin at these choke-point canyons. The Denmark Strait, for example, is the largest waterfall on the planet where cold Arctic water at -0.5C overflows the chokepoint and falls 4,000 metres to form one of the 3 sources of the Atlantic bottom water (the others being the Faroe Bank Channel overflow and the Davis Strait on the other side of Greenland coming from the Arctic peninsula channels). The Arctic bottom water continues flowing south from here until it starts to override the Antarctic bottom water at 20S.
Not to mention splitting of the ocean floor, oozing magma, number of sub-marine volcanoes and thousands of the ocean floor vents pumping boiling hot water
http://news.ucsc.edu/2015/06/images/circulating-seamounts-400.jpg
A ‘hydrothermal siphon’ drives water circulation through the seafloor
New study by scientists at UC Santa Cruz explains previous observations of ocean water flowing through the seafloor from one seamount to another.
http://www.nature.com/ncomms/2015/150626/ncomms8567/full/ncomms8567.html
Awesome comment.
Using an extended time-series of the NAO index as a proxy for the zonality of atmospheric
circulation in the northern midlatitudes, we find that the long-term correlation between solar
activity and atmospheric circulation changes in consecutive secular solar cycles and depends on
the north-south asymmetry of solar activity: when the northern solar hemisphere is more active,
increasing solar activity in the secular (Gleissberg) cycle leads to decreasing prevalence of zonal
forms of circulation, while increasing solar activity in secular solar cycles when more active is the
southern solar hemisphere leads to increasing zonality of atmospheric circulation.
Little can be said about the century-scale variations in the solar open magnetic field and hence
of the number and intensity of high speed solar wind streams, but we can suppose that increasing
solar open flux would lead to enhanced zonality of the circulation. The decreasing correlation
between the long-term variations in sunspot and geomagnetic activity and the recent increase in
geomagnetic activity point at the increasing importance of solar open flux. This increase in
geomagnetic activity not related to increasing sunspot activity coincides with the gradual change
over the past 4 decades of the NAO pattern from the most extreme and persistent negative phase
in the 1960’s to the most extreme positive phase during the late 1980’s and early 1990’s – a fact
which supports the role of the solar open flux in enhancing the zonality of the circulation.
http://arxiv.org/ftp/physics/papers/0702/0702057.pdf
So they say in this article which is bunk. The AMOC is showing no signs of any significant slow down while Arctic Ice is within it’s normal range of variability over the last 150 years.
Add to this that Arctic Sea Ice will be on the rise.
This article has nothing to offer other then more AGW bunk.
This has the potential to weaken oceanic convection in the Greenland and Iceland Seas.
“The heat exchange is weaker — it’s like turning the stove down 20 percent,” says Moore. “We believe the weakening will continue and eventually cause changes in the Atlantic Meridional Overturning Circulation and the Gulf Stream, which can impact the climate of Europe.”
T
I think heading forward cooler temperatures for the globe are looking more likely. The geo -magnetic field will have a bigger role then what many think because it enhances the effects of solar activity when weakening or when weak.
I do expect sea surface temperatures to decline in response to prolonged solar minimum activity and I think unlike some others that a -NAO will equate to a -AMO phase and more Arctic Sea Ice when Solar Minimum conditions are PROLONGED, and reach certain criteria in regards to duration of time and degree of magnitude change, which results in a much different climate outcome then when the sun is in a more or less 11 year rhythmic solar cycle mode of activity where solar minimum conditions under that scenario may for example go along the lines of what Ulric, has been suggesting and has some support from past data of his assertions.
I think under the scenario of prolonged minimum solar conditions however , that Sea Ice may start to form in the NORDIC SEA which could impact the AMOC and slow it down if enough fresh water via the Sea Ice got incorporated into the mix. This would have cooling implications for Europe, and Eastern North America.
The Arctic itself may not be all that cold under this scenario due to the Meridional Atmospheric Circulation but cold in the Arctic is relative and cold in the Arctic is much more meaningful during the summer season then the winter season, when temperatures in the Arctic are well below freezing regardless if the Arctic temperatures are above normal or not.
Inhibition of circulation weakens the force of the wind on the ocean. This means less water vapor in the atmosphere and global temperature drop.
-NAO will never equate to a -AMO. You have only managed to confuse what I have said with the paragraph long sentence.
I tend to disagree I do not think one should expect the same climatic results from solar minimum that are prolonged in nature, and reach certain criteria.
Time will tell.
In addition the folks at Weatherbell Inc. are of the strong opinion the AMO will be in a negative phase from this point in time going forward.
http://snag.gy/hjc6M.jpg
You may be correct. We will have to see how it plays out. Collecting the data not manipulated is what I am trying to do.
And a renewed +AMO means less sea ice again.
As of 6/29/2015 http://nsidc.org/arcticseaicenews/
I find it a little odd, that they look at winter time ice cover. The Arctic ocean is mostly surrounded by land, meaning that winter time ice cover has very little variation. http://ocean.dmi.dk/arctic/icecover.php
Did they at all looked at ice cover? “Moore and his fellow researchers based their findings on wintertime data from 1958 to 2014 that was provided by the European Centre for Medium-Range Weather Forecasts and model simulations”.
Waldmeier (1957) suggested the following relation between the north-south asymmetry of
solar activity and the secular solar cycle: solar activity dominates in the northern solar hemisphere
during the ascending part of the secular solar cycle, in the southern one during the descending
part, and in epochs of secular minima and maxima the asymmetry is small. However, there wеre
at least two episodes when this rule did not hold: the secular maximum of the 20th century around
1950 when the asymmetry had a maximum rather than a minimum (See Fig.2), and the end of the
Maunder minimum when the activity was clearly increasing while all sunspots were concentrated
in the southern solar hemisphere. From the supposed dependence of the correlation between solar
activity and temperature on solar asymmetry (Georgieva, 1998), we can hypothesize that solar
asymmetry changes sign in consecutive secular cycles, being positive in “even” cycles (if we
denote the 20th century secular cycle as even) and negative in odd ones; it has maximum positive
or negative values coinciding with the maximum of solar activity in the odd and even secular
cycles, respectively, and changes sign around secular solar minimum. Therefore, we can speak
about a “double secular” solar cycle consisting of two secular, or “Gleissberg” (Gleissberg, 1958)
cycles – one in which more active is the southern solar hemisphere, and a second one in which
more active is the northern hemisphere, much like the 22-year magnetic solar cycle consisting of
two 11-year cycles with opposite polarities, which leaves no “anomalies” in the available data
(Georgieva and Kirov, 2000). This double secular cycle, inferred from climatic data, was
independently determined by Mursula and Zieger (2001) in geomagnetic data: they found that the
streamer asymmetry, as determined from seasonal geomagnetic activity, changes its orientation
from being shifted towards the southern magnetic heliosphere in the 19th century to being shifted
towards the northern magnetic hemisphere in the 20th century.
http://www.sidc.be/images/wnosuf.png
It is obvious that the main reaction is observed at high latitudes, as should be expected taking
into account that the effect of magnetic clouds is strongest at high latitudes. The pressure at low
latitudes practically doesn’t react to magnetic clouds. Consequently, the changes in NAO index
are determined by the high latitude processes. NAO has a prolonged deep minimum starting two
days after the magnetic cloud encounter, and reaching its lowest values five days later. A more
careful inspection reveals that on the day of the encounter of a magnetic cloud and shortly prior to
it NAO index has a maximum, and the pressure in Iceland has a minimum. This maximum in
NAO and the minimum in Iceland pressure vanish if we exclude the fast magnetic clouds with
preceding shocks. Obviously, the shock itself, irrespective of its causes, always leads to a decrease
in the pressure at high latitudes. It should be noted here that according to the criteria which we
have adopted, the beginning of the magnetic cloud is considered the beginning of the magnetic
field rotation, while normally the shock precedes it by a few hours to a day or two.
http://arxiv.org/ftp/physics/papers/0702/0702057.pdf
https://en.wikipedia.org/wiki/Magnetic_cloud
Ren that approach is making matters to complicated and not straight forward which leads into problems when trying to claim a solar/climate connection.
The standardized seasonal mean NAO index during cold season (blue line) is constructed by averaging the monthly NAO index for January, February and March for each year. The black line denotes the standardized five-year running mean of the index. Both curves are standardized using 1950-2000 base period statistics.
http://www.cpc.ncep.noaa.gov/products/precip/CWlink/pna/season.JFM.nao.gif
The negative NAO (JFM) corresponds to a decrease AMO.
http://www.woodfortrees.org/graph/esrl-amo/from:1950
I show the impact of solar activity on the pressure changes at high latitudes.
Visible is the impact of solar activity on the changes in pressure in the stratosphere.
http://www.cpc.ncep.noaa.gov/products/stratosphere/strat-trop/gif_files/time_pres_HGT_ANOM_ALL_NH_2015.gif
“A warm western Europe requires a cold North Atlantic Ocean, and the warming that the North Atlantic is now experiencing has the potential to result in a cooling over western Europe.
Oh please just stop printing this BS
Let’s see what is responsible for the heat in Europe. What will happen in the winter?
http://earth.nullschool.net/#current/wind/isobaric/250hPa/equirectangular
Off topic but I got to this post from Yahoo news feed. That is the first time I have seen a WUWT post in my yahoo news. The title must have done it 🙂
“Retreating sea ice in the Iceland and Greenland Seas may be changing the circulation of warm and cold water in the Atlantic Ocean, and could ultimately impact the climate in Europe”, says a new study.
May be … could???
No disrespect but it is this kind of weak scientific language that is rendering science useless.
It should be obligatory for scientists to not use cheap words like “may be” or “could” and instead quantify what they are saying by using mathematically backed-up expressions such as “a X% risk” or “Y% probability”.
So, imagine how more scientifically meaningful the statement would have been had it stated something like the following:
“Retreating sea ice in the Iceland and Greenland Seas has a 5% risk of changing the circulation of warm and cold water in the Atlantic Ocean, with a 2% probability of ultimately impacting the climate in Europe”.
Instead, the original statement in the study simply renders the study as meaningless, and of no beneficial use.
Late in the day with this comment however….
“Traditionally, the Gulf Stream moves warm water north toward western Europe, says Moore”…..
No, no, no, no, no…..and no again
Maybe usually or normally but not traditionally.
Tradition is a human custom.
Strange clothes regularly worn are a tradition. An annual music festival might be a tradition.
The Gulf Stream has no traditions.
Apparently in the 12 years prior to 2005 the Gulf Stream had weakened 30%
http://www.theguardian.com/environment/2005/dec/01/science.climatechange
All of NW Europe was about to plunge into an ice age as a result
And in 2013 the Gulf Stream was the weakest it had been in 5 years
http://notrickszone.com/2013/10/23/meteorologist-gulf-stream-weakens-to-lowest-level-in-five-years-may-bode-ill-for-europes-winter/#sthash.GJYNV6aR.dpbs
And then Michael Mann checks his proxies and confirms NW Europe is set to freeze.
http://www.resilience.org/stories/2015-03-26/deep-concerns-as-climate-impacts-on-gulf-stream-flow#
Oh that old Gulf Stream
I shouldn’t but…http://www.dailymail.co.uk/news/article-191830/Sizzling-UK-records-hottest-day-ever.html