Guest Post by Bob Tisdale
And that’s why the 2014/15 El Niño appears so weak…and has disappeared from NOAA’s Oceanic NINO Index with their new ERSST.v4 data. If we look at the tropical Pacific as a whole though, the 2014/15 El Niño was a relatively strong El Niño—stronger than many El Niños during the satellite era. This post reinforces a few of the points made in the December 2014 post Did ENSO and the “Monster” Kelvin Wave Contribute to the Record High Global Sea Surface Temperatures in 2014?
INITIAL NOTE
NOAA and other weather agencies around the globe monitor the sea surface temperature anomalies of the NINO3.4 region for numerous reasons. The possible impacts of the variations in NINO3.4 region surface temperatures on surface temperatures and precipitation around the globe are well studied. This post is in no way intended to cast doubt on those studies. The NINO3.4 sea surface temperatures are a very useful ENSO index. This post does show, however, that occasionally we miss things when we define an ENSO event using one metric.
INTRODUCTION
NOAA uses the sea surface temperatures of a portion of the equatorial Pacific to determine the strength of an El Niño and to list that ENSO event on their Oceanic NINO Index, assuming it meets their requirements. That portion is called the NINO3.4 region, which is bordered by the coordinates of 5S-5N, 170W-120W. See the map here. But as we’ve noted a number of times in the 2014/15 El Niño Series posts, the 2014/15 El Niño was not focused on the NINO3.4 region. In fact, of the NINO regions, the NINO3.4 region was least impacted by the El Niño processes…the El Niño blossomed east and west of the NINO3.4 region. We can see this in the Hovmoller diagram of equatorial sea surface temperature anomalies from the NOAA GODAS website for 2014, Figure 1. I’ve highlighted the longitudes of the NINO3.4 region in grey.  Figure 1
Let’s drop back a year. As you’ll recall, early in 2014 a huge pocket of warm water from the West Pacific Warm Pool migrated eastward along the Cromwell Current (a subsurface equatorial Pacific current that travels from west to east, also known as the Pacific Equatorial Undercurrent). See the gif animation of the equatorial subsurface temperature anomalies for January through June 2014 here. Alarmists went berserk with all sorts of proclamations, including a “Super El Niño” for 2014/15 (that didn’t develop) and that the unprecedented “monster Kelvin wave” that initiated the El Niño was fueled by anthropogenic global warming (which we dispelled by showing that the ocean heat content of the tropical Pacific was lower leading into 2014 than it was before the 1997/98 El Niño. See the post The 2014/15 El Niño – Part 2 – The Alarmist Misinformation (BS) Begins.).
Alarmists have short memories… conveniently short. (Recalling their failed predictions would take all of the fun out of alarmism.) When the Super El Niño failed to form later in the year, and when the sea surface temperatures in the NINO3.4 region did not even qualify to be registered as an El Niño in NOAA’s Oceanic NINO Index until April of this year, the alarmists forgot all about all of that naturally (sunlight-) created warm water that had migrated to the east earlier in 2014. To alarmists, the elevated surface temperatures in 2014 were no longer associated with the warm water associated with that “monster” Kelvin wave. But in the real world, that warm water didn’t just disappear…only from the memories of alarmists.
NOTE: As we discussed a few days ago in the post Weak El Niños and La Niñas Come and Go from NOAA’s Oceanic NINO Index (ONI) with Each SST Dataset Revision, in April 2015, NOAA listed the 2014/15 El Niño on its Oceanic NINO Index (the ONI based on their ERSST.v3b data), but two months later, with the release of NOAA’s ERSST.v4 data, the 2014/15 El Niño has dropped off of the present Oceanic NINO Index. [End note.]
WHERE DID ALL OF THAT WARM WATER GO THAT’S ASSOCIATED WITH THE ALARMISTS’ “MONSTER” KELVIN WAVE?
The warm water that had travelled east early in 2014 had to go somewhere. As illustrated above in Figure 1, some of the warm water upwelled to the surface east and west of the NINO3.4 region along the equatorial Pacific. Thus, the goings on in the NINO3.4 region hardly showed up in a graph of the sea surface temperature anomalies there, Figure 2.  Figure 2
According to interviews with Kevin Trenberth and Axel Timmerman in the November 2014 article Warming Pacific Drives Global Temperature at ReportingClimateScience, some of the warm water migrated poleward along the west coasts of the Americas:
Next, a series of waves of warm water – known as Kelvin waves – moved across the Pacific from the west near Indonesia to the east and these were interpreted as signs that an El Nino Pacific Ocean warming event may be about to take place. Trenberth explained to reportingclimatescience.com that, as a result of this movement of water, sea levels rose in the central and eastern Pacific and fell back in the western Pacific. However, this warm water did not trigger the expected full blown El Nino. Instead, the warm water moved across the Pacific until it hit the western coast of the Americas and moved north and south – warming coastal waters along the west coast of North America as far north as Oregon and causing a warming of the north eastern Pacific Ocean waters from April through to September.
We further discussed those Coastally Trapped Kelvin Waves in the post Axel Timmermann and Kevin Trenberth Highlight the Importance of Natural Variability in Global Warming…
Some of the warm water from the initial Kelvin wave in 2014 broke away from the equator and was recirculated west, where it helped supply the warm water for a second, less powerful downwelling (warm) Kelvin wave in 2014. That secondary downwelling Kelvin wave helped raise the sea surface temperature anomalies of the equatorial Pacific again toward the end of last year. We first presented this peculiarity in the July 2014 post The 2014/15 El Niño – Part 14 – Warm Water Recirculated?
And last, but not least, we can look at the sea surface temperature anomalies of the tropical Pacific as a whole, Figure 3, and see something entirely different than the data for the NINO3.4 region (Figure 2 above). We’re using the coordinates of 24S-24N, 120E-80W for the tropical Pacific. There appears to have been a very noticeable warming event in tropical Pacific in 2014. This suggests that part of the warm water from the Kelvin waves was simply distributed throughout the tropical Pacific…instead of remaining focused on the equator.  Figure 3
And just in case you’re concerned about the minor trend of less than +0.03 deg C/decade over the past 3+ decades, the sea surface temperature anomalies for the tropical Pacific have been detrended in Figure 4. The warming event—a tropical Pacific-wide El Niño?—is still very noticeable.  Figure 4
LET’S COMPARE THE EVOLUTION OF THE 2014/15 EVENT IN THE TROPICAL PACIFIC (AS A WHOLE) TO THE OTHER EL NIÑOS OF THE SATELLITE ERA
For the rest of the post, we’ll be presenting the detrended sea surface temperature anomalies of the tropical Pacific. We’re also using NOAA’s Oceanic NINO Index to determine which events were El Niños.
We’ll start with comparisons of tropical Pacific temperature anomalies (detrended) during the evolutions of the strong El Niño events of 1982/83, 1997/98 and 2009/10. See Figure 5. There’s no comparing the evolution of the 2014/15 event (or the others) to the 1997/98 event. The 1997/98 event was in a league of its own. The 2014/15 event, however, ended the year weaker than the 1982/83 and 2009/10 events, but the evolution of the 2014/15 event was stronger than the 1982/83 El Niño for much of their respective years.  Figure 5
The only other multiyear El Niño during the satellite era was the 1986/87/88 El Niño. See Figure 6. The 1st year evolution of the event in 2014 was much stronger than in 1986 based on the detrended data for the tropical Pacific, and the second year of the current event (2015) is much stronger than 1987. 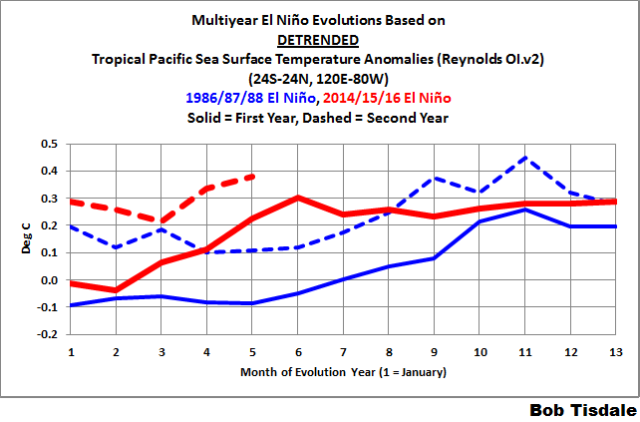 Figure 6
Next up in Figure 7 are the 2002/03, 2004/05 and 2006/07 El Niños along with the 2014/15 event. Based on the detrended data for the tropical Pacific, they all evolved differently, but the 2014 evolution peaked near the values of the others late in their respective years. From May to October, however, the 2014 event was stronger than the evolution of the 2002/03 El Niño. And from April to November, 2014 was definitely stronger than the 2004/05 and 2006/07 events.  Figure 7
Last are the 1991/92 and 1994/95 El Niños. See Figure 8. From April on, based on the detrended sea surface temperature anomalies of the tropical Pacific, the evolution of the 2014 event dwarfed the 1991/92 and 1994/95 events.  Figure 8
CLOSING
If we focus on the tropical Pacific, then the El Niño processes in 2014 resulted in a relatively strong event…definitely much stronger than what is reflected in the surface temperatures of the NINO3.4 region. The natural warming of the tropical Pacific in response to the two downwelling (warm) Kelvin waves last year helped to make 2014 the (possible) warmest year on record for the GISS, UKMO and old NOAA global land+ocean surface temperature datasets. But as discussed in the post Did ENSO and the “Monster” Kelvin Wave Contribute to the Record High Global Sea Surface Temperatures in 2014?, The Blob in the eastern extratropical North Pacific was the primary cause of the uptick in surface temperatures last year.
NOTE: The unrealistic recent warming in the new global land+ocean surface temperature data from NOAA, on the other hand, is of course dependent on NOAA’s excessive and unjustifiable bias adjustments to their sea surface temperature during the hiatus. See the Open Letter to Tom Karl of NOAA/NCEI Regarding “Hiatus Busting” Paper.
SOURCE
The Reynolds OI.v2 sea surface temperature data are available from the KNMI Climate Explorer.
Shebang, she wrote,
The hot for broke;
Stir the poke
Salad Annie folk.
============
Interesting. I see the “poke salad Annie” reference. The rest begs translation.
We are in trouble if the definitions of what constitutes an El Nino or what constitutes a hiatus for that matter depend on the whim of a single person.
I can assure you neither the El Nino nor the hiatus definitions depended on a single person.
But the point is as relevant if group think persists amongst those that ‘control’ the data and/or define the terms and/or are seen to be the only people/group of relevance.
+1 and that’s what I’m referring to as well.
Yeah, if you shift the goal posts for defining an El Niño, then it’s a really strong El Niño. That’s like saying “we like it better this way, so we’ll use this definition this time.” Then when it’s a different definition that supports a strong El Niño, they’ll switch to that definition.
(┛ಠДಠ)┛彡┻━┻
What’s really interesting is the lack of warming in the troposphere during the 2014 El Niño. Through the first half of 2015 the temperature has been lower than most previous events. Does this mean the heat is still waiting to be released?
It means that surface thermometers show that heat was released at the surface but never made it to the lower troposphere. Maybe it got sucked up by all those cold surface thermometers? More likely it very really existed.
“More likely it very really existed.”
What’s that in English?
It’s interesting to note that following the 1986/87/88 3-yr El Nino cycle that Bob mentioned, the following 1988/89 La Lina cycle was one of the coldest since 1950, superseded only by the abnormally cold and long 1973/74/75 and 1998/99/00 La Nina cycles:
http://www.cpc.ncep.noaa.gov/products/analysis_monitoring/ensostuff/ensoyears.shtml
It’ll be interesting to see how cold the 2015/16 La Nina cycle turns out to be, as I suspect it will be quite cold as seen by other La Ninas that follow strong El Nino cycles.
Nature seeks equilibrium, not its own destruction…
Oh sure. Every nova and supernova is an example of Nature seeking its “own equilibrium, not its own destruction…”
/snark
the resulting ball of fast spinning, highly magnetic neutronium or a singularity makes your snark naive. Some matter-energy got blown away, and some got unbelievably crushed.That’s balance.
Since the solar system (including the Earth) is partly composed of elements synthesized in a supernova(s), I wouldn’t snark at them. 🙂
anna, the total energy of the Universe is…zero. No snark required.
Planets and life is made and based on.supernovas
Its axiomatic that the world occupies a zone of equilibrium, supported by our and the worlds existence.
The supernova example is purely to small a part of a system to see the equilibrium.
Just as a day in the middle of winter does not indicate we are in an ice age.
La Nina cycle??
Oh, noes! Another cycle to track?
Sorry, meant the “1988/89 La Lina cycle”.
I think a more useful ENSO index based on a single region of the Pacific is to have that region being Nino 3.4 plus the remainder of the Nino 3 region.
So exclude Japan from being influenced by El Nino?
So, what we are left with is a ” new science ” , not fully defined, not yet fully understood and still useful to the Obama team ” scientists ” when its selected parts fit the agenda. Warm / cold ocean water, depth & extent , along with location & movement – let me be the first to define it as a new part of a larger climate phenom – I have yet to announce a name. Stay tuned.
Interesting stuff, Bob. Thanks.
I understand El Nino events are associated with higher rainfall on the US west coast. Any chance we Californians will benefit from this? Or is this El Nino perhaps in the “wrong” place for that?
The chink-chink-chink- chaaaaaaa ElNino water sprinkler is currently pointed at Texas-NM.,moving slowly left to the AZ- 4Corners area now. By Sept, the nozzle will be in the general direction of So Cal. Cal’s El Nino rains historically have been fall-winter events.
Yes, Bob – thanks for this.
However, I (a SoCal resident) must also ask, where is the rain from this “relatively strong El Nino”? I’m hoping that Gary Hladik is right and we get some rain this fall – may keep our lawns from going “golden” with our water cutbacks.
Oops – Joel O’ Bryna, not Gary Hladik.
Be careful what you wish for. The book linked below (a bit old now) has descriptions of CA when it rains, and rains, etc. Some of the historical reporting is good. Climate science not so much. Worth reading for the actual weather descriptions and related events.
http://www.amazon.com/El-Ni%C3%B1o-Unlocking-Secrets-Weather-Maker/dp/0446679925
Yet another climate ‘goof’ by NOAA, or was it intended? With the current crowd there, one never knows.
Thanks, Bob.
Very interesting. There have been collections of regional weather when an El Niño of the 3.4 type has happened. The so called analog-years approach to forecasting uses such summaries. Seems there is work to be done by those that like this approach.
Yes. That is because this time it is an el nono (intended) NORTHERN oscillation. The instrumentation has never before been in place to detect this feature of the PDO shift.
gymnosperm
Thanks for that comment.
I’ve been a long term watcher of WXmaps since around 1995. And for our area it was pretty bloody good.
And then there was (about two and a half years ago) the high chance el Nino that didn’t.
And since then it seems to have gone to hell as a guide. Gone from where I would tell neighbours to watch it to where I now don’t.
Things I notice
A look at Days 8-14 one evening with possibilities of rain. Then 12 hours later negligible. Then back in another 12 hours. By Day 1 it didn’t rain so I suppose they can claim right.
And one evening hot prospects on the Oz side of the Coral Sea. Next morning on the far eastern side.
Hot prospects in the Gulf of Carpenteria – next day up the top of the Arafura Sea.
The only met input I can think of that changes like this is day and night – and it seems that was under control in the earlier versions?
Or is it somehow ringing?
BTW This means I’m questioning WXMaps but not knocking it – at least they put up their “projections” and in a few days we can see how good they were.
The ENSO is meaningless if they just go back and make it whatever they want it to be.
Someone else needs to fix all their errors now.
Someone else needs to fix all their errors now.
One if by land, two if by sea.
“One if by land, two if by sea.”
Are you talking about the adjustment, or proposing a revolution?
The timing of this El Nino could not be worse, except if you are a Californian resident desperate for rain this upcoming winter.
The approximate 6 months lag in global temperature following El Nino conditions in the central Pacific means that these should peak around the time of the Paris fiasco later this year. You can already hear the alarmists trumpeting “warmest year ever” and “told you so, the hiatus is over”, conveniently forgetting the fact that it was all El Nino caused.
Peter Millar. No it’s not all El Nino caused. If you start from a high place you end up in a higher place. El Nino is not the cause of the warming trend we see, it is the ripple on the water of a rising pool. Take a look at the graph all skeptics love, Roy’s UAH
http://www.drroyspencer.com/latest-global-temperatures/
Now look at where the 1998 El Nino started. You will see it is considerably lower than today. Roy is going to need a new graph if we get a similar El Nino to that one.
According to the UAH chart, the last La Niña (2011 and first half of 2012) had approximately the same global temperatures which preceded and followed the 1998 El Niño, so your point is?
I did not check the highly homogenised/manipulated/tortured land based statistics.
Peter Miller…. “I did not check the highly homogenised/manipulated/tortured land based statistics.” You mean the ones down here where we actually live?
“According to the UAH chart, the last La Niña (2011 and first half of 2012) had approximately the same global temperatures which preceded and followed the 1998 El Niño, so your point is?” My point is La Nina’s are a cool place to start. Why would you think of using that point unless you wanted to distort the obvious warming trend? Our launching place is far higher now and will almost certainly result in records being broken and Roy needing a new graph.
Based on current Peruvian fish meal prices the anchovies still don’t seem worried. http://www.indexmundi.com/commodities/?commodity=fish-meal&months=120
Bob, I’m wondering if higher temperatures in the North Pacific are related to this behaviour and are we seeing a longer term period of elevated heat rejection without the obvious spike in sea and air temperatures typical of “normal” el Nino events?
You argue the science,
But ‘warming’ is not about science,
It’s a political agenda,
That demands our compliance.
http://rhymeafterrhyme.net/theres-something-afoot/
“This post does show, however, that occasionally we miss things when we define an ENSO event using one metric.” ~ Bob T.
It seems climate “science” is full of examples of only looking at one metric and then seeing what you want to see. (“Man sees what he wants to see and disregards the rest” ~ Paul Simon)
“NOTE: The unrealistic recent warming in the new global land+ocean surface temperature data from NOAA, on the other hand, is of course dependent on NOAA’s excessive and unjustifiable bias adjustments to their sea surface temperature during the hiatus.” ~ Bob T.
I am shocked. Shocked! I had no idea there was cheating going on at Rick’s place.
In the last 10 to 20 years it seems like every time I turn around some outfit is changing their historical data set in some way or their methods. We should never have bought those guys those time machines so they could go back in the past and take their own readings.
It is high time we look a serious look at the James Hansen promoted delusion that the earth is warmed via CO2 and other “greenhouse gases”. At the very least, the luke-warmers should admit that CO2 does darn little if it does anything. Two decades of no warming whilst CO2 concentrations where going up and up should settle that score.
As a lukewarmer, that depends on how one defines darn little. We lukewarmers are all about “how much”.
But everything that is found to contribute must be “subtracted” from CO2. (Aerosols spring to mind.)
“As a lukewarmer, that depends on how one defines darn little.” ~evanmjones
I wrote, “At the very least, the luke-warmers should admit that CO2 does darn little if it does anything.” I should expect that even the luke-warmers, such as you identify as, should see that CO2 does almost nothing. I doubt you will get to my view that CO2 cools more than warms anytime soon, but even a loose inspection of the laws of thermodynamics would lead one to see that CO2 does not do what alarmists and luke-warmers think it does.
Mark;
Bill Gray documents its failure and derives an ECS of 0.3:
http://tropical.atmos.colostate.edu/Includes/Documents/Publications/gray2012.pdf
The models all share this error.
Bob
We should not just abandon the original Nino3.4 statistics and use . If we want to propose a new wider area “Nino like situation” as well , lets call it something else like Pacific Regional EL Nino. , but keep the original area Nino3.4 as well. . This current phenomena may turn out to be just a short term hiccup for all we know.. The problem with the NOAA analysis was not that they invented a new area , they just kept interpreting the same El NINO four different ways. in, out, in, and now out again to suit the global warming agenda and never explained why .. Then they further confused things by the across the board adjustment of Ocean SST’s
An interesting observation is that the blob in the North Pacific appears to some degree every time there was an El Nino and migrated from east to west and then it subsequently subsided. This time it has continued for a much longer time frame .
This isn’t much of an “El Nino”. The trade winds are pretty much still nominal. Some slackening in the far eastern Pacific but that area currently has a cool anomaly. Weather pattern along the US west coast still entrenched in that “La Nada” pattern.
What constitutes a strong evolution with regards to an El Nino event? Is it that it started with a higher temperature? Forgive my ignorance. I’m over my head at this site.
Sorry but can this article be summarized in one paragraph or so? I read it in its entirety but missed boat. I must be one of rush’s LIVs
JBP,
The 2014/15 El Niño Was Not Focused on the Region Used By NOAA for their Oceanic NINO Index
said Bob Tisdale –
And that’s why the 2014/15 El Niño appears so weak…
Regards – Hans
And – Thanks, Bob Tisdale!
Hans