Guest Post by Bob Tisdale
I wasn’t too surprised to find Joe Romm’s June 16, 2015 blog post 2015 May Bring Long-Awaited Step Jump in Global Temperatures at the climate alarmist website ClimateProgress. For more than 2 years, his buddy Kevin Trenberth of NCAR has been promoting El Niño-caused upward steps in global surface temperatures. But what Romm fails to recognize: a skeptic was the first to note this is how, when and why much of the global surface warming has occurred since the early 1980s. Joe also fails to tell his readers that El Niño events are fueled by sunlight, according to Kevin Trenberth.
Joe Romm’s post also includes a classic sleight of hand and a reference to a dataset that even climate scientists are skeptical of. Let’s dismantle his blog post.
THE EL NIÑO STEP DISCUSSIONS
The post began:
Historically, the global temperature trend-line is more like a staircase than a ramp. We now appear to be headed for a step-jump in global temperatures — one that scientists have been expecting.
The post linked in the above quote is Joe Romm’s April 2015 post Long-Awaited ‘Jump’ In Global Warming Now Appears ‘Imminent’. In it, he presents snippets of a post at LivingOnEarth and of his interview with Kevin Trenberth of NCAR. Trenberth is back promoting El Niño-caused “big jumps” in global warming (Romm’s boldface):
How much of a temperature jump should we expect? Last month, Trenberth explained to Living on Earth:
Trenberth says it could mean a rise of two- or three-tenths-of-a-degree Celsius, or up to half a degree Fahrenheit. The change could occur “relatively abruptly,” but then stick around for five or 10 years.
I interviewed Trenberth this week, and he told me that he thinks “a jump is imminent.” When I asked whether he considers that “likely,” he answered, “I am going to say yes. Somewhat cautiously because this is sticking my neck out.”
Back to Joe’s more recent (June 16) post: He then goes off onto multiple tangents, which will be discussed in a moment. After those “squirrel”-like focus diversions, Joe Romm returns to the topic of El Niño toward the end of his short post:
Climatologist Kevin Trenberth has explained that “a global temperature increase occurs in the latter stages of an El Niño event, as heat comes out of the ocean and warms the atmosphere.” This week, NOAA released its monthly El Niño Southern Oscillation [ENSO] report, which concludes, “There is a greater than 90% chance that El Niño will continue through Northern Hemisphere fall 2015, and around an 85% chance it will last through the 2015-16 winter.”
So — barring a massive volcanic eruption in the next few months — 2015 is all but certain to become the hottest year on record by far. And if the growing El Niño does extend into next year, than 2016 will be another blistering year.
The ClimateProgress post by Kevin Trenberth linked in the above quote is actually a cross post of Trenberth’s 2-year-old (May 2013) article Has Global Warming Stalled? published by the Royal Meteorological Society. It’s the first of his “big jumps” discussions. In that article, Trenberth shows (poorly) the upward steps caused by the 1986/87/88 El Niño and the 1997/98 El Niño, but Trenberth failed to explain what caused those steps. Back then you needed to refer to the June 2013 blog post Open Letter to the Royal Meteorological Society Regarding Dr. Trenberth’s Article “Has Global Warming Stalled?” (The cross post at WattsUpWithThat is here.)
It took a few months after my open letter to the RMS before Trenberth admitted that it was El Niño events that caused the upward steps. See the August 2013 interview with Trenberth on NPR. Trenberth also discussed an El Niño-caused upward step in global surface temperatures in his May 2014 YouTube interview with Peter Sinclair of ClimateCrocks, which we discussed in The 2014/15 El Niño – Part 9 – Kevin Trenberth is Looking Forward to Another “Big Jump”. Now Trenberth is back promoting the big jumps…and Joe Romm, for some reason, is happy to use ClimateProgress to publicize them, too. Go figure.
A QUICK INTRODUCTION TO THE EL NIÑO CAUSED BIG JUMPS
A strong El Niño event can cause a tremendous volume of water from the surface and below the surface of the western tropical Pacific to be relocated to the eastern tropical Pacific, focused primarily on the equator and sometimes running poleward along the west coasts of the Americas. Because the water in the western tropical Pacific is naturally warmer than it is in the east, when it is relocated to the east during an El Niño, the surface temperatures in the eastern tropical Pacific are warmer than normal…an El Niño.
But the El Niño doesn’t consume all of the warm water that made its way to the east. There’s still lots of leftovers, with much of those leftovers below the surface. That leftover warm water is returned to the western tropical Pacific (much of it carried west below the surface just off the equator) when the weather conditions in the Pacific transition from El Niño to La Niña phases. (Keep in mind, El Niños and La Niñas are weather events…of monstrous proportions.) Ocean currents carry that leftover warm water poleward in the western Pacific and into the eastern Indian Ocean, where it rises to the surface and surface temperatures warm in what appears to be an upward step jump. With time, ocean currents carry the leftover warm into the western Indian Ocean and the South Atlantic as well.
You can actually watch the leftover warm water being returned from the eastern tropical Pacific to the west in the gif animation here of sea level residuals, immediately after the peak of the 1997/98 El Niño. The animation is from the JPL video “tpglobal.mpeg”. Watch what happens when the leftover warm water reaches the western tropical Pacific. It’s like an El Niño is taking place in the western tropical Pacific, while everyone is focusing their attention of the La Niña taking place in the eastern equatorial Pacific. Also see the full YouTube version of the JPL animation “tpglobal.mpeg”, which runs from 1992 to 2002.
Because the Eastern Pacific Ocean is only the temporary host of the El Niño-related warm water, it shows a very small warming rate during the satellite era, which started in late 1981 for sea surface temperatures. See Figure 1. As a reference, the East Pacific data covers about 33% of the surface of the global oceans and shows warming at only 0.03 deg C/decade. And that trend should drop, of course, during the trailing La Niña.

Figure 1
(Note: Prior to The Blob in the eastern extratropical North Pacific, which made its presence known in 2013, the sea surface temperature data for the East Pacific Ocean showed no warming for more than 3 decades. With The Blob on top of the current El Niño, it’s showing a very small warming rate for 3+ decades. )
But the step-like impacts of the strong multiyear 1986/87/88 El Niño, the 1997/98 super El Niño and the strong 2009/10 El Nino (shown in red) can be seen very easily (Figure 2) in the sea surface temperature data for the South Atlantic-Indian-West Pacific subset…which covers more than 50% of the surface of the global oceans. To help highlight those steps, I’ve included the period-average temperatures before, between and after those three strong El Niños. (That is, the blue horizontal lines are not trend lines.)

Figure 2
That leaves the North Atlantic, but up until about a decade ago, its surface temperature data had shown the additional warming associated with the Atlantic Multidecadal Oscillation. Since then, the sea surface temperatures of the North Atlantic have flattened or cooled slightly. See Figure 3.

Figure 3
Figures 1 through 3 are from the most recent monthly sea surface temperature anomaly update.
TWO THINGS JOE ROMM FORGOT TO MENTION
First: It was a climate skeptic, me not Trenberth, who first noted that strong El Niño events can cause upward shifts in surface temperatures for much of the global oceans, which obviously contribute to the long-term warming trend. See the two part series written in January 2009, four years before Trenberth jumped on the bandwagon:
- Can El Niño Events Explain All of the Global Warming since 1976 – Part 1 (WUWT cross post is here.)
- Can El Niño Events Explain All of the Global Warming since 1976 – Part 2 (WUWT cross post is here.)
Over the next few years, with the help of a multitude of people who commented at WattsUpWithThat and at my blog ClimateObservations, we worked to expose and detail the processes that cause those upward steps. A reasonably easy-to-read overview can be found in the illustrated essay The Manmade Global Warming Challenge (free here). The processes that cause those upward steps are described and illustrated in minute detail in my ebook Who Turned on the Heat? – The Unexpected Global Warming Culprit, El Niño-Southern Oscillation (available here at the discounted price of U.S. $5.00. Please buy a copy to support a skeptic.)
Oddly, Joe Romm is now promoting a skeptical view that strong El Niño events cause long-term global warming through “step-jump” effects.
Second: Romm overlooks something critical to this discussion…something that has been presented a couple of times in peer-reviewed papers by his chosen El Niño expert Kevin Trenberth: El Niño events are fueled by sunlight. Maybe Trenberth forgot to mention this to Joe.
We’ve presented these quotes from Trenberth-authored papers numerous times over the past few years. But for those new to these discussions:
The first quote is from Trenberth et al. (2002) Evolution of El Niño-Southern Oscillation and global atmospheric surface temperatures (my boldface):
The negative feedback between SST and surface fluxes can be interpreted as showing the importance of the discharge of heat during El Niño events and of the recharge of heat during La Niña events. Relatively clear skies in the central and eastern tropical Pacific allow solar radiation to enter the ocean, apparently offsetting the below normal SSTs, but the heat is carried away by Ekman drift, ocean currents, and adjustments through ocean Rossby and Kelvin waves, and the heat is stored in the western Pacific tropics. This is not simply a rearrangement of the ocean heat, but also a restoration of heat in the ocean.
That paragraph is the basis for my constant description of ENSO as a chaotic, naturally occurring, sunlight-fueled, recharge-discharge oscillator, where El Niño events act as the discharge phase and La Niña events act as the recharge and redistribution phase.
The second quote is from Trenberth and Fasullo (2009) Tracking Earth’s Energy: From El Niño to Global Warming. It confirms the cause of the increased sunlight over the tropical Pacific during La Niña events, and the role that temporary blast of sunlight plays (my boldface):
Typically prior to an El Niño, in La Niña conditions, the cold sea waters in the central and eastern tropical Pacific create high atmospheric pressure and clear skies, with plentiful sunshine heating the ocean waters. The ocean currents redistribute the ocean heat which builds up in the tropical western Pacific Warm Pool until an El Niño provides relief (Trenberth et al. 2002).
In the post Open Letter to the Royal Meteorological Society Regarding Dr. Trenberth’s Article “Has Global Warming Stalled?”, we confirmed that sunlight provides the warm water that serves as fuel for El Niños. It can’t be downward longwave (infrared) radiation, because infrared radiation decreases during La Niña events, when the ocean heat in the tropical Pacific is replenished. Also see the more recent post New Paper Tries to Explain Disparities in Deep Ocean Warming Between Two Basins.
So, without his knowledge, Joe Romm is promoting naturally occurring global warming, fueled by temporary blasts of sunlight over the tropical Pacific during La Niñas…or maybe he knows and he just doesn’t want to advise his readers. That would take all of the fun out of being an alarmist…and he wouldn’t want that.
ROMM SLEIGHT OF HAND
In his June 16 post, Joe Romm states and includes the following graph after the opening paragraph:
NASA reported this week that this was the hottest five-month start (January to May) of any year on record. Climate expert and UK Guardian columnist John Abraham put together this chart of how the start to 2015 compares to previous years:
As Abraham notes, “2015 is a whopping 0.1°C (0.17°F) hotter than last year, which itself was the hottest year on record.”

Did you note the sleights of hand in John Abraham’s graph and Joe’s discussion of it? That graph compares the average surface temperature anomalies for January-May 2015 (the first 5 months of this year) to the ANNUAL surface temperatures from 1880 to 2014 based on the GISS global land-ocean temperature index. The fact that he’s not comparing comparable annual time periods doesn’t come across clearly in Romm’s introduction. If John Abraham had bothered to show the January to May averages for each year, my Figure 4, the data would have shown that 2002, 2007 and 2010 values were also greater than the +0.7 deg C upper range of his graph. That is, the data for those years would be off the graph too.

Figure 4
And Joe Romm didn’t bother to tell his readers that the January to May 2015 average for the GISS LOTI data was +0.766 deg C, which is only 0.006 deg C higher (that’s read 6 one-thousandths of a deg C) than the January to May value of +0.760 in 2010. That 0.006 deg C difference is minuscule, well within the uncertainties of the GISS data.
ROMM FOCUS DIVERSION 1
In his June 16th post, Joe Romm continues:
The recent study, “Near-term acceleration in the rate of temperature change,” explains why a speed up in the rate of global warming is imminent — with Arctic warming rising up to 1°F per decade by the 2020s.
Oddly, that linked post has nothing to do with El Niño events or the “big jumps” associated with El Niño events. It’s about the recent alarmist paper Smith et al. (2015) Near-term acceleration in the rate of temperature change, which has two strikes against it right off the get go. (1) It treats proxy-based paleoclimatological temperature data as though they were reality. (2) It treats climate model projections as if they’re credible.
ROMM FOCUS DIVERSION 2
His June 16 post continues with a discussion of ocean heat content and a graph of the NODC’s data…again, nothing to do with the step changes in surface temperatures caused by strong El Niños:
More than 90 percent of global heating goes into the oceans — and ocean warming down to 2000 meters (1.24 miles) has accelerated this century, as this recent NOAA chart shows:
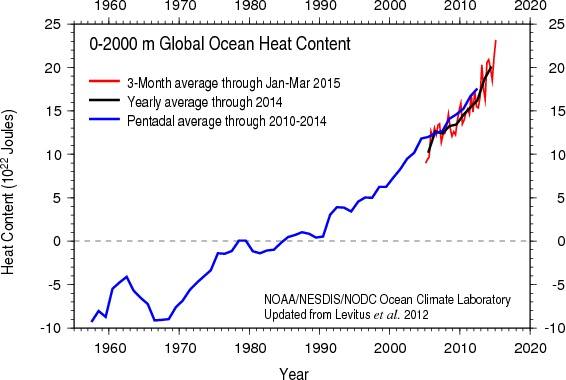
Joe even presents the NODC data to depths of 0-2000 meters and claims the warming is accelerating, as if the data to those depths prior to the ARGO era represent the real world. The reality is that there are very few observations at those depths prior to ARGO, so it’s basically a make-believe dataset before about 2003. And he seems to forget something that’s just as important: the ARGO-based data have to be adjusted to show warming of those magnitudes. See the posts:
- Is Ocean Heat Content Data All It’s Stacked Up to Be?
- AMAZING: The IPCC May Have Provided Realistic Presentations of Ocean Heat Content Source Data
WILL SURFACE TEMPERATURES JUMP IN RESPONSE TO THE 2014/15/16 EL NIÑO?
It’s very possible that surface temperatures could make a Trenberth “big jump” in response to the current multiyear El Niño. A tremendous volume of warm water has made its way into the eastern tropical Pacific in 2014 and 2015—a response to El Niño processes. If history repeats itself, we could see an upward shift in surface temperatures.
In the post The 2014/15 El Niño – Part 9 – Kevin Trenberth is Looking Forward to Another “Big Jump” last year, in fact, I showed a couple of possibilities in Figure 2 of that post, which is included here as Figure 5. As we well know, the El Niño did not develop into a super El Niño in 2014, but conditions this year are much stronger. So in your mind’s eye shift the upward step back a year…there’s no reason for me to update that graph since it was shown only for illustration purposes, not as a prediction. The graph simply assumes that surface temperatures will shift the 0.2 to 0.3 deg C as Trenberth suggested and that surface temperatures afterwards will follow what happened after the 1997/98 El Niño.

Figure 5
CLOSING – ALARMISM ON STEROIDS
You gotta see this! Gotta!
Joe Romm closes his June 16th post with a link the Amazon webpage for his book Hell — and High Water, published in 2006:
We are building a staircase to … Hell — and High Water.
Following the links, I came to the Kindle webpage and its preview. The following illustration is a screen cap that includes the first two paragraphs of its Introduction.

The “ice sheets shrinking 100 years ahead of schedule”, comically, illustrates a climate model failing. Funny that Joe Romm can’t see that.
“inland United States”…“ 10° F hotter”…“ravaged by mega-droughts”…”widespread wildfires”…“drowning from a 5- to 10-foot increase in sea level”… “relentlessly climbing 5 to 10 inches a decade or more”…“ultimate sea level rise of 80 feet”…“as soon as the second half of this century”.
WOW!
I’ll let you readers comment on that. Then again, you might not want to waste your time.
NOTE TO KEVIN TRENBERTH
Kevin, I’d be happy to co-author a paper with you about these upward steps in global surface temperatures caused by strong El Niños. If you like, we could even make it Trenberth and Tisdale (2016). Has a catchy ring to it, doesn’t it? Feel free to leave me a note at my blog Climate Observations if you’re interested. If you’d like to wait until after you retire from NCAR, that’s fine too. Maybe we could get a head start on it, though.
Cheers.
I’d prefer Tisdale and Trenberth (2016)….
I was going to say that, since ‘i’ comes before ‘r’.
Great post, Bob. As ever, informative, educational and entertaining. But you should try and get a newspaper interested in your pieces, they need a wider audience.
Me too. I don’t think Trenberth would let the co-author order stand in his way of writing a joint paper. There might be other considerations, silly as the idea sounds.
Jesus, they sound like some apocalypse cult, *rooting* for the end of the world. “The El Niño will come and jumpstart global warming, yay!”
What in hell is wrong with those people?
What in hell is wrong with those people?
Answer MONEY, LOTS OF LOVELY MONEY.
These people are climate pimps. Out of the mold of all pimps. Their creed is something for nothing. Also true all pimps are crooks always looking to work the system. They care nothing about the consequences of their actions or the lies they constantly spin.
Money is just a sideshow. Power is the goal.
Who’s behind the money, and what is their agenda??
Gary M, don’t start seeing conspiracy theories like ‘rulers of the world’, it’s just a left-wing idea of control (also used by the right, as it’s convenient). If climate change wasn’t there (it isn’t, it’s stable!) then it would be something else. Governments need to control. There was an excellent TV series a while back called The Power Of Fear (I think). It is how governments use the idea of terrorism and war to do whatever they want. They can tax climate change and draw in huge funds – as Britain’s government does…billions. Even our car (road) tax here in the UK is based on how much CO2 your car emits. It’s quite incredible, when you think about it.
Lucius: Yet they never, ever tell you WHY a fraction of a degree change in GAT (whatever that is) is going to be so disastrous.
I know this is an old argument (I’ve never heard it disputed), but if the ‘average climate’ in Chicago is around 23 Deg C, and the ‘average climate’ in Florida is around 26 Deg C, what are the down-sides to moving from Chicago to Tampa? And do the people who have moved there know they are doomed because they have exceeded the dreaded TWO deg C threshold?
Absolutely. This is a claim on which experience would suggest that the climate scientists are almost certainly wrong since we know that bio diversity thrives in warm wet conditions, and is at its least in cold arid conditions. If one wants to look back in time at the attainment of civilisation and skills (move from Bronze Age to Iron Age) one will see that it is temperature dependent. Warmer climates develop skills and civilisation sooner. It is no coincidence that whilst the Ancient brits were building Stonehenge, the Egyptians were building the Great Pyramid.
i often point out that there is an about 6 to 8 degC difference between temperatures accross the UK.
Why would it matter if temperatures in Scotland became more like the borderss, the temperature in the borders more like Northern wales, the temperatures in Northern Wales more like the Midlands, the temperatures in the Midlands more like the South West, the temperatures in the South West more like the South East, the temperatures in the South East more like the Channel Isles, and the Channle Isles more like Brittany in France.
Whats not to like about that? Most people would consider such a climate chaneg a God Send.
In any event, the UK surronded by oceans temperature changes/climate shifts would be tampened by the oceans so it would be a very gradual change/process unless something extraordinary were to happen to the Gulf Stream.
Since the UK is surrounded by oceans and since the topography does not change, rain will always fall in the more mountainous regions no matter which way the wind blows.
What is wrong with a 2 to 4 degC change. Heck many UK citizens retire to Spain which is about 12 degC warmer than the UK (may be 8 to 9 deg C warmer than the South of the UK, but more than 12 deg C warmer than Scotland), and most find the Mediterranean Climate great, and preferrable to that of the UK.
The only down side to a warming globe is sea level rise, which is a gradual process and to which man can easily adapt. .
LVS
This. Very much this.
‘”This week, NOAA released its monthly El Niño Southern Oscillation [ENSO] report, which concludes, “There is a greater than 90% chance that El Niño will continue through Northern Hemisphere fall 2015, and around an 85% chance it will last through the 2015-16 winter.”
So — barring a massive volcanic eruption in the next few months — 2015 is all but certain to become the hottest year on record by far. And if the growing El Niño does extend into next year, than 2016 will be another blistering year.”
None of this may be valid as NOAA also this week cancelled the 2014/2015 El Nino that previously had ran from OCT 2014- April 2015
So can anyone figure out this double talk coming from NOAA?
http://www.bom.gov.au/climate/enso/
The El Nino was taking all the emphasis out of the record warmest year propaganda. So, disappear the El Nino and now 2014 is the hottest ever without an El Nino. Science once again takes a back seat to propaganda.
El Nino does not add any energy to the long term global balance.
La Nina does not remove any energy from the long term global balance.
ENSO is just a large Lavalamp. Leave it on for a while and you will see.
The Abraham graph looks like GISTEMP, it’s mostly adjustments. The 1930s were the warmest decade in the industrial era.
bw says: “El Nino does not add any energy to the long term global balance. La Nina does not remove any energy from the long term global balance.”
Both El Nino and La Nina events have strong impacts on the global energy balance. Even Trenberth understands this. In fact, that was one of the points of his Climategate email to Michael Mann, the one that followed Trenberth’s travesty email. To paraphrase, they didn’t have a system in place that could track the ENSO-related energy, where it came from and where it went.
Due to variances in cloud cover due to SST and trade wind conditions, ENSO oscillations can indeed add or deflect solar energy into the storage battery.
http://profs.princeton.edu/leo/journals/Atmos/Li-etal-CloudsAtmosAbsorption-Nature1995.pdf
Old but good. Strangely enough, modelers chose not to incorporate cloud variances. Hmmmm. I wonder why?
It is not a question of whether it adds any energy to the system, but rather whether it releases energy from the oceans which then warms the atmosphere or is retained within the atmosphere on a short term basis by which I mean possibly for 100s of years.
The material point is that in none of the temperature data sets is there any first order correlation between CO2 and temperature, and there is no straight line linear trend fit to the temperature rises that are seen.
The inescapable fact is that since the satellite record began, the only changes in temperatures have been step changes and have resulted from the aftermath of El Nino events and these events are natural in origin, not driven by manmade emissions.
From the satellite record one is forced to conclude that climate sensitivity to CO2 is so small that it cannot be seen above the noise of natural variation using our most advanced and sophisticated measuring devices.
I’ve said before, el Nino being fuel by sunlight is irrelevant. The steps could well demonstrate the increasing greenhouse effect since a lack of decline in temp is what the ghe is. That said, it pretty much precludes positive feedbacks and high sensitivity.
aaron, it’s not irrelevant. Until the climate science community can properly track variations in downward shortwave radiation at the surface of the oceans, they have no way of knowing how much of the global warming is anthropogenic. Now, the modelers assume the warming must be from greenhouse gases, because they can’t simulate (or won’t simulate) properly the naturally occurring processes that can cause global warming.
I have said it before and i’ll say it again, Kevin Trenberth is a dishonest activist, got nothing to do with science.
https://roaldjlarsen.wordpress.com/
“dishonest activist”
Which is not to be confused with a “honest activist”, something Diogenes would love to shine a light on.
Trenberth has his moments of clarity.
The problem when being dishonest is that you don’t remember all the lies you have told over time. You end up telling the truth from time to time simply because you’re not able to keep track of all the lies.
What is going to determine the future global temperature trend is sea surface temperature trends on a global basis not El Nino/La Nina which only serve to give a refinement to the global temperature trend within a particular climatic regime . ENSO is not going to act to sustain a long term temperature change or bring the climate of the earth into a different climatic regime.
The reason why the global temperature trend has been up for most of last century was mainly due to overall sea surface temperatures warming on a global basis due to very high solar activity. It is visible and long UV light radiation wavelengths that determine the sea surface temperatures and ocean heat content because those are the ONLY energy wavelengths that can penetrate the skin of the ocean surface to any degree of meaningful magnitude and thus warm the sea surface ocean temperatures.
With solar activity in a prolonged minimum state post 2005 if not a bit earlier and the maximum of very weak solar cycle 24 in it’s final phase sea surface temperatures on a global basis are going to head downward. Of course ESNO will still have it’s phases being superimposed upon the overall temperature trend as what had happened last century but this time it will be superimposed over a declining global temperature trend not a rising one. This will come to fruition before this decade is through.
The so called stair step temperature rise is another fabrication of the AGW cult.
I agree with much, of what you say, but the step up after 98 did happen. Not so much after 2010. Why? The solar decrease lag catching up and the AMO is starting to shift.
If we have a strong La Nina, in conjunction with a strongly negative AMO, with a weak sun, I would not be surprised to see a step down and 100 percent of the satellite data set warming disappearing.
Throw in a major volcano in say 2017, and we could well have cooling over the 38 years of the satellite data sets.
On rain and weather.
On past history of rain and weather of the short term / long term.
Great grand father came to U S just at the start of Civil War.
Got to make a choice. Join Union Army or get back on boat.
They saw his service records of being in Austrian Army prior.
At the end he was with Sherman in New Mexico and the Apache horror.
He quit and ended up in Paris Texas and some how married to an Apache lady.
Had some money and some how ended up with farm land in Delta County Texas.
After lots of floods, rain out of crops from the 1870’s on to 1900 he said,
“Go west family, there is only sometimes when there is dry land in Delta County”
Now 115 years later, same thing.
We are just lucky to get 80% of our wheat crop out in Delta County.
Floods, rain, to muddy to get normal combines in fields, got “rice” combines
from Ark. to do the cutting due to the large mud tires they have for the rice fields.
The weather is a cycle, we are in the cycles “weather” we like it or not.
Long cycles, very very long cycles.
The rest is redistribution of your lives’/wealth to others.
“Trenberth and Tisdale” is that like TnT?
If El Nino events cause upward steps in temperature, as it seems that they do…what process restores the temperatures downward (naturally)?
Incoming solar radiation penetrates the ocean to a depth of 100 meters. The ocean radiates infrared from a depth of only 1 millimeter. So heat must travel upward from the 100 m depth to the 1 mm depth to be reradiated. This requires mixing of the surface by thermal convection of the water and mixing by surface winds and is a relatively slow process. So when conditions are unfavorable for surface mixing (El Nino) the ocean continues to trap heat efficiently and you get the upward step. This will eventually be reversed when winds pick up again (La Nina), but only slowly, giving the appearance of a persistent step upward. The ENSO cycle has nothing to do with Global Warming,
pochas, sabrmatt may be referring to figure 5. The point being, where’s the natural fall back?
Figure 5? Try this one instead.
http://i279.photobucket.com/albums/kk145/pochas_2008/UAHGlobalTemps.png
Red is a 12 month smooth. Blue is monthly data The trend for the period Feb 1997 to May 2015 is -0.00108 degrees C per decade. There are reasons to expect an upcoming cooling, a negative PDO (expect mostly El Niños for 20 – 30 years), a string of weak solar cycles leading to a Grand Minimum in ~2040.
sabrmatt, we unfortunately have to wait for that to occur. Keep in mind, we only have a few decades of satellite-based measurements of numerous metrics, and still no measurements of the amount of sunlight reaching the oceans.
The El nino – triggered stair step mechanism for global warming , analogous I suppose to “punctuated evolution ” in biology , is an attractive one , but does run into difficulties on a historical basis.
El Ninos and the relaxation from them have been a feature of the world climate for at least hundreds of years according to historical records . The complications of WMP and LIA may make it difficult to attribute subsequent temperature effects following El Ninos (and they would tend to be land temperatures anyway I imagine) before 1850 , but since that date there must be about 30 events , of which say 10 would be strong enough to result in a permanent temperature rise . But that would mean a greater ruse relative to 1850 than observed if each event is equivalent to 0.2-0.3C.
Only in recent years, ie with increased anthropogenic CO2 production, does this permanent step appear so it would seem that the El Nino does after all need the long wave IR contribution from greenhouse gases to produce a long term warming.
But , that would mean that each successive El Nino of comparable strength would result in increasing step heights (since CO2 concn is constantly increasing) . I am not sure that that is true , although the no of suitable events to check this is so small. I wonder if there is , as Salvatore suggest above , a 3rd component to the stair step mechanism , one of natural variation which sometimes works with , sometimes decreases, the CO2 effect..
So,if I heat a pot of water over a wood fire, it will boil and produce steam. But if I put a pot of steam over a pile of wood, the wood will not start on fire. We are told increasing CO2 will increase the temperature. If I sleep on frozen ground, I will freeze. If I sleep on frozen ground on a blanket, I will still freeze, just a little slower. I conclude something is heating the earth up and the GHG “blanket” simply changes the rate (of cooling or heating). At least that is what the downloads of local historical temperatures suggests to me, but then I am not a scientist, just an engineer who has been looking up “weather” history for nearly a half century in order to “design” things that will withstand the elements.
mikewaite says: “Only in recent years, ie with increased anthropogenic CO2 production, does this permanent step appear so it would seem that the El Nino does after all need the long wave IR contribution from greenhouse gases to produce a long term warming.”
Now, there’s an massive assumption. There is no way to know for a fact that El Ninos are not associated with the warming from the 1910s to the 1940s. The source data are too poor and too sparse. Sea surface temperature data then are “reconstructed”, and have been adjusted beyond recognition.
But we have also noticed that cooling cycles turn to La Nina and El Nada dominance, as now. The solar integral can favour a longer cycle in either direction. Watch and see, the past will repeat, unless something unusual happens!
It seems to me that El Nino events do NOT store heat that magically increases in steps. But as even the post itself points out, ENSO events redistribute existing stored heat in time and space – they create no heat themselves. What heat they release to the air is lost to the water – and vice versa for La Nina . Strangely one might expect albedo effects to change the H2O greenhouse effect – but those do not show up clearly in the climate data (McGregor & Nieuwolt 1997, Frecaut et Peguy 1983). As the critique referred to in the WUWT post shows, the energy must come from somewhere. An obvious source would be CO2 greenhouse effect as that certainly exists. Besides, it is not the solar cycles. Also the Argo data show that the heat stored is almost entirely in the upper 700 m. Which is what would be expected if the extra heat energy is simply picked up from the air.
How does the air heat the oceans?
There is very little energy in the air, and massive amounts of energy in the water.
If I have a pot of water say at 20degC in a vey well insulated container all but for an open top, and if this is placed in a room at 25degC so the air above the water is 25degC, how does the air heat the water in the pot, and how long would it take to warm the water above 20degC?
Now consider the position where the water is even warmer than the air above. How does the cold air above the water heat the water?.
Surely, here on planet Earth, it is the oceans (which are heated by the sun) that are heating the atmosphere.
Air heats the ocean in the same way anything warms something adjacent. Duh. The ocean is heated directly by the sun of course. But that has been very stable, at least since 1970. All variation in heat attributable to the sun is in the +-0.1% range. What warmer air would do is two things: (1) pass more heat to the ocean directly by contact; (2) back-radiation from the warmer air would also (slightly) counteract the ocean cooling. The so-called back-radiation is simply the exchange of black-body EM both ways. So warmer air slows the radiative cooling of the ocean surface. Water has a much higher heat capacity than air, hence its heating-cooling is strongly buffered. Not belabour a point, but even air colder than the ocean surface can slow the cooling of the warmer water. How? As long as the adjacent masses are not at 0K there is an exchange of EM energy.
The thermodynamics of the air-oceans are well known. And it is no like NOAA is staffed by dunces. Karl et al do know how to do these heat calculations.
D. Andrew White
So, why don’t you do this NOAA “calculation” showing exactly how much energy is being exchanged due to an air temperature that hasn’t heated up for 18+ years? And an ocean that hasn’t heated up measureably either.
White
So you are saying that an atmosphere that isn’t warming is some how warming an ocean that is?
You make an all too common mistake. El Nino events do not store heat, they release heat to the atmosphere which then does heat up. La Nina events recharge heat at depth in the ocean. But these two opposing processes are not balanced with each other. It is noisy with some periods stair stepping up and some periods stair stepping down in jagged unequal ways.
Another all too common mistake is for people to dismiss ENSO events as being short term “weather” and not drivers of long term climate trends. This is not the case and knowledge of thermodynamics on a very large scale, as well as the teleconnected oceanic-atmospheric systems makes the case that ENSO systems in a large chaotic complex planet can produce long term trends using just intrinsic variations in the presence of a much more stable Sun.
The link below examines regime shifts in Pacific Salmon. Hidden in this seminal article is a reference to a sardine regime shift observation set from Japan that goes all the way back to the 1600s.
http://www.richardbeamish.com/uploads/1/6/0/0/16007202/regimes_cjfas_1999.pdf
A step jump doesn’t matter. It really is the average rate of warming that has an impact.
The only thing that affects people is the weather. That is going to be warm or cold as it happens – but more likely to happen warm and more extreme warmth when the climate is warm.
When there’s a step jump we don’t suddenly get the warmth. We get ‘more likely’ warm weather. And that ‘more likely’ weather is what we have to adapt to.
We don’t have to adapt immediately as though we were three steps ahead. We need to adapt to the middle of the curve.
Too early and we waste resources. Too late and we get a disaster (but we will always get those anyway as we can’t build in too much redundancy).
The middle of the curve depends on how long it is between each big El Nino, about a decade and a half (it seems). So three jumps mean adapting to some warming in about almost half a century.
How often do we upgrade our infrastructure (reservoirs, flood defences, air conditioning) anyway?
There’s hardly any extra cost here. So why spend a fortune on mitigation?
Periodic upgrades of certain infrastructure do of course occur, but a large amount of spending is when we rebuild after disastrous flood and coastal storms.
Despite the knowledge that coastal storms, hurricanes, river flooding, earthquakes, and other disasters will always be repeated in the areas vulnerable to such, we still see nearly every disaster followed by a huge and immediate effort to rebuild.
New Orleans was rebuilt with improved building codes, upgraded levees and flood control structures, homes built higher, etc.
But it was rebuilt in place…in a place which is below sea level, and sinking more every day.
The levees are better, but still unable to withstand a cat 5 strike, even though such an event is just as likely as ever…which means not just very likely, but a question of when and not if.
The response to these events from the same officials that promote panic mongering is completely incongruous. Our President warns (Falsely, IMO) of accelerating sea level rise and increasingly ferocious and frequent storms, but never said a single peep on the subject of actually disallowing rebuilding on high risk sites.
Even, maybe especially, the people who scream the doom and gloom the loudest never want to take steps to prevent the next actual disaster from ruining actual peoples actual lives and actual property.
And the worst part is those who make good decisions to avoid such places and risks, wind up subsidizing the insurance and relief of those who make poor decisions.
El Nino is a natural climate occurrence and therefore has nothing to do with AGW. Yet AGW enthusiast try to use it to further their cause. Does not make sense.
I’m not 100% convinced that the post 2010 global SST step change is real. Satellite temperatures over oceans show no such step up: http://www.climate4you.com/images/MSU%20UAH%20SST%20GlobalMonthlyTempSince1979%20With37monthRunningAverage.gif – and Ryan Maue’s (land + ocean) reanalysis temperature trace at http://models.weatherbell.com/temperature.php even shows a downward step after the 2009-2010 El Niño.
I agree. The 2010 El Nino occurred during the -PDO which appears to nullify any step change. My own opinion is the step changes after prior El Nino events were due to the +PDO configuration. This affects the currents which then determines how the heat gets distributed. Or, maybe it is the currents that determine the phase of the PDO.
All very interesting academic tidbits about weather minutia, but all that really matters:
According to IPCC AR5 industrialized mankind’s share of the increase in atmospheric CO2 between 1750 and 2011 is somewhere between 10% and 200%, i.e. IPCC hasn’t got a clue. IPCC “adjusted” the assumptions, estimates and wags until they got the desired result.
At 2 W/m^2 CO2’s contribution to the global heat balance is insignificant compared to the heat handling power of the oceans and clouds. CO2’s nothing but a bee fart in a hurricane.
The hiatus/pause/lull (IPPC acknowledges as fact) makes it pretty clear that IPCC’s GCM’s are useless.
A minor quibble, “recharge-discharge oscillator” is more commonly referred to as a “relaxation oscillator”.
Bob, I’ve been bothered by the steps for some time. I’ve asked a few times where you think these steps are going. Do you expect them to stop, climb up forever or comedown in the form of steps for a cooling situation? It would seem that JR and KT have a point if the stairway is going to climb up uninterrupted forever. I’m a long time sceptic but I couldn’t fail to become a warmer if this is how its going to continue. Before that happens, I’d have to see a serious audit of the temperature series to see if the documented temperature adjustments aren’t causing this like the jump from the recent NCAR/NOAA brash switch to ship bucket measurements as the centeral data for SSTs that has to be used.
Gary Pearse, I don’t know if it will continue for ever – it might.
Yet eventually we will move on from fossil fuels. We will find something cheaper. Wealways have, eventually.
So the question is, surely, how fast will the warming be?
Can we cope?
And there is no evidence that continued warming – at this rate – will be a problem.
If you look at the volume of warm water in the western Pacific, it is rather evident that something is slowing down. Is it the Walker Circulation? Is it the amount of heat? It is rather clear that the SST swings in the NINO 3.4 region are getting less and less steep. Why? It is rather clear that the depth of the thermocline “indicated by the depth of water above the 20°C potential temperature isotherm averaged over the region 10°S to 10°N and 125°E to 180°E” is more and more shallow. Why? Are we running out of stored heat lost during El Nino’s and not sufficiently recharged during La Nina’s?
http://iridl.ldeo.columbia.edu/maproom/ENSO/Time_Series/Heat_Storage_West_Pac.html
Note: The negative correlation between the two indices is to be expected based on the observation that volume depth is greater or lesser along the western equatorial Pacific depending on trade winds blowing or leaving in place that volume of warm water towards the western edge of the Pacific.
All we’re doing is tracking changes in ENSO/PDO which dominate global climate.
Joe Romm attempts to sell BS , in other ‘news’ bears find wood a good place to dispose of personal waste .
And Pope embraces Catholicism.
While imitation is flattering, it is also a chargeable offense. Plagiarism is a civil offense and it appears both Trenberth and Romm believe themselves to be above the law.
Interesting that you call yourself a “skeptic”. Why not a “naturalist”, since you promote the ideas of natural climate change.
We have not just been kicked out of the Garden of Eden. Things weren’t perfect in the 19th century. So why think everything is in the exact right place until the industrial revolution?
No-one really thinks that.
People do think we have built up our society and infrastructure to cope with what we’ve got. So it’s change that scares people.
If we need to build a new infrastructure every year we would need to re-organise our entire policy priorities.
If we need to build a new infrastructure every month we would need to re-organise our entire society to have forced labour to fix it.
If we need to build a new infrastructure every week we would need to just repent and surrender and die.
But the worst cAGW can scare us with is that we need to build a new infrastructure every half century.
And we do that anyway.
I’m not scared.
There is a lot of frozen, cold, and unfarmable wastelands on the Earth.
These will shrink on a warming world. The tropics have been shown to be stable, temperature-wise, over periods of multiple millions of years. They are unlikely to warm much if at all because convective activity limits how warm it can get.
Plants need less moisture in a CO2 enriched atmosphere, so it seems unlikely deserts will expand, the ranting of panic mongers notwithstanding.
So it seems only coastal areas could face any risk from a much warmer Earth, if sea level rises appreciably. And these are areas that are the least likely to have long-lived structures to begin with, due to the nature and reliability, over the long term, of coastal storm events.
I see nothing to worry about, given that there are places where people have protected, and even reclaimed, lands from a rising ocean using nothing but picks and shovels, and have done so for hundreds of years.
I view it as bizarre in the extreme that there are seemingly sane individuals who profess to believe a somewhat warmer Earth is unsurvivable.
+1
cAGW does not require even that.
What infrastrure has the US had to build since the 1930s because of global or US warming?
The accumulating energy added to the atmosphere after an El Nino, if there were no external addition of heat into the climate system … would fall back to an equilibrium level during the opposite La Nina (neglecting the AMO etc), and not (accepting the wartime hiatus) continue to add heat overall for ~100 yrs. Where is that heat coming from? and why isn’t it escaping? We know, that deep ocean heat is increasing. This isn’t because of ENSO. It is only reflected by it
We see a step effect. ENSO should exhibit an oscillation around a null average were there no additional heat accumulating in the climate system – but what we see is an oscillation around a rising mean.
ENSO distributes heat in the climate system. It does not create it. Yes, a La Nina will allow more SW to enter the Equatorial Pacific, as it has always done, but the rising step-trend is indicative of excess heat being retained in the the climate system. You cannot “pull yourself up by your own braces” – meaning the internal energy of the ENSO should equilibriate and not increase …. but it has been for far longer than an internal oscillation would allow. Conclusion: there is retained heat in the climate system, the ultimate source being the Sun. And we know the Sun has been slowly (overall) been ramping down for ~50 yrs.
http://blog.chron.com/climateabyss/files/2012/04/1967withlines.pdf
Tony b says heat is being retained in the climate system and the sun has been slowly ramping down for 50 years.
That is correct but as evidenced by avg. sola flux readings running well above 100 for the last 50 years until solar cycle 24 has taken place ,solar activity was still supplying heat to the climatic system of the earth. This condition not really changing until around 2005 from which time the average sola flux values has been dropping other then the rise it had during the weak maximum of solar cycle 24. Still overall solar flux reading heading toward the 100 value 2005-2015.
With solar the weak maximum of solar cycle 24 just about behind us solar flux readings should average sub 100 for many years which will equate to less energy coming into the climatic system via the sun which will turn the global temperature trend that is down rather then up. 100 being a key number in my opinion.
I say before this decade is out these effects will be apparent.
Tony makes a common mistake to equate the two processes as being mirror images. They are not. Anyone schooled in the meteorological physics surrounding the thermodynamics involved in the oceanic-atmospheric teleconnections would not expect mirror images. Why does Tony?
Err, Pamela I am a retired Meteorologist.
(sorry about that appeal to authority – but you started it)
What is your excuse for being wrong?
El Nino surface waters are not all evaporated away during the calm windless days. These now risen to the surface unmixed warm waters meander the globe continuing to disgorge heat, even while the equatorial band returns to neutral or even trends to La Nina. Further, some of it becomes left over warm subsurface waters that ride the subcurrent back towards the Eastern Pacific edge. And I haven’t even started on the atmospheric bridge that teleconnects ENSO processes all over the globe. You, as a meteorologist should know this. Which also means you have no excuse. So “Err…” all you want because it is evident you have need of further instruction on ENSO oceanic/atmospheric teleconnected systems.
Here ya go Toneb. Anything else I can help you with?
http://oceanmotion.org/html/impact/el-nino.htm
…and another article for your edification.
http://m.nautil.us/issue/23/dominoes/the-hidden-ocean-patch-that-broke-climate-records
Call me pig ignorant here. But how is it that a step-change, of any kind, can resist cooling off afterwards? For this to be the case, the CO2/GHG contributions would need to be strong enough to prevent night time cooling — at least in some sense.
And we can grant that it could simply be an absurdly large pulse of water. But necessarily we will still see a cooling profile between pulses. And, of course, something that cannot go on forever — won’t. There’s no sanity to positing the step-change version of the ultraviolet catastrophe. What are the limits — with or without hand-wringing ourselves silly about the human production of plant food?
Because KT’s stairway is ‘false travesty’ of research. But they will try their “adjustments” again. Our expectations are. however, for a deeper cooling next than they can cover up.
Because a warmer moister world does not readily cool off. Especially at night. Dry air is needed for radiative cooling. But when the ocean is pumping out water vapor night and day you will not have as much radiative cooling. The world will stay warmer and moister until that layered El Nino water now sitting on top meandering around on ocean currents is gone.
An historical note. In 2008, a high school girl, Kristen Byrnes of Ponder the Maunder (now a defunct website), pointed out the temperature steps. She had a very simple way of constructing them. She connected the peak(trough) of each El Nino(La Nina) with the trough(peak) of the subsequent La Nina(El Nino) and divided the height of the line in half. The center points all neatly line up and produce a straight line. I think that there are only two real steps separated by the 1998 El Nino.
Since none of the GCMs, nor any other model, can predict the El Ninos and certainly don’t predict step changes in temperature, they are clearly wrong. What ever is happening to the climate it only has the most minimal connection to CO2.
Paul
The WayBack Machine may help you here:-
https://web.archive.org/web/20070713023117/http://home.earthlink.net/~ponderthemaunderd/id11.html
I for one am hoping for a good steady string of rain storms this year on the west coast of the US, which has a much better chance of happening if there is an El Nino situation. I live in California and I am tired of the drought here and the exposure it has given to our state’s pathetic inability to deal with low rainfall amounts. The threats of fines if you use water outside of the government approved uses are nazi horse hockey. Our water use is only half way through tier 0 on their usage charts each month because we have been practicing water conservation over the past two years, now they are fining us if we don’t cut back another 30%. State of Calif water provision plan: Hope it rains. Backup plan: fine the people because it didn’t rain as much as we hoped, and keep fining them until the rain picks up.
Time to build a dozen desalination plants powered by coal!
Let me guess what would happen at startup time.
So what causes step cooling events and when should we next expect one?
Once the prolonged solar minimum becomes more established and the degree of magnitude increases ,sea surface temperatures globally will cool off and ENSO will be superimposed on this just like it has been in the past when sea surface temperatures on a global basis were rising.
Step cooling will occur when La Nina’s are superimposed over an overall global sea surface temperature decline Justas step warming events occurred in the past when El Nino was superimposed upon a global sea surface temperature rise.
Also volcanic activity and the phase of the PDO/AMO will have impacts
It’s true that the El Nino is fueled by sunlight, but when it’s in the absorption phase, it should be causing cooling of approximately opposite magnitude of the warming it causes; otherwise it’s out of heat balance.
No it is not. El Nino is caused by a reduction in the Walker Cell circulation that results in wind blown warm water relaxing and sloshing back towards the Eastern Equatorial Pacific. It brings with it thunderheads and clouds that actually reflect sunlight to a greater degree than when under La Nina conditions. If you want to use the phrase “fueled by” use it in the sense that it is disgorging fuel stored under previously clearer skies (when the sea surface was actually anomalously colder).
“El Niño-caused upward steps in global surface temperatures.”
A characteristic of a random walk with drift is that is that it is not mean-reverting: there is no return to the mean (trend) after a random shock.
By contrast, the Mauna Loa CO2 record is a deterministic trend with a seasonal component. The MLO CO2 series is mean-reverting.
Do we need more evidence that the climate we observe is the result of a coupled dynamic system with chaotic subsystems?
In fact Working Group 1 of the IPCC has set this out very clearly, “…it is known that components in the system are inherently chaotic; there are feedbacks that could potentially switch sign, and there are central processes that affect the system in a complicated, non-linear manner. These complex, chaotic, non-linear dynamics are an inherent aspect of the climate system..”
Source: IPCC, TAR. http://www.ipcc.ch/ipccreports/tar/wg1/504.htm
Frederick:
“Do we need more evidence that the climate we observe is the result of a coupled dynamic system with chaotic subsystems?”
No, as the IPCC states, and climate scientists well realise, and why any GCM can only give an increasingly wide range of temperature trend due to the error-bars necessary to take account of these (at present) unforecastable cycles.
Climate is not a sum of the internal cycles, that is weather (on a yearly/decadal basis). Yes, the climate system as myriad internal chaotic cycles of heat distribution. Climate is the changes wrought by the direction of accumulating heat in the system. The heat in the system is increasing and it is that that GCM’s highlight. The empirical science of GHG absorption/emission underlying is NOT up for argument (empirical bit). The cycles, yes, but they are internal chaos that MUST occur given the complex nature of solar heat absorption and emission to space.
So you have found the missing heat? Show the evidence. Where is it? Land temperatures as well as ocean temperatures could just be a redistributed heat index so don’t go there. Besides, when heat is at the ocean surface, we are losing heat, not gaining heat. Where is the heat you say is being added?
Are you sure we shall have an El Nino this year, and not just a positive neutral?
Nobody aint sure of nothin’.
El Niño conditions are present. We are in a weak El Nino condition. It is not in neutral territory. Granted, nothing to write home about.
http://www.cpc.ncep.noaa.gov/products/analysis_monitoring/lanina/enso_evolution-status-fcsts-web.pdf
“Kevin, I’d be happy to co-author a paper with you about these upward steps in global surface temperatures caused by strong El Niños.”
Not clear to me why Tisdale can’t write his own paper. Come on, Herr Tisdale, what is stopping you?
What, Bob “can’t write his own paper”? You just read one, and it makes a lot of sense, eh? Or maybe you still think atmospheric CO2 heats the Oceans? Better go ask Trenberth!
He has written a book,runs a website about it,when will YOU get started?
‘Hair’ Trafamadore, woot, woot!
===============
CO2 absorption energy is too small to have an impact on the climate if the oceans need to be warming not just the atmosphere. Finding a trend in chaotic oscillations of the climate is just cherry picking.
No, the oceans heat the atmosphere and not land (taken overall ) due massive thermal capacity and land cooling greatly in winter (vis NH snow cover). Add to that LH release and the PDO/ENSO cycle is THE most important climate cycle. Which it is why it is not “cherry-picking”.
The lack of surface wind along the equatorial band has resulted in a near flat thermocline slope, meaning that there is precious little churned up surface water protecting our heat storage. If there is any heat at all at depth, it has risen to the surface, evaporates, and is being lost to the atmosphere. The heat rises with the water vapor only to be released above greenhouse gas blankets when thunderheads turn into torrential rain (the work of making rain releases that ocean heat, unfortunately high in the atmosphere). What is worrisome is that each time we have these calm conditions, thermocline volume indicators are growing weaker and weaker. This can only mean there is less and less heat stored in the oceans, because it is likely being lost to the upper atmosphere, and not recirculating via anthropogenic CO2 re-radiation keeping it here. In addition, all this evaporation has been created a reflecting blanket of clouds effectively reducing the amount of solar infrared from reaching the equatorial oceanic band.
See slide 10 of:
http://www.cpc.ncep.noaa.gov/products/analysis_monitoring/lanina/enso_evolution-status-fcsts-web.pdf
http://iridl.ldeo.columbia.edu/maproom/ENSO/Time_Series/Heat_Storage_West_Pac.html
We are running out of stored heat, the winds will begin to blow, and we will all get very cold again. Let us hope that happens. While we bundle up, rest assured the clear skies will once again allow the Sun to send visible light into our equatorial oceans, replenishing the warmth we are so enjoying now.
Damn stiff fingers and Saturday morning brain. Can’t type a grammatically correct sentence to save me from hell.
The lack of surface wind along
the equatorial band has
resulted in a near flat
thermocline slope, meaning
that there is precious little
churned up surface water
protecting our heat storage.
____
Sounds like the begin of a great story. Thx
CCSS ELA section http://www.corestandards.org/ELA-Literacy/RI/6/8/ states that by 6th grade students should be on their way to mastering evaluating and judging supported statements from trash. So let’s use the CCSS to see if this piece and its central proposals are well supported by included documenting evidence in the body of the text.
http://www.climate.gov/news-features/climate-qa/whats-difference-between-global-warming-and-climate-change
Introduction
Over the last several decades significant progress has been made in explaining and modeling El Niño–Southern Oscillation (ENSO), which is the dominant mode of climate variability in the tropical Pacific induced by ocean–atmosphere interactions (e.g., Wang et al. 2004; McPhaden et al. 2006; Fedorov and Brown 2009). Despite these efforts, broad discrepancies still persist in the way ENSO is simulated, particularly in the subsurface (AchutaRao and Sperber 2006; Guilyardi et al. 2009). For example, the present suite of global circulation models includes very different magnitudes and frequency spectra for ENSO variability and different representation of physical mechanisms such as thermocline and SST modes (Fedorov and Philander 2001; Guilyardi 2005).
From the point of view of ocean dynamics, El Niño and its complement La Niña manifest as a horizontal redistribution of warm water along the equator, altering the slope of the thermocline. During La Niña years, strong zonal winds pile up warm water in the west, causing the thermocline to develop a large east–west slope. During an El Niño, weakened zonal winds permit warm water to advect to the east so that the thermocline becomes more horizontal. The same phenomena can be understood by considering the balance of mechanical energy in the tropical ocean during the ENSO cycle—notably, the transfer of energy from the winds to the thermocline prior to La Niña, a removal of energy prior to El Niño, and energy dissipation by various oceanic processes. These energy transformations are the focus of the present paper.
Is this a reply to me or did you get caught in the nested black hole as I did?
Hint: Did the authors prove their preferred Climate Change thesis or the less preferred Climate Warming thesis based on their evidence shown in the body of the text?
Meant to post this under my class assignment comment. Damned nesting.
Nah, there’s almost nothing supporting the text’s central proposals, “included [by] documenting evidence in the body of the text,” no stated evidence – except for, oops, a graph grafting instrumental temps onto proxies – or links connected to the body of the text, except for one which led to a large document on ~”cascading side effects” once the CO2-CC/CAGW starts, which it hasn’t. The Reference links at the bottom of the text were not specifically referenced to the text’s central proposals./ trash
So they didn’t overturn the Null Hypothesis, which contains their less favored thesis
I agree with your critique. The government authors should be up to speed on standards when writing articles about climate. It is deliciously ironic that the Common Core ELA and Math standards promoted by the government can be used to reveal the poorly informed government stance on climate.
One should be careful what one asks for. Lest one ends up with a boot in the arse aimed at the exit door.
There is a 60 year cycle in temperatures caused by the AMO.
Did the El Ninos of the 1950s, 1960s and early 1970s cause downsteps in temperature?
What did temperatures do after the super-El Nino of 1877-78?
1977 to 2004 is just the up-cycle of the swings from the AMO.
Bill, there is a possible atmospherically bridged teleconnection between ENSO events such as El Nino and the AMO with the latter lagging behind the former by some months and even years.
http://ir.library.oregonstate.edu/xmlui/bitstream/handle/1957/44057/WickhamCharlotteStatisticsDecadalVariationsGlobal.pdf?sequence=1
I would look at ENSO events between 1977 to 2004 and determine their proximity to the AMO swings.
“We demonstrate that the 60 year component of the PDO is strongly time-lag correlated with the Atlantic Multidecadal Oscillation (AMO). On this timescale the AMO is shown to lead the PDO by approximately 13 years or to lag the PDO by 17 years. This relation suggests that the AMO and the 60 year component of the PDO are signatures of the same oscillation cycle.”
On the Pacific Decadal Oscillation and the Atlantic Multidecadal
Oscillation: Might they be related?
Marc d’Orgeville and W. Richard Peltier (2007)
http://onlinelibrary.wiley.com/doi/10.1029/2007GL031584/pdf
The step up after 98 did happen. Not so much after 2010. Why? Perhaps the solar decrease lag catching up and the AMO is starting to shift.
If we have a strong La Nina, in conjunction with a strongly negative AMO, with a weak sun, I would not be surprised to see a step down and 100 percent of the satellite data set warming disappearing.
Throw in a major volcano in say 2017, and we could well have cooling over the 38 years of the satellite data sets.
http://www.cpc.ncep.noaa.gov/products/analysis_monitoring/ensocycle/enso_schem.shtml
http://www.cpc.ncep.noaa.gov/products/analysis_monitoring/ensocycle/lanina_schem.shtml
These last two post clear up what Pam was saying about the thermocline slope associated with ENSO phases.
Those last two posts are basic thermocline 101. I expect my readers to know its definition. I go beyond that. My investigation of the data indicates that the total volume has decreased over time, meaning there is less warm water above that thermocline. Why? Anthropogenic theory says there should be more volume, not less.
I link again to the data:
http://iridl.ldeo.columbia.edu/maproom/ENSO/Time_Series/Heat_Storage_West_Pac.html
It is always good to know the basics and never does any harm. This subject(CLIMATE) is very comprehensive and not everyone is going to know everything about everything including myself.
Perhaps with La Nina conditions and strong easterlies, warm surface water is blown westward to pile up in the western pacific north of Australia (the “warm pool”), increasing warm water volume in that area and decreasing it to the east offshore Equador. When El Nino strikes the easterlies abate and all of that warm water travels back eastward so that warm water volume in the western pacific decreases. I think Bob Tisdale occasionally makes this point.
The phenomenon of Southern Oscillation was there in the past and it is there now and will be there in future. This has two parts, namely warm and cold phases known as El Nino and La Nina. If a step-wise rise in temperature with El Nino is true then step-wise fall in temperature with La Nina must also be true!!! We are talking the manipulation of data. We must look in this direction.We must stop discussing one month data or truncated periods that lead no where except filling the pages. Let us concentrate on validating the satellite and balloon data series and then build global temperature and see whether there is rise and if so, what is the contribution of global warming associated anthropogenic greenhouse gases!!!
Dr. S. Jeevananda Reddy
Do not make the mistake of thinking that La Nina and El Nino are opposite and equal functions. They are not. Observations prove that El Nino conditions can dominate long periods of time, possibly evaporating away a significant amount of stored heat before there isn’t enough left above the thermocline layer to produce those tag along thunderheads across the pacific. This would encourage the reestablishment of the Walker Cell circulation (which I consider to be the normal state of things) which causes clear skies to resume once again across the equatorial band except for the normal thunderheads that pile up in the Western portion of that atmospheric circulation along with the top layer of wind blown warm water (or what is left of it). This sets up the recharge regime which in fits and starts, begins to recharge the depleted ocean of solar energy. Thus it would be correct to say that La Ninas are super charged normal conditions while El Ninos are a break down of normal conditions. Given the chaotic nature of Earth, this process would be expected to be noisy, jagged, and demonstrate long rises as well as slow or even fast falls that in no way balance each other out in nice neat packages.
Dr. S. Jeevananda Reddy says, “This has two parts, namely warm and cold phases known as El Nino and La Nina. If a step-wise rise in temperature with El Nino is true then step-wise fall in temperature with La Nina must also be true!!!”
You have expressed a common misunderstanding about ENSO. A La Nina is not the opposite of an El Nino.
You wrote: “We are talking the manipulation of data. We must look in this direction.”
That’s the topic for another thread.
Cheers.
Pamila Grey & Yourself — sorry Sirs, even if we take El Nino is the sole parameter, it comes down during La Nina in one oscillation and then another and thus no continuity in increasing temperature level with the time. It is normal in the past, now and in future. So, leave this aside from global warming — this is accounted inter-annual variations only and not steps.
Dr. S. Jeevananda Reddy
Again no. You are making the mistake of keeping these processes within the confines of the equatorial Pacific band. However, there are multiple currents, both on top and below the equatorial ocean surface that allow these waters to travel elsewhere. When warm water is released from its Western prison parts of it can then meander into other parts of the basin or travel back along the equator towards the Eastern Pacific. The same is true for warm water that has been unmixed and allowed to rise to the surface. These variously warmed or cooled waters meander elsewhere, meaning that the next La Nina that comes along can’t touch them because they are now elsewhere. There are also atmospheric bridges that teleconnect ENSO processes to other parts of the globe, again away from La Nina. There are no ocean based thermo and fluid dynamic properties unique to the equatorial Pacific band that would show an equal up and equal down step pattern.
Pamela Grey — your argument is not correct. Southern Oscillation is not a new phenomenon. It was there thousands of years. Otherwise it has no meaning of Southern Oscillation, PDO, ADO, etc. Also, global temperature presents a 60-year cycle — vary between -0.3 to +0.3 oC. Each El Nino rise is not going to add. This is science.
Dr. S. Jeevananda Reddy
During La Nina, strong winds over the Pacific Ocean pushes warm surface waters to the west, so that the ocean can absorb more solar radiation. Is also increased evaporation, which leads to a gradual increase in temperature.
No. Increased evaporation occurs under El Nino conditions, not La Nina. This is demonstrated by an increase in thunderheads across the equatorial surface from West to East, not just in the Western Pacific.
indeed, you do not find it in de articles from Romm, but Trenberth explains in the Coversation:
“Why should it (temperature) go up? Well, because the planet is warming as a result of human activities. With increasing carbon dioxide and other heat-trapping greenhouse gases in the atmosphere, there is an imbalance in energy flows in and out of the top of the atmosphere: the greenhouse gases increasingly trap more radiation and hence create warming. “Warming” really means heating, and this can exhibit itself in many ways.”
http://theconversation.com/global-warming-is-here-to-stay-whichever-way-you-look-at-it-14532
that part I was missing in your article;
Travesty Trenberth, famous for admitting in a 2008 NPR interview that the missing heat may have already been radiated out.
He hasn’t dared re-visit the idea since, but you should, Martin.
==============
It’s too bad, too. We could’ve used that missing heat. A little warmer is a little better and always has been.
==================
So the pause in Arctic Ice melt will be similarly disappeared when?
https://www2.ucar.edu/atmosnews/news/5124/arctic-ice-melt-could-pause-near-future-then-resume-again
By the way, we are creeping up on the 10 year limit. That limit was set by the models, indicating that a pause in ice decrease should change back to its continued melting state after 10 years. I think betting against this limit will be a pretty good bet. Unless, of course, it is disappeared. Betting that it will be is also a pretty good bet.
Pamela;
Pardon me, but you are teaching me to suck eggs (Google if puzzled). As I said, I’m a retired meteorologist (not a TV weatherman), so that means I know these things, sorry to burst your bubble.
My point is that the PDO/ENSO is NOT a cause of GW nor even a portion of it, as it is cyclic and SHOULD trend back to a null value after each cycle. What goes in is what goes out, or more likely only part of what goes in (the oceans) should come out (we know the ocean heat content is rising ?? surely?).
For your edification…..
http://www.skepticalscience.com/pics/GISTEMPENSO.gif
sorry about the site but follow the paper.
Please explain why it is that ave global temps keep rising with time whether you follow a Nino, Nina or neutral event?
There is heat entering the PDO/ENSO – that is from the Sun and as we know it’s been overall cooling for ~50 yrs – so ????
Oh, and please explain to me the “atmospheric bridge”, so I can correct where you may be wrong there too.
Must I say this again????? The ENSO stage by itself and measured within the equatorial band, is a view that disregards the teleconnected ENSO stages on a global basis. El Nino waters do not disgorge all their heat where they were born. They meander the globe continuing to disgorge heat keeping the plateau fairly flat inbetween noisy ups and downs. The pause is likely because of these now meandering waters initially brought to the surface in ’98, in addition to more El Nino’s compared to La Nina’s during the pause. The currents have now wedged this warm top layer up against a coastline. It will likely stick around until all the heat is gone. Once it is gone, things will cool down, especially if the AO continues into its negative phase as it is now trending (in opposition to what the models say should happen with the AO).
As for the atmospheric bridge, it has and is being studied and reported in the literature. It isn’t my invention. Argue with the scientists.
http://lightning.sbs.ohio-state.edu/geog5921/paper_enso_Alexander2002.pdf
From the graph you posted, I assume this is the new and improved “paramaterized” to hell and gone reconstructed deprogrammed version of (cough cough) sensor measurements.