UPDATE 2: KNMI added the HadNMAT2 data to their Climate Explorer, so we no longer have to rely on my replication of data from a graph. See the update before the closing.
# # #
UPDATE: I was just informed by the UKMO via email and by blogger Andrew on the thread of the cross post at my blog that the UKMO has provided links to the HadNMAT2 data on their webpage here. For those of you with programming skills, have at it. Thank you, Met Office.
# # #
The Night Marine Air Temperature dataset HadNMAT2 from the UKMO is used for bias adjustments of the new NOAA ERSST.v4 “pause-buster” sea surface temperature data over nearly its full term, from 1875 to 2010. But the UKMO HadNMAT2 data are not available online so that the public can easily verify the NOAA ERSST.v4 results. That’s small fish compared to an even bigger problem for NOAA. A preliminary investigation of the UKMO dataset suggests that the HadNMAT2 data do not support NOAA’s claims of no slowdown in global surface warming. In other words, the HadNMAT2 data have a much lower warming rate than the new NOAA “pause buster” ERSST.v4 data since 1998.
INTRODUCTION
In the post NOAA/NCDC’s new ‘pause-buster’ paper: a laughable attempt to create warming by adjusting past data, we discussed the new paper about NOAA’s latest revisions to their global surface temperature dataset. That paper was Karl et al (2015) Possible artifacts of data biases in the recent global surface warming hiatus. The changes to the sea surface temperature component of the new NOAA/NCEI global land+ocean surface temperature dataset were the biggest contributors to claims that the new data show no hiatus or slowdown in global warming since 1998. NOAA’s new extended reconstructed sea surface temperature dataset is called ERSST.v4. Those adjustments and the fact that the oceans cover about 70% of Earth’s surface made the new sea surface temperature data the governing factor in NOAA’s new claims that there was no slowdown in surface warming.
One of the oddities of the new NOAA sea surface temperature dataset shown in our earlier post was that the warming rate of the sea surface temperature portion of NOAA’s new data was an outlier since 1998…that it had a much higher warming rate than all other sea surface temperature datasets during the recent slowdown in global surface warming. In other words, there were no other sea surface temperature datasets that supported the high warming trend of the new NOAA data. See Figures 6 through 9 from the earlier post about Karl et al.
What I did not compare to NOAA’s new sea surface temperature dataset in that post was the temperature dataset that served as the reference for bias adjustments over the full term of the data, and that reference dataset was the HadNMAT2 Night Marine Air Temperature data from the UK Met Office. My preliminary investigation reveals that the reference HadNMAT2 data also do not support the excessive warming rate since 1998 of NOAA’s new sea surface temperature data. And that’s a bad sign…a really bad sign.
BACKGROUND
The two papers that present NOAA’s new Extended Reconstructed Sea Surface Temperature dataset ERSST.v4 are (both are paywalled):
- Huang et al. (2014) Extended Reconstructed Sea Surface Temperature version 4 (ERSST.v4), Part I. Upgrades and Intercomparisons, and
- Liu et al. (2014) Extended Reconstructed Sea Surface Temperature version 4 (ERSST.v4): Part II. Parametric and Structural Uncertainty Estimations.
We discussed the new NOAA ERSST.v4 data in a few posts last year, including Has NOAA Once Again Tried to Adjust Data to Match Climate Models?
Like their earlier ERSST.v3b dataset, the new ERSST.v4 were bias adjusted by a marine air temperature dataset. But NOAA added a new feature this time through. For the bias adjustments in the earlier ERSST.v3b dataset, NOAA used a night marine air temperature dataset that was part of the ICOADS Release 2.4 (R2.4) to adjust the sea surface temperature for the period of 1875 to 1941. On the other hand, two of the features of the new NOAA ERSST.v4 data was that (1) NOAA used a newer and improved night marine air temperature dataset HadNMAT2 from the UKMO and (2) NOAA extended its use through to 2010. In other words, the HadNMAT2 data were used for bias adjustments for nearly the full term of the new ERSST.v4 data from NOAA. See my Table 1, which is Table 1 from Huang et al. (2014). I’ve highlighted the relevant portion.
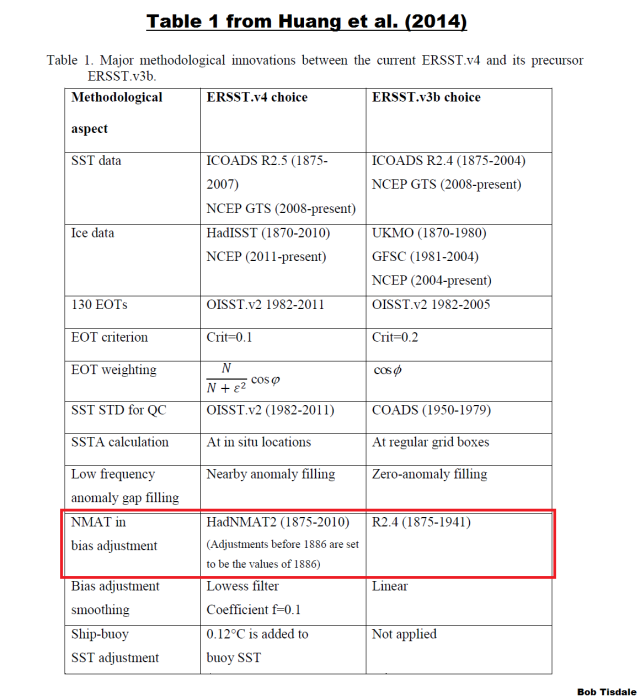
Table 1
As they write in Huang et al. (2014) (my boldface):
Firstly, ERSST.v3b does not provide SST bias adjustment after 1941 whereas subsequent analyses (e.g. Thompson et al. 2008) have highlighted potential post-1941 data issues and some newer datasets have addressed these issues (Kennedy et al. 2011; Hirahara et al. 2014). The latest release of Hadley NMAT version 2 (HadNMAT2) from 1856 to 2010 (Kent et al. 2013) provided better quality controlled NMAT, which includes adjustments for increased ship deck height, removal of artifacts, and increased spatial coverage due to added records. These NMAT data are better suited to identifying SST biases in ERSST, and therefore the bias adjustments in ERSST version 4 (ERSST.v4) have been estimated throughout the period of record instead of exclusively to account for pre-1941 biases as in v3b.
Oddly, by using the HadNMAT2 data for bias adjustment, NOAA did not address the post-1941 problem presented in their referenced Thompson et al. (2008), which was the discontinuity in 1945. NOAA seems to have exaggerated that problem in their new ERSST.v4 data. See the earlier post here, under the heading of YOU MAY BE WONDERING…
Considering that the HadNMAT2 data played a key role in the creation of the ERSST.v4 data, it would be logical to compare the new NOAA ERSST.v4 data to the UKMO HadNMAT2 data to see how well those two datasets agree…especially during the global surface warming slowdown period from 1998 to present, which was one of the highlighted periods in Karl et al. (2015) that served as the bases for the odd claims made in that paper.
PROBLEM ONE (HAS BEEN RESOLVED BY THE UK MET OFFICE)
The HadNMAT2 data are not yet available to the public online, even though the paper that supports it was published in February 2013. And that paper is Kent et al. (2013) Global analysis of night marine air temperature and its uncertainty since 1880: The HadNMAT2 data set. I emailed the UKMO to determine if the HadNMAT2 data were available somewhere online, and I was advised that they were still trying to decide on the format in which to publish it, the length of time for the decision being unusual for them.
It’s been 2 years. I suspect the UKMO has hesitated in publishing the HadNMAT2 data, because they contradict their HADSST3 data during the period from the early-1940s to the mid-1970s. Recall that in HADSST3 the UKMO eliminated the Thompson et al (2008) “discontinuity” around 1945 and made numerous other adjustments during the 1950s, 60s and 70s. Those changes produced a slight cooling trend from the mid-1940s to the mid-1970s. The HadNMAT2 data have not received those corrections.
The fact that the HadNMAT2 data are not available online, of course, presents problems for the three NOAA papers relating to the ERSST.v4 data: Huang et al. (2015), Liu et al. (2015) and Karl et al. (2015). The results of those papers cannot be verified by the public, because one of the key reference datasets for those three papers has not been published. I wonder if the editors of those publications know that sad fact. I suspect they might be informed in the not-too-distant future.
PROBLEM TWO
The global UKMO HadNMAT2 data are presented in Figure 18 of Kent et al. (2013), alongside their HADSST3 data. See my Figure 1. The global HadNMAT2 data are shown as the black curve. The data in the graph run from 1880 to 2010 (with what appears to be a slight downturn in 2011 from an incomplete year of data).

Figure 1
(A larger version of the graph is here.)
While there is software available that will extract data from graphs, I prefer to use the x-y coordinates of MS Paint to replicate the data. My results for the HadNMAT2 data for the period of 1998 to 2010 are shown in Figure 2, compared to the global ERSST.v4 data used by Karl et al. (2015) for their claims of “no hiatus”.
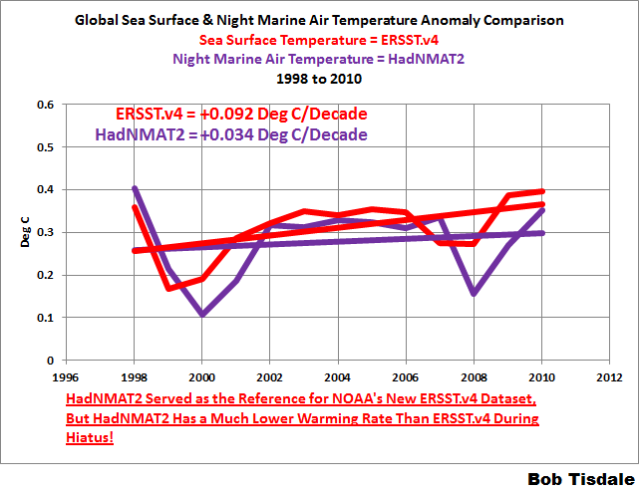
Figure 2
Of course, Karl et al. presented their trends for the period of 1998 to 2012 and from 2000 to 2014. But I know of no source of the HadNMAT2 data for the years of 2011 to 2014. So this is preliminary comparison.
These preliminary results strongly suggest that even the (HadNMAT2) data used as the reference for bias adjustments in the new NOAA sea surface temperature dataset (ERSST.v4) do not support that ERSST.v4 data…or the claims in Karl et al (2015) of no slowdown in global surface warming.
Not too curiously, as far as I can tell, NOAA failed to present those differences in their papers. While NOAA may now try to justify those differences in the short-term warming rates of ERSST.v4 and HadNMAT2, they look very awkward, and any excuses NOAA gives now will simply be viewed as that…excuses.
UPDATE 2
Yesterday the UKMO published their HadNMAT2 data, and today KNMI added it to their Climate Explorer. (Scroll down to “Air Temperature”.) Thank you very much to the hard-working individuals at KNMI and UKMO who took time from their weekends.
The monthly HadNMAT2 data run from 1880 to 2010.
Figure 2 above was based on global data. It is biased by the differences in how the two datasets handle sea ice. So I’ve updated the graph in Figure 3 for the period of 1998 to 2010, using the monthly data for the latitudes of 60S-60N, the non-polar oceans.

Figure 3
NOAA’s new “pause busting” sea surface temperature data still doubles the warming rate of the HadNMAT2 data that served as the bias-adjustment reference for the new NOAA data. And as a note, the HadNMAT2 trend for 1998 to 2010 of 0.045 deg C/Decade is in line with the UKMO HADSST3 data at 0.047 deg C/Decade (not shown).
NOAA, you got some ‘splainin’ to do.
CLOSING
As noted earlier, the preliminary investigation that shows the HadNMAT2 data do not support the claims of no hiatus is a bad sign for the results of Karl et al. (2015), a very bad sign.
I suspect that the editors of the journals that published the three ERSST.v4-based papers (Huang et al. (2015), Liu et al. (2015) and Karl et al. (2015)) will soon be informed of this problem as well.
When the HadNMAT2 data are finally published online by the UKMO, that reference data for the NOAA ERSST.v4 data will very likely put NOAA and the publishers of the Huang et al. (2015), Liu et al. (2015) and Karl et al. (2015) papers in very awkward positions. Time will tell.
http://dailycaller.com/2015/06/04/noaa-fiddles-with-climate-data-to-erase-the-15-year-global-warming-hiatus/
There is fraud day each on all kind of levels and even high levels and broad scale(Fifa)
So it will be no surprise then that these temperature adjustments are in the same field
Nic Lewis advised me on the thread of the cross post at my blog:
The Huang and Liu papers are available non-paywalled here: http://rda.ucar.edu/datasets/ds277.0/docs/ERSST.V4.P1.JCLI-D-14-00006.1.pdf and http://rda.ucar.edu/datasets/ds277.0/docs/ERSST.V4.P2.JCLI-D-14-00007.1.pdf
I’ll update the links in the post later today,
Bob,
What chance is there that this data will be manipulated as well?
An amazing trap.
=============
‘Will no one rid me of this troublesome pause?’
It would have disappeared long ago if they hadn’t sent a Mann to do a Buoys job.
We need to separate the menn from the buoys.
Keep up the research Bob, on this agenda released study which amounts to manipulation of data once again to try to make it conform to AGW theory. This is not the first time nor will it be the last time they will try to do this sort of thing, but they will not get away with it.
So…the publishers of the tripe filled lies of these fake ‘scientists’ will correct things when real scientists tell them about this whole matter! HAHAHA.
Look, when the elites want stooges to lie for them and the reward is billions of dollars, then lies will be told until hell freezes over literally.
They have zero intention of correcting false data, errors or outright lies. They have great incentive to stick to these lies and not allow any debate at all.
As I’ve noted before, doesn’t matter if it’s wrong, or even if it gets retracted as a paper, the damage is already done. We all know the 97% of climatologists agree thing is total bunk, but it’s constantly showing up in news articles, political speeches, and in the marching hordes of online AGW cultists posts. Doesn’t matter that it’s been debunked, the meme is set and is tenaciously hanging on. Same for the 2014 was the warmest year evah, how many times do you hear about that regardless of the fact it’s completely bogus?
This is nothing but a propaganda war pure and simple. The goal of these papers, like Mann’s hockey stick, is to get a meme started that will be bludgeoned into people by the press and politicians.
Meanwhile, chocolate rations have been increased from 30 to 25 grams a week. INGSOC!
Not so sure of that.
The Guardian reported this paper. And their report is still there online. But they haven’t done a follow up. All the related content are links to previous excuses for the Pause, not claiming the Pause didn’t exist.
It looks like there is indecision about whether to stand by this paper.
http://motls.blogspot.com/2015/06/karl-et-al-hiatus-killer-is-research.html?utm_source=feedburner&utm_medium=feed&utm_campaign=Feed%3A+LuboMotlsReferenceFrame+%28Lubos+Motl%27s+reference+frame%29
THE 64TH REASON FOR AN EXPLANATION OF THE HIATUS . REASON 64 IS IT NEVER HAPPENED!
“REASON 64 IS IT NEVER HAPPENED!”
You have to give them points for their audacity. Since it can’t be explained away with 63 tries, the next logical step is to make it disappear. Poof. stop this Pause nonsense, and get back to wealth redistribution, and capitalism destruction.. Shades of Gruber maybe, but I suspect it will backfire on them before long.
Lies, damned lies and mainstream climate science!
Do we have any raw data for the buoys and the ships all by themselves without any biased adjustments? What do those trends look like?
I looked for that breakdown a few days ago, Richard M, but I couldn’t find it.
Cheers
Thanks, Bob. I wonder why?
Is this useful?
http://www.aoml.noaa.gov/envids/gld/FtpInterpolatedInstructions.php
Bob, have you or anyone with greater knowledge than the rest of us tried FOIA requests on all the raw data? AND, while we’re at it…..the exact methodologies and rationale for their “adjustments”?
It seems that is is all public information as taxpayers are footing the bills?
Would love to hear back on this.
Yes. the data is available.
If you do no adjustments to the raw data the warming trend increases.
@Steven Mosher,
I don’t understand. NASA said Dr. Josh Willis changed the buoy data because it was running too cool: Correcting Ocean Cooling
Who’s right? You or NASA?
If you do no adjustments to the raw data..
======
..and if you are constantly adjusting past temp data….you are saying you can’t measure temp in the present
And this is their present temp reconstruction…….
There seems to be conflicting thoughts in this?
The first response gave no citation for…”the data is available”.
The next post shows some data that would refute the first response, but doesn’t respond to my original question about FOIA requests?
Anyone with superior knowledge, please commoner. Would love to here from Bob on this.
Steve, From all recent articles on data adjustment, you are contradicting what has been stated. I’m not saying you’re wrong, but please give citation?
The URL on Correcting Ocean Cooling from MRW did not work.
We must brace ourselves for the day that correction is made for the (as yet) unacknowledged warming artefact of whale urine.
Whales were more plentiful in the nineteenth century (more research needed) and adults produce almost 1,000 litres a day at approximately 37 degrees Celsius.
Once the algorithm is applied, we can expect a significant further cooling of past ocean temperatures.
We will need studies on historical distribution of both whales and ships, since obviously, cetacean secretions would have a more pronounced warming effect in Arctic waters than in tropical seas. This is consistent with the well-known Polar Amplification phenomenon.
The issue of linen-weave buckets contrasted with 10 oz duck canvas should also be addressed, particularly in the years after 1846, with the Indian protests against the Lancashire cotton mills quite possibly, maybe suggesting a data collection instrumentation inconsistency that could mask the overall, incontrovertible trend in long-term, significant variation of homogenized ocean heat content.
Good work Bob, the key thing here is that the NMAT has not even been released yet.
They are trying to rewrite the global temp record, with heavy policy implications, based on a dataset that the owners do not even have enough confidence in to make public.
This will put pressure on Hadley to release the data, then we can have proper look at what kind of voodoo science has been done by Karl.
“…dataset shown in our earlier post …”
Unless you developing schizophrenia, you could probably drop the “royal wee”.;)
Mike, I agree with most of your comment. But the “our” in “our earlier post” was with respect to the post written by Anthony and me.
Cheers
Fair enough, a thousand pardons. 😉
Though an unparalleled solo pilot, Bob’s machine is now fueled with enough crowd sourcing that he’s about to take off into elevated realm of the We True Yonder.
==================
If Karl et al reckons that Marine AIR temperature is more reliable than purpose built buoys for measuring SST, lets have a look at trends in NMAT2:
If that is now to be record of reference, then the early 20th c. rise is indestinguishable from the recent rise. CO2 is not supposed to have been significant before 1960, according to IPCC.
Then, what NMAT2 shows is that there has been NO DETECTABLE warming due to CO2 / GHG / land use. The whole thing : ZILCH.
BTW the NMAT data was one of main reasons justifying the insertion of a 0.5 deg. C “correction” in to hadSST2, which was later replaced by a smoother, but essentially similar, change in HasSST3.
It seems that the drop in NMAT was too much to be fully reproduced in hadSST products since it still drops more than the “corrected” SST.
I did not realise that NMAT was not available ( or I’d forgotten ).
The CRUTem land records are famously unverifiable since CRU’s dog ate the orgininal records.
So the whole global surface temperature record is basically some unverifiable mash of adjusted and readjusted, “homogenised” numbers.
None of this is verifiable hence none of it is valid science.
The science is settled…. until the next time we move the goal posts. Stay tuned for the next update.
If your post-modern “scientific breakthrough” is to simply find a transformation that takes data set A and converts it to a desired data set B, then it really doesn’t matter what you use for data set A. All that matters is that you have enough degrees of freedom to produce a nearly infinite set of possible transformations and that the values of data set B have a slight range (if the values of data set B needed to be exact, then the carnival trick gets a bit more difficult). So if you point out that Climategate Co-conspirator Karl used the wrong starting data, his rejoinder will simply be that he discovered an error in his transformation and, once corrected, the result will be a new data set that is in the acceptable range of the desired outcome. I suspect you could give CCK any data set of equivalent cardinality and he could produce a bankable result using his breakthrough method.
Is it possible to use Benford’s Law of Leading Digits on temperature data sets to detect ‘cooking the books’ as they do in financial bookkeeping records?
Bob: “When the HadNMAT2 data are finally published online by the UKMO”…they will have been ‘fixed’ to support NOAA – this is all the Paris run. Don’t forget we had delays in Cryosphere today cover ice coverage, late surface temp data from HadCrut, etc. Whenever there has been a significant delay in data, we’ve ended up with ‘adjustments’. Don’t believe for a second that Karl didn’t get this cleared with HadCrut beforehand. They aren’t very smart but such a brash oversight would put them in the stupid category.
AdjustGate?
Fiddlegate
Datagate
Noaagate
Pausegate
Take your pick.
Hawkwind- “Adjust Me”
“The HadNMAT2 data are not yet available to the public online, even though the paper that supports it was published in February 2013. And that paper is Kent et al. (2013) Global analysis of night marine air temperature and its uncertainty since 1880: The HadNMAT2 data set.”
The major part of the historical sea (sub)surface temperature data comes from ships with all the problems involved that have been discussed in the various criticisms or the Karl et al paper. However, one point I have not seen brought out enough is how concentrated the measurements are on limited areas of the oceans. This can be seen from a comparison of shipping maps from 1900 with the present:
Present:http://upload.wikimedia.org/wikipedia/commons/3/39/Shipping_routes_red_black.png
http://iamyouasheisme.files.wordpress.com/2008/02/nytimes_shipping_map.jpg
1900: http://www.knmi.nl/cliwoc/images/all_ships0.jpg
These maps show that in 1900 most shipping was in the Atlantic, Indian oceans and around Indonesia but later in the century this expanded considerably to cover the Northern Pacific. Given the differences in heating of the Indian and S Atlantic oceans to the N Pacific and the sparse coverage of the Southern oceans the idea that any SST series can be based on temperature data from shipping is a joke. Especially given that the oceans cover 70+ percent of the Earth’s surface and take in 80+ percent of solar energy, mainly in the areas that are sparsely sampled by shipping in 1900 and now.
So you don’t think it possible to estimate within 0.1C then.
We can ESTIMATE to within .001C, but it is just as worthless as estimating to 0.5C. (Unless “we” get paid to do the estimating, then I guess I would have to say lucrative instead of worthless).
Supply and demand … if some entity will pay for it, then it is possible to estimate anything. Please keep doing what you are doing and eventually the people that supply the “entity” with money will see that it is a waste. Thanks.
Thanks, Bob. Very good detective work.
BTW, the June 4th MEI shot up to 1.5, the highest since 2010.
http://www.oarval.org/ts4Jun2015OptAV.png
From http://www.esrl.noaa.gov/psd/enso/mei/
Thanks for the MEI update, Andres.
http://www.cpc.ncep.noaa.gov/products/analysis_monitoring/ensostuff/detrend.nino34.ascii.txt
If the science is settled why do they even need to adjust the data?
I think it is to add some more dirt on the grave of science.
That is a very good political talking point (to throw back at the Warmers).
Because 97%
The plot thickens. Great digging Bob, thanks.
Or more accurately the plot sickens.
I see it as the heat was not hiding in the deep ocean…..it was hiding behind an adjustment
…and the adjustment means NOAA/NASA have not been able to accurately measure temps for the past 20 years
Latitude,
Thanks for the early morning smile. The heat’s hiding in San Diego and Boulder. Who knew!
Despite the NCDC adjusting the trend up more and more as time goes on, (these are the changes made by the NCDC up to 2008 versus the first NCDC global land/ocean index I saved in 2008) …
http://s4.postimg.org/4nl66i1ul/NCDC_Land_Ocean_Adjustments.png
… And the more recent changes to the Ocean SSTs, which are actually not that large but look to be far too “systematic” to be a data collecting problem but more of a “problem” related to trying to get rid of the pause through adjusting Ocean SSTs this time in the latest round of adjustments …
http://s8.postimg.org/hndz144wl/NCDC_Recent_Ocean_Adjustments.png
… There is still a pause according to the NCDC, I don’t know why they think there is warming here. It is flat and not increasing as in that predicted by the climate models which should be increasing by about 0.4C over this period.
http://s29.postimg.org/6qaazniqv/NCDC_Pause.png
To sum all this up:
Just like with the TPP the details must be hidden for you “protection”. You should trust them and be confident that they know best in all things, just as they insist they do. You must accept that they are just honorable, ethical saviors of the planet while you are the perps, despoiling their pristine personal playground (and hunting preserve when they feel the need).
And just because your tax dollars paid to accumulate and tabulate this data doesn’t mean you have any right to see it. This data is exclusively for the eyes of government funded “experts” who know that they must tow whatever line the pols say they must, or no more funding!
Its a perfectly balanced system. I mean, what could possibly go wrong?
The other day I produced alternatively ‘corrected’ set of the NOAA’s global temperatures (details here )
http://www.vukcevic.talktalk.net/CRUTEM4-F.gif
I am inclined to put it on line, but if I do don’t use it for any peer review or otherwise paper.
They don’t know what format to release NMAT, how about just giving you the same data they gave NOAA?
Too obvious.
NCDC(Karl et. al.) appeared to have
finally over reached. That karma thing
could be rough!
I just wanted to say to Anthony and all the other posters and bloggers here on WUWT, thank you for doing what you do here. I have learned a great deal concerning the science and politics behind the AGW scare.
My Father was a scientist in analytical chemistry, spectroscopy and holds a couple patents in inductively coupled plasma. He often took me to work with him on the weekends when I was young and showed me the lab and things he and others were working on. I grew up understanding scientific philosophy and methods, although I ultimately wound up working in the natural gas utility industry in a mostly unscientific capacity. I still love science in all of it’s explorations and believe that a person doesn’t necessarily have to be a PhD or have official credentials to have a scientific mind and to be able to put forth theories and even prove them. I really enjoy some of the ideas that are put forth here. Even a simple question here about some obscure data or aspect of a scientific discussion has the possibility of turning on the lightbulb in the mind of another.
What I like about this WUWT site so much is that there are good posts and great discussion without much blather about other websites and personalities, except for the “scientists” who put forth their opinions with a political bent or the ones who really believe AGW and have a bias for it. I really cannot believe that there are sites out there, specifically dedicated to pissing on WUWT, Anthony and others who post here. This is a site of free discussion of ideas concerning the science and politics of AGW, which is a huge issue to us all in many ways. (Too bad there is not as much focus on the threat of Iran getting ahold of nukes which has the potential to turn the discussion of Global Warming to a moot point in a very short time). If this site can advance the science or politics of climate change in an honest, open way, as it seems to be doing, it is worth every second of energy put into it in opposition of a political agenda bent on putting fear into peoples minds to advance that agenda…Which aims to massively redistribute wealth worldwide and reduce our standards of living.
Thanks People
+10
Well said. My sentiments exactly.
It’s worth throwing this here as a short crib sheet:
http://en.wikipedia.org/wiki/Pseudoscience#Pseudoscientific_concepts
These concepts are largely inseparable from the practice of modern climate science generally[1]. But with specific relation to the issue of adjustments, what we are lacking is the replicable experiments that demonstrate the veracity and correctness of the adjustments used in the data products. Or, quite obviously, the necessary error bars that would come with any such experimental constructions.
The other significant and specific problem here is that the data product in use here is simply not available. There is a Woozle effect loose in this that the data product itself has not been validated scientifically. But it one-ups this by relying on a Woozle that everyone freely admits is not published at all. This is not unlike all the perpetual motion and over unity energy cranks that state that they have such a device, but refuse to allow inspection of it.
The paper should be relegated to mere bunkum or conjecture until such time as this deficiency is corrected.
[1] Indeed, the only thing that keeps the field of Climate Science from batting a thousand on the short list of pseduoscience ‘tells’ is that of peer review. But given that it is demonstrable from Climate Gate that peer review in this field has succumbed to regulatory capture, it’s hardly unsurprising.
@Jquip,
I enjoy reading about perpetual motion, and some other science fiction/fantasy.
Yeh, it’s entertaining stuff. But I’d be just as put out if there was a political movement afoot to burn kittens for electricty — just to prevent a Kzin uprising.
I was also taught perpetual motion did not exist by the same person who taught me that the universe was perpetual as was the motion of the moon and Earth and the entire solar system down to atoms.
From the confluence of news stories as seen by Mark Steyn
-from Birth of the New, Mark Steyn, June 5, 2015
Correction: “Master Cruise” above was in reference to Connor Cruise, son of actor Tom Cruise. My mistake.
Woozlers
Is it just me or am I sensing the resurrected smell of a phenomenon lovingly referred to as “Mike’s Nature Trick”. If one can hide the decline, hiding a pause would be just too easy to pass up. And climate researchers who rally round the coolaid will not be able to resist. So I thought it apropos to remind readers just what these people are capable of.
From: Phil Jones
To: ray bradley ,mann@xxxxx.xxx, mhughes@xxxx.xxx
Subject: Diagram for WMO Statement
Date: Tue, 16 Nov 1999 13:31:15 +0000
Cc: k.briffa@xxx.xx.xx,t.osborn@xxxx.xxx
Dear Ray, Mike and Malcolm,
Once Tim’s got a diagram here we’ll send that either later today or
first thing tomorrow.
I’ve just completed Mike’s Nature trick of adding in the real temps
to each series for the last 20 years (ie from 1981 onwards) amd from
1961 for Keith’s to hide the decline. Mike’s series got the annual
land and marine values while the other two got April-Sept for NH land
N of 20N. The latter two are real for 1999, while the estimate for 1999
for NH combined is +0.44C wrt 61-90. The Global estimate for 1999 with
data through Oct is +0.35C cf. 0.57 for 1998.
Thanks for the comments, Ray.
Cheers
Phil
Prof. Phil Jones
Climatic Research Unit Telephone +44 (0) xxxxx
School of Environmental Sciences Fax +44 (0) xxxx
University of East Anglia
Norwich Email p.jones@xxxx.xxx
NR4 7TJ
UK
+100
I wonder how the Yamal trees will react to the oil and gas exploration.
Or was the original intent of collecting Yamal tree rings to stop oil and gas exploration?
http://www.total.com/en/energies-expertise/oil-gas/exploration-production/projects-achievements/lng/yamal-lng?%FFbw=kludge1%FF
http://www.yamaloilandgas.com/en/
Exactly why are we accepting any if these adjustments if these guys are past masters of falsifying global temperatures? I have proved [1] that GISS, NCDC, and HadCRUT in cooperation cooked up a non-existent global warming in the eighties and nineties in order to cover up lack of warming there. I demonstrated that there was no warming at all from 1979 to 1997 but they went ahead and over-wrote that section of global warming graph with a fake warming called late twentieth century warming. Fortunately they still do not control satellites and that no-warming section is clearly visible in satellite temperature records. I discovered this in 2008 while doing research for my book “What Warming?” That was no-warming section rextended from 1979 to 1997. It lasted 18 years, as long as the present hiatus has lasted. They did exactly what they are doing now: invented a fake warming and succeeded in inserting it into official temperature records. I put a warning about it into my book when it came out in 2010 but nothing happened – I was completely ignored. They are pulling the same underhanded deal now with the present day hiatus. Satellite data show clearly that the hiatus/pause exists and even IPCC data showed it until they brought out their revisionist data. I regard it simply one more of dozens of papers that have appeared to deny that the hiatus exists. It differs from others in the boldness of the falsification effort which in my opinion is likely to sink the entire affair as a pseudo-scientific forgery. I have long felt that satellite data are the only reliable scientific temperature data. The two hiatuses – one in the eighties and nineties and one in the twenty-first century – are clearly visible in satellite records but not in ground=based temperature records. . Not mentioned so far is the important fact that during a hiatus there is no such thing as greenhouse warming. It is suspended and the Arrhenius greenhouse theory that has made wrong predictions of warming during the hiatuses is thereby invalidated. From this we can conclude that it probably never existed in the present global atmosphere. The no-warming periods we know of include the years 1979 to 1997 and all the tears after 2002. I am not including the super El Nino of 1998 into a hiatus because it is caused by a different physical process, nor am I including the short step warming that followed the super El Nino in 1999. It is importasnt because in only three years it raised global temperature by a third of a degree Celsius and then stopped. This action made all the twenty-first century years after it warmer than the twentieth century had been(except 1998). This leaves a scant five years wedged in between the two hiatuses for any greenhouse warming that is the lifeline of IPCC. And unfortunately for them, neithe the super El Nino nor the step warming that followed have anything to do with the greenhouse effect. We must conclude that during the entire satellite era there has been no greenhouse warming whatsoever which explains why they are so anxious to push that fake warming of theirs unto us.
[1] Arno Arrak, “What Warming? Satellite view of global temperature change” (CreateSpace 2010), pp. 31-36; figures 15, 24
Oceans and land heat independently of each other! There is a Nobel prize there.
Hmmm…so the previous 97% consensus that NOAA’s climate analyses were accurate are now wrong? Will NOAA claim that their new analysis has a 97.1% consensus? Wondering minds are wondering.
Like Mr. Dahlquist above, I have learned a great deal here, particularly from the comments. Unlike him, however, I do not have a scientific background, so quite a bit of the reading is difficult, if not incomprehensible to me. I became a bit of a skeptic about most things in the media after I met Gerald Ford and learned that he was not a stumble bum idiot.
This new “data adjustment” has me puzzled. Could someone please, in simple language, explain to me what NOAA says was wrong with the original data, and how they corrected it?
And another thing…if NOAA’s data from their instruments used in the past several years was not accurate, how can they say with such certainty what temperatures were when they didn’t have any instruments at all?
TIA
I’ll have a crack at it katherine009, only because I know if I get anything important wrong someone will be along soon to correct me. I don’t have a scientific background either, so perhaps I can speaka your language.
Your first question was – what did the NOAA SAY was wrong with the original data?
Well, I don’t think they ever provided a straightforward answer to that specific question – anyway, not one that made sense.
The real answer to the question simply has to be that the “original” data as was showed a pause/hiatus/stoppage of global warming, and there is a big conference coming up of high global warming mucky mucks, and this pause/hiatus/stoppage had to be disappeared.
As to what they actually did – well they were quite clear about that, but depending on how much you know, little background may help you understand what was done, and why it didn’t make sense to do it.
There are a bunch of different temperature datasets being compiled in the world, and I don’t even pretend to understand them – some (most? all?) are adjusted before we even see the finished product. If you dig deep enough, you can find the unadjusted (raw)data, but that isn’t what is publicized. There are various averaging protocols, grids on the earth are set up, blah blah blah and so on. Sometimes there isn’t any data for a grid, and extrapolations, infilling, kriging (don’t know what any of these mean, other than that they are some kind of educated guesses?) are made for that grid and on and on.
Some datasets are for sea surface temperature only, and some combine land and sea temps and attempt to give us a global average temperature. We also measure, to some extent, the temperatures of the oceans at depths up to 1900 meters. Are you with me so far Katherine009?
Now these particular adjustments were made to sea surface temperatures, or to the sea surface temperature portion of one of the datasets. Drilling down a little more – Sea surface temperatures for many many years have been taken by ships, which makes sense because how else would we realistically get them? We still do get temperature readings from ships to this day. Of course, there are a lot of ships and have been a lot of ships, and they are very different, coming from different parts of the world, with differing ways and technologies for measuring temps.
Some use buckets, and some went from wooden buckets, to canvas buckets, to I don’t know what. but each style of bucket has different thermal and insulative properties, so the readings are not strictly comparable. To complicate matters further, other ships, usually larger/more modern vessels, measure temps at certain water intake ports, which I’m guessing are taking in water to cool engines or something like. These intake measured temps have their own issues as well, such as are they being heated by the hull etc, and they are not strictly comparable to bucket measured temps, and maybe not even to each other.
Now there are also TOB’s issues, meaning time of observation. If one ship takes temps at a different time than another then those readings are not directly comparable either. So, you see that although ship-taken temperature readings are useful to an extent, and it’s a good thing they were and are being done, they are not a really precise and uniform way to measure SST’s to the level of precision we need to help us with the tiny amounts of global heating and cooling we are attempting to assign real meaning to.
Scientists realized some time ago that we needed a more uniform, more reliable, and more precise method of measuring SST’s, and so for some time now (a couple of decades or so, someone will tell us exactly how long I’m sure) we have had buoys – called drifters – measuring SST’s. These buoys are designed for the purpose, and do their job in a uniform, more scientific way.
Well, Katherine009, it turns out that our intrepid climate scientists discovered that ship measured temps were running on average about .12 of a degree warmer than buoy measured temps.
So, rather than adjust the ship-measured temps down to match the buoys, or to make no adjustments at all, they decided to adjust the buoy-measured temps up .12 degrees to match the ship measured temps. This adjustment, coupled with the greater weighting (Yeah, I know I didn’t cover this concept of “weighting” – sorry) imparted to the buoy-measured temps by their particular protocols in creating this particular dataset, results in a slightly higher temperature trend for the particular time period they wanted, which I think was the period that contains the pause/hiatus/stoppage.
So – Hey-Presto! the pause/hiatus/stoppage is now gone.
I hope I didn’t completely botch that, and I hope it helps.
Tom, thanks for the great response! I had a couple aha!s reading it. (I did understand weighting already, thanks.)
It seems to me that is would be a relatively straightforward experiment (although perhaps not easy) to sail around and take simultaneous measurements at the water intake valves of a ship and at the buoys, to check in which direction the bias is occurring, if any. Using a single ship (or designated group of ships) would presumably control for different ships and methods, as well as time and place variations.
I mean, it would be a relatively inexpensive experiment compared to the upheaval of completely changing our power generation systems worldwide, don’t you think?
Another question…since we have data from ships for longer than buoys, does that data show a hiatus over the long term?