Wow! ECMWF Long-Term Weather Model Is Predicting a Super El Niño and I Mean Super
Guest Post by Bob Tisdale
I was notified today of the rather remarkable plume of ENSO forecasts for 2015 from ECMWF (European Centre for Medium-Range Weather Forecasts). See their System 4 ENSO region sea surface temperature anomaly forecast webpage here.
Figure 1 presents the ECWMF plume of sea surface temperature anomaly forecasts for the NINO3 region (5S-5N, 150W-90W), with some of the runs reaching highs in November 2015 in the neighborhood of +4.5 deg C.
Figure 1
For those unfamiliar with them, see the map of NINO regions here.
Figure 2 show the plume for the NINO3.4 region (5S-5N, 170W-120W). Note how a couple of the runs reach beyond the upper +4 deg C extent of the y-axis.
Figure 2
Now consider that NINO3.4 sea surface temperature anomalies peaked at +2.7 deg C in December 1997 in response to the 1997/98 super El Niño, and peaked at +2.8 deg C in January 1983 during the 1982/83 El Niño. See Figure 3, which is from the April 2015 Sea Surface Temperature (SST) Anomaly Update.
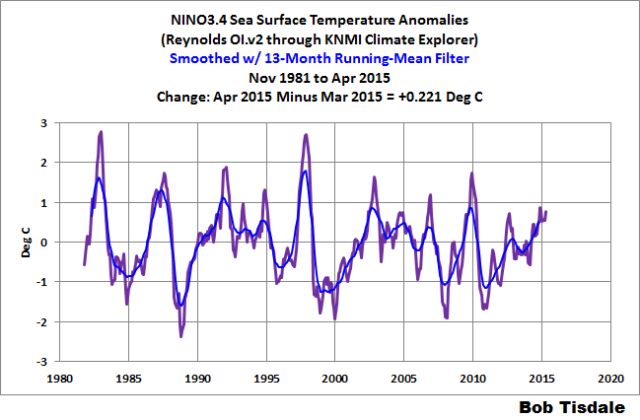
Figure 3
ARE NOVEMBER SEA SURFACE TEMPERATURE ANOMALIES OF +4.0 DEG C AND HIGHER IN THE NINO3.4 REGION PHYSICALLY POSSIBLE?
In the post Why Do El Niño and La Niña Events Peak in Boreal Winter?, we illustrated and discussed how and why the sea surface temperatures (absolute) of the NINO3.4 region mimic the seasonal cycle of, and come near to the values of, those in the western equatorial Pacific (5S-5N, 120E-165E) during a strong El Niño, like the one in 1997/98.
Based on the Reynolds OI.v2 data, the average November sea surface temperatures for the NINO3.4 region for the period of 1981-2010 is 26.64 deg C. That value serves as the November reference temperature for NINO3.4 sea surface temperatures anomalies.
Sea surface temperatures in the western equatorial Pacific (5S-5N, 120E-165E) are naturally warmer than those of the NINO3.4 region. The November sea surface temperature for the western equatorial Pacific in 2012 was 29.95 deg C; in 2013 the temperature there was 29.98 deg C; and, for 2014, it was 29.90 deg C. The average November temperature for the western equatorial Pacific for the past 3 years was about 29.94 deg C.
Let’s assume for a moment that the sea surface temperatures in NINO3.4 region did something very unusual in November 2015 and rose to that 2012-2014 average value of the western equatorial Pacific of 29.94 deg C. The November 2015 NINO3.4 sea surface temperature anomaly would be 3.3 deg C. That’s far short of 4 deg C.
Because someone’s bound to ask, in November 1997, the sea surface temperature for the western equatorial Pacific was 29.35 deg C, while the NINO3.4 region was remarkably similar at 29.31 deg C. And for November 1982, the sea surface temperature for the western equatorial Pacific was 29.08 deg C, while the NINO3.4 region was a little less at 28.81 deg C.
[My thanks for the heads-up, anonymous person.]
SOURCE
The Reynolds OI.v2 sea surface temperature data are available from the KNMI Climate Explorer.
Models, models everywhere, and not an accurate prediction to make….
The computer made me do it.
The programmer made the computer make me do it.
Models all the way down.
“Models, models, everywhere and all the trends did stink..”
The question we would always ask at Intel for something like this was:
“how much of your salary/retirement would you bet on this being correct?”
Ahh, a subjective naive prior, the gateway to Bayesian probability/inference.
Surely the Gavinator and his entire department will bet their entire year’s salary along with Richard Betts and Dame Slingo of the Met Office in England.
At least, if they had any honor at all, they should.
How much do you think Betts and Slingo sweeten the pot? Maybe Gav should just add a few hundred in cash to the pot, instead. Betts and Slingo would be hard to monetize.
You would think that when the majority of their runs produce something not just unprecidented but physically impossible, they might conclude their model is wrong. Instead, they publish it and embarass themselves.
OTH, you found Trenberth’s missing heat. It was hiding inside the ECMWF model.
Right on the money as usual, rv. Many thanks,
an (aka pokerguy)
Bob,
From a historical perspective, what are the odds of a weak/stalled El Nino in one year, intensifying significantly in the following year?
Rob, according to NOAA’s ONI index…
http://www.cpc.ncep.noaa.gov/products/analysis_monitoring/ensostuff/ensoyears.shtml
…the 1986/87/88 El Nino strengthened during the second year, but peaked earlier in the year than normal.
This year, there’s still a large pool of warmer-than-normal water below the eastern equatorial Pacific, so the El Nino conditions should strengthen somewhat from where they are now.
Much will depend on if and when we get more westerly wind bursts. We need them to push more warm water from the western to the eastern equatorial Pacific.
Cheers
http://www.cpc.ncep.noaa.gov/products/analysis_monitoring/ensostuff/detrend.nino34.ascii.txt
1997 3 27.15 27.34 -0.19
1997 4 27.98 27.81 0.18
1997 5 28.63 27.91 0.71
1997 6 28.86 27.69 1.17
1997 7 28.86 27.28 1.58
1997 8 28.69 26.92 1.76
1997 9 28.89 26.83 2.06
1997 10 29.13 26.79 2.34
1997 11 29.12 26.74 2.38
1997 12 29.04 26.69 2.35
1998 1 28.98 26.68 2.30
1998 2 28.72 26.84 1.88
1998 3 28.67 27.34 1.33
1998 4 28.66 27.81 0.85
1998 5 28.48 27.91 0.57
1998 6 27.42 27.69 -0.27
How about all the many data insufficiencies? The badly maintained floating equatorial stations? Those that have contributed to so many failed El Nino predictions in the past?
Orson, the moored TAO project buoys have been supplemented by drifting buoys for a few decades. And there are satellite measurements thrown in too.
Also, add a volcanic eruption, major or minor and when it appears that Nino died in its
crib or was a changeling, the volcano will be blamed…
just saying..
Thanks, Bob. If the ECMWF model is correct we’ll probably have some El Niño warming to keep the pause going.
But if it is correct about the increasing strength of the ongoing El Niño, global warming would resume.
Some charts that are important for the ENSO (updated to April 2015).
First, the Pacific ocean equatorial upper ocean temperature anomaly (probably the most accurate leading indicator for where the ENSO is heading).
Keep in mind, most of this temperature anomaly is actually below the surface at about 150 metres depth and mostly represents warm or cold water flowing to the East in the Pacific Equatorial Under-Current. It is not at the surface, as in a Kelvin Wave but it is the temperatures in the deeper ocean current which carries the most mass of water on the planet of any current. Large increase in the last few months (which is leading to the expectation of a large El Nino this year but there was also a large increase last year which did not result in a large El Nino).
http://s14.postimg.org/b74jrvcyp/Nino_34_vs_EUOTA_Apr15.png
In the last few weeks, this temperature anomaly has been decreasing (which again is exactly what it did at this time last year).
http://s4.postimg.org/9oo2b3831/EUOTA_Weekly_May15.png
The Trade Winds haven’t been doing much lately. An El Nino will need these winds to slacken by a huge amount (as in 1997) to produce a large El Nino.
http://s2.postimg.org/h3mvli4xl/Nino_34_vs_Trade_Winds_Apr15.png
Last several days have seen some extra slackening however.
http://www.cpc.ncep.noaa.gov/products/analysis_monitoring/enso_update/ua850_c.gif
And then lastly, Water Vapor. If an ENSO is going to impact global temperatures, there needs to be a large jump in water vapor levels but not much is really happening at this early stage of the ENSO.
In addition, the ENSO seems to be, by far, the most important driver of water vapor levels. It is not increasing anything like predicted in the theory and, since the ENSO seems to be the big driver of it and there is no increasing trend in the ENSO, as in more El Ninos are NOT occurring, as in there has been no change in this oscillation since the start of the record in 1871, one might be tempted to say the global warming theory got this wrong. At least half of the total warming expected comes from increased water vapor. If this is flat or only increases at half the rate expected, then the large warming will simply not happen.
http://s22.postimg.org/4g25h2p3l/Nino_34_vs_PCWV_Apr15.png
Thanks for the updates, Bill.
No chance of a strong El Nino. It is worth observe the temperature at a height of 3500 m.
http://earth.nullschool.net/#current/wind/isobaric/700hPa/overlay=temp/equirectangular
Bill Illis .comment-author .vcard May 16, 2015 at 9:19 am
…Large increase in the last few months (which is leading to the expectation of a large El Nino this year but there was also a large increase last year which did not result in a large El Nino)….
When there is a large increase that does not result in an El Nino, where does the heat go?
Clearly, global warming is causing disruption in the functioning of our high-tech society, leading to computer malfunctions that are only to increase in frequency and amplitude until planes start falling out of the sky and our cars act to murder us. We must act now to control our emissions.
This is just to get the politicians in the right mood for Paris, although if it doesn’t happen……OOPS.
James Bull
That was my first thought James. Give the shysters in Paris one more thing to point at so we become convinced to turn over our lives to them.
Joe Romm is in ecstasy over the possibility of a huge elNino breaking the pause. Too funny.
To me the ~1992-1995 and 2002-2006 action seems more like what we are getting now. Hope it brings some moisture to California as they are in need of it.
And there was me thinking Rantin’ Romm didn’t want the world to warm up…
he’s just an alarm-junky
forget global warming, climate change, extreme weather, irritable climate syndrome……..
it’s weather
What does this mean for California?…..rain or no rain?
@TRM, and @Latitude,
Watch Joe Bastardi’s weekly weather forecast. He talks about CA.
First time I’ve watched Joe Bastardi’s informative and entertaining Saturday Summary. Thanks for the link.
Exactly – rain or no rain. Whichever it is, it will be bad, and the fault of fossil fuels.
I agree. At least half of their model run predictions are physically impossible. The western warm pool temperatures vary a lot less than el-nino temperatures. Their upper limit changes even less. You have shown how the Kelvin wave ties the two temperature changes together. Their models apparently do not include the Kelvin wave effect.
Jamstec and IRI blend usually best on this matter Weatherbell predicts similar enso event to 57-58, 65-66 should peak before winter, and shrink back to enso 3.4 warmer than 1.2 a marker for a cold winter. Look for major flop to global temp dropping la nina within 3 yrs. Before that though, get ready , the agenda offendas are coming out in full force. You think its bad now with their global temps, wait till this cranks more
Thanks, Joe. With all those graphs and alphabet soups, sometimes I need a weatherman to tell me which way the wind’ll blow.
btw that warm water still around Australia is a huge negative for the trades cranking up enough for ECMWF idea. We see some fairly good soi drops as we are having now, but nothing like the kind of set up we had in 97-98 as the water was very cold around Australia by now, meaning high pressure and the slow down of the trades. Same problem last year, though this year its off to a warmer start in enso 3.4. Interestingly enough the CFSV2 this am had many more colder recent runs ( blue) than its average.
http://origin.cpc.ncep.noaa.gov/products/people/wwang/cfsv2fcst/imagesInd3/nino34Sea.gif
and the earlier peaking. 1.2 noticeably lower
http://origin.cpc.ncep.noaa.gov/products/people/wwang/cfsv2fcst/imagesInd3/nino12Sea.gif
Jamstec under all of them, like it was last year
Thanks, Joe. Great Saturday summary! I too watched Superchicken way back…
SOI drops? According to KNMI SOI just popped positive.
Here is a CPC/NCEP plot of a few predictions. A lot of diversity, but some fairly super
http://www.cpc.ncep.noaa.gov/products/NMME/current/images/nino34.NMME.png
Hey, Nick!
Let’s take an average of all those predictions. Then we’ll know what to expect… right?
Nick that science looks pretty settled alright
GCR growth will weaken southern polar vortex and larger cooling the South Pacific.
http://www.bartol.udel.edu/~pyle/thespnplot2.gif
Last week on Joe Bastardi’s Saturday forecast, he talked about (and showed) the warmth in the waters around Australia now. Then he showed the waters around Australia at the start of the 1997/98 El Nino: it was cold. Ditto 1983. So his prediction was that this year’s El Nino was not going to be a super El Nino. He said the water surrounding Australia has to be cold for a super El Nino, and explained why.
I just checked his site because sometimes he doesn’t put the new report up until later in the day. But May 16th’s report is up now. He talks about this year’s El Nino, and it’s nowhere near as dramatic as the ECMWF above.
Ah, I was typing as Mr. Bastardi himself was explaining.
The alarmist narrative desperately requires those ‘predictions/projections’ to be true in order to validate the excuses made ex post facto for the near 20 year pause.
If it doesn’t happen they have a real problem.
My position is that the quiet sun is increasing global cloudiness by a means I have set out elsewhere and reducing solar energy getting into the global oceans so that the balance between El Nino and La Nina within the ENSO cycle is moving towards weaker El Ninos and stronger La Ninas for, eventually, a net cooling effect.
If Bob thinks the predictions are physically unfeasible then I go with that. I don’t know any other researcher with even a fraction of his knowledge in this subject.
>The alarmist narrative desperately requires those ‘predictions/projections’ to be true…
Since when?
>If it doesn’t happen they have a real problem.
Not really, if accuracy in forecasting was important to alarmists they’d have faded away by now, I can’t think of a single alarmist prediction that has come true in 25 years. Something else is driving this, and it certainly isn’t any actual threat of catastrophic warming.
The excuse to tax everyone’s energy use is irresistible. Governments use the money gathered this way for other nefarious purposes. They then tell angry people paying high energy prices that this will save the planet from burning up.
Cold, snowy winters and colder than normal summers are screwing this up for our rulers.
Looks like more pre-Paris fever.
Dead on!
Ocean oscillations are just that, oscillations. If a major high happens, a major low is lurking.
So do these models rely on global warming models as an input. In essence basing El Niño on CO2 levels?
Dave, these are long-term weather models (about 6 months), not climate models.
http://www.ecmwf.int/en/forecasts/tools-and-guidance/documentation-and-support/long-range
i’ll believe in El Nino when he gets to #Failifornia…
until then, this is all just wishcasting
Just wait….the Anchovies know…
The current sea temperature.
http://oi61.tinypic.com/2hf6mat.jpg
That’s a nice picture. I wonder what the cell sizes are?
http://www.ospo.noaa.gov/data/sst/contour/global_small.fc.gif
Ren ST diagram. Looks right in Sydney where the sea temp is currently around 20 C whereas normally around this time in other years it would be 16 to 17 C.
Also it might be El Nino but we are still getting consistent rain no doubt says the BOM due to the higher sea temp.
Dramatic images emerged from Nicaragua on Monday after visitors to Nicaragua’s Telica volcano found themselves just metres from its massive crater as it spewed dark clouds of ash and gas high into the sky.
Nicaragua’s most-active volcano let out a first, loud explosion on Sunday (May 10) night, according to the Nicaraguan Institute of Territorial Studies, or Ineter, which monitors seismic and volcanic activity.
http://www.stuff.co.nz/world/68521780/nicaraguas-telica-volcano-roars-to-life-spewing-ash-gas
Bring it on. Normal ENSO pattern
is disrupted. In 82/83… The winter
540 thickness was in Canada. No
cold. No freezes for the Southeast
US in 2015/16. But it must be SUPER.
The Fire Volcano in southern Guatemala exploded incandescent rock and ash over surrounding towns Saturday. David de Leon, spokesman for the national disaster. Scores of residents have been.
Scores of residents have been evacuated from their homes in southern Guatemala after the Fuego volcano erupted, the country’s president says. Clouds of black ash belched into the sky, while.
Scores of residents have been evacuated from their homes in southern Guatemala after the Fuego volcano erupted, the country’s president says. Clouds of black ash belched into the sky, while.
https://youtu.be/vVk2aARCXK8
The Fuego volcano has a history of very high sulfur content eruptions. The Fuego eruption in 1974 did not erupt a lot of material but the high sulfur content put it number 6 on its impact on the climate from the volcanoes in the 20th Century.
Many thanks Bob, something to watch through the lazy, hazy, days of summer, if and when they arrive?
I don’t consider a 6-month forecast as a medium-range weather forecast. The ECMWF gained some notability as a result of an impressive 8-day forecast for the yet-to-form Hurricane Sandy. I think medium-range weather forecasting means from 5 days to a few weeks.
26.03.2015
Two of Mexico’s most active volcanoes are putting on a spectacular show. Ash and gas is erupting from the Colima and Popocatepetl volcanoes. More than 60 explosions have been recorded at the Popocatepetl volcano in the last 24 hours. One of the eruptions is reported to have reached more than 1,000 metres into the air.
https://youtu.be/Jq9Pf3ziU1c
Susan Corwin May 16, 2015 at 8:45 am wrote:
“The question we would always ask at Intel for something like this was:
“how much of your salary/retirement would you bet on this being correct?””
Sadly, the more pertinent question here is:
“How much of your salary/retirement was dependent upon your model coming to this particular result?”
Such is the difference between providing goods/services which a private citizen is willing to buy, and obtaining grant money from an activist publicly-funded entity.
SUPER FEAR-MONGERING for the SUPER PARIS POWER GRAB……
Are these people that far gone from reality? Or is this the next ploy to bilk millions from their money and property and submit themselves to the collective as property. The shear amount of unreasonable exaggeration should be a tip off to the models validity.
sheer
Great commentary Joe and Bill…makes sense with what I see also…thanks
Bill Illis that is! and we all know who Joe is!
Q:- For people who seem to think themselves “experts” * they do not seem to cross check their models against reality very well. Considering that the 1998 El Nino only made just under +3˚C anomaly and the average of the subsequent ones is only about +2˚C on what basis do they really “forecast” +4˚C?
* working definition from 1st Year Engineering, ‘x’ in an unknown quantity and a ‘spurt’ is a drip under pressure.
A:- The advent of Paris seems to be putting a lot of pressure on these drips to put on a performance. Perhaps they should apply for ‘arts’ funding.
(Houston, that model over reach problem seems to have cross infected the El Nino codes. Most seem to be going ballistic by the end of the year let alone the end on the century. Switching to manual.)
Answer : The forecast extent of the forecast 2015 El Nino is calculated as the amount needed to prove beyond any doubt that it is all caused by CO2.
Maybe “arts” funding goes to far. But “theology” funding sounds right.
Certainly, as they have done it, not “science” as it is divorced from empirical data.
Good thinking M Steward. You are making a serious point but turning loose the wits. And does WUWT have wits!
Question: If WUWT is twice as witty are the warmists half-witted? Mean, but also serious as they have NO sense of humor.
02 Jul 2013
Scientists unveil new and improved El Niño forecasts
Professor Hans Joachim Schellnhuber, director of the Potsdam Institute for Climate Impact Research and co-author of the study, said:
“Enhancing the preparedness of people in the affected regions by providing more early-warning time is key to avoiding some of the worst effects of El Niño”.
He says the new algorithm the team is using not only extends the period of its forecasts but also enhances their reliability.
Conventional approaches kept on predicting, long into 2012, that there would be a significant El Niño warming in the last year, he said. But the new approach had already correctly predicted as early as 2011 that there would be no such warming.
http://www.carbonbrief.org/blog/2013/07/scientists-unveil-new-and-improved-el-niño-forecasts/
“The variation between El Niño and La Nina is strongly affected by random chance, so, it’s stochastic, it’s unpredictable, and that’s why IPCC doesn’t attempt to predict that.
So you will find a statement in the latest IPCC report which kind of says that this evolution over the last 15 years was not predicted like that by the IPCC …”
Stefan Rahmstorf — The Climate Crisis
Published on Feb 11, 2014, youtube, 9.50 minutes
Of course we only have a handful of previous El Ninos to compare to so any similarities in pre conditions to previous ones could be completely irrelevant. Perhaps temperatures will drop 4C this time instead of rise. So much certainty from such small amounts of data.
If you look at the actual temperature of area 4, you will see most of it is already at 30C with the balance being mostly 29C. http://www.emc.ncep.noaa.gov/research/cmb/sst_analysis/images/tpacv2.png The Ocean limits it’s temperature to less than 31C. Remember Willis’ posts on the Argo float temperatures that show a hard limit at 31C. How will we see the kind of anomalies that are being predicated?
The color coded sea surface temperature map in an earlier comment here shows a spot of ocean east of India as being 32-plus degrees C.
Donald, you have to realize that this is a full world map and is not necessarily accurate in detailed areas.
If you pull the website http://www.oceanweather.com and find the temperature map for that area you will see that the temperature for that area is at 31C. There is also another area between India and the Persian Gulf that has the same temperature and is not shown on the map. But you can’t expect a map like this to be accurate. The website that I referenced serves the shipping industry and their data is collected by automatic on-board weather monitoring equipment. The data includes wave height, wind speed and direction, and temperature. The temperatures given are actual measured temperatures and are direct water temperature measurements.
Region 4 has already lost much of it,s heat load in the last 10 days. Take a look at the difference between 10 days ago and today using a ssta chart.
I have examined many hundreds of thousands/probably millions of entries in ship’s logs and I can confirm that recorded temperatures (and these are drawn at about 7m below surface) are in many areas well above 30degC. The deep ocean (because of currents and ocean overturning, not because of evaporation) tends to restrict temperature to around 30 degC, but shallower oceans, or oceans where currents are less, or slow down and pool can have significantly higher temperatures.
I have seen temperatures as high as 36degC. Temperatures between 32 and 34 are common place in the Gulf of Mexico, Red Sea, South China Seas, Indian Ocean, in and around Indonesia, off the West Coast of Africa (say betwen Gabon and Ghana).
In the Article that you referred to, I posted a comment of the then current temperatures (in about 10 different locations) given by the Port Authorities which were showing that day, or the highest temperature recorded that year temperatures above 32 degC. I provided website links to many of the Port Authority reports confirming the information.
The equitorial/tropical oceans can get very warm but ocean overturning and currents distributes the ‘excess’ heat downwards (heating the ocean to depth) and polewards (heating the higher lattitude areas) as can be seen in the Arcticle a few days ago showing CERES info on energy distribution.
It is an over simplification (and indeed incorrect) to consider that the oceans only reach about 30degC, and that is the maximum temperature that you will see.
Richard, I didn’t notice your post earlier. I would like to see the sources where you have seen temperatures as high as 36C. In Willis’ posts there were temperatures above 31C; however, they were in coastal areas and as near as I can tell they were often near areas where there were mud beaches or muddy rivers emptied into the Ocean. The only places that higher temperatures are found are the Persian Gulf, which is very salty, in the Ocean and in fresh water lakes, a lake in Southern Russia that is very polluted. Most temperature charts for both fresh water and salt water end at 32C. I have looked for higher temperature and have not found them.
“The variation between El Niño and La Nina is strongly affected by random chance, so, it’s stochastic, it’s unpredictable, and that’s why IPCC doesn’t attempt to predict that.”
Is that so?
You might want to look at my public prediction here made in November 2014:
http://astroclimateconnection.blogspot.com.au/2014/11/evidence-that-strong-el-nino-events-are_13.html
If you look at the 31 year Full Moon Epochs for the Perigean spring tides i.e.:
:
Epoch 2 – 15th April 1870 to 18th April 1901
Epoch 4 – 20th April 1932 to 23rd April 1963
Epoch 6 – 25th April 1994 to 27th April 2025
You find that for the historically recognized moderate to strong El Nino’s, 12 that have started at times that are within +/- 45 degrees of the time where the lunar line-of-apse aligns with the Sun at the Equinoxes and ONLY 2 have started at times that are within +/- 45 degrees of the time where the lunar line-of-apse aligns with the Sun at the Solstices.i.e :
+/- 45 deg. Solstices________2 points
+/- 45 deg Equinoxes_______12 points
If you apply a chi squared test to the data, based upon the null hypothesis that there is no difference between number of points within +/- 45 degrees of the time where the lunar line-of-apse aligns with the Sun at the Equinoxes, compared to the number of points within +/- 45 degrees of the time where the lunar line-of-apse aligns with the Sun at the Solstices, then you find that:
expected value = 7.0
total number of points n = 14
degrees of freedom = 1
chi squared = 7.143
and p = 0.008
This tells us that we can reject the null hypothesis.
Hence,we can conclude that there is a significant difference between number of points within +/- 45 degrees of the time where the lunar line-of-apse aligns with the Sun at the Equinoxes, compared to the number of points within +/- 45 degrees of the time where the lunar line-of-apse aligns with the Sun at the Solstices. The difference is such that the El Niño events in the Full Moon epochs preferentially occur near times when the lunar line-of-apse aligns with the Sun at the times of the Equinoxes.
And if you do the same set of calculations for 31 year New Moon Epochs for the Perigean spring tides i.e.:
New Moon Epoch:
Epoch 1 – Prior to 15th April 1870
Epoch 3 – 8th April 1901 to 20th April 1932
Epoch 5 – 23rd April 1963 to 25th April 1994
You find that for the historically recognized moderate to strong El Nino’s,
+/- 45 deg. Solstices________10 points
+/- 45 deg Equinoxes_______3 points
expected value = 6.5
total number of points n = 13
degrees of freedom = 1
chi squared = 3.769
and p = 0.052
Hence,we can conclude that there is a significant difference between number of points within +/- 45 degrees of the time where the lunar line-of-apse aligns with the Sun at the Equinoxes, compared to the number of points within +/- 45 degrees of the time where the lunar line-of-apse aligns with the Sun at the Solstices. The difference is such that the El Niño events in the New Moon epochs preferentially occur near times when the lunar line-of-apse aligns with the Sun at the times of the Solstices.
Relevant to the general El Nino theme is this article contained in the print version of the Sydney Morning Herald (May 16-7 2015) and on line here:
http://www.smh.com.au/environment/climate-change/going-with-the-flow-scientists-probe-changes-in-the-east-australian-current-20150515-gh2fvj.html
Alarmism at Fairfax is indeed alive and well!
“Currently, we have a relatively weak El Niño in progress, but we expect it to become moderate to strong progressing this coming fall and winter,” Noll said.
The weak El Niño has been significant enough to contribute to heavy rainfall in a large part of Texas and the southern Plains and sporadic rainfall in California this spring.
http://www.accuweather.com/en/weather-news/el-nino-texas-california-beneficial-rain-drought/47173554
I do not see how they can claim that the El Nino has caused the rain in Texas, when it can clearly be seen that the stream of wind coming from the east off of the Atlantic and into the Gulf of Mexico, then turns north into Texas. It is that northward wind flow over the extra warm gulf waters that has carried the rain into Texas and into states further north. What does that have to do with El Nino conditions?
“….After the rain, when the sun comes out,
It will be the hottest day ever;
Computer models will confirm that this is the case;
These climate scientists are so very clever.
But what happens, instead, on a day full of clouds,
With neither any sun nor rain?
Then the scientists will know that this is a sign,
That it will never ever snow again!
If it does snow again? Then that’s just further proof,
That the oceans are storing the heat.
This climate science witchcraft is such clever stuff,
Mother Nature could never compete!….”
From “Alice in Wonderland Revisited” More http:///wp.me/p3KQlH-7G
The upwelling off Peru has been only partly interrupted by the Kelvin wave. Upwelling continues, displaced a little south, where continued strength of the anchovy fishery is still ongoing. This neans no el nino yet.
Well I already read an article that 2015 was the warmest year ever recorded..so I’m sold
I might have missed it above, but is anyone aware if there any published papers around with NOAAs model or BOM model showing any skill for predicting an El Nino? For example, last year the BOM stated something like 80+% certainty of an El Nino at this time of year, but it ended up not happening. And that was not the first year that they got it wrong. Any light shed on their skill would be much appreciated.
El Nino, Katrina and other powerful meteo phenomena will always take us by surprise, even if we know when they will happened. I think that man’s activities on the oceans (such as shipping, fishing, off-shore drilling, off-shore wind farms and other ocean uses) had constantly contributed to the global warming since the start of industrialization, more than 150 years ago. A new chapter on the climate change issue could be now opened, giving more attention to oceanic phenomena under the influence of the potential of the “1982 United Nations Convention on the Law of the Sea” . All research would lead to a better understanding and protection of the stability of our short-term weather and long-term global climate.
Robert Marston Fanney, writing as Robert Scribbler, has begun to re-run his alarmist predictions from last year about a “super El Nino” coming. Although with no visible qualifications, and a terrible track record of predictions, he has a big following.
https://robertscribbler.wordpress.com/2015/05/15/summer-el-nino-on-the-way-long-range-models-are-still-freaking-out/
He mentions the “the so-called Super El Nino Threshold of +1.8 C.”. I see no mention on Google of this. NOAA describes a “strong El Niño” as greater than or equal to 1.5°C, but doesn’t mention a higher level. Has anyone seen this, or is he making this up?
Isn’t he a fantasy novelist?
MRW,
Yes. So I find it odd that he has such a large following for his analysis. He takes the raw data and interprets it as if he is an expert. Sometimes he cite’s experts, but the big calls are his.
Last year he ignited the hysteria about the super monster El Nino, which echoed so strongly on alarmists’ websites.
@Editor of the Fabius Maximus website,
I went to his site–the one you linked to–and read the comments. Let’s hope he doesn’t fart, because if he does he’s going to blow some people’s brains out.
IAN WILSON -made the prediction for this El Nino before anyone. Truth is the truth.
FINAL COMMENTS:
This study is still a work in progress but already we can make some interesting predictions, which if fulfilled would reinforce the claim that El Nino events are triggered by the Moon.
The first prediction is that because we are currently in a 31 year Full Moon Epoch for El Nino events. Hence, there should be heightened probability of experiencing a strong El Nino in the following years:
•2015-2016 (see figure 1)
2019-2020 and
2024
as these are the years where the lunar line-of-apse aligns with the Sun at the times of the Equinoxes.
The second prediction is that, starting sometime around the year 2021, we should begin to see El Ninos events that are more typical of the sequencing seen for the New Moon Epochs (i.e. they will be triggered
when the line-of-apse aligns with the Sun at the times of the Solstices). These times could include:
2022-23 (?) and
2027
Of there is always the caveat that we currently moving into an extended period of low solar activity which could reduce the the overall intensity of El Nino events out to at least the mid 2030′s.
Personally, I think he is wrong, and so is NOAA. My forecast for what is happening stems from the end of February of last year. The next 60 days will either show me that it is time to give up on the thoughts I have held over the last 15 months, or that there is reason to continue on to the next step.
Because Ian’s prediction has been correct he deserves some attention to how he came up with his prediction.
It has not been +0.5 or greater for five months so it’s not an El Nino episode yet. I think it pick up strongly from later this year, and continue through 2016 into 2017. I am basing that on what I think the NAO/AO will be doing.
I see three changes over the past six months as far as sea surface temperatures go.
1. Formation of El Nino.
2. Blob of water off W. North America not as intense.
3. North Atlantic cooling off.
Summer is exactly antiphase to the normal winter timing of the annually phase-locked el Nino. This will weigh against the development of an el Nino event. My guess therefore is that there will not be an el Nino or only a weak and ill-defined one. I also confidently predict that whatever happens in the Pacific will make no difference whatever to climate sociobiology.
Thanks Salvatore – time will tell whether Goldminor and NOAA are correct or whether my prediction is correct.
You have posted some comments from my page i.e.
“Of there is always the caveat that we currently moving into an extended period of low solar activity which could reduce the overall intensity of El Nino events out to at least the mid 2030′s.”
This has been updated by changing the word reduce to ….increase the overall intensity of El Nino events..
Ulric Lyons has suggested that El Nino may be a negative feedback mechanism for world mean temperature that tries to maintain the status quo – i.e. as it cools of the next 20 years or so due to low solar activity the El Ninos become more intense. I would be interested to see why he makes such claims.
If the level of solar activity were not weakening we would normally be going it a period where the overall impact of El Nino on world temperature would be reduced compared to the impact of La Nina – leading to a period of cooling. I believe that this change in relative strength between El Ninos and La Ninas is a 31 cooling cycle set by the strength Lunar tides (2005 – 2035 A.D.).
I am not sure what is going to happen when we have Lunar tides tending to weaken the strength of the El Ninos (relative to La Ninas) and the reduced solar activity tending to increase the strength of the El Ninos (assuming that Ulric is right).
I think the sea surface temperatures will decline in response to prolonged minimum solar conditions over the long run. This situation might result in more El Nino episodes but superimposed on lower sea surface temperatures overall.
The sun could promote more El Nino formation, while at the same time causing overall sea surface temperatures to decline.
Then as you say lunar tides will play a role.
Winter will come to South Australia and Tasmania. Below 0 C at the height of the clouds.
http://earth.nullschool.net/#2015/05/21/0600Z/wind/isobaric/850hPa/overlay=temp/equirectangular=-230.93,-27.79,1009
On 12 May this year, Australia’s Bureau of Meteorolgy officially declared the “start of a major El Niño event.” On that day the monthly SOI average was -10.11. As I understand it, an El Niño starts with an SOI of -8.0. BoM’s certainty is based on their idea of quality modelling. I am following the daily SOI data with interest. At what point can BoM’s prediction be verified or trashed (not for the first time for that alarmist institution!).
https://www.longpaddock.qld.gov.au/seasonalclimateoutlook/southernoscillationindex/30daysoivalues/
Does not look like a drought in eastern Australia, rather a lot of snow in the mountains.
http://earth.nullschool.net/#2015/05/20/0600Z/wind/isobaric/850hPa/overlay=total_cloud_water/equirectangular=-230.93,-27.79,1331
The current Kelvin wave has just peaked and is waning.
Will there be any following Kelvin waves?
Cold water at depth in the east equatorial Pacific seems to be interrupting the formation of further such waves.
If this is so then the current K wave could fizzle out and with it hopes of el Nino – again.
If this is a big event like they predict, will there be an equal La Nina to follow? And if so, how much could the temps drop?
One can only hope. At this point I’ll take any “normal” (e.g. rainy) El Nino at any strength.
Waiting for el Ninot, PART 13
ESTRAGON
Well here we are again, Vladimir old boy
VLADIMIR
Again – its not as if we’ve realy been anywhere else is it?
ESTRAGON
El Ninot is coming for sure this time – we’re not the only ones who think so.
VLADIMIR
Yes we’ve got quite a following at last. You’re really sure this time he will come?
ESTRAGON
I’ll bet my bottom dollar
VLADIMIR
You did that already
ESTRAGON
Just got to wait for those trades to finally reverse – they’re swerving a little north already – and for that Peruvian upwelling to finally stop – these will happen any day now…
VLADIMIR
Any day?
ESTRAGON
Yes – any day now…
The only people that would pick out a single model for discussion would be a cherry picker… Even when all the El Nino models converge, the experts tell us that long range they are not still not very useful.. The experts know how to use the models together and when they are more accurate.
see: “very few models ever suggested a major El Niño event (2). We obtain the range, or spread, using many runs from one model (an ensemble) and/or many runs from many different models (multi-model ensemble). Informally, a “strong El Niño” occurs when the ONI is ≥ 1.5°C (the ONI value for the 1997-98 El Niño was 2.4°C at its peak) and many of the purple lines do not exceed this threshold. In contrast, most of the year, the average forecast of the models predicted a “weak El Niño” (ONI at least 0.5°C but less than 1°C). ” http://www.climate.gov/news-features/blogs/enso/were-model-predictions-el-ni%C3%B1o-big-bust