Guest Post by Bob Tisdale
I just finished the illustrations and text for another chapter of my upcoming book. The latest was about sea ice data. I believe you’ll be interested in one of the topics from that chapter. As noted in the title of the post, the topic is the “pause” in global sea ice extent anomalies.
It is well known that there have been gains in sea ice extent and area in the Southern Hemisphere during the satellite era. Those gains have been exceeded by the losses of sea ice in the Northern Hemisphere, so that globally there has been an overall decrease in sea ice extent and area.
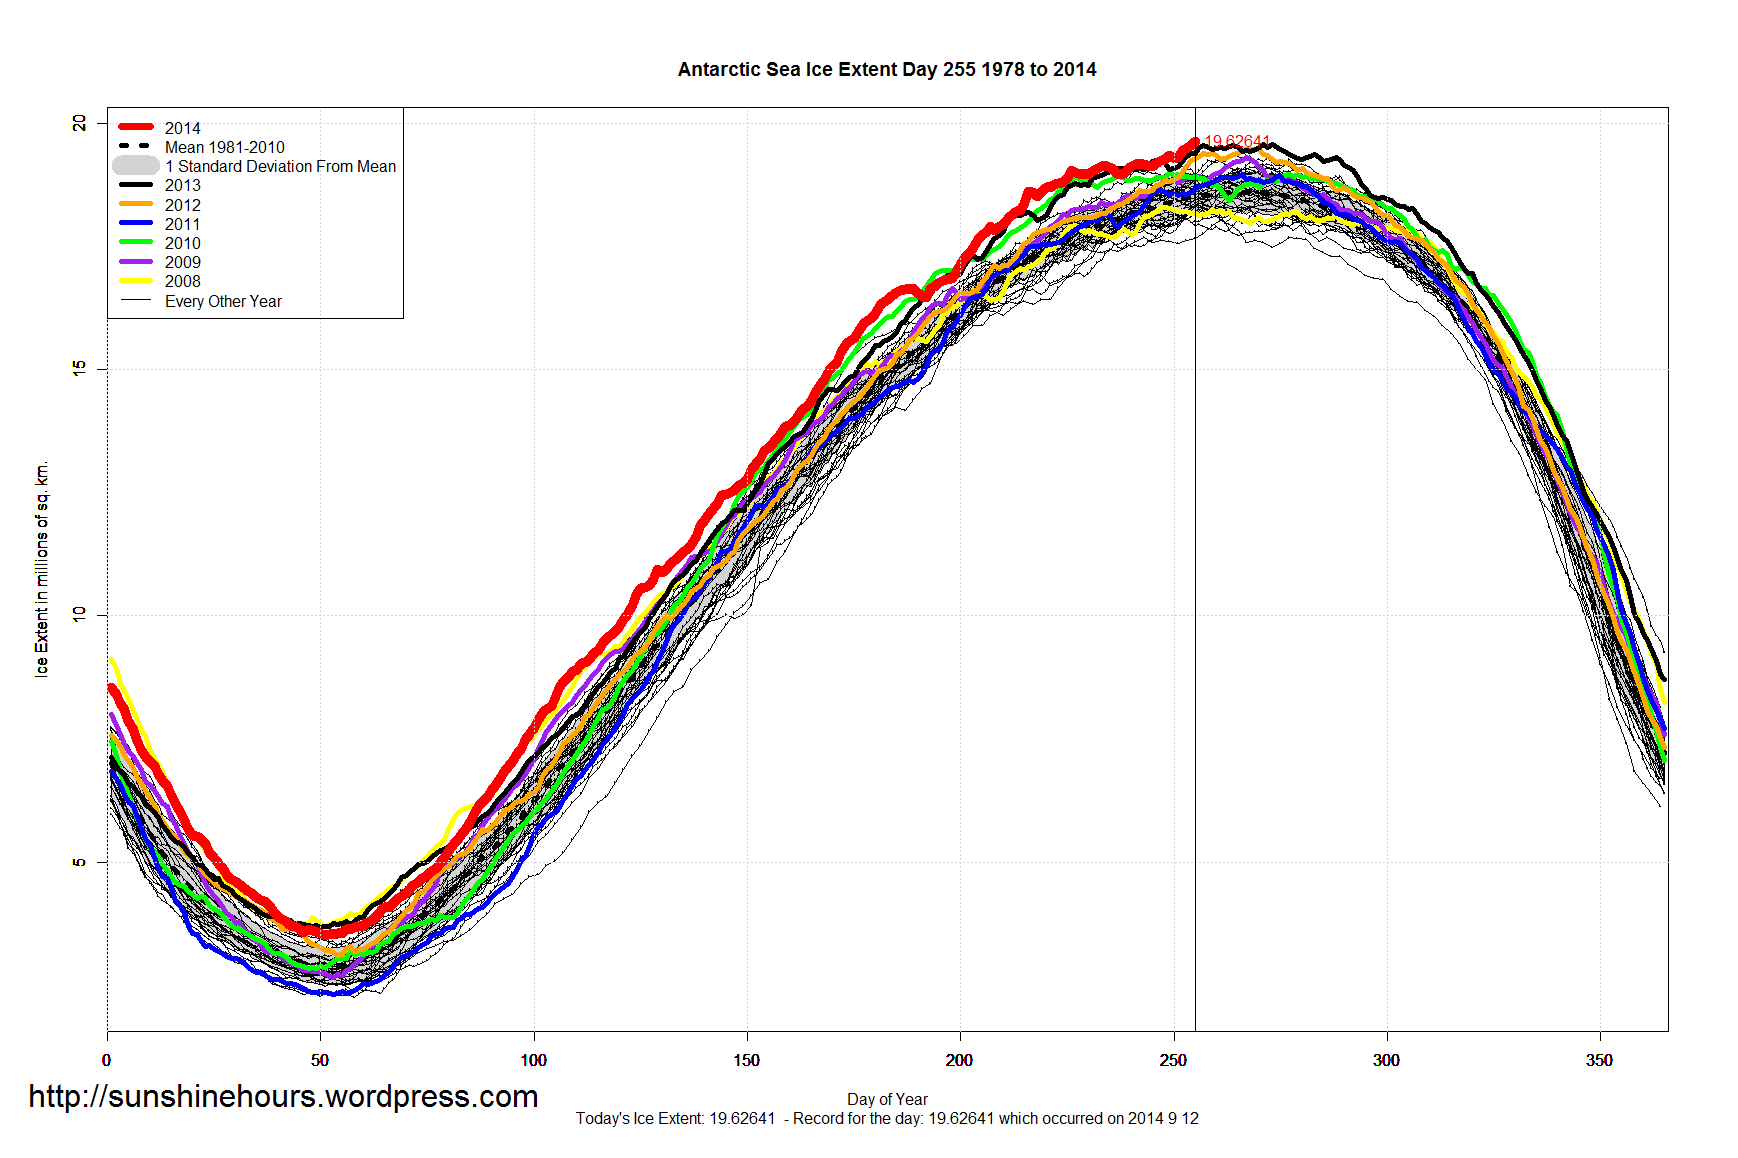
There was a resurgence of sea ice globally in 2013 and 2014, however. That recent resurgence allows us to present the data in another way. We can use a linear trend analysis, starting in April 2015, to determine how far back in time we can go while the global sea ice extent data show no losses or no gains. See Figure 1. Based on the linear trend, there has been no loss (or gain) in global sea ice extent for 178 months…almost 15 years.

Figure 1
Note: Anomalies were calculated against the WMO-preferred period of 1981-2010.
Let me try to counter in advance the misdirection by the CO2 obsessed.
You’ll note that the anomalies on average over that time period are about 400 thousand sq. km below the average for base years of 1981-2010. Keep in mind two things, though. (1) The average global sea ice extent for that period is about 23 million sq. km. On a percentage basis, 400 thousand sq. km is less than 2% of 23 million sq. km. (2) Annual global sea ice extent anomalies have been positive in 2013 and 2014. In other words, for the past 2 years, global sea ice extent has been above, not below, the average for the period of 1981-2010. In fact, global sea ice extent anomalies in 2014 are comparable to those 3 decades ago in 1980 and 1981. See Figure 2.

Figure 2
CLOSING
Global sea ice extent anomaly data are quite volatile. In coming years, the global sea ice extent anomalies could once again fall below “normal”. That, of course, would reduce the length of the pause. Then again, the very noticeable recent increase in global sea ice extent could very well continue.
One thing is for sure: global sea ice is not cooperating with the climate models used by the IPCC for their prognostications of gloom and doom.
SOURCE
The NSIDC sea ice extent data are available in “daily” form during the satellite era. In reality, the daily data only cover the period from July 9, 1987 to present, while, from October 26, 1978 to July 7, 1987, they were supplied every two days. They require a little effort to put them into monthly and annual formats. The Northern Hemisphere data are available here, and the Southern Hemisphere data are here. The NSIDC maintain the data up-to-date at those links. For documentation, see the Arctic and Antarctic Sea Ice Concentrations from Multichannel Passive-Microwave Satellite Data Sets: October 1978 – September 1995 – User’s Guide.
It doesn’t matter. Nothing matters, when it comes to the “agenda” ! It can be Temps still flat, or falling, sea ice slowly climbing in extent, polar bears roaming in S. Dakota, snow on Kilimanjaro down to 4,000 feet, S. sea islands gaining land mass area, nothing will change the voices of the agenda. If Monicas ex boyfriends wife is elected, there will be NO pause in the left of liberals religion.
Excellent! I had noticed that all alarmist presentations of sea ice data end in 2012. Now we know why.
Amazing volatility over small sample size. Geologically speaking, the satellite era is a blink of an eye. Given the volatility and small sample size, we can say very little about long term trends.
Three objections:
1 Sea Ice around Antarctica may be due to the land ice cap spreading out.
2 There is no discussion of thickness of sea ice.
3 In geological terms we have very little data anyway.
No, land ice expansion cannot explain the multi-year, multi-million sq kilometer increase in Antarctic sea ice.
Antarctic sea ice is 1-2 meters thick, re-freezing over open ocean water. To “push” 2 million sq kilometers of sea ice “out” you’d need to physically move 1/7 of Antarctic’s land ice (all much thicker than 1-2 meters!) off of the land and out to sea.
Didn’t happen.
Land ice melting and diluting the water can be argued against as well: The increase occurs across all seasons of the year (free, summer melt, fall re-freeze) and as near-equal rates regardless of whether the sea ice border is close to land, far from land, expanding or retreating.
I was under the impression that the Arctic sea ice has been increasing in thickness and area during the last 3 to 4 years and therefore volume (surface area x depth{thickness}) was increasing.
https://notalotofpeopleknowthat.wordpress.com/2015/05/04/but-the-ice-is-getting-thicker-mr-shukman/
“2 There is no discussion of thickness of sea ice.”
You filled an ice cube tray with water and put it in a temperature controlled enclosure. For several years it just sat there with the water in it but then ~2.5 years ago it started skimming over with ice. What can be concluded about the temperature inside the enclosure?
Nothing. Could be as well that the cube shrinked.
I don’t know what to conclude about the temperature but how long have you been using my freezer do do your experiments?
It’s interesting how rapid the recovery appears to be. Figure 2 shows a steady decline for 25 years and then a recovery in 4 years.
Long term trends before satellite data shows a waxing and waning with an approximate 60 year time span.
It is well documented that for about thirty years before the steady decline was an alarming increase in ice.
Newspaper reports from back in the 19th century speak of advances and declines in arctic ice.
Amundsen traversed the Northwest Passage in 1906 or so, and William Parry is documented as having done so in 1819.
Whatever has happened recently is but the latest in a long series of fluctuations.
Idiotic for anyone to get their knickers in a bunch over it.
Tony Heller has an extensive collection of such newspaper articles archived on his blog site.
Pretty much what I would expect; a 60 something year cycle in both N and S hemispheres. With N and S being almost but not quite anti-phase.
I believe there is less, and less reliable, long term reporting for the Antarctic regions.
It drives Warmunistas nuts when you show them that Arctic sea ice was at or near its height for the century when satellite observations began, following the long cooling period from c. 1945 to ’76, which came after a warming comparable to 1977 to 1996 during c. 1919 to ’44..
Mr. Hooper,
They tend not to respond when such things are pointed out, or will squirm and deny that there is any reason to believe such is true, if not resorting to outright lies.
I am not sure how any discussion of recent trends that does not look at the bigger picture is somewhat surreal and detached from reality.
And little mention seems to be made, and many do not realize I am quite sure, when ice extent is given it is not solid coverage, but anything over the very low amount of 15% of a given grid square.
Current temperature at the South Pole.
http://www.accuweather.com/pl/aq/vostok-station/2273742/weather-forecast/2273742
Most of above pretty irrelevant in light of Arctic sea ice data available BEFORE 1975 which was LOWER see SG site IPCC 1
The maximum extent of Arctic sea ice was reached in 1979, that means less sea ice before 1979.
One might object that in Figure 2 the horizontal blue line is near a MINIMUM of the red line in 1981, but at a MAXIMUM of that red line in 2014.
Jean, would 1985 or 1993 be better years then? We’re still looking at about 2 to 3 decades.
Cheers.
Much derided Steven Goddard/Heller has an interesting post on his Web site
https://stevengoddard.wordpress.com/2015/05/11/visualizing-global-sea-level-fraud/
where he compares the University of Colorado’s sea level rise at 3.3 mm/year with NOAA’s tide gauge record of 1.01 mm/year. With sea levels not really rising, there cannot be a lot of land based ice melting. Perhaps this 1.01 mm is as much due to man’s use and discharge of stored land based water as it is to melting ice and glaciers. So the conclusion must be that possibly overall ice cover is increasing on the Globe. That can only mean global cooling regardless of Obama and his ilk’s pronouncements to the contrary
Heller made three mistakes. 1. The sat altimetry value is 2.8 before a modeled GIA adjustment of 0.3. 2. The tide guage number is higher than previous 1.1, a value inputed by a model in order to assert SLR acceleration when yhere isn’t any. 3. SLR from tide guages is unreliable due to isostasis and tectoniks. Very few tide guages sit on land that is not rising or falling. Essay PseudoPrecision.
In any event, SLR is unaffected by sea ice. Archimede’s principle. Only change in land grounded ice or ocean heat content (thermosteric rise) affects SLR. And that leads to the closure problem proving estimate uncertainty.
I don’t think that the satellite measurement of sea level is devoid of modeling. You might want to ask yourself how the satellite folks apply the inverse barometer and wind effects on sea level, especially as a global measurement takes a long time to acquire. Easy enough with tide gauges – just take a barometric pressure reading and a wind observation at the same time as you read the sea level. Satellites – not so easy. You might also ask yourself why the tide gauge numbers have been relatively constant at under 2mm/yr for a couple of hundred years (three Church & White papers 2011) but the satellite measurements are suddenly more than 50% higher.
These figures look the global temperature record, suspiciously alike. One wonders why 5 institutions are required if they all get the same answer:
CU: 3.3 ± 0.4 mm/yr
AVISO: 3.3 ± 0.6 mm/yr
CSIRO: 3.2 ± 0.4 mm/yr
NASA GSFC: 3.2 ± 0.4 mm/yr
NOAA: 3.2 ± 0.4 mm/yr (w/ GIA)
I do not think the atolls and islands in the Pacific and Indian Oceans are rising or sinking, and tide gages or no, photographic evidence shows oceans a very long time ago pretty much right where they are now.
Why should anyone believe anything from the “It is much worse than we thought” crew?
Reports that the satellite show a different story than the tide gage data smell strangely similar to adjustments that always make the past cooler and the present warmer, and surface temperature trends that for some odd reason do not match satellite data trends
And then there is this:
Bob:
I would disagree with the concept of using “global sea ice” as a metric for anything for trends.
Antarctic sea ice receives 1.68 times the energy that Arctic sea ice receives over the course of the entire year. By assuming both poles get equally illuminated, you are assuming that both will be equally effective and reflecting or absorbing solar energy.
Which is not the case. The edge of the Antarctic sea ice is “in the dark’ only two months of the year, arctic sea ice is completely dark from mid-October to mid-February.
Arctic sea ice darken considerably between April and August, Antarctic sea remains much more reflective that whole melt season.
Antarctic sea ice is hit by sunlight at higher angle of elevation, so it reflects from water much differently than does the low sun over the Arctic.
Antarctica is colder than the Arctic for three reasons. First, much of the continent is more than 3,000 m (9,800 ft) above sea level, and temperature decreases with elevation in the troposphere. Second, the Arctic Ocean covers the north polar zone: the ocean’s relative warmth is transferred through the icepack and prevents temperatures in the Arctic regions from reaching the extremes typical of the land surface of Antarctica. Third, the Earth is at aphelion in July (i.e., the Earth is furthest from the Sun in the Antarctic winter), and the Earth is at perihelion in January (i.e., the Earth is closest to the Sun in the Antarctic summer). The orbital distance contributes to a colder Antarctic winter (and a warmer Antarctic summer) but the first two effects have more impact. (Wikipedia)
Also, katabatic winds are very effective at moving the cold from the pole to the edge of Antarctica. The Arctic has no such phenomenon (it’s as flat as a pancake!).
I agree, we cant use sea ice extent at this time to draw conclusions of any kind. As Ive stated in other posts, the tech does not yet exist to survey sea ice thickness. We can’t credibly speak to total sea ice volume at this time or at any point in our history. We are in the observation and development stage in climate science. We have instruments capable of giving us vague ideas. There is o ly so much we can extrapolate from the data.
“There is (only) so much we can extrapolate from the data.”
I think it may be quite safe to extrapolate that the warmistas… that only tell one side of a story, and that always make dire predictions and warn how horrible it will be if they come true, and yet never take it as good news when these predictions prove unfounded… have a agenda, and that objective analysis is not a part of that agenda.
Very interesting. Do you have any data on katabatic wind trends, particularly in Antarctica?
opluso
No recent measured data has been released showing that a change has happened, only models that are claimed to predict those winds. No historical data has been released showing longer-term trends since the first IGYears of ’56-57-58 either.
No matter how carefully you explain it to them, climatists just can not get the idea of a pause or halt in a trend. As with the 18+ year Halt in warming, they will say you cherry-picked your trend to start 15 years ago.
It goes against the very grain of their Belief system.
Thanks Bob. Look foreward to the book.
I posted this in ‘Tips’n Notes’ ….it is relevant here for the topic:
“THE size and power of ships needed to break through Antarctica’s increasing sea ice levels is a worry for the global research community. ”
http://www.news.com.au/national/breaking-news/forecasting-sea-ice-to-save-scientists/story-e6frfku9-1227350248988
Any minute now I’m going to start quoting Robert Frost.
Bob, have you looked at just the Arctic sea ice trend? It looks to be pretty much flat going back to about 2006
Yes, Marcos. I have that impression looking at
http://nsidc.org/data/seaice_index/images/n_plot_hires.png
Lets see what May 2015 shows.
“image cannot be displayed because it contains errors”
Marcos, the annual trend from 2006 to 2014 is much less than the trend from 1979 to 2006. (About -0.04 million sq. km/decade for 2006 to 2014 versus -0.46 million sq. km/decade for 1979 to 2006.)
But that can’t be said for the seasonal lows. For seasonal lows, the trends over those two periods are much more similar. (About -0.45 million sq. km/decade for 2006 to2014 versus -0.55 million sq. km/decade for 1979 to 2006.)
Cheers
It’s interesting how much warmer the early holocene temps were across northern Russia and Siberia. Here’s the abstract from the 2000 MacDonald et al study. Temps may have been from 2.5c to 7c higher than today. I just wonder how much Arctic ice was left during this Holocene climate optimum? Of course this lasted for thousands of years and co2 levels were presumably around 280ppmv.
Research Institute for Marine Geology and Geophysics, Riga, Latvia LV-1226
Received March 9, 1999
Radiocarbon-dated macrofossils are used to document Holocene
treeline history across northern Russia (including Siberia). Boreal
forest development in this region commenced by 10,000 yr B.P.
Over most of Russia, forest advanced to or near the current arctic
coastline between 9000 and 7000 yr B.P. and retreated to its
present position by between 4000 and 3000 yr B.P. Forest establishment
and retreat was roughly synchronous across most of
northern Russia. Treeline advance on the Kola Peninsula, however,
appears to have occurred later than in other regions. During
the period of maximum forest extension, the mean July temperatures
along the northern coastline of Russia may have been 2.5° to
7.0°C warmer than modern. The development of forest and expansion
of treeline likely reflects a number of complimentary
environmental conditions, including heightened summer insolation,
the demise of Eurasian ice sheets, reduced sea-ice cover,
greater continentality with eustatically lower sea level, and extreme
Arctic penetration of warm North Atlantic waters. The late
Holocene retreat of Eurasian treeline coincides with declining
summer insolation, cooling arctic waters, and neoglaciation.
© 2000 University of Washington.
Key Words: treeline; climate change; Holocene; arctic; Russia;
Siberia; macrofossils.
Here’s a link to the study. http://epic.awi.de/4164/1/Mac2000c.pdf
Thanks for the link, Neville.
My preference is the anomaly presented on this chart: http://arctic.atmos.uiuc.edu/cryosphere/IMAGES/global.daily.ice.area.withtrend.jpg
There were several periods of decline of varying lengths punctuated by short-lived periods of recovery such as from 2003 to almost the end of 2007 when it recovered briefly for only 6 months. Then it bounced back followed by another declining trend until the end of 2011 when it bounced back up again. But again – it didn’t hold and dropped low at the end of 2012.
However… at the end of 2012 it recovered yet again but this time the recovery has held and has been holding for now over two years. For over two years global sea ice area has remained at a level no different than what it was in 80’s.
Only time will tell if the current state holds but every day it remains at the level it is – is further proof that global conditions for sea ice have “flipped” back to what they were 30 years ago.
And the best thing about looking at sea ice? … the NCDC cannot go back and “adjust” the freezing point.
http://c.o0bg.com/rf/image_960w/Boston/2011-2020/2015/02/27/BostonGlobe.com/Metro/Images/coyote-big.jpg
That’s an excellent point.
What really will matter is the next 10-20 years. All metrics I see point to a substantial cooling.
The Sun is going quiet.
The Pacific Ocean is pretty warm with a good el Niño in progress and the global temps are staying fairly constant. With the inevitable flip back to la Nada or la Niña and if the temps don’t rise much in the next year or so, what will the cooler water portend in the next five to ten years?
Snow cover in the NH has increased.
And the historical oscillations from global cooling to warmth to cooling are indicating a fairly large stretch of cooling ahead.
Sea ice is trending towards more coverage. With the large land masses surrounding it and the Japanese and Gulf Stream currents forcing weather pattern shifts, the Arctic has always been susceptible to oscillations in ice coverage. But the big surprise to a lot of people is the Antarctic ice increase. Is it the bellwether?
Exactly. I agree100%.
And it is solar activity is what determines sea surface temperatures.
Note that the ENSO meter just fell back to 1.0 today. Regions 3 and 4 have given up a lot of their heat. Today, Region 1/2 also shows a loss compared to yesterday. All of this started back around the 3rd of this month. Basically, it is over. There will be gradual cooling until July, and then increased cooling afterwards through the ENSO Regions.
The Blob in the Pacific has two cooler intrusions splitting up the large warm mass. The lower arm of that cooling has just broken through to coastal California, between SF and LA. The upper cold arm will split the northern Blob in two, while landing around the Wash/Oregon border. That is where the remaining extra heat load is sitting in the Northeast Pacific. I look forward to a pleasant summer with occasional clouds cooling the area as those cool intrusions work their way eastward, there may even be some summer rain.
I haven’t got an ENSO meter. Where can I get one from? JB Hi-Fi? Bunnings Hardware?
@ RoHa…you are in luck as I just got in a fresh supply of newer ENSO meters. Priced to sell, and don’t forget to check out the buy 2 package for extra savings. I never leave home without my ENSO meter in my pocket.
Based on the linear trend, there has been no loss (or gain) in global sea ice extent for 178 months…almost 15 years.
How ’bout that?
Thanks, Bob.
A wider perspective on sea ice extension is valuable.
Bob, I can’t wait for your book on land ice.
http://www.climate-change-knowledge.org/uploads/nasa_land_ice.gif
The data you present is in high dispute both for the reason and the actuality of the data.
Barry,
You’re cherry-picking “land” ice now because that serves your confirmation bias. But the debate has always been over sea ice:
Antarctic sea ice is at an all time high:
http://nsidc.org/data/seaice_index/images/daily_images/S_stddev_timeseries.png
In fact, Antarctic ice just set a new record:
Remember that the Antarctic holds 10X the volume of ice that the Arctic has.
Face it, Barry, your ‘disappearing ice’ scare is alarmist nonsense.
Current temperature over the North Pole sharply below normal.
http://ocean.dmi.dk/arctic/plots/meanTarchive/meanT_2015.png
@ ren…that looks to be a record for this time of year. There are only 3 other somewhat similar episodes which show a drop in temps around this date.
Ren– DMI has been tracking Arctic temps since 1958.
These cold Arctic temps aren’t a record for this time of year but they’re very close. We haven’t seen Arctic temps this cold for this date since the 1960’s…
These abnormally cold temps will obviously have some effect on Arctic’s minimum this summer but how much is anyone’s guess.
What’s more interesting is the thickness of arctic sea ice, which is substantially thicker compared to 2007 for this time of year:
http://home.comcast.net/~ewerme/wuwt/cryo_compare.jpg
Baring another once-in-50-year Arctic cyclone event like we saw in 2012, the 2015 Arctic Minimum will be substantially larger than 2007 and will likely add to the growing multi-year Arctic Ice volume.
“The Blob”, the El Niño and the Rediculously Resiliant Ridge in the North Pacific/Bering Sea substantially reduced Arctic Sea Ice Extents on the Pacific side of the Arctic this winter, but these will all be gone next year, so Arctic sea ice in the winter of 2015/16 should be interesting to watch.
As the AMO continues to cool before switching to its 30-yr cool cycle around 2022, it’ll be fun watching the CAGW advocates squirm. The PDO entered 30-yr cool cycle in 2005, and there had already been increasing sea ice formation on the Pacific side, with the exception of this year for the aforementioned reasons.
The current solar cycle is the weakest since 1906 and peaked in 2014. If the Svensmark Effect pans out, this may also add to increasing Arctic sea ice.
Now is not a good time for the warmunists.
“Bob, I can’t wait for your book on land ice.”
Barry,
Are you really insinuating the lower latitude, elevated, ice covered interior is somehow warmer then the surrounding ocean? Somehow CO2 is causing the ice to melt and slide into the ocean? You do also realize that the ocean’s temperature is going to regulate the earth’s temperature. (high heat capacity) I would either recommend reading your physics 101 textbook or maybe you want to rewrite the laws of physics?
As far as Antarctica gaining mass.
http://ntrs.nasa.gov/search.jsp?R=20120013495
http://www.agu.org/pubs/crossr...
wattsupwiththat.com/201…
ntrs.nasa.gov/archive/n…
Even NASA admits there was mass gain in Antarctica 1992-2008. So did CO2 decide to warm Antarctica just after 2008? Why not look at Antarctic surface temps from 2008-present?
Corey,
Sir, well said.
I recall the first time I was told that the explanation for the increase in Antarctic ice was, in fact, a direct consequence of global warming.
Some crappola about winds blowing this way or that, and/or land ice melting, running into the ocean, where it mixed with salt water and promptly refroze after moving to a lower latitude.
All propounded as serious scientific analysis and spoken with a straight face.
Or presumably so.
I suppose, upon further thought, that it is possible it was something like this…in fact that all warmista arguments are something like this…behind the scenes:
https://youtu.be/DGXx56WqqJw?t=22s
Warmists logic 101: Satellites are capable of accurately measuring gravity field changes within an ice sheet to determine changes in mass and these data are superior to altimeter satellite data using radar which is superior to altimeter satellite data using laser. This is simply because the gravity field data show a bigger decrease in ice sheet mass. These same altimeter satellites that are not great at measuring the relatively constant ice sheet surfaces are great, however, at measuring the dynamic surface of the ocean to determine it’s elevation to within a mm. Satellites can do these wonderful things but when determining the average global heat within the lower atmosphere the data should be ignored in favor of the spatially sporadic ground-based data.
Skeptic logic: There are some very big oddities with that gravity data. If you were to accept the data as precise and accurate then you need an explanation for the wild variability in the data, i.e. 500+ Gt changes in ice volume within a few months. Then, even more inexplicable, you need to determine how some of these sudden and drastic decreases in Antarctic ice volume occurred in the middle of the southern winter, e.g. June-Aug 2002, June, 2003, June-July 2004, etc.
Land ice mass variation based on GRACE. Ha, ha, ha, ha, ha, … falls off chair!
Data from 2011 going up to 2009. Anything happened since?
Barry, I would expect a long term decrease in land ice from the last interglacial ice advance for two reasons:
1) A recovery from an interglacial ice advance would mean a slow warming trend.
2) Glaciers grind mountains down, bringing the ice mass into warmer altitudes.
Barry, do you have a link to the data in those graphs? Along with documentation? I’d be happy to include it in my book.
Barry,
Sir, can you please explain why you presented graphs which began in2002, and ended in 2009?
I am sure you have a good reason, as it would obviously be quite deplorable to cherry pick a short period that shows a certain trend.
Another problem for you Barry: data shows that Antarctic temps have been flat for over thirty years. So what’s melting the land ice, if indeed it is melting?
The Arctic will be ice free this summer. A scientist says so.
https://climatesanity.wordpress.com/2015/05/09/definition-barber-event/
Next joke.
With the AMO ,now returning to a colder phase Arctic Sea Ice will be recovering while Antarctic Sea Ice will be remaining above normal due to below normal sea surface temperatures in the Southern Ocean.
Global man made warming having nothing to do with any thing.
When will Arctic ice recover? It surely is not happening yet: http://nsidc.org/arcticseaicenews/
Chris, Arctic ice has been recovering for years:

And since the subject is GLOBAL warming (actually, the lack of global warming), here’s what’s happening to GLOBAL ice cover:
There is nothing unusual or unprecedented happening. Arctic ice is the highest since 2006. So please, stop with the silly scare stories.
Chris
And why do you fear the loss of Arctic sea ice. from today’s sea ice extents, losing additional arctic sea ice only means additional heat loss from the Arctic ocean between August and April every year.
dbstealey,
You brought up Arctic ice, so why are you switching topics to global ice? No, Arctic ice areal extent is declining, just as the chart I showed indicates. I’ll continue to rely on data from NSIDC, you can continue to rely on Steven Goddard and his pixel counting skills. And in any case, Goddard’s point is not about areal extent, which is what matters for albedo and impact on weather.
@RACook said: “And why do you fear the loss of Arctic sea ice. from today’s sea ice extents, losing additional arctic sea ice only means additional heat loss from the Arctic ocean between August and April every year.”
Because of the impact on weather in the northern hemisphere: http://www.arctic.noaa.gov/future/bib/Vihma_accepted_in_Surv_Geophys.pdf
Chris
You say
OK. That paper says observations show no effects but reanalyses and modeling do.
Is your linking of that report of no observed harmful effects a claim by you that you think there is no reason to “fear the loss of Arctic sea ice”?
Richard
richardscourtney (replying to Chris)
Chris: So, I’ve quoted your reference above. Now, back to my question. Why do you fear a further loss of Arctic sea ice?
The paper you cited contains no such warnings nor serious problems. Actually, at best, it says there is no data to make a strong conclusion.
Chris
May 11, 2015 at 11:03 am
Interesting paper from Vihma. He clearly reveals in Figure 3 of the paper that the Arctic produces a huge negative feedback from Global Warming – colder winters in mid-latitudes.
Chris
look at the total volume. Arctic sea multiyear ice is up this year and unless there is a huge change in temperatures it will be up again next year. couple this with the increase in Antarctic ice and you have the potential for record global sea ice in the next few years. what argument will you have left if that happens?
Chris, the Arctic Sea Ice is recovering and will continue to recover. The nonsense from AGW enthusiast is just that utter nonsense. Once the AMO becomes more entrenched in it’s cold phase watch what happens to Arctic Sea ice extent and volume.
The fact that Antarctic Sea Ice is above normal and near record highs or at record highs for the past few years should convince you that what AGW theory is saying about Arctic Sea Ice, which it is declining due to global man made warming is not correct.
If it were the same thing would be happening in Antarctica.
Chris,
You asked:
When will Arctic ice recover?
I gave you my answer, then I tried to remind you of what started the basic debate, which has always been about man-made global warming.
From that, the debate morphed into the vanishing Arctic ice scare. The reason is because Arctic ice cover dropped for a few years, and the alarmist crowd thought they had finally found a prediction that worked! Sadly for alarmists, no.
Sorry to disappoint, but Arctic ice is now recovering nicely. The dip was from about 2006 – 2012 or 2013. Now the Arctic is getting back on track. So, another false alarm. Really, there’s nothing unprecedented or unusual happening. Just natural variability.
Richard, RACook,
From the paper:
“Several scientific papers, to be reviewed here, have addressed the
potential causal links between the Arctic sea ice decline and these cold winters in midlatitudes.
In addition to the exceptional winters, large parts of central and northern
Europe have recently experienced six consecutive wet summers, which is exceptional
(Screen, 2013). A few studies have addressed the potential links between the sea ice
decline and rain fall in Europe, the Mediterranean, and East Asia.”
My interpretation of that is that it is referring to specific observed phenomena and connections to changes in Arctic sea ice. It does not say the Arctic ice extent is the sole factor, but does suggest that it is one of several key factors affecting the climate in the regions mentioned.
Barry & Chris:
Arctic ice is just about at normal (the orange lines are the long term median):
http://nsidc.org/data/seaice_index/images/daily_images/N_daily_extent_hires.png
And Antarctic ice is way above the median:
http://nsidc.org/data/seaice_index/images/daily_images/S_daily_extent_hires.png
Your ‘vanishing ice’ scares don’t work here. We know better.
dbstealey May 11, 2015 at 9:25 am
Barry & Chris:
Arctic ice is just about at normal (the orange lines are the long term median):
As of today it’s about 2 std dev below the mean according to the source of those maps you posted.
Apparently you don’t know better stealey.
Use your eyes, Phil., then you will see what everyone else sees: the problem is only in your head.
Those that can, do. Those that can’t, teach.
Phil. (commenting on the dbstealey reply to Barry and Chris)
dbstealey May 11, 2015 at 9:25 am
Barry & Chris:
And that’s exactly what he said! “Natural” deviations are considered within 2 std deviations of an established mean. And, for most of the past year, Arctic sea ice was within 2 std deviations of its 1980-2010 average. It is now slightly below 2 std deviations. So, “just about normal” means exactly what is happening = “just below normal” Db didn’t claim Arctic sea ice was “normal” as you want to imply.
What you (deliberately) ignore, is that, for almost all of the past 4 years, Antarctic sea has been ABOVE two std deviations ABOVE normal for all parts of the year at ALL melting, freezing, and re-freezing times of the year. Many years of out-of-normal (positive deviation) trump a few weeks of low sea ice.
Just the “excess” Antarctic sea ice last June was greater than the entire area of Greenland. It is now some 7/8 the size of Greenland. At Greenland’s latitude.
dbstealey May 11, 2015 at 7:12 pm
Sorry to disappoint, but Arctic ice is now recovering nicely. The dip was from about 2006 – 2012 or 2013. Now the Arctic is getting back on track.
Back on track to what? It’s currently at its lowest level for the date (NSIDC, JAXA, DMI etc), hardly a recovery!
“None so blind as those who will not see!”
RACookPE1978 May 12, 2015 at 3:36 am
Db didn’t claim Arctic sea ice was “normal” as you want to imply.
Actually he did, I implied nothing I quoted him:
“Arctic ice is just about at normal”.
Of course with his agenda, two or three std dev below normal is “just about normal”, but the same amount above normal is “way above the median”.
Stealey is a propagandist pure and simple he’ll produce any graph he can find that suits him regardless of whether it’s been proven to be wrong (he does this all the time with his fake GISP plots).
He did it just above saying:
“Arctic ice is the highest since 2006
Which is of course not true, but then he’ll do a ‘bait and switch’ and change the subject.
Phil. go see an opthamologist. The rest of us can see this:
EVERYBODY PANIC!!
…or not.
Phil. calls me a “propagandist”. His name-calling is due to the fact that he’s lost the argument. Phil. seems to actually believe his own nonsense that a temporary fluctuation in Arctic ice is indicative of anything except regional variability.
Phil. is used to losing his arguments. But don’t take my word for it: Planet Earth is the arbiter.
@dbstealey…Phil also forgets that when the sea ice extent recovered that the warmist argument switched to the volume of the sea ice being much lower than normal. Unfortunately for them Piomas is now showing that Arctic sea ice volume has also recovered to the level of 2006 volume.
Why would anyone take your word for anything stealey, when you can’t stand behind it from one post to the next? As predicted above, when challenged on your false statement you run off and post something completely different.
In support of your claim:
“Arctic ice is now recovering nicely. The dip was from about 2006 – 2012 or 2013. Now the Arctic is getting back on track.”
you posted maps produced by NSIDC, yet that same organization shows data that the present level is the lowest recorded for the date. Also they showed that this year’s maximum was the lowest on record by about 3 std dev below the mean.
Start telling the truth and stop the ‘bait and switch’ and perhaps you could be regarded as something other than a propagandist, but for the moment the cap fits so you’ll have to wear it.
Pressure anomaly is visible in the stratosphere over the northern polar circle.
http://www.cpc.ncep.noaa.gov/products/stratosphere/strat-trop/gif_files/time_pres_HGT_ANOM_AMJ_NH_2015.gif
I regularly update a graph of global sea ice area showing monthly and annual values from 1996 here:
http://www.friendsofscience.org/assets/documents/FOS%20Essay/GlobalSeaIce_Area.jpg
The data is from here. Hmm, the website seems to be down at the moment.
It can be found by a thumbnail link in the first column of the home page here.
Ren, apparently, in the graph title, GPH means GeoPotential Height, which ranges from -6 at the surface to over +10 at 25 km altitude. What does GDAS-CPC mean in the title?
What point about geopotential height are you trying to make?
Ken Gregory
http://www.cpc.noaa.gov/products/precip/CWlink/daily_ao_index/hgt.ao.cdas.gif
http://www.cpc.ncep.noaa.gov/products/stratosphere/strat_a_f/gif_files/gfs_z30_nh_f00.gif
I have long believed that the extent of Antarctic sea ice is a much better indicator of global climatic conditions than the Arctic sea ice. Just look at a globe or a map of the world. The Arctic ocean is 80% landlocked. The only major link to the rest of the world’s oceans are in the North Atlantic, around Greenland and Iceland. There is only a very narrow channel between Alaska and Siberia that connects the Arctic to the Pacific. And the Indian ocean has no connection to the Arctic at all. The Arctic ocean is more like a gulf or a huge saltwater lake than an ocean.
Compare that with the seas surrounding Antarctica. These seas in which the ice has been steadily increasing, in spite of Al Gore’s wet dreams, are completely open to the warmer waters of the Atlantic, Pacific, and Indian oceans. Heat can easily transfer from the equator to the Antarctic region by conduction or convection.
This graph shows sea ice from 1975 (Arctic) it was less than it is now, so no NH ice is exactly the same it was 30 years ago
Actually it was much less than it is now