Guest essay by Clyde Spencer
Unless you have been in cryogenic suspended animation for several decades, you are aware of the extreme polarization about the role that CO2, particularly from burning fossil fuels, assertedly plays in warming the planet. I will attempt to provide a fresh perspective on the issue below.
It seems that many people think of global circulation models (GCMs) as being a virtual reality, or at least some kind of scientific ‘truth.’ What is generally unappreciated is that the GCMs are, instead, complex and convoluted working hypotheses. As such, they are a part of the Scientific Method. However, they should be subject to careful scrutiny, evaluated against reality, and modified as appropriate to conform to reality. That is the essence of the Scientific Method! Any hypothesis that does not have utility as an explanation, or have reliable predictive powers, does not achieve the purpose of scientific theories.
The extant GCMs, while purporting to work from first principles, have widely varying predictions of future temperatures, and are generally contradictory in their predictions of future precipitation patterns. Projections fail to mimic the step-like behavior of past, recent temperature increases. They gave no prediction of the current plateau in average global temperatures, nor do they provide an acceptable explanation for the current temperature plateau. The only thing that they have in common is an upward trend, not unlike CO2, or even the general population growth. Clearly there are problems with the computer models! Apparently, basic assumptions about the relationships of feedback loops add an element of subjectivity that nullifies the goal of operating from first principles. There are other more technical criticisms of the GCMs, but I won’t go into them here. As long as all the modelers assume that CO2 is driving temperature increases, one can expect that the models are going to display that behavior because CO2 is increasing. If I were to buy a high-performance car, based on computer simulations of similar veracity, I’d ask for my money back.
Let’s assume, for the sake of argument, that anthropogenic carbon dioxide (CO2) is indeed a significant contributor to global warming. I will define “anthropogenic” as any production that is influenced by or created directly by humans from carbon sources that have been sequestered for short or long periods of time. The International Energy Agency (citing the US Dept. of Energy) claims that the burning of fossil fuels contributes more than 31 gigatons (Gt) annually to the atmosphere.1 However, fossil fuels used for transportation, heating, and power generation aren’t the only anthropogenic sources of CO2. The calcining of limestone to make cement (>3.8 Gt annually2) additionally produces more than 3 Gt of CO2 annually,3 of which approximately 2 Gt is CO2 produced from the chemical decomposition of limestone alone.4
To the extent that biomass is burned to supply heating and cooking, at a rate greater than it is replenished, there is a net contribution of CO2 to the atmosphere that is tied to population. If deforestation of old trees is accomplished by burning to make way for expanding agriculture, then there is a net contribution of CO2 again tied to the expanding population. Controlled burns of forest land and agricultural stubble are an additional anthropogenic contribution. Probably wildfires started by arsonists should be considered anthropogenic sources of CO2 also! Maybe we should also consider the CO2 resulting from smoking tobacco and marijuana for a thorough accounting! To be conservative, let’s assume that intentional biomass burning amounts to about 1 Gt annually.5
Additionally, CO2 released from fermentation of alcoholic beverages and the rising of leavened bread dough contribute in proportion to the population. The production of bio-ethanol produces CO2. CO2 is also an industrial byproduct of hydrogen production by steam reforming, and the synthesis of ammonia. Limestone is used to neutralize industrial-waste acid streams, and in so doing, CO2 is released. Steel can be produced without using fossil fuels for heat, but coke (derived from coal with the release of CO2) and limestone as a flux, are still important in purifying steel in the smelting process. Magnesium production directly produces CO2. While I don’t have good estimates on the industrial contributions, it probably would be reasonable to assume that it is at least 2 Gt annually.
However, a complete accounting of anthropogenic sources of CO2 needs to recognize the contribution of respiration, 24 hours a day, of some 7 billion humans and the animals that feed them (not to mention the methane that both produce). Humans alone produce nearly 3 Gt of CO2 annually6 just breathing. Some argue that this isn’t appropriate to consider. However, if an increasing population is producing more CO2 from metabolism, and if vegetation isn’t immediately converted back to oxygen and carbohydrates, then it needs to be accounted for! Agricultural land would largely be covered with vegetation even if there were no humans. The difference is that by planting cultivars, humans promptly convert that vegetation into CO2! Excluding respiration makes about as much sense as ignoring biomass burning. Animal respiration and digestive gases are usually allocated to natural sources. However, I would argue that, if the animals are domesticated, then the respired CO2 should be considered anthropogenic in the same sense that industrial fermentation is. Let’s assume that humans and their domesticated animals together contribute approximately 5 Gt of CO2 to the atmosphere annually. Landfills and sewage also create CO2 and methane of an additional undetermined amount! Farmland plowing is claimed to be a significant source of CO2; however, I have not seen what I would consider reliable estimates of the actual amount.
The above calculations and available estimates come to at least 41 Gt of anthropogenic CO2 annually. Conventional estimates of anthropogenic CO2 vary, but typical values are around 38 Gt annually,8 which doesn’t include respiration; therefore, my estimates (exclusive of respiration) are in line with conventional estimates.
To complicate things further, a generally unappreciated, significant source of CO2 is underground coal fires.8 An unknown number of smoldering fires in organic-rich shales are found throughout the world, also.9 Some of this CO2 can be assigned to anthropogenic origins, but there is a large number that are natural in origin, started by lightning or spontaneous combustion. One fire in Australia has been burning for 6,000 years.10 I have not explicitly taken these into account, and conventional Carbon Cycle accounting ignores them. An unknown amount of coal is consumed by fires in China, but estimates run as high as 200 Mt per year,11 and they possibly produce as much CO2 as all the cars in the USA! There are thousands of coal fires throughout the world and CO2 estimates run as high as 3% total new CO2 derived from them — nearly as high as for cement production!
The energy and fossil fuel use in industrial societies is a tangled web and sometimes it is difficult to decide where to assign sources. All things anthropogenic considered together, excepting fossil fuels, probably produce an amount equal to at least one-third the CO2 emissions from burning fossil fuels. These additional sources of anthropogenic CO2 are important because even if fossil fuels were eliminated tomorrow, if nothing is done to reign in the growth of population, these other sources will grow to become significant. Even in the absence of any fossil fuel combustion, should the world population triple, they would produce anthropogenic CO2 of at least 30 Gt annually – what is produced currently by all fossil fuel combustion! Assuming that CO2 is the problem claimed by many, we would be confronted with essentially the same problem that we currently are concerned about! Actually, it could be worse because warming oceans will be less effective at sequestering CO2. Is there really any wonder that the shape of the curve representing the CO2-concentration time-series resembles the population growth curve? The elephant in the room that few are willing to talk about is the runaway population growth since the beginning of the industrial revolution.
I have begged the question of the magnitude of the influence of anthropogenic CO2. Unless one can quantify all the influences on warming, it is impossible to assert confidently that the CO2 derived from fossil fuels is the major contributor to warming. Therefore, let’s return to the initial assumption that anthropogenic CO2 is the dominant agent responsible for 20th century warming.
Undeniably, physics predicts that CO2 will cause warming by absorbing infrared radiation radiated outward from Earth’s surface.12 The question is, “What proportion of measured warming is directly attributable to the atmospheric CO2 concentration?” To answer that, we have to look at all the processes that are known to, or could, influence warming.
Other factors that play a role in increasing temperatures, and thus changing the climate, include the following:
1) Compared to the heat supplied by the sun, the waste heat from our profligate use of energy is miniscule. However, it is sufficiently large to be calculable. Notably, it is concentrated in urban and industrial areas and contributes to the Urban Heat Island effect. It has the potential to upwardly bias recorded temperatures and falsely give the impression of greater warming than is actually taking place globally. Weather stations recording temperatures are neither random nor uniform in coverage; they are biased by being located where most people live. After all, who is going to be willing to pay for information in some remote corner of the world where few if any people live?
2) A decrease in cloudiness, particularly cloudiness in the mountains, may contribute to general warming and, especially, the retreat of glaciers. (There is anecdotal evidence that most alpine glacier retreat is impacted more by increased surface insolation than an increase in ambient global air temperatures.13) Decreased cloudiness not only has implications for surface insolation, but also implications for precipitation. It is well known that the energy exchanges within clouds are handled poorly (somewhat ad hoc) by the current GCMs, and probably always will be! The phase change from vapor to liquid is exothermic and the phase change from liquid to solid is also exothermic, but the amount of heat released is not the same. This is one of the complications encountered by GCMs because the clouds, in which these transformations occur, are much smaller than the grid-cell size used for all other calculations.14
3) A decrease in aerosol concentrations and/or type since the 1970s, when the first serious efforts to reduce air pollution began, may impact surface insolation as well as cloudiness by reducing nucleation particles.15
4) A dense network of condensation trails from commercial aircraft can accumulate, under favorable meteorological conditions, and noticeably dim sunlight over large areas. What is their effect on upwelling radiation at night? The IPCC states, “The level of scientific understanding of contrail RF [radiative forcing] is considered low, since important uncertainties remain in the determination of global values.”16
5) An increase in surface water-vapor resulting from a) a world-wide program of dam building in the 20th Century, b) increased irrigation, and particularly, c) the invention of pivotal irrigation17, may be responsible for increased retention of heat at night and a decrease of temperatures in the day in arid rural areas. Massive amounts of water sequestered in deep aquifers under the Great Plains, and elsewhere, have been extracted and used for irrigation18. Microclimates change within irrigated fields, and in proximity to large reservoirs. Also, one of the by-products of internal combustion engines is water. (Hydrogen-powered cars would exacerbate this.) Water vapor has a much shorter residency (≈9 days)19 in the atmosphere than CO2, but a stronger ‘Greenhouse’ effect than CO2. It is replenished regularly – every commute cycle in cities and continuously at reservoirs! Furthermore, assuming prevailing winds transport the water vapor easterly at an average of 15 MPH, any individual ‘pulse’ can travel approximately 3,200 miles! Thus, there is the potential of water vapor evaporated in the western US influencing most of the country to the east. In places like Phoenix and Las Vegas, swimming pools and golf courses are ubiquitous where there were few 50 years ago. Also, one can now find water-misters at bus stops, gas stations, and backyard patios, driving up the relative humidity. In the 1950s, so-called ‘swamp coolers’ were common in the hot SW desert communities; one never sees them anymore because evaporative coolers aren’t as effective as they once were. The water vapor being generated over land that is naturally arid would help explain why average surface temperatures are rising faster than at the altitudes CO2 is supposed to be trapping outgoing thermal radiation. An examination of the Berkeley Earth project’s global high and low land-temperature data20 reveals that the low temperatures have been increasing steadily and for a longer period of time than the high temperatures. Furthermore, the lows have increased more than the highs during the 20th century. (See below) This is what is expected for a ‘Greenhouse’ effect, but it may be more than CO2 driving the increase!

6) Changes in land use, including urbanization and converting forests to agriculture, generally result in greater surface heating because of reduced albedo. Urban areas are not only local hotspots, but remote sensing research has demonstrated that the weather can be influenced for miles downwind of these hotspots.21
7) Albedo of snow and ice can be decreased not only by soot from combustion, but also by dust created from land that is plowed, and urban dirt such as tire and brake-lining dust, and abraded pavement. This can help explain warming in Winter, and glacier melting.22
The above are obvious contributors to temperature changes. Many of them are potentially related through feedback loops. Unfortunately, they aren’t well characterized. To the extent that they are ignored, and GCMs are tuned to get apparently good historical results based principally on CO2 trends, then the confidence in predictions is decreased precisely because we know that things have been left out! Individually, they may not be exceptionally important; however, in aggregate, they may be very important, particularly if they are components of incomplete feedback loops.
However, what is potentially a more severe problem in model building are the things that may be missing. One doesn’t know what they don’t know! As examples:
1) The sun is the most important source of heat for Earth. Satellite observations of a couple of sun spot cycles indicate that there is trivial variation in the sun’s Total Solar Irradiance (TSI) during those recent cycles.23 But, what if there are longer-term variations (>22 years) that haven’t been measured? Astronomers believe the sun was dimmer when the Earth was born and variations in observed sunspot cycles and radiogenic evidence strongly suggest that there are intermediate-term variations in solar activity that have not been characterized nor included in models.24 There is no satisfactory alternative explanation for the exceptionally cold weather during the Maunder Minimum, when there were no sunspots.
2) Even though the TSI changed relatively little during recent sunspot cycles, there is a significant increase in the shorter wavelengths at the peak of sunspot cycles. Might there be some unappreciated impact of increased UV beyond just creating more ozone? The IPCC states, “The effects of … shifts in the solar spectrum towards the ultraviolet (UV) range, at times of high solar activity, are largely unknown.”25
3) The Earth’s magnetic field strength has declined at least 10% during the same period of time that rising global temperatures have been observed;26 the decline appears to be accelerating, as measured by a recently launched satellite constellation.27 Is it coincidence? Or, might a weakening of the Earth’s magnetosphere allow more extraterrestrial high-energy particles to enter the atmosphere than previously, and heat the upper atmosphere? If one can’t dismiss the possibility because research hasn’t been done, then it raises a red flag about misplaced research efforts.
4) High-energy charged particles from coronal mass ejections spiral in at the magnetic poles. As they enter the upper atmosphere they produce the well-known auroras. However, the auroras are a result of ionization of the air and, consequently, heat is produced. Could the wandering of the poles over decades result in changes in the jet streams and then changes in weather at mid-latitudes?28
5) There is still controversy about whether cosmic rays might modulate cloud formation through ionization.29 This deserves more attention.
6) Recently, it has been found that bacteria apparently can play an important role in cloud formation and precipitation.30 Might the ubiquitous use of antibiotics for humans and livestock, and now routinely found in sewage, have some unintended consequences for bacteria that play previously unsuspected roles in precipitation?
In summary, there is much still unknown about weather and climate, and many of the things we are aware of are poorly characterized. There is disagreement about the sensitivity of temperature increases in the atmosphere resulting from increased CO2; that is the essence of my remarks above. There is disagreement about whether the water vapor feedback-loop is positive or negative! We know even less about what is called space weather. Even the fundamental Carbon Cycle has issues about accuracy and completeness. How much CO2 do the hidden, and largely unexplored, oceanic spreading centers — more than 80,000 Km in length — contribute to the dissolved CO2 in the oceans?31 How do we know that we are adequately accounting for diffuse volcanic CO2 emanating from the ground as is happening at Long Valley Caldera (Calif.)? Recent research strongly suggests that volcanism on land contributes much more CO2 than was formerly believed.32 If there is any sort of scientific consensus, it can only be a result of shared ignorance. There is an old joke that for the handyman who only owns a hammer, the solution to all problems looks like a nail. As long as there are still significant unanswered questions about what things influence weather and climate, and precisely how they interact with other influences, then we are at risk of treating screws as though they were nails. We need to be looking beyond CO2 if we want to have confidence we really understand the problem!
References
2 http://www.cemnet.com/content/publications/GCR10Worldoverview.pdf
3 http://www.sciencedirect.com/science/article/pii/B9780080442761501574
4 http://en.wikipedia.org/wiki/Environmental_impact_of_concrete
5 http://www.sciencedaily.com/releases/2011/03/110316084907.htm
6 http://www.slate.com/articles/news_and_politics/explainer/2009/08/7_billion_carbon_sinks.html
7 http://gizmodo.com/the-worlds-oldest-underground-fire-has-been-burning-fo-1539049759
8 http://en.wikipedia.org/wiki/Coal_seam_fire
10 http://co2now.org/Current-CO2/CO2-Now/global-carbon-emissions.html
11 http://www.okstorms.com/chasing/other_weather/climate_change/underground_coal_fires.htm
12 http://www.aip.org/history/climate/co2.htm
13 http://www.nrmsc.usgs.gov/files/norock/products/GCC/SattelliteAtlas_Key_02.pdf
14 http://www.inscc.utah.edu/~krueger/6150/Cloud_System_Modeling_GCMD.pdf
15 http://earthobservatory.nasa.gov/Features/Aerosols/page3.php
16 http://www.ipcc.ch/ipccreports/sres/aviation/index.php?idp=38
17 http://www.livinghistoryfarm.org/farminginthe50s/water_03.html
18 https://water.usgs.gov/edu/gwdepletion.html
19 http://scienceline.ucsb.edu/getkey.php?key=894
20 http://berkeleyearth.org/data/
21 http://wwwghcc.msfc.nasa.gov/atlanta/
22 http://esp.cr.usgs.gov/projects/sw/swdust/snow_pack.html
23 http://www.ipcc.ch/ipccreports/tar/wg1/244.htm
24 http://www.geo.arizona.edu/palynology/geos462/20climsolar.html
25 https://www.ipcc.ch/publications_and_data/ar4/wg1/en/ch1s1-4-3.html
26 http://ffden-2.phys.uaf.edu/104_spring2004.web.dir/Carla_Tomsich/Slide3.htm
27 http://www.livescience.com/46694-magnetic-field-weakens.html
28 http://www.ngdc.noaa.gov/geomag/GeomagneticPoles.shtml
29 http://www.ipcc.ch/ipccreports/tar/wg1/246.htm
30 http://www.nature.com/news/high-flying-bacteria-spark-interest-in-possible-climate-effects-1.12310
31 http://carbon-budget.geologist-1011.net/
32 http://www.livescience.com/40451-volcanic-co2-levels-are-staggering.html
Interesting article, but I don’t get the temperature graph.
It appears to show that minimum temps are rising faster than maximums. In other words, more of the “warming” is actually less cold at night, than more hot in the day.
Indicative of UHI
Less cold at night implies the long wave radiation is trapped, or slightly higher humidity. Or both. I wonder if there’s a way to plot the temperature when the sun is highest in the sky?
If you look at the approximately 24 hour period that is from yesterday’s minimum temp to today’s minimum temp, you find surface stations measure slightly more cooling over night that it warms the day before. The graph is most likely based on a calendar day, but that changes the results and is one of the slight of hand, where what is shown (intentionally or not) is wrong.
The cause of this is that air is heated and humidified over the tropical oceans, and then moves poleward were it cools. Warm air blows in, cools off every night. Every night as it cools, rel humidity goes up, removing water as dew, in the morning some of that water evaporates, some is lost, drying the air as it moves away from the ocean.
Here’s the data.
YEAR RISING FALLING DIFFERENCE in F SAMPLE COUNT
1940 15.71097157 15.6830136 0.027957973 40450
1941 15.51280724 15.52291128 -0.010104032 37104
1942 17.19708086 17.18970456 0.007376309 50974
1943 18.49100199 18.49760266 -0.006600669 106368
1944 18.09759878 18.09670445 0.000894331 171413
1945 17.1321793 17.12947072 0.002708585 109356
1946 16.5656968 16.58263341 -0.016936611 75818
1947 17.02919548 17.01359006 0.015605421 104547
1948 18.61353831 18.62331222 -0.009773913 196738
1949 18.88868122 18.87702793 0.011653284 274738
1950 18.59500561 18.59388211 0.001123508 294791
1951 18.50607786 18.48544244 0.020635422 301060
1952 18.71132731 18.72543796 -0.014110651 366071
1953 18.42814736 18.43695155 -0.008804188 380160
1954 17.9957428 17.98496993 0.010772869 396199
1955 17.42433676 17.43215448 -0.007817724 361934
1956 17.72695923 17.71825583 0.0087034 355229
1957 17.5963675 17.62517297 -0.028805471 396449
1958 17.92289163 17.91920132 0.003690311 497221
1959 17.95581365 17.95448641 0.001327244 451085
1960 17.9869764 18.01315115 -0.026174748 508024
1961 18.03388368 18.03508739 -0.001203715 511500
1962 18.22151176 18.22907951 -0.007567744 514658
1963 18.34429315 18.33326835 0.011024797 507837
1964 18.15873062 18.15302857 0.005702056 485246
1965 17.3675503 17.35766173 0.009888569 335812
1966 17.50450441 17.52169516 -0.017190748 393037
1967 17.36575907 17.3679094 -0.002150335 397752
1968 17.55711991 17.5692133 -0.012093387 362322
1969 17.40666311 17.40243898 0.004224134 416322
1970 18.07845446 18.08878884 -0.010334386 486444
1971 17.41842199 17.41011975 0.008302247 176121
1972 17.24428991 17.23699402 0.007295899 172782
1973 18.29953951 18.30869743 -0.009157925 564178
1974 18.01006162 18.01329035 -0.003228731 805208
1975 18.61680029 18.63771804 -0.020917758 792671
1976 18.60309034 18.64140958 -0.038319245 1111465
1977 18.55697684 18.53033801 0.026638833 860841
1978 18.23385269 18.25044722 -0.016594529 1093975
1979 18.32688642 18.31058265 0.016303773 1028032
1980 18.25960534 18.27724383 -0.017638483 1129689
1981 18.31705388 18.3222249 -0.005171018 1099474
1982 17.62293309 17.63431024 -0.011377151 1055440
1983 17.42864046 17.4414735 -0.012833048 1166200
1984 17.37740432 17.38125902 -0.003854703 1220950
1985 17.48307532 17.48756305 -0.004487731 1185677
1986 17.58500848 17.58717123 -0.002162743 1254703
1987 17.4050167 17.40805318 -0.003036479 1235016
1988 17.77354186 17.78007015 -0.006528295 1365931
1989 17.55334589 17.5506176 0.002728288 1265629
1990 17.46665232 17.47565155 -0.008999233 1247673
1991 16.8231994 16.83149181 -0.008292409 1171457
1992 17.02449214 17.03832609 -0.01383395 1304978
1993 17.05782469 17.06297818 -0.005153482 1277117
1994 17.68736749 17.67993302 0.007434471 1298317
1995 17.33133396 17.33992032 -0.008586358 1293354
1996 16.91674692 16.9202606 -0.003513682 1318816
1997 17.21316377 17.20476681 0.008396956 1321324
1998 17.43171297 17.45367591 -0.021962934 1169739
1999 17.78586036 17.80618396 -0.020323599 1147533
2000 18.01024792 18.04020913 -0.029961211 1582673
2001 18.47831326 18.48061249 -0.002299226 1455055
2002 18.20320992 18.21497998 -0.011770051 1534148
2003 18.34413085 18.3384575 0.005673355 1562356
2004 18.25971399 18.26013423 -0.000420242 1769217
2005 17.95410103 17.95819944 -0.004098412 1928381
2006 18.31533458 18.3236668 -0.008332224 2058850
2007 18.26982812 18.28168462 -0.011856501 2070282
2008 18.23365477 18.24080168 -0.007146907 2324740
2009 17.87566685 17.88050967 -0.004842814 2401806
2010 17.88415593 17.88582125 -0.001665325 2506477
2011 18.00993136 18.012606 -0.002674635 2529280
2012 18.42713328 18.44643677 -0.019303489 2632177
2013 18.36008308 18.36336279 -0.00327971 2488421
9999 is an average of all years.
9999 17.80549016 17.80964193 -0.004151764 69864812
Individual years Rising/Falling temps are not directly comparable since stations can change for that year.
Indicative of greenhouse warming.
Barry,
It is indicative of natural, routine global warming abetted by the UHI effect.
UHI does the same.
The first article here on Watts Up With That that summarizes my layman’s understanding of our incredibly poor grasp on the nuts and bolts of AGW in all the vast detail I could never muster! Bravo!
Great work! Well-researched! But you missed some opportunities for exclamation points!
!
¡
Exactly what I was going to say!
! != ✓
Good summary, but you seem to forget that Tellus is the only water planet we know of in the Universe, where three phases of water are stable: liquid, gas, and solid (ice), on the surface. 72 per cent of the globe is covered by seawater with an average depth of 3600 m. And, furthermore, we hardly know what is going on down there. 60 per cent of the global crust is thin, – on average, only about 8 km thick (‘oceanic crust’), where sensible heat from the underlying hot mantle (which is 1200 degrees C) leaks through to the water column, etc.
Let me help get you up to speed.
Al Gore has explained to us all that the center of the earth is millions of degrees.
Well if you are going to talk about scientific principles, the first such principle would be to use the correct scientific terms, so that all can be talking the same language.
So when I read that the sun is earth’s principal source of “heat”, I immediately turn off.
It IS our principle source of ENERGY, almost all of it in the from of Electro-magnetic radiation energy; but virtually none of it is in the form of “HEAT”.
Since earth does receive charged and maybe other particles from the sun; then we do get a microscopic amount of energy in the form of the kinetic energy of those particles when they land on earth.
But even that is NOT “heat”, after all those particles got here from the sun by following specific trajectories, rather than randomly walking every which way, so their tiny amount of kinetic energy isn’t “heat”.
We make virtually all of earth’s “heat” right here on earth; mostly in the oceans, in fact maybe more than 70% of it, since the oceans absorb perhaps 97% of the EM radiation that strikes the oceans, whereas the land can reflect maybe as much as 30-40% of what EM energy strikes the land.
So NO, the sun is NOT our principal source of heat; we make it ourselves.
G
And the GCMs might actually do something real if they dealt with a rotating earth that is only half illuminated.
Not only do they not predict any future state, but they can’t even explain that which we already know has happened.
While we are at it, why do we measure energy using units of temperature, which is not a unit of energy. When the temps are rising there is no talk of energy from the CAGW crowd, but when the temps level off all of a sudden, it is energy that is important, i.e. the energy stored in the oceans. So, is climate change measured by an increase in temperature or an increase in energy? Seriously, which one is it?
Mr. Smith,
I hate to contest any points you make, since I generally agree with your conclusions and respect your very broad knowledge of physics.
But this criticism seems to be a little overdone.
As an analogy, I go to work and get paid, and one might therefore say that my boss gives me money in exchange for my work.
But what is proven by saying that no, this is wrong, he does not give me money, He gives me a check?
I take that check and convert some of it into cash, but most stays in another form, as numbers on a statement, a line item on my account balance.
I get a little money from other sources too, but they are negligible.
Is it wrong to say my cash comes mostly from my job?
Besides for that, I totally agree that it is a travesty that the models do not even model a diurnal cycle of a partially illuminated earth. Add in the lack of clouds or, most significant IMO, thunderstorms, and it is no wonder these models are useless.
At least, I do not wonder why.
Actually Nicholas, George is correct. There is an energy flux from the sun, and when absorbed by matter, it is converted into heat. They are two different things. Your boss doesn’t pay you in food or shelter, but you can convert the money he does pay you into food or shelter.
It is one of my pet peeves that heat is so readily used where the term energy flux should be. I object also to the characterization of CO2 absorbing either an energy flux or heat. The capacity of CO2 to absorb either in meaningful quantities is minuscule. By temporarily absorbing a photon and instantly (for all practical purposes) re-emitting it in a random direction, the energy flux is redistributed in all directions. It is this redistribution that results in an increased downward energy flux and hence higher temperatures. Just not nearly as much higher as the models are evidently programmed to calculate.
I think that most people reading this site know the difference between heat and energy, and that frequently people discuss heat and energy as if inter-changeable when of course they are not. The main thrust of this article can withstand this basic error, of course, that does not mean that the main thrust is sound, but I do not dismiss the main thust merely because of a basic error in confusing and conflating heat and eregy..
But the problem arises from the fact that we have no energy metric. The thermometer record is not an energy metric but a heat metric. It does assist in determining whether there is some ongoing energy imbalance. One would have thought that would be a serious issue for a serious science, but hey in climate science, why worry about the fact that we are not measuring the beast that we are concerned with.
The only energy metric is ocean temperature data, but pre-ARGO the data is completely worthless, and even the ARGO data is riddled with problems such as extremely short time scale, inadepquate spatial coverage, no assessment as to whether the free floating nature of buoys (which are swept along on ocean currents) leads to bias, and when it was first rolled out, it was immediately adjusted because it was showing a cooling trend.
It is because people comment upon the thermometer record that people discuss heat and inevitably confuse this with energy.
The K&T energy budget is hopeless since it does not reflect real world conditions, failing to deal with the diurnal day, and the vast and significant difference between equitorial/tropical regions, mid latitudes and polar latitudes. The planets heat pump is effectively ignored. No wonder that CGMs are useless since they make no attempt to model the real world (and of course, it appears that they have been tuned to suspect data.
davidmhoffer May 5, 2015 at 11:35 pm
The capacity of CO2 to absorb either in meaningful quantities is minuscule.
I agree.
By temporarily absorbing a photon and instantly (for all practical purposes) re-emitting it in a random direction, the energy flux is redistributed in all directions. It is this redistribution that results in an increased downward energy flux and hence higher temperatures.
I don’t accept that changing direction of non-meaningful quantities of energy flux can cause warming. Please explain.
Physics check, David.
CO2 absorbs photons and, long before it reradiates the energy absorbed from those photons, collides with other air molecules and transfers all or most of that energy. In fact, it converts radiation in its coupled bands into internal molecular kinetic energy, which (if we’re going to be picky) might be called either internal molecular energy or if you want to be fancier, “enthalpy” as opposed to “heat”. Heat is defined only in terms of energy flow — there is no such thing as an “amount of heat” in a substance.
The CO_2 in local thermal equilibrium then radiates energy away in those same bands in completely separate collisional processes, but the energy levels for an emission are almost certainly completely disconnected from those of the previous absorption, and they are comparatively widely separated in time, not at all “instantaneous”.
The point is that CO_2’s interaction with LWIR is not “elastic scattering” of photons. It is highly inelastic, and the principle effect is either local heating or local cooling not of the CO_2 molecules themselves but of the entire atmosphere. That’s why the emitted radiation seen at the TOA in the CO_2 bands conforms to the local temperature at the emission height. It isn’t elastic scattering, it is thermal emission.
Otherwise, everybody should continue with a good rant. I think it is a bit excessive to go all the way down to human breathing and beer production in a quest for “anthropogenic CO_2”, and that a more serious treatment would involve building something like a Bern model for overall local equilibrium concentration allowing for all sources AND SINKS, but the article does make it clear that humans contribute a pretty hefty dose of CO_2 to the atmosphere on TOP of the usual differential cycle and simple arithmetic indicates that a lot of this sticks. A very nice treatment of this is here:
http://www.ferdinand-engelbeen.be/klimaat/co2_origin.html
Personally I’d argue that this quantitative treatment is more useful than just listing stuff as is done above, but people should suit themselves. Ferdinand’s numbers are a lot more conservative, BTW. Not exactly “40 Gt” per year, which seems to be excessive.
rgb
Between not including the energy movement during night time and not including the heat engine of the water cycle, the models are fatally flawed. Then, there’s the other missing 50 plus factors, all much more important than CO2, which can basically be ignored altogether.
rgbatduke @ May 6, 2015 at 7:01 am
“…and simple arithmetic indicates that a lot of this sticks.”
Simplistic arithmetic, you mean. That, and a heavy dose of confirmation bias.
rgbatduke May 6, 2015 at 7:01 am
Physics check, David.
>>>>>>>>>>>>>
Thanks RGB.
Thanks RGB…
Clyde included a lot of “human sources”, which are not really contributing to the current CO2 levels: all what we eat or use as wood for cooking and heating is in fact CO2 which plants have taken out of the atmosphere a few months to a few decades before: thus a fast recycling of the same CO2…
Mr. Hoffer,
“Actually Nicholas, George is correct. There is an energy flux from the sun, and when absorbed by matter, it is converted into heat. They are two different things. Your boss doesn’t pay you in food or shelter, but you can convert the money he does pay you into food or shelter.”
Thank you, sir. Yes, I do understand this. This is the point I was making. He pays me in one form, the funds can be converted to other forms, but it is all different of the same basic thing. Others have said it perhaps more succinctly, below.
Mr. Verney,
“I think that most people reading this site know the difference between heat and energy, and that frequently people discuss heat and energy as if inter-changeable when of course they are not. The main thrust of this article can withstand this basic error, of course, that does not mean that the main thrust is sound, but I do not dismiss the main (thrust) merely because of a basic error in confusing and conflating heat and (energy).”
Yup, yup, yup, yup and yup.
🙂
Mr. RGB,
“Otherwise, everybody should continue with a good rant.”
I agree, as long as it does not cross the line into a diatribe, harangue, tirade or screed, eh?
There is no satisfactory alternative explanation for the exceptionally cold weather during the Maunder Minimum, when there were no sunspots.
2) Even though the TSI changed relatively little during recent sunspot cycles, there is a significant increase in the shorter wavelengths at the peak of sunspot cycles. Might there be some unappreciated impact of increased UV beyond just creating more ozone? The IPCC states, “The effects of … shifts in the solar spectrum towards the ultraviolet (UV) range, at times of high solar activity, are largely unknown.”
“since the oceans absorb perhaps 97% of the EM radiation that strikes the oceans”, and that EM becomes heat ” So the sun is the principle source of our heat.
Electromagnetic radiation transports energy. When an object absorbs that radiation, it also absorbs the energy that radiation conveys. This manifests itself in the form of heat. It is as simple that.. If the Sun were not there the Earth would be cold, therefore, it quite acceptable to say “the Sun is Earth’s principal source of heat” without getting into a semantic tangle ( as Menicholas points out).
Let’s repeat that to make it clear.
As for GCMs, they do of course model a rotating Earth, diurnal effect, clouds, winds etc. These are essentially the same models that are used to forecast the weather (OK, they get that wrong too). They share the same code. The grid spacing, time step and initialisation are the major differences.
http://en.wikipedia.org/wiki/General_Circulation_Model#/media/File:AtmosphericModelSchematic.png
In a political debate, in which all people have a vote, I can tolerate a semantic shortcut that allows more people to sort of follow the concepts being debated. However, when one side of that debate represents not only the majority of the science, but also consists mainly of either government employees or major recipients of government grant money, I resent imprecision in language. They don’t even define what climate change is. Is it a short term energy flux imbalance? What does short term mean? And if so, when did precisely ZERO level of imbalance become the true state of nature? Where are the papers that decided that, when day/night changes dwarf the alleged anthropogenic contribution. Or, alternately, is climate change defined by a long-term trend in short term imbalances based on an poorly understood factors? Or, is it, as appears, some sloppily measured near-surface temperature trends correlated with only one possible driver? And when did the debate take place that concluded for all time that model outputs are factual evidence? This branch of science is more than just sloppy. It’s become corrupt. Lose the cause, lose the team, lose most of the government employees and most of the government grants, and let’s start over.
Er, most of the global climate models (GCMs) used for predicting future temperature are NOT rotating. Many of them are based on an adaptation of a model for a star, which has been cooled and shrunken and has no night time. Do NOT assume the GCMs are related to weather forecast models. In fact, many GCM programmers gave up trying to include the real scientific principles involved and resorted to much less understandable algorithms, with no scientific principles in sight.
Mike B,
“If the Sun were not there the Earth would be cold, therefore, it quite acceptable to say “the Sun is Earth’s principal source of heat” without getting into a semantic tangle ”
Yes, thank you. This is my view as well. The exception would be when the point being made or debated became obfuscated or misconstrued due to imprecise terminology.
When discussing the details of any technical subject, it is usually a good practice to be as concise and clear as possible, but sometimes conversations can get bogged down in endless discussions of nuance that are not always germane to the thrust of the original point.
“As for GCMs, they do of course model a rotating Earth, diurnal effect, clouds, winds etc. These are essentially the same models that are used to forecast the weather (OK, they get that wrong too). They share the same code. The grid spacing, time step and initialisation are the major differences.”
I spoke too dismissively of the GCM’s, and did not mean to state so broadly of their utility being zilch. They are surely not proving to be very good at predicting global temperature trends into the future.
But besides for that, I am not very familiar with the history of discussions on these models, here or elsewhere. But Mr. Smith made a statement that I had read here before, and had not heard contested. I was actually very surprised to hear that the models did not portray the diurnal heating cycle. But now you have contested that point, so I do not know what to think. I should lie to hear more about this dispute, if indeed there is one and not just a misunderstanding.
But I have read on several occasions that the models have a grid coordinate resolution (or whatever it is called) of around one degree, or 100km. And that details smaller than this are omitted. I al also fairly certain I have heard that clouds are not modelled, nor are thunderstorms.
Again, I am interested in learning more about this, if there is a disagreement or difference of opinion on this.
Thanks again,
-Nick.
Mr. Reno,
Great post, and great points.
Many of these questions you ask here are ones I have asked many times.
So much of this CAGW malarkey just GALLS me (Add as many exclamation points here as your own personal outrage would indicate.)
Menicholas
You can find more information if you search for General Circulation Model. Wikipedia covers it here
http://en.wikipedia.org/wiki/General_Circulation_Model
if the sun is not a heat source then it should not radiate out IR waves… It does so the sun is a heat source
IR radiation being synonymous with heat, is a colloquial truism that is not actually grounded in scientific reality.
I believe this may be due to that IR band being at a peak at the temperatures which are common in the typical surface environment, and as such it is used by FLIR and other manufacturers in their various products which are useful for detecting and differentiating objects of varying temperatures in our everyday environs. Discussions of such often conflate the two, and it has become “common knowledge”.
It is really just a narrow portion of the EM spectrum.
Just as a for instance…a block of ice melting on your countertop is radiating IR “waves” (they are also particles), and yet would not be generally considered a heat source. Except maybe to the block of dry ice sitting next to it.
It IS our principle source of ENERGY, almost all of it in the from of Electro-magnetic radiation energy; but virtually none of it is in the form of “HEAT”. ~ G. E. Smith
Agreed. The misuse of “heat” v. “radiant energy ” is one of the aspects of this debate on climate that often clouds the issues. Since there are sometimes five posts a day here, it seems like one post could be donated to just a explanation of the difference between heat and energy and why using the proper term is useful in science.
Heat is just a form of energy Mark; some would say transport of energy. It’s as simple as that!
Electromagnetic radiation transports energy from the hot Sun and, when it reaches the Earth, it is absorbed and heats the Earth.
Actually, George, et al, the correct scientific definition:
It is NOT EM radiation in the IR range.
Richard V, what you wrote here doesn’t make sense:
Because the correct definitions of these words:
Therefore, temperature IS an energy metric. The problems are:
a) a temperature reading is only valid for the time and place taken. The system is extremely dynamic because a1) there are a tremendous number of moving parts and components and a2) the system is a spinning sphere half lit by the sun (as has been mentioned)
b) It’s very difficult, if not impossible for humanity in 2015, to determine the total energy content of a system component, let alone the system.
c) Energy content is proportional to mass. The atmosphere is a tiny fraction of the system (Energy-Atmosphere =~ 1/1280 Energy-Ocean). Therefore, all the air temperature readings are irrelevant.
The problem is that “heating” something is not a unique process in thermodynamics. The first law makes it clear that the energy balance of a system:

 , the internal energy of the system, but they are not at all the same thing. A system actually has a definite value of internal energy, one that is, in fact, directly proportional to the temperature of the system if it is in (approximate) thermal equilibrium. However, you can do work on the system in a systematic way and squeeze out “heat” without changing its temperature!
 instead of
  , making it an “inexact differential” — one whose integral does not just depend on the end points but rather on the specific path:
 or
or 
 . All of these things change
  and hence increase the temperature of the system, but they do not in fact involve any transfer of heat.
does not allow a unique value for “heat”. In words, the change in internal energy of an open system equals the work done ON that system less the heat flow OUT of that system (you can see many sign conventions and arrangements, but they all have to be interpreted in the way that makes sense as a statement of global energy conservation). Note that heat is defined only in terms of an energy exchange across the borders of the system that is distinct from organized work.
Nearly everybody confuses heat with
In physics, the indeterminacy of heat is often indicated by putting a bar on the differential or using
Strictly speaking, then, “heat” describes a quantity in flow across the boundary of a system, not a property of a system. A second definition is that it is energy that, in the process of being transferred between two reservoirs, is no longer available for doing work.
Yet human language often refers to heating something up — raising its temperature. This terminology, while understandable, is not universal or uniquely descriptive in a physical sense. We can “heat something up” by doing work on it while keeping it thermally isolated. We can “heat it up” by shining light through its boundary, even though the light in question is in no sense thermal and has no “temperature”. We can “heat it up” by pushing molecules through the boundary and hence changing its mass. We can “heat it up” by putting a heat source inside that converts stored chemical or nuclear energy into internal molecular energy
Or one can put the system in thermal contact with a hot reservoir at a higher temperature, and heat up the system by means of transferring heat in the classic sense from the hot to the cold reservoir. In this sense, the Sun does indeed heat the Earth, by the way. The sun is a large “system” at roughly 6000 K. The earth is a large “system” at roughly 288 K (very roughly!) The two systems are coupled by radiative transfer, and net energy flows from the hotter to the colder in the form of radiation energy at “thermal equilibrium” with the hotter object and flows back in the form of radiation energy at “thermal equilibrium” of the colder object. Sadly, because the Earth in particular is not otherwise isolated, the backflow to the sun is trivial compared to its outflow in all the rest of the outgoing solid angle to a sky at 3 K! The “heat” transferred to the Earth is just being delayed in the general flow to “the Universe”. The Earth as a radiatively coupled thermodynamic system has to be viewed as being between a hot reservoir (the Sun) and a cold reservoir (the Universe in general) and hence is an open system where the details of how the heat flows through and redistributes in the many channels and processes available are all ultimately important in determining its approximate “global temperature”.
This is a very difficult problem. It is difficult even to count the reservoirs or identify the nameable spatiotemporal emergent structures generated by this flow! Modeling it is insanely difficult.
rgb
rgb, that was great.
A good way to explain the different between heat and energy is a piece of wood. If can have a certain temperature but the mass times the temperature is not the energy stored in the system.
Energy can be stored chemically in the form of cellulose (etc) or by vibrating the arms of the molecules, or by being pressed closer together.
Knowing the temperature of a tank of compressed propane doesn’t tell us much about the energy available from what is in the tank.
Mr. Explorer,
“b) It’s very difficult, if not impossible for humanity in 2015, to determine the total energy content of a system component, let alone the system.”
I think Einstein told us, in 1905, that we can do so. We just need a very accurate scale.
Just sayin’.
RGB,
“However, you can do work on the system in a systematic way and squeeze out “heat” without changing its temperature!”
For sure. This is how one knows which girl to marry, I think. Although I am not so sure about the temperature part. It sure feels hotter.
Considering that this blog is frequented by fairly technically knowledgeable readers, I agree that proper definitions/terminology be used.
While we all generally accept the term pH as the negative log of the hyhydrogen ion concentration, the proper definition is the “negative log of the ACTIVITY of the hydrogen ion in an aqueous solution”.
While the difference may be negligible in most cases, the mathematical value for common definition, would definitely result in a wrong answer if used in a calculation.
It is true my toaster makes the heat that makes my toast, not electricity. I am fairly certain however my toaster would stop making toast without the electricity. Yep, just tried it, no heat, no toast without the energy source.
So was wondering why the emphatic declaration that the sun is NOT our principal source of heat and then remembered how clouding the issue so to speak, by conflating heat with energy is used to support various AGW positions.
Alx says, May 6, 2015 at 3:37 am:
“(…) why the emphatic declaration that the sun is NOT our principal source of heat and then remembered how clouding the issue so to speak, by conflating heat with energy is used to support various AGW positions.”
Exactly! George is NOT helping.
‘Heat’ is a very specific thing that can and should not be confused with anything else, not with ‘temperature’, not with ‘internal energy’, not with ‘kinetic energy’.
And not with ‘back radiation’!
You forgot that the electricity makes the heat, and numerous sources may provide the energy to generate the electricity.
George,
‘Heat’ is not the same as ‘internal energy’. Internal energy is internal energy. In thermodynamics, ‘internal energy’ [U] is the energy contained statically within a system. It is part potential, part kinetic. The kinetic part is proportional to the system’s overall temperature. However, we do not know how this kinetic internal energy arrived inside the system. In thermodynamics, it could’ve gotten there in two ways: 1) by a dynamic transfer of energy to the system as WORK [W] (like friction or adiabatic compression), or 2) by a dynamic transfer of energy to the system as HEAT [Q].
This is how ‘heat’ is defined in thermodynamics: The energy spontaneously transferred from a hot system or hot surroundings to a cold system, by virtue of the temperature difference. ‘Heat’ is energy. Not any particular kind of energy. It is just energy in transit as a result of a temperature difference between systems in thermal contact. ‘Heat’ is the energy that is transferred from a hot place to a cold place. No matter how it’s done. The ‘heat’ is both the energy itself, the transfer process and the result of it (one system getting cooler, the other getting warmer). Depending on how you want to look at it. But it’s always about a THERMAL TRANSFER of energy.
This is nicely summed up in the 1st Law of Thermodynamics (for a closed system): ΔU = Q – W
The change in ‘internal energy’ [U] of the system (proportional to its temperature) is equal to the (net) transfer of energy to it in the form of ‘heat’ [Q] minus the (net) transfer of energy from it in the form of ‘work’ being done [W].
So you trying to somehow deny that the Sun is Earth’s main ‘heat source’ is only confusing things. OF COURSE it’s our main ‘heat source’! It keeps us warm by sending energy to us AS HEAT (yes, by way of radiation, but still AS HEAT). Kinetic energy is not ‘heat’. Kinetic energy is kinetic energy.
Interesting.
If one blocks out the sun, by, say, moving the moon directly between the sun and the Earth, the area where the sun is blocked out becomes colder than the places where the sun is not blocked out.
If “lack of sun” equals “colder” then “direct sun” gives us what?
No sun, not so much heat.
While the Sun may not be “heating” the Earth, it is clearly Earth’s main “heat source”.
While George is technically correct, I agree that great care should be taken not to imply, or support, the fact that without the Sun it would be awfully cold around here.
JohnWho, I think you missed Kristian’s point. One, he did confirm that the Sun is the main source of Heat, since it is transferring energy to the Earth. Two, George is not “technically” correct.
He’s using a layman’s definition of heat. I’ve pointed this out to him a long time ago (with scientific references), and so I can only conclude that he is either unable or unwilling to learn.
I speak up only to attempt to prevent him from confusing other people.
Well said, and I said almost exactly the same thing (with an irrelevant sign difference in the first law). In fact, the hot (6000K) sun heats the cooler (288 K) earth as the earth in turn tries to warm the much cooler (3 K) Universe. The earth is thus an open system BETWEEN a (radiatively coupled) hot and a (radiatively coupled) cold reservoir. Since radiative transfer of energy is very nonlinear in temperature and since the system in question consists of two distinct Navier-Stokes systems with complex boundary conditions in an accelerating frame of reference and with further enormously nonlinear phase related modulation of energy transfer, this is a very, very, very,…. (repeat for many very’s) very difficult problem. So far, we cannot solve it. I am not optimistic that we will be able to solve it even with Moore’s Law helping in the 21st century — too many orders of magnitude — assuming Moore’s Law doesn’t itself peter out in the meantime.
rgb
I take the point.. The sun is hot but virtually all the energy that the earth receives from the sun arrives in the form of radiation, some of which is converted into “heat”. But surely we do not “make it ourselves”. If we humans/animals/plants/bacteria did not exist, would not some (most) of the energy still be converted into “heat”?
No, Solomon. It is not “converted into heat”. It is RECEIVED and ABSORBED as heat and converted into ‘internal energy’, raising the temperature of our Earth system.
Just as I receive my paycheck, which is them absorbed by my bank, and some is converted into “cash”, but it is all “money”, which raises (albeit temporarily) my “net worth”.
And if I make enough, it makes my girlfriend “hot”.
Many people belabour the difference between heat and energy.
A quick Google will produce about a zillion definitions of ‘heat’. However, in physics it is common to refer to heat as a transfer of energy. In that light it’s a bit pedantic to get one’s shirt in a knot about the difference between heat and energy. Energy is transferred from the Sun to the Earth. The Sun heats the Earth.
so science evolved from earth, wind and fire to climate science. Give them a lever and they heave the sun out of its course.
Meanwhile some of their young absolvents lever wall street to heave world economy out of its course.
I know I know economy isn’t hard science. But: climate science is? Hard science?
Regards – Hans
As I recall, George used to say “heat” is a verb, not a noun.
Now he says “we make it ourselves”.
Whoever “we” is.
Petty, punctilious peeve.
GES says “So NO, the sun is NOT our principal source of heat; we make it ourselves.”
That’s an extraordinary combination of pedantry and laziness: you should hold yourself to the same standard as you do others. **WE** DO NOT make Earth’s heat: IT is made here, but NOT by US.
“Physician, heal thyself.”
G.Smith;
My pet peeve – what is a “microscopic amount of energy”.
It is an extremely small amount of energy, not detectable by humans without using an instrument designed to measure extremely small things. In the case of energy, it requires a micro-energy scope, AKA an energy microscope.
“All people contain a certain amount of “hotness”, which is not necessarily fixed or static, and for some unfortunate individuals, this amount is “microscopic”.
It may be noted, however, that the chemical compound known as ethanol can act as a sort of “hotness microscope”, and as people consume ever greater quantities of this fluid, they seem to be able to detect ever more miniscule levels of “hotness” in other people, most commonly, but not exclusively, individuals of the opposite gender.
As the ethanol fluid accumulates, presumably at least some of it in the actual eyeballs (which then act as a sort of “goggles”), a state is occasionally reached in which even nano-scale quantities of hotness become readily observable to the affected individual, although the effect is quite temporary and apparently completely reversed by the occurrence of a rising sun.
This is one of the most gratuitously smug, cheap, disingenuous, catty, obfuscatory, diversionary attacks I’ve seen in a while. Does it feel smart to demolish imaginary strawmen of your own creation? It doesn’t *look* smart. I doubt anyone here honestly thinks the author is unaware of the distinction or relationship between energy and heat. Nor did he *claim* that the sun’s energy is delivered in the form of heat.
The author is correct. The big ball of fire in the sky IS our principal *source* of heat. That simplifying statement is both logically true *and* does not contradict most of your detailed elaboration – at least until your own presentation commits a worse error than that you accuse the author of making.
Your attack is also a bit hypocritical: Nit-pick a strawman for insufficiently precise terminology, but then your own sloppy wording implies that the earth doesn’t need the sun for heat – “we make it ourselves”. You probably don’t mean it the way it reads, but that’s what you wrote. If I wanted to try to stroke my ego publicly by pretending you’re a fool, I would ask something like:
“If the sun were somehow permanently blocked, how long would earth be warm enough to live on?”
After you replied with some version of “not very long”, I would observe,
Really? That long? Didn’t you say “we make it ourselves”?
If the sun is the primary source of *energy* for the earth’s heat, then the sun is the primary source of the earth’s heat. You don’t have to be a scientist to acknowledge the logical truth of that. You do have to be willing to discuss issues honestly and honorably.
BTW: Guns don’t kill people. Kinetic energy does!
Sheesh.
This is a weak but fairly successful example of how prissy pedantry can be used to attack the messenger and evade the issues and facts of a terrific, excellent article.
One problem is that you’re wrong, and you failed to defeat even your own strawman. Of course the sun is the primary source of the earth’s heat. Question: Without the sun, how much would mankind have to expand our “carbon footprint” to stay comfy?
For a weak smokescreen, it actually worked, given that discussion of red herrings instead of the insightful observations raised in the article seems to be overly represented in replies, to the point of willing suspension of disbelief and common sense in some cases. This shows the astonishing power of prissy pedantry, a power of attraction for those of like mind who seek excuses to shoot messengers and dismiss news and thought they can’t refute.
It’s a win-win for the prissy pedant poseur since if he is refuted, the refutation assists the goal of the smokescreen, so I’ll leave it at that and post a direct reply to the article.
Finally, thank God and Shakespeare that prissy pedants can’t hijack the English language. Heat is a noun as well as a verb.
menicholas,
A good rant is fun for both readers and the writer. You’re right, it shouldn’t get personal. But sometimes a little emotion goosing some verifiable facts, testable evidence, and maybe a good chart or two, makes a point that sticks in the mind better than just discussing numbers or formulae. Just MHO.
A lot of stuff here (a bit rambling). I’ll take up just the carbon accounting issue. Starting agriculture leads to a one-off loss of biomass. That’s covered in the allowance for land clearing. It’s bounded – there was only so much biomass in the first place, and it isn’t all going to go.
Then there is the 100 Gt or so carbon that is reduced every year by photosynthesis. That state is only temporary, most will be soon be oxidised by respiration of plants, animals, or maybe wildfire. It’s the total available to sustain animal life. The amount we divert to food is taken out of the mouths of microbes. It’s not new carbon. Likewise biomass burning. It’s oxidising carbon that was always going to be returned to the air. Part of the 100 Gt. But digging up fossil fuel is a new source.
“But digging up fossil fuel is a new source.” Not really, it simply has a very, very long cycle time given that it was organic material originally.
Yes, but that was taken out of an atmosphere which was much richer in CO2 than the atmosphere today. Thus while adding CO2 from burning wood or eating food doesn’t increase the CO2 levels of today’s atmosphere, burning fuels of many million years ago certainly does…
If that has much impact, that is an entirely different question.
Ferdinand, I agree with your comment about “when it was much richer…”
So what is the problem with restoring the CO2 level to its natural state instead of the dreadfully low level it has been for many years now? Nothing, right? A warmer, milder, more evenly distributed climate would be wonderful, in my view. Humans spend a great deal of time trying to create exactly that so they can live in little pockets of it.
With an increase over the past 100 years, the 100 Gt absorbed by photosynthesis mentioned above will increase. There will be a net accumulation in the biome of mass directly attributable to an increase in the concentration of CO2, about 3% of which is anthropogenic in origin so we are told.
Actually some people are claiming that 50% or 100% of the increase is ‘us’ but that is just the result of bad math or ignorance or both.
Another ‘long cycle’ is the manufacture deep within the earth of natural gas and petroleum from water and carbon-containing rocks. It should actually be called ‘natural oil’ to go with ‘natural gas’. It has the same chemical composition but with longer chains because it was formed at higher temperatures and higher pressures. The water and carbonaceous rocks are cycled by tectonic movement over aeons.
We live on a wonderful planet.
Crispin,
It is not because human use of fossil fuels is only 3% of the natural cycle that it isn’t 96% the cause of the increase in the atmosphere (4% from warming oceans). Human emissions are one-way additional, while the 97% is part of a cycle, where 97% natural is coming in but 98.5% is going out, the latter mostly natural and a very small part caused by the momentary human emissions. Thus (near) the entire increase is caused by humans…
Further, the biome indeed is growing somewhat, but that is not more than ~1 GtC/year from the 110 ppmv (~230 GtC) increase in the atmosphere, while humans emit ~9 GtC/year.
funny that the OCO2 sat shows almost zero CO2 production over industrial areas.
“Human emissions are one-way additional, while the 97% is part of a cycle, where 97% natural is coming in but 98.5% is going out, the latter mostly natural and a very small part caused by the momentary human emissions. Thus (near) the entire increase is caused by humans…”
Nonsense. Additions are additions, and there is no requirement that natural additions should be zero sum. Historical evidence flatly contradicts the assumption in the past, and modern measurements contradict it in the here and now.
“there is no requirement that natural additions should be zero sum”
The sum is bounded. That is clear from history. Air CO2 has remained remarkably stable for many millennia, despite a large annual flux.
What bounds it is that respiration and other oxidation (eg wildfire) can only return to the air the carbon that was previously reduced by photosynthesis. And it does so efficiently. The same carbon, historically, just goes round and round. Unless someone digs up fossil fuel.
Nick Stokes says:
CO2 has remained remarkably stable for many millennia
Yep. But global temperatures have changed a whole lot. That sorta debunks your ‘CO2 is the climate control knob’ belief, no?
“That sorta debunks your ‘CO2 is the climate control knob’ belief, no?”
No. The amount of CO2 in my bloodstream is fairly constant, but my health varies. That says nothing about how I’d be with doubled CO2.
Bart:
Additions are additions, and there is no requirement that natural additions should be zero sum.
They were very near zero sum over the past 800,000 years, only going slowly up and down after temperature changes with a (long) lag. Currently the net sum is -2 +/- 1 ppmv/year. Human emissions being +4 ppmv/year. Whatever the individual natural sinks and sources may be or how they vary over the years…
Nick Stokes,
Oh, please. That silly ‘health’ analogy totally fails. You believe that CO2 is the control knob for global temperatures — but you acknowledge that CO2 has remained unchanging, while global T has varied both high and low?
You need to re-think your arguments. That one doesn’t hold water.
“You believe that CO2 is the control knob for global temperatures”
Who said? Not me. I don’t believe blood CO2 is the control knob for my health either. But doubled CO2 would be bad.
ferd,
Human emissions are only some 7% of total emissions: 4.5 ppmv spread over a year that is 0.01 ppmv/day. Even if concentrated in 10% of the earth’s surface, still only 0.1 ppmv/day. It will be a hell of a job to detect that level of CO2 releases by satellites.
Further the OCO-2 satellite only has a few months of data. As there are huge changes in seasonal in and out fluxes, you need a full year (and preferentially several years) of data before one can have an idea of the net balance of natural fluxes…
Ferdinand Engelbeen
You say
Analysis of “the net balance of natural fluxes” has academic interest but no practical importance. At issue is whether human or natural activities are raising atmospheric CO2 concentration.
I strongly agree that “you need a full year … of data” from OCO-2. However, I strongly disagree that “preferentially several years” of the data are needed to address the important practical issue.
The most important question is whether or not emissions of CO2 from human activities (i.e. anthropogenic CO2) are overloading the carbon cycle so accumulating in the air to cause the observed recent rise in atmospheric CO2 concentration.
The rise in atmospheric CO2 concentration occurs in each year. Therefore, if the anthropogenic CO2 is sequestered by the carbon cycle in localities near the emissions over any year then the rise is NOT caused by the anthropogenic CO2. Any complete year of OCO-2 data has the possibility of indicating this.
Richard
Richard,
One full year of data probably is sufficient as the current (weak) El Niño is decreasing the overall sink rate, but in case of a new Pinatubo eruption, that would be more difficult, as in such a year near all human contribution indeed is removed.
Not that the removal is adjacent to the human emissions: that would show up in the 13C/12C trends: if human emissions were immediately absorbed by nearby vegetation, there wouldn’t be a drop in 13C/12C ratio, while the trend is in line with a near complete mixing of human emissions in the atmosphere and a continuous exchange of ~40 GtC between deep oceans and atmosphere.
Ferdinand
Sorry, but observation trumps interpretation.
You say
If the anthropogenic CO2 emission is all sequestered near its sources then there would be no excess anthropogenic CO2 available to overload the sinks for CO2 elsewhere.
And if the anthropogenic CO2 emission is all sequestered near its sources then there would be unusually low atmospheric CO2 concentration over those sources. The preliminary OCO-2 data shows such low CO2 over Europe and notably the UK. However, that is for only one month. We need a similar plot for an entire year; n.b. any year when the Mauna Loa CO2 data shows an annual rise.
If the regions with significant anthropogenic CO2 sources do NOT show high atmospheric CO2 concentration over a year then the anthropogenic CO2 is NOT overloading the ability of the CO2 sinks to sequester it. Your understanding of isotope ratios or anything else cannot affect that.
The matter would be undeniable if the regions with significant anthropogenic CO2 sources did not show high atmospheric CO2 concentration over any month of a year.
Richard
Richard,
If the anthropogenic CO2 emission is all sequestered near its sources then there would be no excess anthropogenic CO2 available to overload the sinks for CO2 elsewhere.
If the sinks, in this case mostly vegetation, sequester all human CO2, then there still is as much extra CO2 available in the atmosphere: the capturing of a “human” CO2 molecule is only instead of a “natural” CO2 molecule, which remains in the atmosphere: There may be some extra uptake due to local higher CO2 levels, but that is rather modest over the global uptake by plant life.
Anyway, let us wait and see what the data say after a full year of satellite measurements…
Nick Stokes May 6, 2015 at 6:32 pm
“The sum is bounded. “
Doesn’t make any difference. Doesn’t constrain it to be zero sum.
“The same carbon, historically, just goes round and round. Unless someone digs up fossil fuel.”
Transport processes are generally non-trivial, composed of traveling waves. And, there are natural additions which are unknown and unquantified.
Ferdinand Engelbeen @ May 6, 2015 at 11:41 pm
“They were very near zero sum over the past 800,000 years…”
Even if so, doesn’t constrain what is happening right now. And, what is happening right now is overwhelmingly a temperature dependent, natural process. That is what the empirical data show.
Ferdinand Engelbeen @ May 7, 2015 at 7:01 am
“…the capturing of a “human” CO2 molecule is only instead of a “natural” CO2 molecule, which remains in the atmosphere…”
Nonsense. The sinks are not static. They are not constrained to take out exactly the same amount all the time. In fact, they expand in response to additional forcing.
Ferdinand
I strongly agree that we need to await a year of OCO-2 data.
However, it is important to avoid excuses before that event.
If all anthropogenic CO2 is sequestered near its source then it CANNOT have any significant contribution to an overloading of the ability of the sinks to sequester CO2 globally.
This would disprove the ‘overload hypothesis’ adopted by you, the IPCC, and some others as explanation for the recent rise in atmospheric CO2. However, it would not prove the anthropogenic CO2 emission is not the cause of the recent rise because the anthropogenic CO2 emission may be (but probably is not) disturbing the equilibrium state the carbon cycle is ‘hunting’.
Richard
Bart:
Even if so, doesn’t constrain what is happening right now.
What we see in the data is a variability of +/- 1 ppmv around the trend, where the trend is from a different process than the variability. The trend may be or not caused by temperature, but the variability is the short term difference between ins and outs, which is very small compared to the total increase in the past 55/160 years.
Nonsense. The sinks are not static. They are not constrained to take out exactly the same amount all the time. In fact, they expand in response to additional forcing.
That is true for the oceans: net sink rate is directly proportional to the CO2 partial pressure difference between atmosphere and ocean surface.
That is hardly true for vegetation: that process is mainly temperature driven. Mostly positive for seasonal changes in the extra-tropics, sometimes negative for its influence on decay rates and precipitation in the tropics. The 110 ppmv extra pressure in the atmosphere (70 ppmv since 1960) only did give 1 GtC more net uptake in vegetation for a seasonal cycle of ~90 GtC in and out.
Thus a local increase in CO2 levels due to local human CO2 emissions will hardly change the local uptake of CO2 in vegetation, as temperature and precipitation (and other constraints) are the main drivers ánd constraints.
“Doesn’t constrain it to be zero sum.”
Yes, it does. 100 Gt gets reduced in a year by photosynthesis. It’s all going to oxidise again. Whether that is done by humans, burning biomass, wildfire, microbes just affects the timing, for that year’s crop.
Nick you say
“Yes, it does. 100 Gt gets reduced in a year by photosynthesis. It’s all going to oxidise again. Whether that is done by humans, burning biomass, wildfire, microbes just affects the timing, for that year’s crop.”
so plants don’t sequester carbon?
3 GT of CO2 from human breathing annually(not to mention flatulence and
waste).
What to do now?
Turn our blood into chlorophyll so we can get our energy from water and sunlight and exhale oxygen instead
Well, to start, maybe those supporting CAGW would only inhale?
/huh?
See theeuroprobe.org 2012 – 015 The Great Global Warming Fraud. The Guardian Warmist columnist George Monbiot has been unable to find fault with this.
In the Basilica of the Vatican flanked by his Holiness and Employees, Bon Ki Moon will proclaim: “We have determined … that the Atom, CO2, is gaining mass due to Human Global Warming. In order to stop this … we demand all armies of the world to declare war on CO2 … to Kill CO2 at all cost before CO2 kills us.”
The delightful cheers of the crowd from the Basilica also have screams of agony as many are torched and burned to dead to appease his Holiness-General Bon Ki Moon.
Bon Ki Moon…I thought it was Mon Ki Mann
Burning biomass merely accelerates the CO2 release. Burning a forest releases CO2 immediately rather than waiting for the trees to rot naturally. So the only differentiator between anthropogenic and natural is a few years. Then the regenerating forest sequesters CO2 for another cycle.
I think this article is verbose and could have been adequately expressed in little more than its summary. The overuse of exclamation marks is also a detraction.
“Controlled burns of forest land and agricultural stubble are an additional anthropogenic contribution. Probably wildfires started by arsonists should be considered anthropogenic sources of CO2 also! Maybe we should also consider the CO2 resulting from smoking tobacco and marijuana for a thorough accounting!”
This is absolute drivel. If this was true, you wouldn’t be able to burn it again in ten years time. The process is cyclical. Regeneration and regrowth following the burn replace the fuel with stored CO2 that were present before the burn. This is so simplistic, I don’t know why the subject keeps on raising it’s empty head.
“GCM’s…gave no prediction of the current plateau in average global temperatures…”
Except for the ones that did, eh Brother Clyde?
http://www.nature.com/nclimate/journal/v5/n5/full/nclimate2575.html
Village Idiot,
That link is self-serving nonsense. Where are the real world measurements? There aren’t any, it’s just more grant-trolling by assertion.
Clyde Spencer is right. No one predicted that global warming would stop following the 1997 anomaly. But it did stop, which explains your consternation. Your belief system has taken a whack, and you’re looking for something to rescue it. But that paper fails.
The rate at which air cools or warms depends on the moisture status of the air. If the air is dry, the rate of temperature change is 1oC/100 meters and is called the dry adiabatic rate (DAR). If the air is saturated, the rate of temperature change is .6oC/100 meters and is called the saturated adiabatic rate (SAR). The DAR is a constant value, that is, it’s always 1oC/100 meters. The SAR varies somewhat with how much moisture is in the air, but we’ll assume it to be a constant value here. The reason for the difference in the two rates is due to the liberation of latent heat as a result of condensation. As saturated air rises and cools, condensation takes place. Recall that as water vapor condenses, latent heat is released. This heat is transferred into the other molecules of air inside the parcel causing a reduction in the rate of cooling.
DAR does not except in theory. Actual measured LR does get above 7K/km.
Refer me to LR = 10K/km. Where?
“An increase in surface water-vapor resulting from may be responsible for increased retention of heat at night and a decrease of temperatures in the day in arid rural areas.”
METEOROLOGIST JEFF HABY
Here are the most common stability / instability terms you will run across and the definition.
Potential Instability– Instability caused by mid-level dry air being advected over the top of PBL warm/moist air. If the troposphere is forced to lift (i.e. by a front, jet streak, vorticity, etc.) the warm/moist air will initially rise at the moist adiabatic lapse rate (avg. of 5 C/km) while the dry air will cool at the dry adiabatic lapse rate (9.8 C/km). Over time, the temperature lapse rate (rate of cooling with height) increases.
Convective Instability– The same as potential instability
Absolute Stability– Any layer in the atmosphere where the rate of actual temperature decrease (or increase) with height is less than the cooling rate of the moist adiabatic lapse rate. The most stable layers are inversions (a.k.a. cap) where temperature increases with height.
Absolute Instability– Any layer in the atmosphere where the rate of actual temperature decrease with height is greater than 9.8 C/km (rapid cooling with height). On a sounding these are termed superadiabatic lapse rates. They most commonly occur at the surface during strong solar surface heating.
Conditional Instability- Any layer in the atmosphere where the rate of actual temperature decrease with height is between the moist and dry adiabatic lapse rate. The air is unstable if saturated but stable if unsaturated. Saturated air cools less with height due to latent heat release thus allowing the parcel to be warmer than the environment if lifting occurs in a conditionally unstable environment.
http://www.theweatherprediction.com/habyhints/45/
Another analysis method is to look at the paleo climate data and solve the puzzle what causes cyclic and abrupt climate change in the past? There is a physical reason for all of the past changes.
With the answer to the puzzle ‘What is the physical reason, the forcing function(s) for the past cyclic warming and cooling and abrupt climate change ?’ it is possible to make a very accurate ‘prediction’ of what to expect next to the earth’s climate.
The solar cycle is entering a special Maunder minimum phase, based on the paleo data and the answer to the why planetary temperature change in the past, planetary temperature and atmospheric CO2 will significantly drop and the drop be rapid not gradual. What is the logic to support that assertion?
The following is how the earth’s temperature and atmospheric CO2 have changed in the last 420,000 years.
http://cdiac.ornl.gov/trends/temp/vostok/graphics/tempplot5.gif
http://cdiac.ornl.gov/trends/co2/graphics/vostok.co2.gif
What can we concluded from looking at the Antarctic graphs (last 420,000 years) and the Greenland Ice sheet data (last 14,000 years) graphs?
http://wattsupwiththat.com/2012/09/05/is-the-current-global-warming-a-natural-cycle/
Greenland ice temperature, last 11,000 years determined from ice core analysis, Richard Alley’s paper. William: The Greenland Ice data shows that have been 9 warming and cooling periods in the last 11,000 years. There was abrupt cooling 11,900 years ago (The ‘Younger Dryas’ 11,900 BP abrupt cooling period when the planet went from interglacial warm to glacial cold with 75% of the cooling occurring in less than a decade and there was abrupt cooling 8200 years ago during the 8200 BP climate ‘event’).
http://www.climate4you.com/images/GISP2%20TemperatureSince10700%20BP%20with%20CO2%20from%20EPICA%20DomeC.gif
Whenever I see the Vostok plot there is one particular question that I want to ask the cognoscenti here but have been afraid to ask in case the answer is embarrassingly obvious .
Why does the sharp rise in temperature , accelerated by feedback from thermally released CO2, stop at about 2C above benchmark each time?
Has the supply of oceanic CO2 been depleted?
in those cores CO2 lags the rise and fall of temperature. it lags by 800 years so it is the proof the rises and falls of temperature have other drivers then CO2.
this is because of the fact the oceans release and absorb CO2 according to theit temperature. As the oceans are vast heat storages they cool and warm much more slower then land.
So in short the ice core data proves CO2 never has driven the fluctutions of earth’s climate. the real causes are still unknown but continental drift, milankovich cycles and tsolar variations are one of the theories that attempt to explain these changes.
mikewaite
CO2 did not accelerate any temperature change. The claim that it could do this is false. CO2 follows, lags, temperature changes and it is clear form the ice core records that temperature can plunge while CO2 is high. If high CO2 cannot maintain a warm climate, it certainly cannot create one.
The 2 deg C top end is because the zero is set at the Modern Period average and these peaks are thus only 2 deg C above that. As the oceans contain about 50 times as much CO2 as the atmosphere, it will not be depleted of CO2. Oceans will outgas CO2 while warming and while cooling, until they cool enough and CO2 is high enough to favor dissolution of Co2 back into the oceans.
A little careful: there is a huge overlap between the temperature increase and the CO2 increase during a de-glaciation: the lag is about 800 years, but the whole increase is about 5,000 years. That makes that the climate models can be made with a positive “help” from CO2 on temperature.
Not so for the opposite cooling after the previous interglacial: temperature and CH4 were already at a new minimum (and ice sheets at a new maximum) when CO2 started to go down. The drop of 40 ppmv didn’t give any measurable change in temperature…
Your question, Why does the sharp rise in temperature, accelerated by feedback from thermally released CO2, stop at about 2C above benchmark each time?
Answer: Clouds.
Water vapor pressure increases with temperature. Bulk vapor rises and cools until it condenses into clouds.
Clouds reflect incident solar energy back into space, surface cools. You could also call this net planetary albedo increases with temperature.
Thank you to all who replied to my comment . Interested in bw’s suggestion that clouds terminated the warming process . Could that be relevant today? Surely it is an idea suitable for modelling and checkable experimentally since we are currently sitting on top of one of those peaks.
good question, followed by good answeres; Thanks – Hans
What is the physical reason, the forcing function(s) for past cyclic warming and cooling and abrupt climate change in the past?
Look at the above graphs more careful. What does the data indicate is the cause of the cyclic climate change?
1) Planetary temperature changes cyclically. Something is causing planetary temperature to change cyclically. Alley’s Greenland ice core data indicates changes in atmospheric CO2 are not the cause of the cyclic warming and cooling and the abrupt climate change events in the last 14,000 years. There is no correlation of temperature and atmospheric CO2 levels in the last 12,000 years.
2) Planetary temperature was multiple times during other interglacial periods been significantly warmer than the current interglacial, period the Holocene. Atmospheric CO2 changes are not the reason why the planet was warmer in the past during past interglacial periods (see 4).
3) Interglacial periods end abruptly, not gradually. Interglacial periods are short, less than 12,000 year in duration. Glacial periods where two mile thick ice sheets cover Canada, the Northern US states, the UK and Northern Europe are long more than 100,000 years.
4) Solar cycle changes are driving the entire cycle. The CO2 mechanisms saturates at around 220 ppm for a reason which is not taken into account in current modeling. The upper troposphere is different due to a fundamental solar factor that is not taken into account. (Additional data and analysis results supports these assertions.)
Milankovitch’s hypothesis that summer insolation changes at 65N is somehow driving this cycle is an embarrassing urban legend. There are more than 12 different paradoxes that invalidate Milankovitch’s hypothesis. Milankovitch’s hypothesis is silly urban legend. Paleo climatic text books list a half dozen of the paradoxes with Milankovitch’s hypothesis and then state it is part of the solution as the authors have no idea what causes the glacial/interglacial cycles. Urban legends fill the theoretical void as there must be a physical reason for the changes.
5) One of the principal reasons why the scientific community have failed to solve the problem what causes the glacial/interglacial cycle and cycle climate change is the standard model of the sun is not correct. The sun is significantly different than assumed. Have your heard about the solar neutrino paradox? The proposed solution was neutrinos change as the move through space. Fundamental physics does not support the assertion that neutrinos have mass and hence cannot change as they travel through space. The alternative solution to the paradox is roughly a third of the solar reactions are not fusion.
6) There is in the paleo record unequivocal evidence of massive abrupt climate changes. Look at the dang graphs. Interglacial periods start and end abruptly. Why? There is evidence of cyclic abrupt climate change throughout the entire 420,000 year period. Ocean sediment data analysis show similar cyclic abrupt climate change for the last 1.8 million years. There has been 22 glacial/interglacial cycles.
7) If solar cycle changes are responsible for the entire changes in planetary climate (there are at least three major forcing mechanisms that are not currently taken into account), then the sun must and does change periodical in a manner that causes cyclic abrupt climate change. What is missing is an explanation of how the sun changes periodically and how solar cycle changes cause the abrupt climate changes and more gradual warming and cooling cycles such as was observed in the last 150 years.
8) Salby estimated based on two independent analysis methods that 66% or more of the recent rise in atmospheric CO2 is due to natural sources, not due to anthropogenic CO2 emissions. Basic analysis of the current CO2 changes supports Salby’s assertion. What is missing is an explanation of the mechanisms as to why CO2 is increasing and what is the source of low C13 carbon. Solar changes are also driving changes to deep CH4 emission and which is how solar changes cause there to be an increase in earthquakes and volcanic eruptions. Note the ocean temperature is increasing down to 700 meters which implies there must be mixing of the surface ocean with the deeper ocean water. That mixing is the missing sink and source.
9) Current solar observations how the sun is changing in the last 12 years, how the geomagnetic field is currently changing starting in the mid 1990, and knowledge of the mechanisms by which the sun causes gradual and abrupt climate changes all support the assertion that the solar cycle has been interrupted. If that is correct we are going to see significant rapid cooling (0.7C) followed by abrupt climate change cooling (2C to 4C).
William,
Your point 8) doesn’t fit reality: Salby used the 14C bomb spike decay, which is way faster than a 12CO2 spike decay as “proof”, that is at least a factor 3 wrong. The real increase is 96% human 4% temperature.
There are only two sources of low-13C: fossil organics and recent organics. Recent organics are not the cause: the whole biosphere is a net, increasing sink for CO2. Neither are the oceans: way too high 13C/12C ratio…
Neither is CH4: that increased a 2.5 fold with human emissions, not natural emissions, but still is less than 1% of the CO2 influence on 13C/12C ratio.
The problem with all you professional science types (including skeptics like the author) is that your careers all depend on making everything seem as complicated and complex as possible. Of course the climate itself is complex. Complex to the point that assessing contributions of individual components of it is next to impossible. But this does not mean that answering questions about it need also to be complex, complicated or down right convoluted!
We all have some basic information available to us: A rise in CO2 from 280ppm to 400ppm and a rise in global mean temperature of 0.8C whilst this rise in CO2 occurred. So let’s have a more basic assumption to give the warmists the benefit of the doubt. Let’s say this 0.8C rise in temperature is directly and exactly attributable to the 120ppm rise in CO2.
Now all one needs to do to confidently asses risk is get a precise answer to the following question: What would the mean temperature of the Earth be if there was zero CO2 in the atmosphere?
If you can answer this question then you can draw a graph that will predict what future rises in CO2 will do to temperature under the assumption that we were correct in the warmists original assumption. It does not matter how complicated or complex or convoluted your calculations are to reach your answer of the zero CO2 question, once you have that answer all other considerations after you have your answer are superfluous and irrelevant. The graph is the sum total and representation of ALL calculations, feedbacks, etc, etc, simply expressed in a single line.
Yes I know, it will probably put lots of scientists out of a job, but let’s face it, PHD’s are being handed out as free gifts in cereal boxes these days. Time some of you got a real job serving burgers or similar!
If you can answer this question then you can draw a graph that will predict what future rises in CO2 will do to temperature under the assumption that we were correct in the warmists original assumption.
No you couldn’t. Adding a gallon of water to an empty pail has a completely different result than adding a gallon of water to a pail the is full. You can’t quantify the result of the first 280 ppm of CO2 and calculate from the the effect of the next 280. Or even the next 120 as the climate modelers have discovered. The feedback effects change considerably from one concentration to the next, they even change as temperature changes, so nailing them down with such a simplistic approach would just be another way of getting the wrong answer.
Sorry that it is complicated, but it is. If it was simple, people would be banging out climate models that get it right both hindcasting and forecasting with ease. But they can do neither.
Apollo 13 demonstrated that the temperature of an unheated spacecraft in full sunlight at the Earth’s orbital distance is somewhat less than the freezing point of water. What we don’t know with any precision is how much of the difference between that and the 14C surface average is due to the Earth’s internal heat, and how much due to atmospheric greenhouse effect. Then again, we don’t know how much greenhouse effect is due to water vapour and how much due to CO2.
What we do know with certainty is that the effect of CO2 works to a natural log law, and by applying Arrhenius’ equation this indicates that the bulk of its effect will be present at relatively low concentrations, say 10-50ppm. Once you get into the hundreds of ppm, any further effects of increases are at most of the order of a degree or two Celsius.
This really leaves the catastrophic predictions of the alarmists to rely on ‘positive feedbacks’ which are unproven, and which from an engineering point of view seem unlikely to work the way they claim even if they do exist.
It’s a non linear solution.
”
wickedwenchfan
May 5, 2015 at 11:27 pm
Now all one needs to do to confidently asses risk is get a precise answer to the following question: What would the mean temperature of the Earth be if there was zero CO2 in the atmosphere?”
Wouldn’t matter – we’d all be dead along with all the carbon based life on the planet.
But, as some have mentioned, that “single line” would be very much a curved line possibly showing the relatively recent 150 ppm of atmospheric CO2 having a very small, if measureable, effect.
“What would the mean temperature of the Earth be if there was zero CO2 in the atmosphere?”
No problem. No change, if using the day time only used in climate models. Water vapor is a much more powerful radiative gas and absolute water vapor would replace the missing CO2, according to Miskowski.
During the day CO2 and water vapor are saturated with IR radiation, both emitting and absorbing IR and converting IR to heat and the reverse; the result is a wash, no change. That covers all the climate models, as they do not do night time or related energy movements.
During night time, these two radiative gases, unopposed by solar energy input, convert heat energy in the atmosphere to IR, which is then lost to space. This process is why the air chills so rapidly after sunset and why little breezes kick up so quickly in the shadows of clouds while they move across the landscape on a sunny day. So, the nights would be cooler, but the days unchanged.
Does not is observed that the two gases. The temperature drop in height depends only on the humidity.
I would dispute this. I believe that the CO2 hockey stick is a myth because ice core data fails to account for the fact that CO2 is soluble in water, even frozen water. The longer the air has been trapped, the more CO2 will dissolve.
IOW, I find the detailed scientific arguments by Dr Zbigniew Jaworowski to be very compelling. http://www.warwickhughes.com/icecore/
Also, I learned some things from various CO2 studies:
1) There are no CO2 domes over highly industrial areas. Man is nearly insignificant.
2) CO2 is well mixed WHEN the wind is blowing. When the wind is not blowing, heavy CO2 settles to the surface. Plants can’t eat when it’s windy.
3) Measuring the global CO2 level has the same degree of difficulty as measuring the global energy content. It varies greatly based on time and place.
Vostok is generally windy. Average = 11 mph, sometimes gusting to 60 mph (during snow storms?). Since Vostok is at 11,444 feet, it’s too high for a lot of those heavier molecules like Oxygen and CO2.
But hey, let’s go completely insane and decide that completely incorrect readings taken at Vostok should be wildly projected onto the entire earth.
I’ve concluded that there is no reliable evidence to indicate that pre-industrial CO2 levels were lower than today.
VikingExplorer,
Put a bottle of Coke in a freezer. Wait until completely frozen. If the bottle doesn’t explode before you open the bottle (careful!), open the bottle. Close it again and let the ice melt. After melting measure the residual amount of CO2 in the melt water. Result: near zero.
To be blunt: the “scientific” arguments of the late Jaworowski are pure nonsense, even physically impossible. Let him rest in peace together with his ideas about CO2 in ice cores. See further:
http://www.ferdinand-engelbeen.be/klimaat/jaworowski.html
1. If there is little wind, you will find CO2 levels which are a lot higher near sources and less at sinks. That is higher in towns all day and in forests at night (under inversion) and lower during the day.
2. When the wind is not blowing, CO2 settles near sources, but CO2 doesn’t settle once mixed with the rest of the atmosphere. In stagnant air (like in firn), after 40 years, the bottom is about 1% richer in CO2.
One find the same CO2 levels from a few hundred meters above land (are from the sea surface) up to 20 km height and from near the North Pole to the South Pole: within 2% of full scale, including huge seasonal changes.
3. Measuring “global” CO2 levels is the most easy thing to do: just look at a place where there are least nearby sources and sinks. There are over 70 “background” stations which show near the same CO2 levels over years:
http://www.esrl.noaa.gov/gmd/dv/iadv/
Antarctica thus is the ideal place to measure CO2: no vegetation or volcanoes for thousands of km around, no human influence,… As ice core CO2 is measured with an accuracy of +/- 1.2 ppmv (1 sigma), it is an treasure of information of historical CO2 levels, be it smoothed over many years, depending of the resolution.
Ferdinand Engelbeen
You say
No, Ferdinand, Jaworowski’s arguments are NOT “nonsense” and they are NOT “physically impossible”, but they do refute your circular (i.e. so nonsensical) mass balance argument.
Richard
Huh? Any loss of CO2 will be because you opened the bottle. The process of crystallization will force the CO2 out. This would happen on those cold snowy nights at Vostok all those years ago as well. This would tend to cause these measurements to be lower than actual reality.
If you didn’t open the bottle, then you should know that Henry’s law is always true. If you freeze a carbonated beverage in a sealed container, and the container remains sealed and doesn’t leak, then the CO2 will re-enter the beverage once it is a liquid again. This is because the contents will still be under pressure, and the pressure forces the CO2 into the beverage.
This might happen at Vostok if it was snowing really hard. For example, Alta, Utah (550 inches/year) would capture quite a bit of air. However, Vostok is very dry (.102 inches/year).
The bottom line is that your example seems to prove my point. If the bottle cap is opened, which is generally the case at Vostok, the CO2 reading will be lower than reality. If the cap is partially closed, where air is captured by being dumped on by .102 inches of snow per year, the gradual decrease in CO2 away from the melt layers is consistent with CO2 diffusion.
I read your link. It doesn’t come anywhere close to challenging Jaworowski, Segalstad, et al. It’s typical AGW pseudo science.
>> If there is little wind, you will find CO2 levels which are a lot higher near sources and less at sinks
Actually, no significant variations with respect to human sources. The base line CO2 level in highly industrial and urban Hong Kong is actually lower than Mauna Low, where there are no significant humans for 6k miles in any direction.
Richard,
I know, you did have a good connection with the late Jaworowski, but what he said is simply impossible:
– He used the wrong column in Neftel’s ice core measurements to accuse Neftel of an “arbitrary” shift of 83 years to “match the ice core data with the Mauna Loa data”.
But Jaworowski did look at the age of the ice, not the average age of the gas bubbles, where the average gas age is (near) always much younger than the ice at the same depth, as the pores remain open long after the snow is settled. So far for an ice core “specialist” (for which is not the slightest evidence that he ever did any own research on CO2 in ice cores).
– What closed the door for me, is that according to him, one finds too low levels of CO2 in ice cores, because CO2 (preferentially?) migrates through cracks from drilling and relaxation to the outside.
The ice core air bubbles contain 180-300 ppmv CO2 as measured (which BTW don’t change even if repeated years later). The outside air contained between 350-395 ppmv CO2 after the cores were drilled. Migration from lower to higher levels???
Thus sorry, let him rest in peace…
VickingExplorer,
Open a bottle of Coke and close it again: some CO2 will be lost, but most still is in the liquid and after some time the CO2 pressure under the cap is again up. Do the same with a frozen Coke and near all CO2 is lost. The bottom message: ice doesn’t contain any CO2, it is all driven out if you freeze water.
All CO2 in ice cores is in the enclosed air bubbles. Not in the ice. There may be some hidden in the liquid-like layer at the border between ice and air, but that is easily removed at measuring time as that is done under vacuum, so that any CO2 is moved out with the water-like layer (that is frozen out over a cold trap again).
It makes not any difference that Vostok has a few mm of ice equivalent of snow per year and Law Dome (coastal) has 1.2 meter ice equivalent per year: the air bubbles contain the same CO2 level for the same average gas age.
And the moment that you can explain to me how CO2 from an air bubble inside an ice core can migrate to a higher CO2 level in outside air, I may reconsider my opinion about the scientific knowledge of Jaworowski about ice cores…
Further, any reference of the measured higher levels of Hong Kong vs. Mauna Loa?
The point was that it was a very convenient assumption that the difference in age between ice and air was made to match up with current measurements. So, the crazy explanation was that today’s air is busy clawing it’s way down through pores in order to settle into ice that was formed 83 years ago…
Let the readers decide for themselves: http://www.angelfire.com/mo/radioadaptive/jawcv.html
I did already, or actually you did. It’s just like the bottle of coke. The ice is under a great deal of pressure. Crystallization will force CO2 in water to be squeezed out. CO2 may not be preferentially removed at the point of drilling. However, CO2 is preferentially ejected from water during crystallization.
Any air bubbles prior to drilling are at pressures greater than the ambient pressure for that altitude. When the ice is dramatically disturbed by drilling, cracks naturally form, the pressure is relieved and poof, it’s gone. Just like you said: “After melting measure the residual amount of CO2 in the melt water. Result: near zero.”.
Over time, there are many partial melt & refreeze transitions. Henry’s law is always in operation. The air bubbles are extracted by melting, crushing or grating the ice in a vacuum. A vacuum will cause water to boil almost instantly and then freeze (desublimate). IOW, after all these physical processes, the resulting CO2 measurement likely doesn’t reflect the atmosphere, but rather, it mostly reflects CO2 in the water.
So, what about that? The problem is that CO2 will gradually decrease as one moves away from the melt layers by CO2 diffusion. I refer you to:
CO2 diffusion in polar ice observations from naturally formed CO2 spikes in the Siple Dome (Antarctica) ice core Jinho et al
Anyone who reads that carefully will realize that attempting to determine ancient atmospheric CO2 by ice core analysis is extremely difficult. IOW, while no scientist is right about everything, or even most things, Jaworowski was on the right track.
The scientific method requires that we attempt to falsify hypotheses. Examples:
1) we know from independent measurement that the CO2 levels in the 1940s were likely the same as today (400+), yet the ice core data for the same time period indicates about 300 ppm.
2) we know that at a CO2 level of 200 ppm, plants hardly grow at all. If the ice cores were correct, plants should confirm. This was very nicely explained here on WUWT (http://wattsupwiththat.com/2010/12/26/co2-ice-cores-vs-plant-stomata/)
Btw, David’s ~250 year time lag for CO2 peaks from temperature increases has been confirmed to be about 200 years by N15 analysis of ice cores. (http://www.scientificamerican.com/article/ice-core-data-help-solve/)
Ferdinand
You assert that ‘Zeb’ J was wrong because he does not agree your untrue belief that ice cores act as sample bottles for atmospheric air.
Stomata data also don’t agree with your mistaken belief but they do agree with ‘Zeb’ J.
The argument of ‘Zeb’ J is right. You are wrong.
Richard
VikingExplorer,
The point was that it was a very convenient assumption that the difference in age between ice and air was made to match up with current measurements.
If you had any idea how the bubbles are formed in ice cores, you would know that the average age of the air in the ice is a lot younger than the age of the ice itself.
When snow is settled it is more air than ice. There is free flow of air between snow and air. As the layers get on and on, the snow is compacted to firn, but still has open pores in direct connection with the atmosphere. That means that e.g. in the Law Dome ice cores at 72 m depth, where the bubbles are getting enclosed, the ice is 40 years old, but the average gas age is only 7 years older than the air in the atmosphere, as it had 40 years of free contact with the atmosphere: more than time enough to get a lot of diffusion, until the pores are getting smaller and smaller.
Nothing is assumed: calculated from a firn densification model which was confirmed by direct measurements top down in firn, already in 1996 by the work of Etheridge e.a. See for a nice description of what happens:
http://courses.washington.edu/proxies/GHG.pdf
(14) validity of polar ice core records of greenhouse gases for reconstruction of the composition of the ancient atmosphere.
In the cv of the late Dr. Jaworowski, that is the only sentence about CO2 in ice cores. He may have been a world expert of radionuclides in general and specific in ice cores, but there is not a shred of evidence that he had any knowledge of CO2 in ice cores or has done any own research on that topic. All what I have read is that he had a lot of comments on other’s work on ice cores, of which most remarks were refuted by the work of Etheridge at three ice cores taken at Law Dome, published in 1996.
When the ice is dramatically disturbed by drilling, cracks naturally form, the pressure is relieved and poof, it’s gone.
Think a little harder: if there are cracks, the pressure is relieved and the air is gone, not preferentially its CO2 content. To the contrary: as CO2 has a higher affinity to water and the ice surface than O2 or N2, if there were such escapes, the CO2 levels would be measured higher, not lower…
CO2 diffusion in polar ice observations from naturally formed CO2 spikes in the Siple Dome (Antarctica) ice core Jinho et al
The theoretical result of that work is that the resolution of the Siple Dome ice core broadens from ~20 years to ~22 years at medium depth and to ~40 years at full depth. That is all. The migration in a “warm” coastal ice core thus makes the resolution worse, but that doesn’t change the average CO2 level over the period of resolution.
For the much colder inland ice cores, there is no measurable migration at all…
we know from independent measurement that the CO2 levels in the 1940s were likely the same as today
Historical measurements in the middle of Paris, Vienna, midst growing plants, forests,… have not the slightest value for the determination of the average “background” CO2 of that time. Historical measurements taken over the oceans or coastal with wind from the sea are around the ice core values. See:
http://www.ferdinand-engelbeen.be/klimaat/beck_data.html
http://wattsupwiththat.com/2010/12/26/co2-ice-cores-vs-plant-stomata/
If you refer to an article, you should also read the many comments of mine below that article…
David’s ~250 year time lag for CO2 peaks from temperature increases has been confirmed to be about 200 years by N15 analysis of ice cores.
Yes, and CO2 levels lag several thousands of years when temperature decreases after an interglacial. But the same ice cores do show that the temperature influence is not more than 8 ppmv/K…
Richard,
I don’t agree with the late Dr. Jaworowski because he falsely accused real ice core researchers (Neftel) of cheating, while he was completely wrong by looking at the column of ice age i.s.o. average gas age. Even after asking him why, he insisted that there was no difference between gas age and ice age in ice cores, as there are frequent remelt layers. Neftel has encountered one remelt layer near bubble closing depth and adjusted his average gas age accordingly…
And as said before: if you can explain to me how one can have migration of CO2 through cracks in the ice from lower inside to higher outside levels, I may change my mind about his knowledge of ice cores…
You need to read a little better, and then think a little harder. I clearly explained. Again, CO2 IS preferentially squeezed out of freezing water. The air has most of the CO2 of the combined air & water while the water is frozen. Poof, it’s gone through the cracks formed by drilling. Just like your bottle of coke. Then, the ice is melted and Henry’s law distributes CO2 between air and water. So, it’s really hard to say what the final measurement means. It certainly isn’t a clear reflection of ancient atmosphere.
Really? That is an extremely biased and favorable reading of that paper. Did you read:
This indicates that a key phenomena affecting the readings has not previously been accounted for.
Perhaps because they are using a-priori science? Higher readings are impossible because they don’t agree with what we already know the answer is.
VikingExplorer,
Again, CO2 IS preferentially squeezed out of freezing water. The air has most of the CO2 of the combined air & water while the water is frozen.
Please read some literature beyond what Jaworowski or Segalstad wrote about ice cores… You have no idea how ice cores are formed.
Snow at Antarctica (and in general) is formed directly from freezing water vapor not liquid water. It is a very fine open crystal structure including and surrounded by air. When it falls on earth, it is compacted and the pores get smaller and smaller until the last air is completely enclosed in ice.
The coastal cores of Antarctica have an average temperature of -20 to -25°C, which makes that only a very small water-like layer is present of some 5 atoms thick (measured by Roentgen diffraction) at the ice-air border of the bubbles. There some CO2 may hide, but that is effectively removed when the ice is grated (not melted!) under vacuum.
The measurements of CO2 in melted ice were completely abandoned as that gives much too high readings in ice from Greenland, where frequent acid deposits from nearby Icelandic volcanoes reacts with carbonate deposits from the oceans. Greenland ice therefore can not be used for reliable CO2 measurements, as such reactions also occur in situ.
Alternative method is sublimating all ice and cryogenic separation of all molecules, as is done for isotopic ratio determination. No CO2 can hide anywhere…
The deep inland ice cores like Vostok and Dome C are average -40°C and there is certainly no liquid water present anymore, except where huge deposits of dust/salts are present, which is mainly in the coldest periods.
Further, have a better look at the summary of the migration study:
This work shows that the smoothing of the CO2 record in the core by diffusion is one to two orders of magnitude smaller than the smoothing induced by the gas age distribution at the depth of 287 m
The smoothing (resolution) of the Siple Dome ice core is ~20 years. The theoretical diffusion then is maximum 10% of the resolution at 287 m depth, thus that makes 22 years i.s.o. 20 years resolution. At full depth, the – still theoretical – resolution doubles to 40 years. That is all. The new theoretical method did calculate some probable migration, the old method showed such a low migration that none was measurable. 100 times near zero still is near zero…
Near remelt layers one can find higher CO2 levels, just because CO2 is more soluble in water: O2 and N2 stay in the air exchanges while CO2 is retained. When the layer is refreezing all CO2 gets into the nearest air bubbles. Thus if anything is going wrong: you will find too high levels, not too low…
Ice core parts with remelt layers are avoided for measurements and the average gas age of the layers below such layer is corrected accordingly.
But that is only a problem for the coastal cores, the inland cores have no problem with remelt layers and don’t show any measurable migration after 800,000 years…
Ferdinand, I realize that you have suspended disbelief with regard to these ice cores.
Premise: CO2 levels in some layers are up to 58 times greater than what is expected for the atmosphere
Premise: law of averages is valid
Conclusion: Other places are lower than atmospheric.
It would be “begging the question” and scientific malpractice to decide that ice has previously melted IF the CO2 levels are higher than expected. That would be like the fraud exposed by McIntire with trees in Colorado being discarded if they didn’t show the correct result.
Premise: The air temperature is cold at Vostok @ 11k ft (above the ice)
Premise: The Antarctic land mass is warm
Premise: There are many volcanoes in Antarctica
Premise: Ice acts like a thermal insulator, while new snow is an even better insulator
Premise: Freezing water releases latent heat (see shallow aquifers in Greenland)
Premise: High pressure can push frozen water into the liquid state
(As predicted by Russian scientists, liquid water has been found deep in the ice sheet)
Premise: Liquid water inside an ice pack is typically supersaturated with N, O, CO2, 50 times greater than normal
Premise: The Antarctic Ice pack is dynamic, with some 400 sub-glacial lakes and a network of rivers
Premise: The entire volume of a sub-glacial lake is typically replaced every 13k years, by continual melting and freezing
Premise: The presence of any liquid water will distort CO2 readings
Premise: Air captured by snow/ice will likely be distorted by CO2 diffusion under great pressure
Conclusion: Ice cores are not the static, reliable source of historical information that AGW enthusiasts have claimed.
wickedwenchfan
Not really, the temperature started going up well before the CO2, and the CO2 only really started getting going over the past 60 years, while the temperature is pretty much the same as it was 80 years ago. The correlation on a short time scale is poor. The AGW claim is that the effect is immediate followed by accumulated positive feedbacks. There is virtually no support for this hypothesis – just 1976-1996 which is a pretty thin argument. The temperature simply doesn’t co-vary with CO2. It does all sorts of things.
Because the surface temperature is a poor measure of internal energy (and the idea behind AGW is energy, not temperature) citing the temperature of the atmosphere is not persuasive. Ocean temperature at least has a chance of being persuasive. So does the ocean heat content co-vary with CO2 in the atmosphere?
“IMPORTANT: the processes of evaporation and condensation take 7.5 times as much energy as melting or freezing. This is why evaporational cooling will cool the air much more than the melting of snow. For example, let’s say snow is falling and the outside temperature is 40 degrees Fahrenheit. As the snow falls into the warmer air it will begin to melt and some of it will be evaporating. The evaporation from the wet snow will cool the air 7.5 times as much as the melting of the snow. If the temperature drops from 40 to 32 degrees as the snow falls, about 7 of those 8 degrees of cooling is caused by the evaporation process. Melting cools the air also, just not near as much as evaporation does. When water undergoes a phase change (a change from solid, liquid or gas to another phase) the temperature of the H20 stays at the same temperature. Why? Energy is being used to either weaken the hydrogen bonds between H20 molecules or energy is being taken away from the H20 which tightens the hydrogen bonds. When ice melts, energy is being taken from the environment and absorbed into the ice to loosen the hydrogen bonds. The energy taken to loosen the hydrogen bonds causes the surrounding air to cool (energy is taken away from the environment: this is latent heat absorption). The temperature of the melting ice however stays the same until all the ice is melted. All hydrogen bonds must be broken from the solid state before energy can be used to increase the H20’s temperature.”
http://www.theweatherprediction.com/habyhints/19/
There is a practical effect and a demonstration that melting ice draws heat from the environment.
For people, like me, who have been involved in agriculture, the damaging affects of frost on plant tissues can be dramatic and catastrophic.
Those of us who pay attention to such things have developed methods to minimize such damage wherever possible.
One of the most effective ways to keep frost from damaging plants or parts of plants (plants includes trees of course) is to melt the frost off with water, rather than letting it melt itself. Most damaging is if the sun melts the frost. Spraying too soon and then stopping the water, or letting the frost reform may increase the damage, s timing and sufficient water is critical.
The reason is that the tissue destruction occurs when the frost melts, and the melting crystals draw heat from the cells.
I have saved many a crop that were covered with frost all night, by watering them just as the sun was about to hit them. Including my crop of bananas from the frost which hit SW Florida a few months ago (I am not currently in the plant nursery biz).
We need to be looking beyond CO2 if we want to have confidence we really understand the problem!
=====================
What problem?
If the writer is referring to the ‘problem’ that the models are useless tools for simulating the Earth’s atmosphere it’s because the task is well beyond current technology and probably impossible.
“What would the mean temperature of the Earth be if there was zero CO2 in the atmosphere?”
Answer is simple: no life on earth.
A simple, direct and accurate comment. Thanks
Sorry I should have added. “To calculate it.”
He forgot about the Carbon!! sequestered in all those humans.
AAAgh!!!!!!!!! and I’m one of them.
But some people are full of something entirely different…
Still includes carbon
I’m so glad you raised the issue of CO2 accounting. Someone else has done a little research on it; seems not all bio-energy is created equal. I find it rather exasperating when the EPA tries to do an end run on this. (Scroll down the page to get to the article) http://www.princeton.edu/step/people/faculty/michael-oppenheimer/recent-publications/Fixing-a-critical-climate-error-T.-Searchinger-et-al-2009-.pdf
Nice overview, I only want to know if highways and all other roads are included in the UHI effect.
I have doubt that maintaining the current CO2 level has any influence on sea level , because sea level is more controlled by natural variability.
davidmhoffer, you say;
“”””By temporarily absorbing a photon and instantly (for all practical purposes) re-emitting it in a
random direction, the energy flux is redistributed in all directions. It is this redistribution that
results in an increased downward energy flux and hence higher temperatures.””””
It is the ‘increased downward energy flux’ I am unable to understand. I read that ‘half’ the
energy flux is downward thus ‘half’ the energy absorbed from the sun fails to reach
the surface. A cooling effect.
When sunlight is abscent about 18% of the upward radiation from the surface is within
the 3,800 active lines in the 15 micron band. There maybe some 1% energy in the 4.3
micro band and none in the 2.7 micron band.
The most energetic photons in the 15 micron band will be at 13 microns which peak
at a temperature of some MINUS 30 degrees.
I understand that CO2 molecules, in the abscence of sunlight, will at their local air
temperature which will be warmer than -30C until above the tropopause.
Thus it is clear most CO2 molecules will be radiating over the 15 micron band. Any
absorption from the surface will not ‘heat’ the molecule, at best there will be a DELAY
in the re-emission of a similar photon. A delay in cooling is not heating.
Radiation theory states quite clearly that any object radiating at a specific temperature
will not absorb any photons with energy levels below that peak temperature. If any such
photon is absorbed a similar photon will be instantly (for all practical purposes) be re-emitted.
To sum up, CO2 molecules in the atmosphere provide a cooling effect under sunshine
and a slight delay of surface cooling limited to just 18% of the total surface flux at night.
Richard, ‘Radiation Theory’, as you call it, says nothing of the sort. A blackbody, for example, will absorb ALL radiation falling on it. You could say that is the definition of a blackbody. In the infrared region, the surface of the Earth approximates to a blackbody. Its emissivity (and therefore its absorptivity ) is on average over 97%. Therefore the surface will absorb all the ‘back radiation’ from the atmosphere (or 97% of it).
.
Well, apart from contradicting the preceding sentence that this couldn’t happen, this is ‘in principle’ correct. CO2 will revert from its exited state within 10s of milliseconds. In practice, however, it is unlikely to get a chance to do that before it collides with another air molecule. When that happens, its vibrational energy is dissipated as kinetic energy, and the molecule can no longer emit the photon. As a result the parcel of air is warmed. Note that all molecules in a parcel of air will be at the same temperature, oxygen, nitrogen, CO2 etc. The effect of CO2 is to warm the near surface air. This called ‘thermalisation’.
At high altitudes, the air is rarer, collisions are less frequent, and CO2 will radiate to space so cooling the upper atmosphere. BUT, at low altitude, , its effect is to warm the ground.
MikeB, you say;
“”””A blackbody, for example, will absorb ALL radiation falling on it.””””
I think we need this point to be clarified because if that was true the universe would not exist.
Can you please explain the concept of NET radiation between two black bodies at different temperatures. Which bands of absorbed photons actually convert their energy to heat in the target object.
If more photons at any specific band are being emitted than absorbed where is the heating?
If the photons are in the energy band ABOVE peak temperature they will indeed contribute to heating the target object.
“CO2 will revert from its exited state within 10s of milliseconds. In practice, however, it is unlikely to get a chance to do that before it collides with another air molecule. ”
I beg to differ. The alpha for conversion of IR to heat for CO2 is 0.012 or 1.2%, so this is a small conversion and vast majority of the IR energy is re-emitted. The IPCC eggheads dishonestly bumper this up 10-fold to 0.12 or 12% because they had to have CO2 have a greater effect.
Also, it works both ways. CO2 can just as likely pick up adequate excitation from collisions and then emit IR 98.8% of the time. It is much more likely to cool the air than heat it.
Richard111,
Consider one black body at 280 K and another at 300 K. They will be radiating energy at 348.53 and 459.30 W/m^2 in all directions respectively. [1] If they are in a vacuum and nearly touching, the NET flux exchanged between them will be 110.77 W/m^2, in the direction of the warmer object to the cooler one. If these two theoretical perfect absorbers/emitters existed in a completely closed system (i.e., no energy transfers in/out) they will eventually reach the same temperature. What temperature depends on the relative mass of each body. If they are exactly the same mass, the final temperature will be 290 K, and each body will have a radiant flux of 401.05 W/m^2. Regardless of the final temperature, the net flux exchanged between them at equilibrium will be 0, by definition.
All photons at all frequencies transfer energy to the body which absorbs them. The key word there is absorbed. Energy must be conserved, 1st law of thermodynamics.
——————
[1] Stefan-Boltzmann relationship. Radiated power, j* = εσT^4 where:
ε = emissivity (no unit) which for perfect black bodies is 1, and 0 for a perfect reflector
σ = the Stefan-Boltzmann constant, 5.6704×10^-08 W/(m^2 K^4)
T = temperature in K
Thanks Brandon
And there is also an implicit assumption that the crystal structure of each object is either identical or doesn’t change with temperature across that range. There are several was to store energy without changing the temperature….
Is there any physical structure that when reversibly heated (without combustion), releases energy as the crystal structure changes on the way up? When very cold water ice is heated it goes through 6 different crystal structures before melting. Does this rearrangement always absorb energy?
Crispin in Waterloo,
Sure. However, when talking about perfect black bodies, we are dealing with a perfect theoretical construct which does not exist in nature for the express purpose of learning our way around the radiative transfer relationships. The next wrinkle usually added is constant emissivity (and/or transparency, reflectivity) across all wavelengths, giving a so-called grey body.
I’m pretty sure the answer is “yes”, and I’ll go one further and say that heating is likely not a strict requirement. By definition, such a rearrangement would be exothermic — a lowering of total potential energy always increases the entropy of the surroundings, yes? A phase transition from liquid to solid is just such an example … I see no reason why a “spontaneous” rearrangement of a crystalline structure within an already solid mass would be any different.
I count 3 at standard pressure, in order of lowest to highest temperature: XI, Ic and finally Ih. The approximate transition temperatures are easy to remember -200 and -100 °C respectively. Again, I would think that a temperature change is not a strict requirement for a crystal structure change, it’s entirely conceivable that the molecular kinetic vibration alone could jostle things into a different lattice structure given enough time.
Much would likely depend on how the ice was formed to begin with.
Try this thought experiment: freeze a small quantity of water at ~250 MPa and -196 °C. The result should be mostly ice IX (not to be confused with the fictional stuff of Cat’s Cradle fame). Reduce pressure to 100 kPa (1 standard atmosphere) while holding temperature constant. Let it sit for a time in a liquid nitrogen bath.
I’m guessing what didn’t rearrange to XI and Ic during the pressure transition would spontaneously go there given enough time because those crystalline structures represent the lowest total potential energy state for water at that temperature and pressure. That process would release energy into surrounding water molecules and ultimately the nitrogen. How long that would take … no idea. I’m thinking too long to be an appreciable energy release, but it definitely would be an exothermic process.
Interesting questions and fun to answer; however, be more than usually dubious of their veracity — the main substance of my answer comes from doing a bunch of synthesis from really basic first principles of physics and chemistry combined with staring at this phase diagram until I went cross-eyed:
http://upload.wikimedia.org/wikipedia/commons/thumb/0/08/Phase_diagram_of_water.svg/1088px-Phase_diagram_of_water.svg.png
Hey, that phase diagram looks familiar Mr. Gates.
I would be flattered if you got it from the time I posted it a few weeks ago, while I was trying to talk some sense into some guy who thinks water vapor is a myth.
Boy, glad he is not a regular here.
lol, water vapour is a myth? That’s a new one. Sorry to say old bean, teh Goggle coughed up that diagram for me.
Menicholas,
Looks like your comment flew right over his head.
I’m very familiar with the triple point of water and other elements. They are used in metrology as a primary standard in calibration. Your diagram brought back lots of memories of my working career.
The things some ‘climatologists’ try to pass off as science are risable. It appears that most of them have very little understanding of either metrology or statistics (which I’m weak on. But I know calibration).
Brandon Gates
Menicholas wrote saying in full
and you replied saying in full
It does not matter where you say you copied it from. The fact is that you copied it without providing a citation, a reference, and/or a link.
This is consistent with your usual practice of copying&pasting to WUWT long screeds of information you don’t understand. However, we now know you find the information by using google.
Richard
Richard,
good question, I think the “energy balance” is far more complicated than in the models without including clouds and aerosols to the mix.
Behold, the truth…
Richard111, I tried explaining the 2nd Law of Thermo to these people a while back.
Most prefer to believe that, in a room with everything at the same temperature, one suddenly brought together two blocks, they would warm each other up.
VikingExplorer,
Behold … the confusion.
The energy, E, of a photon is always = hc/λ
h = 6.626×10^-34 j·s (Planck’s constant)
c = 2.998×10^8 m/s (speed of light in a vacuum)
λ = wavelength of the photon in m
The quantity hc = 1.99 x 10^-25 j·m is a good one to keep handy, as is 1 m = 10^6 μm. Thus a photon with a wavelength of 15 μm carries energy:
E = 1.99 x 10^-25 j·m / 15 μm * 10^6 μm/m = 1.32 x 10^-20 j
Always. The universe does not keep track of the temperature of the body which emits a 15 μm photon. The body which emits such a photon loses 1.32 x 10^-20 j of energy, and a body which absorbs that same photon gains 1.32 x 10^-20 j of energy regardless of the relative difference in temperatures of the two bodies.
ALWAYS.
The universe doesn’t have to, because the key word missing from your text above is the word IF. I have inserted it for you. I identified what Richard111 said was the truth because it matches what I learned from my science degree (BSEE), where I got an A in electromagnetism. I learned that:
This is why things at the same temperature don’t warm each other up. This is why cold things don’t heat up warm things. I’m unlikely to reply because people who contradict the 2nd Law of Thermodynamics are true science deniers and there is no talking them out of their religion.
VikingExplorer,
Correct.
Wrong. It’s why CO2 gas absorbs photons in the 15 μm band, but O2 and N2 gasses do not.
Don’t I know it. Hauling you outside on a sub-freezing day in nothing but your shorts on for 15 minutes, then dragging your shivering body back inside where it’s “warm” might not even work — even if I told you that “room temperature” air is 10 °C cooler than your normal skin temperature and 16 °C cooler than your normal core temperature.
Wait, so you’re saying that I’ll feel warm when I get inside because of “back radiation” from the air?
It’s because my body has an internal temperature control system that requires energy. Outside, it was under distress, putting everything it could into maintaining core body temperature. That’s what made me shiver and feel cold. When you dragged me back in, the cooling effect was much less (but still there), and so my body was able to calm down and handle the situation.
It’s like having an oven set to 250 F, and A) leave the door open or B) leave it closed. You think (and I can hardly believe it), that situation B is warmer because of back radiation, and not the flame. And then you wildly project that onto inanimate objects without temperature control systems.
Compared to air, CO2 is an excellent conductor of heat. Look it up if you don’t believe me. For those of you in Rio Linda, conductor is kind of the opposite of insulator. More CO2 in the air would mean that heat would be conducted better from the surface to the top of the troposphere. CO2 is helping to cool the surface slightly and warm up the top of the troposphere than it otherwise would be.
In fact, it’s O2 and N that are excellent insulators. That’s why I won’t die of exposure in my house even though the air is 16 °C cooler than my body core temperature. However, if I’m in water of the same temperature, I will eventually die of exposure. That’s why there is such a big difference in air temperature between sun and shade. With enough CO2, shade would provide a lot less relief.
I would suggest taking a course in thermo, but I doubt you have the prerequisites.
Brandon, Richard111 and I say “A delay in cooling is not heating”, but you claim that a delay in cooling is heating. Why don’t you bet your life on it.
Go from a nice comfortable room at 70 F into warm, tropical 85 degree water. We’ll feed you from the boat for weeks. According to you, the increased back radiation from water which is 15 degrees warmer than what you’re used to, will warm you up.
Or not: http://infolific.com/leisure/scuba-diving/warm-water-hypothermia/
Look, guys, I teach physics, including GRADUATE level electrodynamics and quantum mechanics both. It is absolute, pure, unadulterated bullshit to state that an object radiating at some temperature will not absorb any photons below that peak temperature. Indeed, I’m not even sure what that means.

 to a cold reservoir at temperature
  across a vacuum-filled gap (no conduction or convection) separating two facing plates with area
  and emissivity
  is the thermal radiation power emitted by the hot source (the first
  term) less the thermal radiation power emitted by the cold source and absorbed by the hot source (the second
  term). Neither system has any idea what the temperature of the other system is, and its outgoing radiation rate is entirely determined by its internal temperature at the emitting surface.

 is the dynamical equilibrium temperature of the sheet. Rearranging:
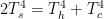

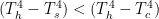

 but the change in temperature of the reservoir is negligible, the change of entropy of the hot reservoir is:


 and
and  as before, but we also have:


 and where the heat capacity of the cold reservoir is infinite and its temperature hence effectively fixed at (nearly) absolute zero (a la 3 K outer space). In this case it is trivial to solve for the equilibrium temperature
  itself in terms of
  in the two cases. If you do it correctly you will discover that in the second case (with an interpolated sheet) the equilibrium hot reservoir temperature is 1.19 times what it is in the first. Basically the temperature of the sheet has to match the temperature the first reservoir had with no sheet in order to transfer energy at rate
  to the cold reservoir at absolute zero in steady state, and the back radiation from the sheet forces the temperature of the hot reservoir up by this fraction in order to lose a net power
  to the sheet at this temperature. If you repeat the second law argument above, you will see that not only is entropy increased in both of these cases, it is increased a lot as the temperature of the cold reservoir is very cold indeed.
I’m not sure I have the energy to go through this in enough detail to sort out your multiple errors. I will hence sum up.
a) The first law requires energy to be balanced. If a system has net energy flowing in in any form whatsoever, its internal energy will increase. Under ordinary circumstances (that is, thermal circumstances as opposed to photosynthesis or solar cells) energy flowing in will increase average kinetic energy and hence temperature. Both Kristian and I pointed this out above.
b) The wavelengths of a microwave oven are order 1 cm. The wavelengths of a uncooked potato radiating at the specific temperature of your kitchen is peaked at around 10 microns — roughly three orders of magnitude smaller. Yet the microwave cooks the potato. I guess somebody forgot to tell it not to absorb any “photons with energy levels below (its) peak temperature”.
c) You aren’t even getting the Stefan-Boltzmann equation right. The correct statement is (and I’m just quoting Wikipedia, which in turn is quoting every physics textbook in the known universe):
In words, the net power radiated from a hot reservoir at temperature
Equilibrium is simply when the energy per unit time lost balances the energy per unit time gained, when the two sources are at the same temperature. The systems don’t “stop radiating” just because they are at the same temperature, that’s silly in the extreme microscopically and doesn’t make any sense macroscopically as well, as if they did the blackbody radiation in the cavity in between the objects would no longer be in equilibrium with its surroundings!
I strongly suggest that you read:
http://en.wikipedia.org/wiki/Black-body_radiation
and get a grip. This entire argument line never does anything but betray the deep, abiding, dragonslayer level of profound willful ignorance of its promoters.
I rarely make ex cathedra pronoucements on this list, but this subject seriously pisses me off, so I will.
The Greenhouse Effect does not violate either the first or the second law of thermodynamics.
Period. Asserting that it does only reveals the fact that the asserters don’t understand either one.
The model above can trivially be used to demonstrate this. Suppose you have the two reservoirs described above, both perfectly insulated on all sides but the single side separated by vacuum facing the other reservoir. We will make the reservoirs finite in size so they have an actual heat capacity, so that as they transfer net energy they cool or warm, respectively, and because the area and emissivity are obviously irrelevant we’ll just make the entire leading constant “1” in units of watts/K^4.
Scenario A) The hot object transfers heat (and it really is heat) to the colder object at the rate indicated above, proportional to the difference in the fourth power of their respective temperatures. As the heat is transferred the rate of transfer slows, as the combined system asymptotically approaches equilibribum with both reservoirs at the same temperature.
Scenario B) We insert a perfectly absorptive, perfectly conductive sheet into the gap between the two reservoirs (so that it doesn’t touch either one). It is thin enough that it has negligible heat capacity compared to either reservoir — think flat black thick cast iron skillet vs flat black aluminum foil. Its temperature can be anything you like as it will almost instantly reach a dynamic equilibrium with its zero heat capacity.
What will that equilibrium look like? Now the net power going into it has to equal the netpower going out of it, as it has no heat capacity. That is:
where
or
which is strictly in between the temperature of the hot and cold reservoirs. Consequently:
or the rate of energy transfer out of the hot reservoir is slowed by the interpolated perfectly absorptive sheet. The rate of transfer to the cold reservoir is similarly slowed, obviously, as the intermediate sheet (still) has no heat capacity relative to the reservoirs.
It takes much longer for the hot and cold reservoirs to reach their mutual equilibrium temperature with the sheet interpolated, because that sheet radiates energy away on both sides relative to its temperature. This means that it returns as much energy to the hot reservoir as “back radiation” as it successfully transfers to the cold reservoir as “forward radiation, in such a way that the net radiation absorbed by the sheet remains at zero, because it has no heat capacity relative to the reservoirs.
Obviously the first law is perfectly happy throughout, because nowhere in this process is energy created or destroyed. The hot reservoir cools. The cold reservoir warms. The sheet in between borrows a tiny fraction of what passes through to remain in dynamical equilibrium. But what about the second law?
The second law has many forms, but the one that is the most useful to us here is the entropy form. What happens to the entropy of the hot reservoir, the cold reservoir, and the intermediate sheet? Entropy in this context is defined by:
That is, the heat transferred at a given temperature divided by that temperature is the entropy change of the object. In case A), over a short time where the heat transferred is
The change of entropy of the cold reservoir is:
The total change of entropy is:
or the net change of entropy of the Universe is positive, as it should be in this irreversible process.
What about case B, which models the greenhouse effect?
for the intermediate sheet! It absorbs as much heat as it loses, so its entropy change is basically zero. When we add them all up we still get:
The sheet in between slows the rate at which entropy increases (because it slows the rate of transfer of heat!) but it doesn’t make the entropy change zero or negative. The second law is as happy as a little clam, unviolated in any way, just as the fact that putting on a jacket to stay warm doesn’t violate the second law either as it slows the rate of transfer of heat from warm to cold.
It is left as an exercise for the somewhat pigheaded studio audience to apply this exact same reasoning in the case where the hot reservoir is actively heated at some fixed rate
So please. No more assertions that back radiation or the Greenhouse Effect violates a law of thermodynamics. It doesn’t. Nor electrodynamics. Nor quantum mechanics. You guys must think that physicists are idiots for this sort of egregious error to be made with nobody noticing for hundreds of years. It is more complex than this simple model, to be sure. It may or may not lead to catastrophic warming — that’s open to doubt. But the concept itself? Sound as a pound, as they say.
rgb
Sigh, mod, in the Stefan-Boltzmann equation in my reply, please change the equal sign between T_h and T_c to a minus sign. Simply typo. And I even (tried to) check everything before posting, but the Monkey doesn’t preview latex…
rgb
[done. .mod]
rgbatduke
Your post at May 7, 2015 at 9:04 am with corrigendum at May 7, 2015 at 9:07 am is truly superb!
More of the same, please.
Richard
VikingExplorer,
No.
Correct. Indoors, the rate of heat loss is reduced to the point that your metabolism can keep pace with it.
The key concept here is net rate of heat loss. Warm-blooded mammalian temperature control is ancillary.
You’re one to talk. Sensible heat transfers follow the 2nd law just as radiative ones do.
No.
85 °F is 29 °C, or ~2 °C cooler than normal mean human skin temperature. Water has 4 times the specific heat capacity of dry air at STP, hence is a better heat sink even at a higher temperature than our normal living spaces. I suspect that what’s going on here physiologically is that our skin is only sensitive to temperature, not rate of heat loss. 29 °C ambient temperature feels warmer than room temperature 21 °C, so skin capillaries don’t constrict and thereby continue to allow warm blood to shed warmth into the more effective heat sink of the water.
No. The key to unravelling this curiosity is:
If you do begin to shiver, exit the water immediately and re-warm. While shivering helps the body rewarm, this works only on land. Shivering in the water only promotes further heat loss. You cannot rewarm in the water.
I know from experience that re-warming in air only works if you can dry off and get out of the wind. I have, on occasion in sailboat capsize situations, jumped back into cold water and remained as still as possible, allowing the water inside my foul weather gear to trap water inside, which then lets the trapped water to equilibrate to my skin temperature. It’s still cold, but not as bad as the cooling which occurs in a 25+ kt breeze when sopping wet, even with polypropylene fleece under waterproof/windproof outer wear. When the urge to shiver goes away — no more than 5 minutes just in case the reason I’m not shivering is because I’m getting critically hypothermic — I haul myself back aboard and continue making the boat ready to sail … straight back to the dock, whereupon I immediately change into dry clothes, drink some warm liquids while practically sitting on the radiator. Then I go back out and put the boat away.
Note that I’m not disagreeing with “You cannot rewarm in the water” here. The difference between on the boat and dry in a tropical dive situation, and on the boat and wet where I go sailing is what’s key. On a cold, very windy day, once I go in the water I end my sailing session as soon as is feasible. I’ve rescued enough hypothermic fellow sailors and windsurfers in deteriorating conditions who obviously don’t know how bad of shape they’re in that it’s my personal discipline to quit once I’ve gone in the drink.
rgbatduke, wow, that was a massive straw man argument. I agree with mostly everything you wrote.
However, the key point is “no conduction or convection”. The 2nd law of Thermo doesn’t apply without a minimum number of molecules, but that number is quite small (like the head of a pin or something). So, creating a condition where 2nd law doesn’t apply and then saying that it isn’t violated seems like a non-sequitur.
Is there a physical phenomena known colloquial as the “green house effect”. Yes, absolutely. However, it’s a transient dynamic effect, not steady state.
Consider the situation where you place a hot object into a freezer and measure the temperature of the object versus time. Convection and conduction are in effect. Then, repeat the experiment but this time in addition to the hot object, you also place a cold object in that is warmer than the freezer, but much colder than the hot object.
Measuring the temperature of the hot object will show that it cools slower. However, it certainly would not increase in temperature. The temperature of the hot object will be higher at time = t, than it was in the first situation. That’s the GHE. It’s a transient phenomena. In either case, the steady state temperature of the hot object will be the same as the freezer.
Conclusion: A delay in cooling is not heating
I think you’re trying to obfuscate the point with lots of irrelevant talk about sailing and shivering. The point is that
1) back radiation from a warmer than normal substance would not, and could not increase body temperature.
2) a human will still die of hypothermia because heat flow is still leaving the body.
3) Water has a higher thermal conductivity than air, which means that it pulls heat out faster, cooling the body, even though the delta T is less. Similarly, CO2 has a higher thermal conductivity than air (O2 and N). Therefore, CO2 is helping to pull heat away from the surface.
4) I’m glad you brought up heat capacity. You’re right that the difference in heat capacity between a single human body and all that water means that the ocean will win this battle. The human may succeed in increasing the water temperature by some minuscule unmeasurable amount, while the human body temperature will eventually drop to 85, and thus die. The heat capacity of CO2 is higher than air, but there is so little of it, that it’s effect would be unmeasurable. IOW, the surface would win, it’s temperature would drop a tiny bit, while the CO2 would warm up.
Re-emission is not reflection and can not heat up (steady state) the ground-level air against the actual heat flow without mechanical work
VikingExplorer,
??!
You almost completely disagree with him.
The 2nd law always applies.
Begin your reply to me:
You’re the one who brought up the interesting phenomenon of warm water hypothermia, not me.
I thought I made it clear in my previous post that non-radiative heat transfers are what’s most operative here.
You would do well to focus on net rates of energy transfer.
Yes: W/(m K)
air 0.024
water 0.58
No: W/(m K)
CO2 0.0146
nitrogen 0.024
oxygen 0.024
Explain Venus.
When being out of the water is not an option and hypothermia is becoming an issue, the idea of not shivering or otherwise moving around is to allow the water closest to your skin to warm up. Movement tends to replace that layer with cooler surrounding water. At that point, it’s heat capacity by way advection which is killing you more than the conductive loss.
Wrong again: kJ/(kg K)
Air 1.01
N2 1.04
O2 0.919
CO2 0.844
Water 4.179
The universe does not keep track of whether an incident photon was emitted from some other object or reflected by it. No mechanical work to a body need be done at all to raise its temperature via a purely radiative process. Were it not so, the Sun would not warm the surface and upper oceans in the first place.
Brandon, I stand corrected about thermal conductivity and heat capacity of co2.
thus ‘half’ the energy absorbed from the sun fails to reach
the surface. A cooling effect.
The energy flux from the sun is mostly short wave which CO2 doesn’t absorb. So while some shortwave is absorbed in the atmosphere, most gets to the surface where it is absorbed and the surface heats up. Earth surface also radiates an energy flux, but because it isn’t nearly as hot as the sun, it radiates in a different frequency spectrum, part of which is absorbed by CO2.
The Kiehl -Trenberth cartoon has 341 watts per square metre coming in and 161 being absorbed at the surface.
Averaged every way imaginable, of course.
Here is a picture
Dr Brown
isn’t the earth the sheet between the 2 bodies and not one of the bodies?
Clyde Spencer says: “An examination of the Berkeley Earth project’s global high and low land-temperature data reveals that the low temperatures have been increasing steadily and for a longer period of time than the high temperatures. Furthermore, the lows have increased more than the highs during the 20th century. (See below) This is what is expected for a ‘Greenhouse’ effect, but it may be more than CO2 driving the increase!”
Funny thing is that this is distinctly NOT the case during the ‘modern’ global warming, from the mid to late 70s till today. Then the highs temps have increased more than the low temps. Just look at the attached figure from BEST.
Using the same reasoning, then, we can conclude that it is NOT the ‘GHE’ that’s responsible for this late warming.
Kristian, When you say ‘this late warming’ how late is that? I have been led to believe that there has been no warming of late.
Besides of tentative model calculations nobody knows what actual contribution CO2 is making to the observed warming. In particular IPCC does not know but makes sophisticated and wrong estimates.
 ?dl=0
?dl=0 ?dl=0
?dl=0
With OBSERVED data, correlation can be found between Temperature ans ANY of other parameters such as CO2 atmospheric concentration, sea level rise, or change of the declination of the Earth magnetic field over the past 150 years.
See to this effect the article https://hal.archives-ouvertes.fr/hal-01146608
Carbon emission: a fair estimate of carbon emissions due to fossil fuels and cement production is given by CDIAC (data since 1751) http://cdiac.ornl.gov/trends/emis/meth_reg.html
Currently about 10 Pg C (petagram carbon) are burned every year. Half of it is absorbed by increased biomass and by the oceans (remains diluted of precipitates as solid carbonate), and the other half accumulates in the atmosphere, hence increasing the concentration by about 2.5 ppm.
All other natural carbon transfers are assumed to be in equilibrium, if not every year but over a period that is much shorter than any change of the climate.
Carbon fate. see this document: http://bit.ly/1PopDBk
Where is shown the CO2 that is absorbed by melting ice? Fresh water absorbs CO2 very quickly. All melting glaciers, ice caps and even sea ice absorb CO2.
Quite a complicated approach.
 ?dl=0
?dl=0 ?dl=0
?dl=0
With OBSERVED data, correlation can be found between Temperature and ANY of other parameters such as CO2 atmospheric concentration, sea level rise, or change of the declination of the Earth magnetic field over the past 150 years, each being a potentially relevant parameter. Short term (up to a few decades) oscillations don’t help resolve long term climate change and no actual observation is available for sufficiently long periods.
This is why, besides of tentative model calculations, nobody knows what actual contribution CO2 is making to the observed warming. In particular IPCC does not know nothing more about it but makes sophisticated and wrong estimates.
See to this effect the article https://hal.archives-ouvertes.fr/hal-01146608
Carbon emissions: a fair estimate of carbon emissions due to fossil fuels and cement production is given by CDIAC (data since 1751) http://cdiac.ornl.gov/trends/emis/meth_reg.html
Currently about 10 Pg C (petagram carbon) are burned every year (multiply by 3.67 to get CO2).
Half of it is absorbed by increased biomass and by the oceans (remains diluted of precipitates as solid carbonate), and the other half accumulates in the atmosphere, hence increasing the concentration by about 2.5 ppm.
All other natural carbon transfers are assumed to be in equilibrium, if not every year but over a period that is much shorter than any change of the climate.
Carbon fate. see this document: http://bit.ly/1PopDBk
MikeB @ May 6, 2015 at 2:11 am
If a CO2 molecule emits a photon, its vibrational level, not its kinetic speed reduces, it is now cooler.
If that same CO2 molecule absorbed a photon to FILL THE VACANT position the vibrational level is back up to where is was before. Still no change in the kinetic speed of the CO2 molecule except as would normally occur over the local temperature kinetic distribution curve which is much slower than the emission/absorption rate. I understand atmospheric molecular kinetic speed at 15C is around 400 metres per second. Light moves faster.
If you are claiming that CO2 molecules can absorb photons over a specific band when that band is already fully energised can you explain please.
What will normally happen in the atmosphere is the following:
A CO2 molecule absorbs an IR photon from the surface, is excited from having its energy content boosted, but collides almost instantly with a nitrogen or oxygen molecule, passing its surplus energy on to this one by conduction. In other words, it hardly gets to emit the energy back out at all in the form of a photon to fall back to its former state.
The nitrogen and oxygen molecules (making up the bulk air) thus absorbing this extra energy from the surface will help to maintain the temperature of the atmosphere. The warmed air will become less dense and rise spontaneously to higher levels to automatically keep the temperature gradient in place. In this way, the energy ‘leaks’ upward through the troposphere.
High up in the atmosphere, the air density is much lower, and the CO2 molecule does not collide with other air molecules as often as further down, which means its chance of emitting any surplus energy it might have or acquire in the form of a photon is better. Normally, most of the energy transferred from the surface (or the Sun) to the atmosphere, is ultimately held by nitrogen or oxygen molecules, but since these can’t realese this energy to space in the form of radiation, they have to transfer the surplus energy (by way of collisions) to the IR-active constituents like CO2 (and, more importantly, H2O) in order for them to do the job and rid the atmosphere (and the Earth system) of it. This is easier to accomplish the higher up the column you get.
Yes, a pretty crude description, but sort of the gist.
“Normally, most of the energy transferred from the surface (or the Sun) to the atmosphere, is ultimately held by nitrogen or oxygen molecules, but since these can’t realese this energy to space in the form of radiation, (…)
O2 has 336 spectral lines longer than 30um.
http://spec.jpl.nasa.gov/ftp/pub/catalog/catdir.html
http://spec.jpl.nasa.gov/ftp/pub/catalog/doc/catdoc.pdf
In a gas all the molecules are whizzing around at different speeds and bumping into each other. The temperature of the gas can thought of as the average velocity of the molecules.
http://scienceofdoom.files.wordpress.com/2010/03/molecular-speed.png
Because absorbing or emitting a photon only changes the internal energy state of the molecule and not its kinetic energy (velocity) it is not considered to be hotter or cooler. It just has more energy (I didn’t mean to bicker about heat and energy -George will be proud of me)
In brief, gas molecules in the atmosphere cannot absorb radiation by increasing their kinetic energy. They can only absorb radiation which is at the right frequency to raise their internal energy level from one discrete quantum state to another.
A CO2 molecule for example, has a vibrational mode ‘tuned’ to radiation at 15 microns. It will therefore selectively absorb radiation at this wavelength whilst ignoring other wavelengths which do not coincide with one of its internal energy states.
I don’t understand what you mean by ‘that band is fully energised. Only a small portion of CO2 molecules will be in an exited state at any one time. The time to revert back to ground state is 10s of milliseconds. The mean time between collisions is nanoseconds. After a collision the energy of the molecule is ‘thermalised’, i.e. it appears as increased momentum, kinetic energy. The CO2 molecule is now free to absorb another photon and ‘thermalise’ that energy as well.
MikeB says: “After a collision the energy of the molecule is ‘thermalised’, i.e. it appears as increased momentum, kinetic energy.”
++++
Why is it always assumed that all collisions will be additive thereby increasing kinetic energy.
mKelly
Well, that is not assumed. In fact, because of ‘conservation of momentum’ it is never assumed, just the opposite. But in this case, the vibrational energy of the molecule is not part of its momentum. It is ‘internal energy’ which it is carrying (actually it is vibrating due to being zapped by a photon). And in the special case of
’, the vibrational energy is translated into kinetic energy on collision.
Now explain the process in an atmosphere the mass is 100% co2.
Then explain atmospheric heating with no green house gases at all.
The molecular collision rate of CO2 at sea level is 8 billion collisions per second.
Just think about what that means for an excited CO2 molecule. The CO2 molecule that just absorbed a LW photon is 10,000 times more likely to immediately bump into another atmospheric molecule right after rather than to decay and emit back that photon (as people like to say for some psychologically soothing reason, 50% up and 50% down).
With 10,000 chances of molecular energy exchange occuring rather than photon emission decay, the excited CO2 molecule at sea level is just thermalizing all the N2 and O2 molecules instead.
It is not until the pressure drops at 10 kms height or so, that the photon emission decay starts to become 50% possible versus collisional energy exchange. CO2 cools off the planet at 10 kms rather than heating it at the surface.
In addition, the molecular collision rate of non-GHGs with the very ground surface is also on the order of 7 billion collisions per second. Every N2 molecule at the ground surface is constantly absorbing energy directly from the surface land and water.
And let’s just now dwelve into how many photons are flying all over the place constantly. Your front-yard grass on a metre squared, is emitting 8 billion, billion LW photons every frickin second (including at night). That’s an 8 with 18 zeros behind it. Its an astounding number.
Energy is moving at the quantum level. No climate model is simulating what really happens in the real world of energy flow at the quantum level. Maybe a few simple things can be simulated at the grand scale but photons and molecular energy exchange cannot. As temperatures rises, all these numbers increase exponentially to the fourth power. We have to measure what is really happening because this is just too complex.
MikeB, I don’t understand your graph of molecular speed in relation to a multitude of different molecules.
Not to worry. Have a look at oxygen and carbon atoms in a periodic table and note the number of electrons available in each shell. Note also that all atoms have a specific number of electrons occupying certain electron shells. If there are vacancies in a shell that can be shared with other atoms you will get a very stable molecule like CO2. This molecule has a limited number of electrons, 6 for carbon and 8 for oxygen, giving us a total of 22 electrons. Electron shells appear to have finite limitations on the allowed number of electrons in each shell. The table shows 2, 8, 18, 18 etc. for a range of elements, or 2, 8, 18, 32, 18 etc. for another range. So those 22 electrons will attempt to stay in the first three shells of 2, 8 and 12. Problem is this will be zero K. Not where we are. As electrons absorb energy they can move to a higher shell. They emit energy when they drop to a lower shell. It is this limitation in electrons and available electron shells that give CO2 (and other gas molecules) their specific radiation characteristics. It is the occupation of specific electron shells by numbers of electrons the effect the vibrational state of the CO2 molecule. Thus there are also a limited number of vibration planes the atoms of the CO2 molecule can occupy.
Quite what happens to the vibrational state of the molecule during kinetic collisions I am not sure, but I have read that these collisions effect a translational change on the vibrational level of the CO2 molecule such that the molecule reaches the local air temperature which at low altitude is well above 0C and the molecule will be radiating appropriate to its local temperature obeying black body rules within its limited structure.
To claim that the CO2 molecule will now absorb photons from the surface, increase its vibrational level and pass this energy to a nearby O2 or N2 molecule doesn’t make sense (free energy?) as the CO2 molecule must have emitted a photon to allow it to absorb another photon thus no change in vibrational level.
Also this business of vibration effecting the kinetic collisions, It depends on what plane the collision occurred. Imagine a spinning wheel, hit the hub and not much changes, hit the rim and wow! So not all collisions are capable of effecting energy transfer into or out of the CO2 molecule.
If it is because of “conservation of momentum” as you say but vibration is not part of a CO2 molecule’s momentum then what is being conserved. Mv=Mv. To be additive the vibration would have to be in sync with the strike of a molecule of something else. And that seems highly unlikely 100% of the time.
Accepting that most CO2 molecule electrons are in their ground state at any given time, can anyone say at what temperature the gas volume would have to be for electrons to be excited beyond the first level?
Is this a function of change in the inter-nuclear distance as a result of a change in di-pole moment?
There’s some very interesting technical discussions on here about the paper, but surely the key point is that our knowledge of our climate is still extremely rudimentary.
The notion that we should radically change our economy based on such rudimentary knowledge is quite mad.
Too often perhaps we get dragged into discussing the details (as has happened above) when the basic and irrefutable statement is that we know almost nothing.
“What gets us into trouble is not what we don’t know. It’s what we know for sure that just ain’t so.”
― Mark Twain
The real author of this aphorism is unknown.
It ain’t what you don’t know that gets you in trouble,
It’s what you know that just ain’t so
http://en.wikiquote.org/wiki/Talk:Mark_Twain
Don’t let the fact that false knowledge is dangerous obscure the equally valid truth that ignorance is dangerous too.
If you recently awoke from a 35 year sleep, you would likely be shocked that the earth is still here and thriving, despite a massive increase in population and continued reliance on carbon-based fuel. Hopefully, you would also have learned a thing or two about doomsday prophesy: it’s always false.
Yes, indeed RH.
The Prophets of Doom who have annoyed, perplexed and scared the pants off of various segments of the human populace since time immemorial, have a perfect record. They are batting zero, with not a single run or even a hit in seventeen umptillion at bats.
And there is no sign of any impending improvements in their perfectly dismal record of failure.
The study of this climate chaos will find a chaos of chaos causes of more chaos.
The title “Anthropological Global Warming and its Causes” lacks foundation – it assumes that AGW is an established fact and looks for data to support it.
However, we do not even know how anthropological contributes to total atmospheric CO2.
Total atmospheric CO2 has been increasing steadily at about 2ppm per year. However, anthropogenic CO2 production has increased dramatically over the last 30 years. Why has the 2ppm CO2 increase not increased?
The author seems to imply that we can improve the models and data collection so that they output meaningful results. IMHO this is illusory. It is just not feasible currently to collect enough detailed information. Furthermore, we do not even know what variables need to be included. Even if we did, are we able to solve the fluid dynamics PDE’s?
Sort of like the war on poverty.
War is man kinds best effort towards chaos.
Poverty too has a chaos of causes.
Lots of our tax money thrown into this chaos hole too.
Study not the chaos , study the money trails.
fobdangerclose
May 6, 2015 at 5:28 am
“Sort of like the war on poverty.
War is man kinds best effort towards chaos.”
Well even though it has become fashionable to call everything a war in the USA, it is not really a war. Think about it. Handing out EBT cards is not exactly what one would call warfare.
Other countries do not call their welfare systems a means of warfare. It’s a US-specific abuse of language.
Thinking about it, declaring a War On Global Warming gives WAR-munist a whole new meaning.
Of course, Lester Brown already had the ides.
http://www.worldwatch.org/global-war-global-warming-heats
Clyde,
One essential error in your reasoning:
Burning wood for heating and cooking, plant decay, eating and breathing by bacteria, molds, insects, animals and humans doesn’t add to the CO2 level of the atmosphere. All what happens is releasing CO2 to the atmosphere which was captured out of the same atmosphere a few months to a few decades before by photosynthesis. Neither does forests clearing and regrowth. That is only recycling.
The biosphere at this moment is a net sink for CO2 of ~1 GtC/year, including all the above…
Only if there is a permanent unbalance like burning a forest for agriculture, that adds to human emissions, as the total permanent carbon storage in a forest, including the root system and debris (humus,…) is larger than in crops, even if the latter have faster cycles…
Thus the increase of the human population is mainly a “problem” for the CO2 emissions for the part that they use fossil fuels (including cement manufacturing, ore processing,…) and land use change (forest clearing and transfer towards agriculture).
For the rest, I ‘don’t think that the CO2 increase will have much impact on climate, as the current “pause” with ever increasing CO2 levels shows…
All what happens is releasing CO2 to the atmosphere which was captured out of the same atmosphere a few months to a few decades before by photosynthesis. Neither does forests clearing and regrowth. That is only recycling.
===============
burning fossil fuel fuel is also recycling of CO2 previously captured from the atmosphere and oceans. The heating of limestone to produce cement is similarly recycling of CO2 captured from the oceans.
As 2 satellites have now confirmed, the human contribution to CO2 is minuscule as compared to the release of CO2 by the tropical oceans. Far from being a source of CO2, the industrialized countries of the earth are net sinks of carbon, as their forests regrow, free from the pressure of burning for heat and energy.
ferd,
Burning fossil fuels does increase CO2 levels in the atmosphere today, burning wood or eating does not.
Further, tropical oceans do release a lot of CO2, but polar oceans do sink a lot of CO2. The net effect is about 40 GtC/year into the atmosphere, 43 GtC/year out of the atmosphere: more sink than source. The 40 GtC/year comes back via the deep oceans, some 1000 years later…
The OCO-2 satellite needs many more months of data before one can make a balance over a full year…
“Burning wood for heating and cooking, plant decay, eating and breathing by bacteria, molds, insects, animals and humans doesn’t add to the CO2 level of the atmosphere. All what happens is releasing CO2 to the atmosphere which was captured out of the same atmosphere a few months to a few decades before by photosynthesis. Neither does forests clearing and regrowth. That is only recycling.”
I often see this reasoning, but I don’t understand how these shorter term cycles are considered “recycling”, but the longer term cycle of burning fossil fuels is not. How long must CO2 be sequestered before it is no longer just recycling? Where is the line? 10 years, 25, 100, 1,000 years? And how was that line scientifically determined?
There is only a loose definition of time in this case: in general if the use and regrowth is within a few decades, let’s say 50 years, there is little influence on the total CO2 level in the atmosphere.
If the replenishing needs several centuries to many millions of years, it is added to “fossil” fuels.
There are of course some overlaps: if you burn wood from a 500 years old oak tree, that is taken as not contributing, but 500 year old dried peat burning is taken as “fossil fuel”… These cases have little contribution to the total human emissions, which is mostly coal, oil and gas, which are millions of years old.
After giving it some thought, I think I understand what your saying. However, I still have to wonder if within this “short term” cycle anthropogenic sources of CO2 aren’t still adding to the overall increase. I think the article was trying to point out the uncertainty in trying to determine the various contributions.
Mr. Spencer says: “…heat from our profligate use of energy is miniscule.”
++++++
I object as strenuously as possible to the use of word profligate in human use of energy. The word is defined as:
adjective
1.utterly and shamelessly immoral or dissipated; thoroughly dissolute.
2.recklessly prodigal or extravagant.
You are wrong Mr. Spencer human are not profligate in the use of energy.
mkelly,
Al Gore called. He said speak for yourself.
The IPCC states, “The level of scientific understanding of contrail RF [radiative forcing] is considered low, since important uncertainties remain in the determination of global values.
=================
It appears that NASA has found the cause of the warming that Gavin and the IPCC claim must be due to CO2, because they can’t find any other cause:
“NASA scientists have found that cirrus clouds, formed by contrails from aircraft engine exhaust, are capable of increasing average surface temperatures enough to account for a warming trend in the United States that occurred between 1975 and 1994.”
http://earthobservatory.nasa.gov/IOTD/view.php?id=4435
If that is true, I wonder if there was a drop in CONUS temperatures immediately following 9/11? All air traffic was grounded or re-routed for three days afterwards.
This topic was the subject of a 3-31-2011 WUWT article
http://wattsupwiththat.com/2011/03/31/the-planes-the-planes/
My understanding is that increased contrails block incoming solar radiation, making days cooler. After the sun goes down, the contrail cover helps to block outgoing LWIR, making nights a little warmer, keeping in mind that most commercial jet flights occur during the day.
The climate change doctrine is just one of the many tools our establishment is using to execute our modern civilization and eventually reduce the world population.
These people are traitors and ruthless murderers, nothing more nothing less.
http://green-agenda.com and UN Agenda 21
The underlying cause of catastrophic anthropogenic global warming is political will. It is not otherwise evident in the observed data. Non-catastrophic anthropogenic global warming is a concept that is thought to be exposed by observation, but observed climate behavior does not validate the predictions that fall out of the concept.
There is tremendous value to some for continuing to be wrong because the solutions for the dangers identified in the CAGW concept create wealth and power, and if done right, will appear to have turned around or arrested CAGW. It is a beautiful deception. Utterly beautiful.
dp understands the situation.
simple and accurate
I don’t get it. How on Earth is a global circulation model that is programmed to augment one minor factor (CO2) to major status in the climate, while ignoring over 50 major factors that influence climate in the real world, have anything to do with the Scientific Method? These models were programmed and do exactly what they are programmed to do. This is NOT science, particularly when the major assumption is that all natural climate influences and factors have been eliminated by CO2 powerful trace gas effects. Truly junk science at best.
Real science would be to put in all the cyclical aspects of, say, the Sun, let the different frequencies of the cycles interfere with each other, and then compare them with the real, say, sunspot record. When this is done, the results clearly show that the Sun’s overlapping cyclic parameters almost perfectly reflect the ups and downs and the extended minimums of the real record, allowing us to predict the outcome of future cycles with a degree of confidence.
In the case of climate models, they include few factors other than CO2 and its related junk science. Climate models are manipulated egregiously to even get them not to outright cook or freeze the planet. How can any such model be valid, when it does not properly include the massive, global, water cycle, negative feedback engine, cloud cover, and night time energy movement to space? They simply are not valid. This is fantasy.
In the latter case, they included everything they knew of and let it run—they did not know the answer.
It would be nice if a large segment of the population of The US or Western Europe would read this and try to understand it but I don’t think that’s ever going to happen.
Before 1980, the TSI was assumed to be a constant; check this out before they rewrite history (like with the NOAA and temperature record adjustments). Now, 1980 (approximately) was when the Ozone hole was discovered. Interestingly, all Tropospheric Ozone is created by Solar EUV (and UV). Since the TSI was deemed to be a constant, therefore, the Solar EUV, UV were also deemed to be virtually constant. So a cause for the Ozone hole must be anthropological actions.
Fast forward to today. Now we have satellites that measure Solar EUV, UV before it is intercepted by the oxygen in the upper Troposphere and converted to Ozone. 99.5% of all Solar EUV, UV is absorbed by the Ozone layer. In addition, we know that Solar EUV, UV intensity can vary a 100 fold between a Solar maximum and a Solar minimum. Surprisingly, it is very difficult to find a graph of the relationship between Solar EUV, UV intensity and Ozone creation! Form your own opinion.
NASA has a group of individuals that monitor the Solar EUV, UV effects on the upper atmosphere. When extreme Solar EUV events occur, the Stratosphere can expend enough to increase satellite atmospheric drag. The atmospheric expansion is due to Solar EUV, UV being converted to heat near the Ozone layer. Why aren’t the Solar EUV, UV affects included in the atmospheric models? If we use the simple formula PV=nRT, and both V, T increase, then P must have also increased (license used, assuming the Earth/Atmosphere is a closed container). Does Solar EUV, UV affect the atmospheric pressure on the Earth?
So many questions, now that we know the the Sun is not a constant energy output Star, and we can now measure the Solar EUV, UV accurately.
The above statement should to be a candidate for the quote of the week. Consensus alone has nothing to do with science. It is simply an attempt to convince the uninformed that believing in global warming is the “in” thing to do. It’s a powerful appeal because most people want to be part of the in crowd. Signing on to the latest fashion, especially if it allows you to claim that you’re “saving the planet,” is much more important to the ignorant than becoming informed on the science.
Not “reign in” to describe limiting a runaway. Should be “rein in”.
In 2008, whilst sitting on the bank of a small, jungle-clad creek in the remnant crater of a supposedly extinct volcano on Big Tabar Island in Papua New Guinea, I noticed a tiny spring issuing clear water bubbling with carbon dioxide. Since this geologic entity is 9-10 kilometers in diameter, how would you measure the amount of carbon dioxide being vented into the atmosphere within such rugged jungle terrain? Bear in mind that the world is also repleat with so-called ‘extinct’ volcanoes. Then there are dormant volcanoes, active volcanoes and submarine volcanoes … even at the North Pole. Most folk probably don’t appreciate that even the Mauna Loa CO2 recording station in Hawaii sits atop a dormant volcano.
Mauna Loa station indeed is at some distance of the vents of the volcano, but when the wind blows downslope, that is seen in the high variability of the CO2 data. These data are noticed, and “flagged” and not used for averaging. The same when in the afternoon with upwind conditions, air from the valleys is measured, which is slightly depleted in CO2. These data and others like mechanical problems, etc. still are available, but flagged and not used for daily, monthly and yearly averaging.
In fact is a luxury problem: over 8 million samples are taken per year, of which a percentage is rejected, but still more than enough to be sure that the data are from pristine air conditions: trade winds over the oceans.
Moreover, including or excluding the flagged data has no influence on the trend over a year, only the spread is smaller. More information on the selection method for Mauna Loa (and other stations) data:
http://www.esrl.noaa.gov/gmd/ccgg/about/co2_measurements.html
Besides Mauna Loa, some 70 other stations measure CO2 in the best circumstances:
http://www.esrl.noaa.gov/gmd/dv/iadv/
Where to measure gives more information:
http://www.ferdinand-engelbeen.be/klimaat/co2_measurements.html
RE: 1) Compared to the heat supplied by the sun, the waste heat from our profligate use of energy is minuscule. However, it is sufficiently large to be calculable. Notably, it is concentrated in urban and industrial areas and contributes to the Urban Heat Island effect. It has the potential to upwardly bias recorded temperatures and falsely give the impression of greater warming than is actually taking place globally. Weather stations recording temperatures are neither random nor uniform in coverage; they are biased by being located where most people live. After all, who is going to be willing to pay for information in some remote corner of the world where few if any people live?
=======================================
I would further generalize this as work done by human activity, by autonomous and human operated machines, by human built infrastructure and equipment, and, by human created modifications to the Earth’s natural systems.
I wonder if the rural stations that were eliminated starting in the late 1980’s have an effect on the overall average temperatures? If you eliminate only rural stations then only the UHI stations are left as the majority and thus it will show an average rising of highs and lows.
See the surfacestations.org page for photos of weather stations placed in the exhaust side of air conditioners.
The UHI problem can not be corrected, there is no scientific control. That’s why NOAA created an entirely new sensor system called the USCRN. That new network is showing zero warming since it was established. There are very few scientifically reliable surface temperature stations scattered around the world. Those stations show zero long term warming. The only reliable “global” temps are the satellites. Those data since 1979 show no significant warming trend.
On the whole, that is a good essay!
!
Hydrogen-containing polar molecules like ethanol, ammonia, and water have powerful, intermolecular hydrogen bonds when in their liquid phase. These bonds provide another place where heat may be stored as potential energy of vibration, even at comparatively low temperatures. Hydrogen bonds account for the fact that liquid water stores nearly the theoretical limit of 3 R per mole of atoms, even at relatively low temperatures (i.e. near the freezing point of water).
http://upload.wikimedia.org/math/4/4/c/44c04ca979f0e0808cde7a39e0595489.png
http://en.wikipedia.org/wiki/Heat_capacity
“4) High-energy charged particles from coronal mass ejections spiral in at the magnetic poles. As they enter the upper atmosphere they produce the well-known auroras. However, the auroras are a result of ionization of the air and, consequently, heat is produced. Could the wandering of the poles over decades result in changes in the jet streams and then changes in weather at mid-latitudes?”
Solar forcing of the Arctic and North Atlantic Oscillations and hence the Jet Steam behavior occurs at the scale of changes in weather types. I can verify that with many hundreds of years of hindcasts of what is driving the solar variations at such scales.
Variability in coronal holes is larger factor than CME’s, and as well as Joule heating of the upper polar atmosphere, nitric oxide production from fast solar wind results in ozone destruction.
Note the lack of Aurora sightings in the colder run of years in the Dalton Minimum, 1807-1817:
http://www.leif.org/EOS/92RG01571-Aurorae.pdf
My long range solar based AO/NAO forecast for the UK region is in comments here:
http://blog.metoffice.gov.uk/2015/04/13/more-warm-weather-this-week-but-whats-in-store-for-the-summer/#comments
In the insolation input diagram shown below it can be seen that about 26% of insolation is directly reflected back into space by the atmosphere but 19% is absorbed within it as thermal energy with much of the UV radiation being absorbed within the stratospheric ozone layer. Clouds reflect 20% and absorb 3%, atmospheric gases and particles reflect 6% and absorb 16%.
http://www.pilotfriend.com/training/flight_training/met/images2/14.gif
An adiabatic temperature change occurs in a vertically displaced parcel of air due to the change in pressure and volume occurring during a short time period, with little or no heat exchange with the environment. Upward displacement and consequent expansion causes cooling, downward displacement and subsequent compression causes warming. In the troposphere the change in temperature associated with the vertical displacement of a parcel of dry ( i.e. not saturated ) air is very close to 3 °C per 1000 feet, or 9.8 °C / km, of vertical motion; this is known as the dry adiabatic lapse rate [DALR]. As ascending moist air expands and cools in the adiabatic process the excess water vapour condenses after reaching dewpoint and the latent heat of condensation is released into the parcel of air as sensible heat thus slowing the pressure induced cooling process. This condensation process continues whilst the parcel of air continues to ascend and expand. The process is reversed as an evaporation process in descent and compression. The adiabatic lapse rate for saturated air, the saturated adiabatic lapse rate [SALR], is dependent on the amount of moisture content which in itself is dependent on temperature and pressure. The chart below shows the SALR at pressures of 500 and 1000 mb and temperatures between –40 °C and +40 °C.
http://www.pilotfriend.com/training/flight_training/met/images2/18.gif
The chart shows that on a warm day the SALR near sea level is about 1.2 °C / 1000 feet while at about 18 000 feet, the 500 mb level, the rate doubles to about 2.4 °C / 1000 feet.
The environment lapse rate [ELR] is ascertained by measuring the actual vertical distribution of temperature at that time and place.
http://www.pilotfriend.com/training/flight_training/met/hm_temp.htm
Thanks, Clyde Spencer. Interesting summary.
Clyde – just exactly what makes you think that carbon dioxide is warming up the world? Is it the decades-long propaganda from the IPCC and their likes? Or the pseudo-scientific claims about CO2 that are found everywhere these days? You spend half of this paper trying to summarize the sources of CO2 that are anthropogenic when that is not even the cause of global warming. Lets do some science about it. The Keeling curve tells us how much carbon dioxide is in the air. It is accurate enough to reveal the changes in atmospheric CO2 caused by annual growth and shedding of leaves in the northern hemisphere. This is enough to allow us to calculate that the average lifetime of a carbon dioxide molecule in the atmosphere is of the order of ten years. Similar results can be obtained from observations of carbon-14 decay that was produced by atmospheric testing in the fifties. Compare that to claims by IPCC of centuries to millennia of atmospheric retention of CO2. The observable amplitude of Keeling curve’s yearly wiggle tells us that major changes of atmospheric carbon dioxide should be easily visible. But it turns out that the Keeling curve does not show any of the known sudden changes in global warming/cooling rate. This means that either carbon dioxide is not doing any warming or the amount of warming involved is too small to be noticeable. It can be demonstrated that the former is the case. Let us take the beginning of the Hiatus/Pause as our starting point. Demonstrably it had a sudden start. Global temperature had been flat in the eighties and nineties when suddenly two things happened. First, the super El Nino of 1998 appeared out of nowhere and gave us a big warm spike. No sign of this in the Keeling curve. It was followed immediately by the step warming of 1999. In three years it raised global temperature by a third of a degree Celsius and then stopped. A third of a degree rise is not a small amount if you consider that the total temperature increase within the last century was only 0.8 degrees (according to Hansen). Since the 1999 warming also was 0.3 degrees Celsius, creating that temperature with carbon dioxide should have used up almost the same amount of CO2 as was needed to produce the entire Keeling curve. No way can carbon dioxide be the cause of this step warming. Keeling is not the only factor that denies global warming talent to CO2. The mere existence of the Hiatus/Pause today proves that carbon dioxide does not and cannot warm the world. Its existence invalidates the Arrhenius greenhouse theory used by IPCC to push their pseudo-science of global warming. Clearly, global warming by carbon dioxide is an oxymoron, a total fallacy. Yet it is still being drilled into us by the full propaganda machinery of the global warming enterprise. Fantastic amounts of money have been wasted and economic destruction has been done in the name of saving us from this non-existent warming. More is going to be demanded at the UN Paris conference and COP21 set up this fall. The whole enterprise is criminal and deserves to be shut down forthwith. That alone will not undo the damage already accomplished. It is also necessary to cancel out the manifold laws and regulations that have been established in the name of saving the world. And the apparatus supporting the false science that allowed this to happen must be dismantled as well.
100%.
While the GCMs look to many like working hypotheses that’s not what they are. A working hypothesis makes predictions of the outcomes of events. A GCM makes projections; there are no events.
One cannot build a histogram from the data generated by a GCM for the height of each bar of a histogram is the count of observed events that is called a “frequency.” There are no relative frequencies; consequently, the theoretical counterpart of a relative frequency – a probability – does not exist. Truth and falsity of claims made by a model correspond to probability values of 0 and 1 but they do not exist for a GCM. Thus the claims that are made by a GCM are not falsifiable. A working hypothesis is falsifiable.
‘If I were to buy a
high-performance car, based on computer simulations of similar veracity, I’d ask for my money back.’
____
there’s exponential differences technic ‘models’ / climate ‘models’:
e.g. static calculations in technics is foremost Triangle Element Formulation for Static Analysis of Solids tested, standardised and real time practiced since up to 100 ys.
Whereas in climatologie ‘materials’ as vectors, influences etc. are until today heavily debated controvers by experts.
settled Climate science – but neither in real time nor in prediction.
____
Just to remind – Hans
Three geophysical aspects seem to be insufficiently appreciated throughout
this thread:
1. While radiation is the only ticket to space for thermal energy, careful
experiments throughout the globe show a Bowen ratio typically less than one
in all but the driest regions. Contrary to the over-idealized academic view
of the GHE, moist convection–not “trapping” of terrestrial radiation by
GHGs–is usually the principal mode of heat transfer between the surface
and the atmosphere. Without such more-direct heating of the bulk
constituents, the atmosphere would not achieve the observed temperatures
that it does, molecular collisions with trace GHGs notwithstanding.
2. Once the bulk constituents are heated, the “inert” atmosphere radiates
isotropically, not just bidirectionally, with a “brightness temperature”
that can be measured. The deep gaps in the terrestrial spectra seen at TOA
are the result of scattering of thermal energy by GHGs out of the distinct
“lines” into a broad (Planck) continuum. There is no single “emission
layer” that can adequately model these planetary emission spectra. Nor can
the Earth’s surface, which includes evaporating oceans, be legitimately
treated as planetary boundary via misapplication of the S-B law.
3. What we know of “global” daily temperature extremes comes from
land-surface stations that are overwhelmingly urban. BEST’s treatment of
such data is by far the most egregious in spreading the UHI bias around the
globe. Such manufactured “global” indices cannot be relied upon to represent geophysical reality.
How can anyone claim that GCM’s are a part of the Scientific Method? GCM projections cannot be validated until many years into the future have passed.
Clyde: Terrific article. I especially appreciate the analysis of population drivers. Sadly, discussion of the countless benefits to be had by reigning in the population explosion has been suppressed, treated as verboten and “Politically Incorrect” by most of the political spectrum, including left and self-delusional right, vote-breeding Democrats and self-delusional Republicans, Christians, Catholics, Muslims, Mormons, self-serving Commerce Uber Alles types, delusional neo-“Libertarians”, fanatical optimists and delusional Simonists, multiculturalists and haters of American culture, New World Orderers, racists, reverse-racists, etc. Not to mention ordinary people with a natural urge to have a lot of kids, a willingness to continue a system that makes other people pay too large a share of the direct costs of having and rearing them, and a myopic ignorance of the externalities. All have their instincts or motives.
This was made all too easy by the self-discrediting, tyrannical instincts of the “population control” crowd. The tragedy is that population need not be controlled through coercion and force to halt the explosion and return to more pleasant, beneficial population densities. We need only reduce the subsidizing of reproduction in reasonable ways, and let people be responsible for some portion of their own reproductive choices. There are numerous ways to do that without ordering people around, ChiCom style. Also, to the extent free market capitalism and opportunity with responsibility prevail, breeding tends to voluntarily moderate to responsible levels, even despite government breeding incentives.