From the University of New South Wales and ‘models versus reality‘ department comes this claim from alarmist Matthew England, whose “say anything” track record isn’t at all impressive, and looks to be an obsession with “being right” rather than doing careful science, for example:
And so anybody out there lying that the IPCC projections are overstatements or that the observations haven’t kept pace with the projections is completely offline with this. The analysis is very clear that the IPCC projections are coming true.
On the plus side, at least he acknowledges the existence of “the pause” now, but says it’s irrelevant. Whatever.

Or, with the surface temperature record and the satellite record, if you prefer:
![CMIP5-90-models-global-Tsfc-vs-obs[1]](https://wattsupwiththat.files.wordpress.com/2013/10/cmip5-90-models-global-tsfc-vs-obs1.jpg?resize=720%2C648) Here is the press release:
Here is the press release:
Heat still on despite warming slowdown
Hiatus in global average temperatures has little effect on projected temperatures in 2100
The recent slowdown in the rise of global average air temperatures will make no difference to how much the planet will warm by 2100, a new study has found.
The peer-reviewed study, published today in Nature Climate Change, compared climate models that capture the current slowdown in warming to those that do not. The study found that long-term warming projections were effectively unchanged across the two groups of models.
“This shows that the slowdown in global warming has no bearing on long-term projections – it is simply due to decadal variability. Greenhouse gases will eventually overwhelm this natural fluctuation,” said lead author and Chief Investigator with the ARC Centre of Excellence for Climate System Science, Prof Matthew England.
To separate the long-term temperature outcomes from short-term variability the researchers took 200 climate simulations and re-evaluated them out to 2100 by comparing those that captured the current slowdown to those that did not.
The models were analyzed using one of two IPCC carbon emission projections.
The first was a scenario where greenhouse gas concentrations continue to rise unabated through the 21st Century. The second assumes emissions are reduced to address global warming, peaking by 2040 before declining sharply.
Under the high emissions scenario, the difference in average projected end-of-century warming between the two groups of models is less than 0.1°C; a tiny fraction of the projected 5°C global warming if emissions are not curbed.
Warming of this magnitude is well beyond the 2°C threshold that is considered a target by the Australian Government and a safe limit by the IPCC.
In the past, certain lobby groups have tried to argue that the recent slowdown in the rise of global average temperatures is a reason to abandon international and national efforts to curb carbon emissions.
This study shows the slowdown merely reflects short-term variability. Long-term global warming is still set to reach dangerous levels unless carbon emissions are reduced dramatically in the coming decades.
“Our research shows that while there may be short-term fluctuations in global average temperatures, long-term warming of the planet is an inevitable consequence of increasing greenhouse gas concentrations,” Prof England said.
“This much hyped global warming slowdown is just a distraction to the task at hand”.
###
Note: as is typical with these jokers, they don’t bother to give the name of the paper in the press release, so I looked it up. The short abstract reads more like an opinion than science, especially since that favorite buzzword “robust” can’t possibly apply to any future prediction, be it climate 85 years from now, tomorrow’s weather forecast, or the stock market.
Robust warming projections despite the recent hiatus
- doi:10.1038/nclimate2575
- Published online23 April 2015
The hiatus in warming has led to questions about the reliability of long-term projections, yet here we show they are statistically unchanged when considering only ensemble members that capture the recent hiatus. This demonstrates the robust nature of twenty-first century warming projections.

“This shows that the slowdown in global warming has no bearing on long-term projections – it is simply due to decadal variability. ”
Hmmm… so it doesn’t matter how big the error in each time step of an iterative model of a chaotic system is, we’ll reach the same state after the same time anyway?
It’s time that mathematicians around the world distance themselves from all climate-scientific modeling lest their reputation will suffer the same fate as the warmunists’.
If this guy is correct, then CO2 based AGW has counter-acted what would have been a devastating, and ongoing, multi-decadal cold period. Far from being catastrophic, AGW has saved us from decades of frigid temperatures, famine, disease and death. The hardest hit would have been the poor, who wouldn’t have been able to pay for heat and food. You’re welcome.
It almost makes one wish the AGW scenario was real.
Yep. Gotta be one or the other.
“This shows that the slowdown in global warming has no bearing on long-term projections – it is simply due to decadal variability. ”
==========
then why are they called “projections” not “predictions”. In science a prediction is used to test valicity of the science. A projection is simply a line drawn outside of the region with data.
A more accurate statement is:
“This shows that the long-term projections have no bearing on global warming”
Because predictions, and with it the predictive power of a theory, permit things to be falsified. Projections have no such restraint and are the domain of psychic hotlines and pseudoscience.
It has no bearing on long term projections because they have not adjusted the models to consider reality. That being the case, of course there is no change in the projections. Duh!
If you do the same wrong thing, expect the same wrong result.
If you predict the unaltered models will be validated by reality, you will be wrong again, just like last time.
Come back in 100 years time Crispin and I’m sure the data will have been suitably adjusted
Or rather, that global warming (or otherwise) has no bearing on the long-term projections
It would have been useful if they had analysed what the models contained that resulted in them predicting the plateau and if those elements were constant across the ensemble. Without that one might think it was just one more set of random coincidences.
No, us math (statistics) people are trying to point out to the “climate scientists” where they’re going wrong. But they respond by plugging their ears with their fingers and sing “na na na na na.” It’s frustrating. And sad, really.
“Greenhouse gases will eventually overwhelm this natural fluctuation,”
I thought that greenhouses gases are PART of the whole picture, and therefore part of the natural fluctuation! ??
“Greenhouse gases will eventually overwhelm this natural fluctuation,”
==========
didn’t the IPCC previously claim the natural fluctuations were insignificant?
Yes, ferd. But also, the IPCC 2012, Special Report on Managing the Risks of Extreme Events and Disasters to Advance Climate Change Adaptation (SREX). Summary for Policymakers. (drafted 18 November 2011, published 29 March 2012)
Part D. Future Climate Extremes, Impacts, and Disaster Losses
“Projected changes in climate extremes under different emissions scenarios generally do not strongly diverge in the coming two to three decades, but these signals are relatively small compared to natural climate variability over this time frame. Even the sign of projected changes in some climate extremes over this time frame is uncertain.”
From IPCC SREX Summary for Policymakers (29 March 2012, pg. 9)
http://ipcc-wg2.gov/SREX/report/
They have covered all the bases!
CO2 does everything…
ah yes, your CO2 may do ‘everything’ but have you seen the new version of CO2 the russians developed-
CO2 – Anthropogenic Super Stealth molecule.
this new ‘super’ molecule can do everything the earlier CO2 molecule could do, namely absorb IR radiation, but so much more. the new properties developed over many years by hard working statisticians include-
# The ability to absorb radiation by stealth. you wont see it absorb, it will look exactly as it looked before due to the new Super Stealth shell TM that can be turned on and off by the command of climate statisticians everywhere (just not at the same time). control can be purchased from our online store for 10 Million carbon credits per hour.
# Not only wont you see the absorption, the new molecule can temporarily bend space time and warp itself into the deep oceans, where the shell can be removed and warming occur. note: may have the reverse effect in the north atlantic and pacific ocean due to the shell polarity being set to southern oceans only. reversal of the polarity can be purchased at our online store for 10 Billion carbon credits.
these new features will puzzle your worst enemies for years as they try to work out why their models dont match reality.
“Every age has its peculiar folly; some scheme, project, or phantasy into which it plunges, spurred on either by the love of gain, the necessity of excitement, or the mere force of imitation. Failing in these, it has some madness, to which it is goaded by political or religious causes, or both combined.”
Charles Mackay 1841 Popular Delusions and the Madness of Crowds.
But this one, unchecked, is going to bankrupt us and our children’s future….after all this has nothing to do with the climate, just the destruction of capitalism.
“At a news conference last week in Brussels, Christiana Figueres, executive secretary of U.N.’s Framework Convention on Climate Change, admitted that the goal of environmental activists is not to save the world from ecological calamity but to destroy capitalism.”
http://news.investors.com/ibd-editorials/021015-738779-climate-change-scare-tool-to-destroy capitalism.htm#ixzz3UqA7aWRx
Well at least some of the fringe alarmists are happy to reveal their true motives.
For some of these guys destroying capitalism wouldn’t be enough – they actually want to; “kill the economy”. Whatever that would mean.
In what manner would we exchange goods and services?
I don’t really quite understand what they are talking about.
I’m not sure that they do either.
http://guymcpherson.com/2012/12/kill-the-economy/
really? you think that quoting from a book is evidence? “every age” – a universal claim that you’re viewing as some prediction of future events. LOL.
Yes, you may be on to something. There is tons of evidence that the concepts of basic human nature are mythical.
Like economic bubbles. No connection between tulip bulbs selling for ten years salary, and tomato pickers buying three five bedroom homes with no money down.
Cecil, the Charles Mackay quote was not offered as evidence but as a conclusion from the evidence. It shows us that reason has prevailed over deception and delusion in the past (usually by way of the wrecking ball of reality) and is likely to do so again. If you doubt the universal claim that every age has its peculiar folly, start reading history. I thank indefatigablefrog for the reminder that our own age is not uniquely delusional and mad. I find that very comforting.
RalphB, I don’t think that “reading” history is either a necessary or sufficient condition to (1) doubt any universal claim (2) question the induction (not in a radical Humean sense) from “it has happened before” to “it’s happening now” . But I’m glad that you find it comforting. I’m sure that people find belief in God comforting too.
Cecil; (1) You can doubt anything you like, but that does not prove that there are no universal truths — what would serve as proof in this case is your counterexample of an age without its follies. Of course “reading” history (or learning it via some other medium?) would be a necessary condition of finding such a counterexample. I’m waiting. (2) Hume is hardly a reliable guide to the validity of inductive inference given his total failure to understand that causality exists as inescapably as identity and that without it science is indistinguishable from numerology or some other form of magical thinking. (3) It is no argument against being comforted by the truth that others may be comforted by their delusions, but if that argument is comforting to you, I wish you a peaceful sleep of reason.
reading – as distinct from understanding. the former you obviously do, the latter questionably not. your interpretation of Charles Mackay’s quote can’t be disproved. it’s neither true nor false but meaningless. thanks for the one sentence guide to Hume. not illuminating or useful considering that I said that I was NOT questioning it in the way that Hume did. However he’s of course correct that there is no way to prove induction. But that shouldn’t worry us, because God looks after ensuring that induction keeps on working, doesn’t he? 😉
Cecil, if your point is that just because every previous age has had its folly that need not necessitate every future age will also, I have to concur, but that’s still the way to bet. Since I am not a determinist with respect to the actions of rational beings I cannot rule out that human nature in the aggregate is open to changing as well.
Sorry I misinterpreted the thrust of your Hume reference, I figured you were claiming that, as Hume insisted, the accumulation of cases would not prove the universal rule, so therefore induction could not establish truths. My too brief rejoinder was intended to suggest that there is more to induction than the accumulation of cases. Since you do, however, agree with Hume that there is no way to prove induction then perhaps we disagree about what should count as proof.
What counts as inductive proof is the identification of a causal connection between events, something that may be suggested by the accumulation of cases but is established by observations or experiments that isolate the factors involved — a process that must be adapted to the circumstances and subject under consideration.
In the case of historical generalizations (“universal claims”) there will be no controlled experiments but there may be plentiful enough similarities (along with few enough differences) among a multitude of historical events and cases that observation alone serves to isolate causal factors. Aristotle collected and studied the constitutions and histories of 158 states before reaching the generalizations he makes about political order and human happiness that you will find in his Politics. (We have one surviving piece of the study in his Constitution of Athens.) If nothing could be proven by such methods we would would not still read and learn from Aristotle. But we do.
In the case of Mackay’s generalization, I have to assume he was familiar with both human reason and human irrationality as behavioral causes and was wise enough to discern the difference in behavioral consequences. He would observe that particular persons might be rational always or for the most part, but in the aggregate he would never observe masses of persons being rational always or for the most part, I’m sure we can all see why the laws of statistics support the inductive generalization and why predictions of the future based on such reliable data are quite “robust” as they say — even without God’s help. Perhaps we agree on some of these issues but not others. :^)
Well, I wouldn’t like to say that this was bound to be true in the long run.
I mean, who would rely on a single glib quote as a guide to the future of mankind?
And after all, let’s remember that, “in the long run we are all dead.” J M Keynes.
🙂
‘eventually’ is a rather long time…..
“eventually” is also a short time. And a medium time. In other words, meaningless in this context.
Heh.
And this, along the same lines: “Our research shows that while there may be short-term fluctuations … .
Aaaaaaaaaand………….. maybe not. lolololol
Janice, what do you think a long term fluctuation would be like, on that scale?
🙂
Hi, Crispin,
I think they MIGHT happen.
#(:))
Since when is examining the results of failed models counted as “research”?
Janice,
It’s all in the nuance!
It’s not a short time if you know it will never happen…..and you’re right, it’s meaningless.
Excellent! This shows that all the climate models are the same, so we can forget about picking the “best” ones based on how well they match the pause (e.g., the Russian model).
If you look at his diagram you see the values “19/90” and “19/108” in the upper left hand corner. What does this mean? Did he limit the number of models? Clearly, his data does not match the data in the other two charts.
Einstein used to say a single observation could prove him wrong, but no number of observations could prove him right.
Warmists say it doesn’t matter how many times their models are disproved, as long as they can come up with new models that aren’t disproved yet then we all have to assume they’ve been proven right.
Hey, that’s what made Vegas rich.
There’s always someone with dollars and a system.
They have it on record saying that they are right because they couldn’t think of what else it could be.
The models are right even when they are wrong. Quite the claim.
Someone needs to send him a copy of Meehl et al., 2014. This wonderful peer-reviewed paper trumpeted the fact that even with hindcasting, nine out 262 projections accurately reflected the pause as of 2014 and six to 2015. This results in more than 97% of the models being wrong. Great odds.
https://e-nautia.com/clubargon/disk/Partage/Hiatus/Nature%20Climate%20change%20sept%202014.pdf
So what year does the pause have to run for the number to decline to zero? I want to mark my calendar.
Ya reckon Mathew England perhaps missed the Meehl et al., 2014 paper?
That would be curious in itself given that Gerald A. Meehl was a co-author of Mathew England’s wind-driven circulation in the Pacific paper.
And Mathew England’s “wind-driven circulation in the Pacific” paper was cited by Gerald A. Meehl et al in your above Link.
Whatsupwiththat?
Whatsupwiththat?
Simple. More than 97% of the model projections being wrong by climate scientists own admission even with hindcasting and more becoming wrong as “the pause” continues. But ignore that because England claims “that the observations haven’t kept pace with the projections is completely offline with this. The analysis is very clear that the IPCC projections are coming true.”
Gotta love climate scientists ability to disassociate from facts they don’t like.
Anthony–
O/T but is anyone else hitting 20-second delays on attempting to get to this site? I’m not getting delays on other sites.
no delays I’m seeing on either network I use.
Lance, I often experience a several second delay here, it is due (I think) to the number of video/photo advertisements (or in the thread). It takes longer for them to “materialize.” WUWT is not unique for me, however. Any site with a lot of ads does that for me. Some days are worse than others, though, here. Type of video/image likely is the cause. Try getting the “Test” thread to materialize! THAT takes “forever!” Well, any delay is well worth it, huh?
#(:))
“boy, it was kind of creepy, though, seeing MY location”
I’m logged in through a VPN for work, and it showed my location as the San Francisco even though I’m in Phoenix . I still got a download speed of 73.62 for comparison.
Well, good for you, Mr. Makarevich. Happy for you that the ol’ workplace supplies fast download bps. And….. I’m in………. uh……… Nome! ….. yeah…… that’s the ticket… 😉 Now, go ahead and “bombs away” at my server (thanks for the clue and the other information, Mr. Clark).
Lance, do a speedtest:
http://www.speedtest.net
I realize this was directed at Lance, but I TOOK IT!
#(:))
Download: 60.03
(just for a comparison for you, Lance)
Upload: fugeddaboudit, lololol (not a priority for me)
Thanks, Ghost!
(boy, it was kind of creepy, though, seeing MY location (I never even told them!!!!) in a little light, flashing on the screen like I was a target for a satellite-launched missile)
Useful …
“Location” is the server, so in my case is 1400 km away 🙂
A useful tool for assessing the effect of advertising is the uBlock addin. Easy to switch on and off, and when on gives you an advert hit-count. (I leave it off for WUWT, eg allow ads, because the load is modest, but some sites get plastered with the stuff, or are maybe more susceptible to drive-by advert hijacking.)
Good grief. The machine says my location is in Carlisle, 110 miles away as the flow cries … er … the cry flows….er….. you know what I mean …. ang gives download of 4.07 and upload of 0.77.
However, I am none the wiser because I have no idea what these numbers mean.
Maybe Mr. Gore or Prof. Mann can take some time out to explain them to me.
Silence, whippersnappers! Pay no attention to the pause behind the curtain.
The Great and Powerful Wizard of Manmade Climate has spoken.
I mean seriously, at this point is there any conceivable evidence that could convince the likes of Matthew England that the models are fundamentally wrong? In ten years, they’ll just have different models that all hindcast the 25-year pause and all predict lots more warming in the future.
Sigh Your tax dollars at work.
Strictly speaking he’s not “ignoring reality”. He accepts there is a hiatus (reality) and tries to square this with his theory, which is a reasonable thing to do.
A theory should be squared /modified with the facts, not the other way around.
He does ignore the reality about the climate simulation models and their utter lack of skill.
First, the theory still rests on the premise that pre-stop(it’s not a pause unless they rise again) the rise in temperature was due to man. The theory states that mans influence was greater than ALL natural variability. So, using simple logic if natural variability is large enough to overwhelm the influence of man to stop rise, then natural variability is large enough to cause the rise. To acknowledge the stop means that it must now be shown the rise was not natural. Steadily rising temperatures was the “proof” rise was manmade.
Secondly, he has now purposed a theory that can not be disproven.
@ ironargonaut, “First, the theory still rests on the premise that pre-stop (it’s not a pause unless they rise again). the rise in temperature was due to man.
Would they stop calling it a pre-stop if temperatures do not rise but go lower? Would that be caused by man as well? Would they then take credit for “changing our attitudes for the so called better”? Oh I forgot, right, it is now called “Climate Change” , they can go any which way they want, the slimy, (sorry slippery) buggers, aren’t they? And they do not use their logic they use OPM’s money and play on emotions to get more money on top of the obscene amount of tax dollars they already get.
It may be reasonable, given human nature being what it is.
But it is categorically not scientific to “square” a falsified theory.
The correct course of action is to abandon it and study reality.
Menicholas You can’t possibly expect them to that, that would require work. God forbid we expect the anointed one to do work
Not really, because the “pause” invalidates the original theory. He is just trying to model the pause as if it does not.
He makes the rather unbelievable claim that natural variability (in reality a decline in temperture( over the last 15-20 years has been pretty much exactly the same as the rise in temperature that man-made CO2 has caused
The chance that the two cancel each other so exactly is zero.
Ironargonaut, Tim Hammond,
All true.
Plus, at the beginning, was not the main part of the supposed “problem” said to be that we were having an unprecedented rate of change?
It was not that it was warmer than ever…clearly it was not…but that it was rising faster than ever.
Of course, now that past temperatures have been “adjusted” beyond recognition, the meme has become that it is warmer than ever in history.
Part and parcel of this selling this lie was that the LIA never occurred, and if the Romans were growing wine grape north of Hadrian’s Wall thousands of years ago, and the Vikings were farming in Greenland in Medieval times, those were all local variations. But that supposed locality has now been debunked, even if it ever did have a smidgen of credibility.
So, we are left with the reality of warmer temps in the past, several times over, and natural variations counteracting “unprecedented” warming, which is flat out impossible if warming rates ever were really such.
It becomes difficult to see any reason for anyone to suppose any cause for concern exists, even if one once had such concerns.
But dispelling concerns requires one to keep in mind all the little arguments and counterclaims that have been dreamed up, ad hoc, to each criticism of the CAGM doom-mongers.
Obfuscation and pettifogging the issues have succeeded in creating uncertainty in the minds of the uninformed, and provided comfort to the credulous believers that all is on track for doomsday to proceed as planned.
Excuse me: The MWP, not the LIA, said to have never occurred.
“The recent slowdown in the rise of global average air temperatures will make no difference to how much the planet will warm by 2100, a new study has found.”
Unprovable/unfalsifiable statement of the year?
“The recent slowdown in the rise of global average air temperatures will make no difference to how much the planet will warm by 2100, a new study has found.”
Translation: The planet will be what it will be by the year 2100. Well duh. It might be colder in 2100 and he’ll still be right.
It could be the Unprovable/unfalsifiable statement of the century.
RH – century timescale may be appropriate here 🙂 But there’s a great deal of competition these days. Noteworthy in it’s meaninglessness, none-the-less.
He does not admit the pause, to his biased eye it is a slowdown. If we had a 10 year cooling trend it would not matter to him it would just be another type of slowdown.
5°C global warming….. that is 1°C every 20 years, and we are already behind.
How are we gonna make it?
HB
lol, yes, indeed — WE WILL NEVER MAKE IT. Good point.
And here comes little Stevie M0sher, the Enviroprofiteer-stooge, bellowing: But, but,…. THE PRECAUTIONARY FALLACY!!! You gotta treat it like, like…… like it’s a REAL crisis!!!!
sohandoveryourmoney.
Janice, I think you’re being unfair to Mosh. I see the co-author of Climategate: The CRUtape Letters as more lukewarmer than alarmist.
http://www.amazon.com/Climategate-Crutape-Letters-Steven-Mosher/dp/1450512437
Just curious, exactly which models “capture the current slowdown in warming?” I am of course familiar with the NCAR hind-cast. But according to one investigator in that study: “… there is no short-term predictive value in these simulations, since one could not have anticipated beforehand which of the simulations’ internal variability would match the observations.” In my opinion, if a model doesn’t have predictive power, then what exactly does it model?
if a model doesn’t have predictive power, then what exactly does it model?
===============
Climate model show what the modelers believe will happen. Otherwise the model builders would change the parameters and change the model output until it matched their beliefs.
This is called machine learning by survival of the fittest (genetic algorithm). Over time the scientists will select for those models that give the answer the scientists believe to be correct, no matter how wrong the model results might be.
Any model that correctly predicts future climate, unless this result matches what the climate scientists believe, that model will be assumed to be in error and changed until it gives the “correct” answer.
So, say for example a climate model said “0C cooling by 2100”. No climate scientists would believe this, so they would tweak the model parameters. After tweaking the climate model predicts “10C warming by 2100”. The climate scientists look at the result, decide it is reasonable, and make no further adjustments.
What has the model predicted? Has it predicted climate, or has it predicted the answer the climate scientists are willing to accept?
Exactly, except climate models are too arrogant or too stupid to see that.
Progressives/leftists never admit they’re wrong. They always resort to the argument of “I’m not wrong. We just need more time and money.” Even after almost 20 years of being wrong about CO2/temperature models, they still won’t give up on the models.
… because l1es about human CO2 are the ONLY way they can keep on confiscating our money to fund their permanently negative ROI windmills and solar panels and the like.
Matthew England is nothing more than a two-bit l1ar-for-hire.
As Anth-ony observed above, he WILL, indeed, say ANYTHING (… if you pay him enough or give him something he really, really, wants….).
This is the problem:
http://wattsupwiththat.com/2015/04/18/claim-graduates-shunning-climate-studies/#comment-1910461
“….the ARC Centre of Excellence for Climate System Science”
It’s pretty obvious that anywhere that feels it has to call itself a “Centre of Excellence for Climate System Science” probably is not.
Does M.I.T. call itself Massachusetts Institute of Excellent Technology ? No.
Universities of Oxford and Cambridge don’t need to add superlatives to their name, they just are centres of excellence.
If they have to say it, it means that they acknowledge there is a doubt and that we need reassuring.
“This study shows the slowdown merely reflects short-term variability.” IN THE MODELS. This tells us nothing about real climate.
“The louder he spoke of his honor,
the faster we counted our spoons.”
Ralph Waldo Emerson (echoing your excellent observation, Mike).
The Democratic Republic of XXXX
=============
what form of government is this country least likely to have?
It is like the worst tyrannies on earth that adopt the word “Democratic” Republic of….”. Remember ‘Deutsche Demokratische Republik? We have a political party in Canada The ‘New Democratic Party’ that essentially wants the government to nationalize things and impoverish the productive private sector.We also have Political ‘Science’, social ‘Science’, just in case you think they they aren’t sciences.
“If they have to say it, it means that they acknowledge there is a doubt and that we need reassuring. ”
Hey, whaddya mean!?!
http://farm6.staticflickr.com/5095/5419887361_1c4e1b1e0c_z.jpg
Congratulations, Piper Paul 😉
When I read “…the ARC Centre of Excellence for Climate System Science…” this is exactly what I was thinking of.
Below is the full legend to Figure 1.
As you read it, pay attention to what they are presenting: individual model runs, and model means. The 2-sigma bars, quoted as the defining message of future warming, represent inter-model variance — model precision. Not model accuracy.
The presented 2-sigmas tell us nothing about the accuracy of the projections.
There are no physically valid uncertainty estimates presented anywhere in the presentation of model results. This lack makes the projections physically meaningless.
Awhile back, I realized the implicit assumption climate modelers are making, when they make these sorts of presentations. They assume the models are a physically complete theory of climate. In that case, projection uncertainty would arise only from the bounds of parameter uncertainty and internal variability.
This assumption is the only way that inter-model variance can possibly be taken to show predictive physical uncertainty. But assuming climate models are physically complete is a nonsense assumption. It’s not even clear to me that most climate modelers even know they’re making it.
I have yet to encounter a climate modeler who thinks like a physical scientist (or engineer).
Figure 1 legend: “Global average SAT anomalies relative to 1880–1900 in individual and multi-model mean CMIP5 simulations. Blue curves: RCP4.5 scenario; red curves: RCP8.5 scenario. The future projections have been appended to corresponding historical runs at 2006. Lighter thin lines denote individual ensemble members; darker thin lines denote those that exhibit a multi-decadal hiatus (taken here as a trend of less than 0.096 °C per decade, lasting at least 14 years) at any time during the period 1995–2015. The thicker lines denote the multi-model mean of all experiments and of the subsampled ensemble set displaying an early twenty-first-century hiatus. The observed data (plotted in black) are version 2.0 of the reconstructed HadCRUT4 climatology11. The multi-model mean and 2σ bars at 2100 are shown to the right of the panel, along with PDFs of each of the samples. Lighter solid lines denote the PDFs for all ensemble members; darker solid lines are for the hiatus members. The all-ensemble PDF was recalculated excluding all hiatus ensemble members, and the resulting PDF is virtually indistinguishable from the all-ensemble member PDF (refer to mean and 2σ bars). The insets illustrate the early part of the twenty-first century for each scenario, with the individual hiatus periods highlighted. The values in parentheses denote the number of ensemble members exhibiting a hiatus out of the total number of ensemble members.“
Quote of the Day:
Pat Frank
Nice statement of the gist of the matter, Dr. Frank.
The multi-model mean and 2σ bars.
=========
You have 100 models delivering random noise. You remove 10 models that accidentally match the Pause. You don’t see any significant change in the statistical properties of the remaining models 80 years later.
Well Duh. That is why it is called random noise. For example:
Say for example we had 100 people tossing fair coins. After 1 hour we removed the 10 people that had thrown the most heads (heads=pause, tails = warming). We continued to watch the people for 8 more hours. Would the remaining 90 people be expected to throw more tail than heads? Of course not.
This is the exact same experiment. Only without the fancy window dressing to hide what is really going on.
Exactly, Ferd Berple. Well put!
You would not expect all random walks to be high of the mark.
ferd berple
You say
Sorry, but the situation is worse than that. The selection of models that seem to fit after the event is an example of the Texas Sharpshooter Fallacy.
Such post hoc selection indicates nothing about ability to forecast the future but it is tempting to think it does, and fr@udsters use the temptation to mislead their ‘marks’.
I again explain how they do this.
A set of, say 4, different investment plans is generated.
Each investment plan is sent to, say 4000, random people.
At a later date one (or more) of the plans has provided a very good return.
Those who were sent the ‘successful’ plan are now sent a report of its ‘success’ together with another investment plan. These new investment plans are another 4 different investment plans so 4 groups each of 1000 people each obtains one of these second plans.
Again, at a later date one (or more) of the second plans has provided a very good return.
Those who were sent the ‘successful’ second plan are now sent a report of its ‘success’ together with a third investment plan. These new investment plans are another 4 different investment plans so 4 groups each of 250 people each obtain one of them.
Yet again, at a later date one (or more) of the third plans has provided a very good return.
Those who were sent the ‘successful’ third plan are now sent a report of its ‘success’ together with an offer to invest $10,000 in the next investment plan which uses the astonishingly accurate prediction method that has apparently been successful three times without fail.
If 100 of the 250 targeted people invest then the fr@udsters gain an income of $1,000,000.
This is, in fact, the same ploy as is used when the ‘best’ climate models are selected after the event.
Richard
The hypothesis here is that there are model runs that happen to go flatish for 14 years 1995-2014 through internal variability. If allowed to run on they project 2100 results close to what those that don’t will. The conclusion is “This demonstrates the robust nature of twenty-first century warming projections”.
Not having the full paper means it is difficult to judge, but I suspect the test is relatively weak. Looking at the relationship between the subsample means and HadCRUT4 suggest they might be flatish but they aren’t modelling the pause (HadCRUT4 has been left behind by 2014).
This suggests the subsample is largely just those that revert to the mean during this period, and it isn’t surprising they project the same future. They say in their supplementary information they tested other criteria.
Perhaps if you have the paper it would be useful to know what was tested and what the results were.
There is a copy at http://web.science.unsw.edu.au/~matthew/nclimate2575-including-SI.pdf
This confirms that the test being applied only relate to the duration and magnitude of the flatness. They show that the runs that have this feature are much the same as the others when it comes to the 21st century projections. As they put it they cannot reject the null hypothesis that the mean and sd of the 2100 projections are different between the two sets of projections using various criteria relating to the duration and magnitude of the flatness.
But the duration and magnitude of the pause aren’t its only defining feature. It isn’t just that it is flatish, it’s the fact that in a series where natural variation should be mean reverting and the forcing should be pushing the temp higher, the measured temp has increasingly moved below the mean of the projections.
I don’t think anyone would be commenting if what we were seeing was the measured temperature reverting to the mean having been much higher (as no doubt a significant number of runs in England’s subsample are doing).
The real test would be to look at those runs that are not only flatish but also have ended up well below the mean.
I suspect that if any runs remain with this more apposite test England would likely need to report this as another “criteria that result[s] in a significant shift … when the subsampling becomes so constrained that only one to two [if any] model experiments remain; however, in this case the statistical analysis is no longer meaningful”.
In other words the pause ain’t reflected in the current model runs.
In passing I note that in his embargoed pre-publication briefing to press on the paper he isn’t too enthusiastic about Bjørn Lomborg or his being funded.
Ignore the millennial at your perennial.
===============
Hey, kim. I really liked that one. T-shirt worthy IMO,
Good point about progressives. The War on Poverty started in 1965 and the reason there are more poor people in the US today is because we haven’t “invested” enough resources. Same thing for education. The reason US kids lag behind other countries is that we’re not “investing” enough resources. We could succeed if only we had more “resources”.
Same with Neo-Keynesian economics, which can never be shown fallacious because advocates like Krugman always just say we didn’t run big enough deficits for the magic to work.
Keynes would not be a Neo. It might have made sense to run deficits during the Great Depression, although it didn’t work then, either. But after decades of deficits, the idea that even greater “stimulus” deficit spending would engender economic growth would be laughable, if not so tragic, since believed or claimed to be believed by the US government & its central bank.
Thank you, Anthony for putting everything in relief for us. My faith was wavering there for a bit, what with the big 3 (HadCRUT4, GISS, NCDC) surface data sets all ticking upwards and nudging towards all time (recorded) highs.
Good to have confirmed that the ‘pause’ is alive and well 🙂
When one is on a high but flat plateau, only a small nudge makes for a record high. But it takes a monumental plunge to make a record low.
But fear not, when the PDO flips, 1977-1998 type warming rill resume (until it goes flat again ~25 to 30 years later). Series of shallow steps only adding up to mild lukewarming, if the past record is any indication.
CLIMATE MODELS ARE JUNK — THEY CANNOT “WIN” — THEY CAN ONLY GET LUCKY
… and the demonstrated “odds” revealed by their numerous runs say that, just as some poor sot with a slot machine, they can only win by not playing at all.
GCM Simulations, i.e., Models — NO SKILL
GCM Code Based on CO2 Conjecture — NOT EVIDENCE
Models cannot hindcast
In short: Climate Models Fail
Source: Climate Models Fail, pp. 11-14, e book by Bob Tisdale (2013)
Then there is this (always worth repeating):
http://wattsupwiththat.com/2015/02/24/are-climate-modelers-scientists/
“This shows that the slowdown in global warming has no bearing on long-term projections – because ‘eventually’ the temperature is going to jump up a whole degree over night
So basically, even though reality shows a warming pause lasting 18 years or so now, and only a handful of the 100+ models can be forced to show such a pause, the MODEL OUTPUT at year 2100 remains the same, so we are still all DOOMED!
There, rephrased the entire paper for you!
Looking at this chart (click on it to zoom in and see it better) I don’t see any models that predict the pause. Out of the 90 models I see 2 that are below observed temps, but neither shows the same flat lining of temperatures that we have observed. These two are lower today only because they were much lower in 1995 (perhaps they exaggerated aerosol effects from Pinatubo?). NONE of the models show the current flat-to-decreasing trendline that shows in both of the observational records in this chart.
It may be premature to claim that the models have been falsified, however at the very least this chart shows that the science is far from settled, and is trending toward strong evidence that they are wrong. How far does the pause have to extend before they are declared falsified? I give it about 5 yrs. I see three possible outcomes in 5 yrs: (1) Observations make an abrupt turn positive and begin to catch up to the average; (2) Observations turn higher, but only weakly so that they are no longer losing ground on the models; (3) Observations remain on current trend of flat to down, becoming far lower than any of the model outputs.
Frankly I would like to see (3) at which point we could leave all this carbon pollution nonsense behind. If it’s (1) then I will change my position that perhaps the alarmist claims have some merit although I would strongly favor spending money on adaptation rather than mitigation. And if it’s (2), heaven forbid, then this stinking polarization will likely continue (which perhaps could be good for climate blogs ;-).
” I don’t see any models that predict the pause…Out of the 90 models …NONE of the models show the current flat-to-decreasing trendline that shows in both of the observational records in this chart”
Ha, ha, ha….Ha. What a mess! Average…your eyes are a lot better than mine. Or is it just wishful thinking?
Idiot: You’re babbling again.
No, he’s right. But I think it is irrelevant.
He is not right, and it is relevant.
Since about 99% of the individual models are well above the CURRENT temperature trend line, you have nothing to brag about.
The entire problem with climate science as a whole is that the models they use are demonstrably faulty to begin with.
You have all heard the phrase “garbage in, garbage out”. Well the actual problem with the climate models is that it doesn’t matter whether you put quality data or garbage data INTO the model. Because the model is faulty to begin with, YOU CAN ONLY GET GARBAGE OUT.
I am sure there are those that will argue that the models are “State of the Art” and “The Best We Have Available” (you all know which 3 or 4 commenters I am referring to), but nonetheless, until a climate model can be designed that properly accounts for ALL of the variables which influence climate, the models will be garbage. Further, since climate is a non-linear coupled chaotic system, I don’t believe a truly adequate model CAN be constructed.
The title of this graph is misleading (at least to anyone who is a scientist). It should technically be titled “Model PROJECTIONS vs. The Real World”.
However, it is only mid-trop. Surface diverges (somewhat) less.
I’m a bit confused with the model vs. empirical graphs and maybe someone can enlighten me. All the graph lines start around 1980 and show an incline to about 1990, followed by a decline to about 1995, followed by another incline.
Did all these models start in 1980? Did these models correctly predict the 1990 to 1995 decline? And is there any graph out the that shows just the forward predictions from these models without the backward “proofing” or readjustments that I suspect have been added to these graphs?
Suggested reading (hope it’s possible for you to get this book):
http://www.amazon.com/Climate-Models-Fail-Bob-Tisdale-ebook/dp/B00FEGNXA4/ref=sr_1_1?s=books&ie=UTF8&qid=1429818782&sr=1-1&keywords=Climate+MOdels+Fail%2C+Bob+Tisdale
Climate Models Fail, e book by Bob Tisdale (2013).
Pinatubo.
Brian, the graphs start in 1980 because satellites started recording in 1979. the models dont start in 1980 but the comparison is made from the start of the dataset.
Wait a minute. Their Fig 1 readjusts the temperature data anomaly to 2006 biasing it upward so it “looks” like it’s not that far off from the models. So now we have an “England” trick?
Wait a minute. Their Fig 1 readjusts the temperature data anomaly to 2006 biasing it upward so it “looks” like it’s not that far off from the models. So now we have an “England” trick?
“This much hyped global warming slowdown is just a distraction to the task at hand”.
Yes, facts are often an inconvenient distraction to the hype and propaganda of flim-flam artists.
eventually the sun will grow so big it will cause the type of global warming that boils the oceans , so he is right ‘ eventually ‘!
And once again we are reminded that they never been able to say what would ‘disprove ‘ CAGW because they claims anything and everything ‘proves it ‘ , and this has what to do with science?
The RCP 8.5 scenario is PRESCRIBED. The IPCC decided they wanted a case with 8.5 watts per m2 forcing. This required the modeler so to jam an incredible amount of green house gases in the atmosphere. The amount of fossil fuels they burn isn’t economically available. This means any paper using 8.5 is pure garbage.
Correct. RCP6 is probably about the max. A closer analysis of this switcheroo suggests that something midpoint between RCP4.5 and RCP6 is analagous to former SRES ‘business as usual’ scenarios A2 or A1b in AR4. I think the change deliberately confounded the ability to compare predictions over time, since AR5 used this trick to effectively climb down a bit.
The way he talks, is someone who has an agenda to push,where an honest researcher would follow the evidence to whatever it leads.
Models all the way up and down,from infinity to infinity!
Ha ha ha ha ha…………
I have no doubt that the models will eventually ‘win’ – not because they will be proved right, but because this entire AGW movement has nothing to do with reality, so much as it is a chess game where policy makers and activists are simply putting their pieces into place, suppressing the opposition – a game that has been played for decades and is approaching checkmate.
Somebody may tip the chessboard over…………… ;^D
Or perhaps bust it over someones head. One thing cagw’s have in common, they’re all pusillanimous.
Anthony – “Cryosphere Today” has not been updated for 10 days. Interestingly, according to NSIDC, global sea ice is now 1.32mm km^2 above average, an increase of about 1mm km^2 since 10 days ago when “Cryosphere Today” apparently decided that ice extent wasn’t really important anymore.
21.86503226 – average global sea ice day 111 2015 mm km^2
23.193 – day 111 2015 sea ice (latest) mm km^2
1.327967742 – mm km^2 above average
You might want to give a ring and see what is up over there. We could be seeing the end of the dreaded “sea ice death spiral” and the beginning of the global warming scare-mongering death spiral.
Data at these links.
http://arctic.atmos.uiuc.edu/cryosphere/iphone/images/iphone.anomaly.global.png
https://sunshinehours.wordpress.com/
ftp://sidads.colorado.edu/DATASETS/NOAA/G02135/south/daily/data
ftp://sidads.colorado.edu/DATASETS/NOAA/G02135/north/daily/data
Funnily enough, I was just about to post: ‘OT, Antarctic ice is currently off on one – up, up and away’.
Yes, I noticed the same strange and sudden cessation of daily updates, too…
Not meaning to be conspiratorial, I find it very interesting the daily updates ended just as global, Arctic and Antarctic sea ice anomalies started to exceed “normal” averages…
Arctic ice extents are now less than 1 SD from the 35-yr average and Antarctic ice extents are about 3+ SDs above 35-yr averages…. Hmmmm….
My guess is that perhaps the powers that be are developing new algorithms to “better” measure ice extents to enable them “better” match CAGW projections…
Since Arctic Sea Ice Extent has become CAGW’s ONLY variable that comes close to matching their dire projections (although recovering substantially since 2007), they desperately need to keep this last vestige in tact for as long as possible; especially with Paris talks just 6 months away..
That’s just a guess, but I wouldn’t put it past them to at least try and make some “necessary adjustments”… It certainly wouldn’t be the first time they’ve done this…
“Abstract:
The hiatus in warming has led to questions about the reliability of long-term projections, yet here we show they are statistically unchanged when considering only ensemble members that capture the recent hiatus. This demonstrates the robust nature of twenty-first century warming projections.”
Is the “Scientific Method” in there somewhere?
I worked with a couple faculty from UNSW on a project about 20 years ago. It was in a totally different field, but I was amazed at how they substituted rhetoric for analysis. This sounds like more of the same.
Except, this time, you’re not amazed, huh?
They are PATHETIC.
Matthew England seems to have a BS in mathemology.
The old days:
1) Warmists release climate study that doesn’t include much about the sun
2) Some point out that the sun seems fairly important for understanding climate
3) Warmists say that those who say this are not only wrong, but paid to say such blasphemous things
4) Warmists release a study include a bit more about the sun, hopes nobody notices
5) Some point out that its nice for the warmists to catch up, but what about clouds?
6) Warmists say that if clouds were important, the IPCC would have included them, you idiots
7) Warmists release a study that includes some information about clouds, hopes nobody notices
8) Etc., repeat as needed
The new days
1) Warmists release a study showing no hiatus in warming
2) Some point out a hiatus in warming, using the same data as the warmists did
3) Warmists say that if the Real Scientists say there is no hiatus, there is no hiatus, you evil bastards
4) Real Scientists admit there is a hiatus, but it doesn’t mean anything, and certainly doesn’t prove the models that didn’t show it are wrong
Waiting for
5) Real Scientists admit the hiatus they didn’t project, and didn’t admit was real, then didn’t admit was a big deal actually does mean something, and will need a massive amount of cash to look into, starting with a week in Rio in January.
LOL. Well said!
+1
Very good.
More important to saving the planet from the CACA conspirators than yet more years of flat to cooling GASTA is electing a GOP POTUS, Among those likely to seek the nomination announced or mentioned so far, any candidate but Bush, Christie, Graham or Kasich will do. Not sure about Fiorina:
http://www.csmonitor.com/Environment/Energy/2015/0416/Carly-Fiorina-Fix-climate-change-with-innovation-not-regulation
http://www.huffingtonpost.com/2015/04/06/carly-fiorina-california-drought_n_7014468.html?cps=gravity_2845_4118165490805229790
That leaves Walker, Cruz, Rubio, Paul, Carson, Huckabee, Jindal, Perry, Santorum, et al. Paul fudges what I think are his true beliefs when on Maher’s show. The others vary in their opposition to the CACA scam, but would IMO go along with a congressional agenda to dismantle the anti-scientific, anti-human hoax, if such were to emerge after 2017. However even many GOP members of Congress, as part of the government, still on the CACA bandwagon.
My GOP representative votes for windmill subsidies, since central & eastern Oregon have so many of the bird- & bat-battering death machines, including those on land belong to my family, friends, acquaintances & neighbors.
Part One: Heating the earth
A popular global heat balance shows 340 W/m2 incoming radiative flux at the top of atmosphere. A watt is a power unit, energy over time, equaling 3.41 Btu of energy/heat/work per hour. Over a 24 hour period the earth’s ToA semi-spherical surface would collect 7.13E18 Btu of energy.
Dry air is mostly nitrogen and oxygen with a heat capacity of about 0.24 Btu/lb-F. For dry air to absorb 7.13E18 Btu would require a temperature increase of about 2.63 F. Over 24 hours.
Water vapor evaporates/absorbs, condenses/releases, energy/heat at about 1,000 Btu/lb. For atmospheric water vapor to absorb 7.13E18 Btu through evaporation would require an amount equal to 25.5% of the current atmospheric water vapor content, i.e. more clouds, more albedo, more reflection, a self-correcting thermostat. That’s the entire ToA!
The sensible heat of water vapor driven by downwelling produces a trivial positive feedback. IPCC AR5 TS6 admits uncertainty about the magnitude. The evaporation of water vapor produces a negative feedback several orders of magnitude larger.
Part Two: IPCC RCPs
IPCC AR5 states that between the years 1750 and 2011 man generated GHGs increased the RF by less than 3 W/m2. (Is that the downwelling?) Contrast that figure with the ToA.
IPCC bases its various computer model predictions on four cases:
Case………….…CO2 ………….……Radiative……Dry air, ΔF………..Increase in atmospheric
………………….Concentration……..Forcing………………………………water vapor content
RCP 2.6…………421 ppm CO2……..3.0 W/m2………0.02……………..……….0.2%
RCP 4.5…………538 ppm CO2……..4.5 W/m2………0.03………………………0.3%
RCP 6.0…………670 ppm CO2……..6.0 W/m2………0.05………………………0.4%
RCP 8.5…………936 ppm CO2……..8.5 W/m2………0.07………………………0.6%
It’s the water vapor thermostat that controls the greenhouse, not CO2. It’s the water vapor thermostat that controls the simplistic blanket analogy as well. The hiatus heat went into a few more clouds, not the ocean.
December 2012: England accuses sceptics of lying when they say the rise in global air temperatures has paused:
“And so anybody out there lying that the IPCC projections are overstatements or that the observations haven’t kept pace with the projections is completely offline with this. The analysis is very clear that the IPCC projections are coming true.”
Really such as this one?
“For the next two decades, a warming of about 0.2°C per decade is projected for a range of SRES emission scenarios. Even if the concentrations of all greenhouse gases and aerosols had been kept constant at year 2000 levels, a further warming of about 0.1°C per decade would be expected.”
http://www.ipcc.ch/publications_and_data/ar4/wg1/en/spmsspm-projections-of.html
Reality shows a very different picture:
http://www.woodfortrees.org/graph/hadcrut4gl/from:2001/to:2015.3/plot/hadcrut4gl/from:2001/to:2015.3/trend/plot/rss/from:2001/to:2015.3/plot/rss/from:2001/to:2015.3/trend
Not even close! EPIC FAIL!!!
Ha ha ha ha ha…….
How about this chart from the same website:
http://www.woodfortrees.org/plot/crutem4vgl/mean:60/plot/crutem3vgl/mean:60/plot/crutem4vgl/trend/plot/crutem3vgl/trend/plot/crutem4vgl/last:360/trend/plot/crutem3vgl/last:360/trend
Scientific thoughts without exclamation points?
or this chart:
http://www.woodfortrees.org/plot/gistemp-dts/plot/none
the late 90′ and mid 2000 lows are higher than anything prior to 1980. That’s a buy signal from where I come from, nothing but up.
Are you that blind to what I wrote?
Again read what I QUOTED from the IPCC:
““For the next two decades, a warming of about 0.2°C per decade is projected for a range of SRES emission scenarios. Even if the concentrations of all greenhouse gases and aerosols had been kept constant at year 2000 levels, a further warming of about 0.1°C per decade would be expected.”
The next TWO decades, which is THIS century. The first 20 years.
That is why I posted a chart for just the same time frame the IPCC started at,year 2001.
According to their crack Chimps modeling scenarios,it should be warming around .35C or more after 13 plus years.Instead we get about ZERO!
You post charts from the 1800’s onward,which has nothing to do what I was talking about,which was about how poor the IPCC modeling projection is,for just THIS CENTURY’S first two decades.
Why give scientific thoughts on unscientifically “adjusted” trendlines?
And who is surprised that temps tend to rise at the end of a little ice age?
btw, showing a temperature history chart from 2000-2015 is like saying it didn’t warm from 12 to 1pm when it should have. Show the full trend, we’re talking epochs and eons here, not an afternoon on the porch.
It is clear you don’t take the time to think over what you read, since I was responding to the IPCC’s statement that covers only 20 years,the FIRST twenty years of this century.
“For the next two decades, a warming of about 0.2°C per decade is projected for a range of SRES emission scenarios…….”
THINK!
I thought everyone was in agreement here that the IPCC is wrong, but that doesn’t mean that temperatures aren’t rising. See Nickreality65 above for valuable insight it what is actually happening. The water vapor thermostat and response is where we’ll find a lot of answers, and a lot more questions.
!!
Again,again and again you missed the point I made,which is that the modeling scenarios I quoted is not just wrong, but it is catastrophically wrong.
They base their climate models on the idea that increasing CO2 level , in the atmosphere, is what drives the warming strongly upward,but 20 years later, it is still well short of meeting the myriad groups of Chimps and Wimps climate models, that keeps saying it is going to get warmer, a LOT warmer,even accelerate upward.
This suggests rather strongly, that AGW conjecture is failing badly, since it fails to show CO2 being the climate driver, it keeps saying it is supposed to be,and the lack of a significant positive feedback loop never shows up.
for below to sunset Tom, again and again, you are missing my point. The moderator won’t let me reference other epic fails of models, but why do we all care where in the band we are? The IPCC can be wrong in alot of ways. Each year there though has been less snow in Tahoe, less rain in Sao Paulo, and Australia so regardless of temperature steps, the longer term trend is clearly higher and the near term realities are accelerating resulting in lower GDP, lower home values, and lower standards of living. Catastrophically if you own a ski resort, or an almond grove. This is real money, not website money.
(Reply: No one is stopping you from referencing anything. Kindly stop trying to get the moderation team involved. Further attempts to start discussions with moderators will be deleted. -mod.)
@ Sunset Tommy — we (the science realists around here) get you.
(Just so you don’t feel all alone in the swamp that L’ho is creating, stomping around out in left fieldin his hobnailed boots, spewing unsupported nonsense).
@ L’ho — COOLER = dryer (v. a v. the ski resorts).
@Janice “stomping” “spewing” “nonsense” Are you suggesting there isn’t a drought in Calif and there is 14 feet of snowpack? Are you suggesting that Sao Paulo got down to 3% of water reserves and will soon break down in chaos? Are you suggesting that Boston didn’t get 100+ inches of snow in just a few weeks? If you think those events did not happen, then you would think I am “spewing nonsense”. You might then think that Santa is coming and Jesus will open the door and feed him cookies. But the reality is…. they did all happen. I didn’t make it up. There is a high pressure ridge.. oh , never mind.
“Lneraho
April 23, 2015 at 2:58 pm
…less rain in Sao Paulo, and Australia…”
WRONG! So so wrong it’s too funny! The issue is where rain falls in Aus in relation to where people live and food grown. Food prices are about to spike BECAUSE OF TOO MUCH RAIN. Our dams are full because of the rain Flannery said would not fall. Manly dam is filled to overflowing. Lake Ayre filled in 2010. I have no idea where you live but less rain in Aus…too funny!
“WRONG! So so wrong it’s too funny! The issue is where rain falls in Aus in relation to where people live and food grown. Food prices are about to spike BECAUSE OF TOO MUCH RAIN. Our dams are full because of the rain Flannery said would not fall. Manly dam is filled to overflowing. Lake Ayre filled in 2010. I have no idea where you live but less rain in Aus…too funny”
*cue the crickets*
From the cricket section, and Australian govt:
http://www.bom.gov.au/climate/drought/drought.shtml
which is an improvement over this drought, worst recorded since settlement:
http://en.wikipedia.org/wiki/2000s_Australian_drought
But the deluges or surpluses you point out are interesting and in a way correlate with temperature extremes we had this winter, -20 vs averages in the east coast and +20 in the west
No mention from the crew of science experts re Sao Paulo, California… just false information re Australia. Anyone care to spew or stomp or use !! points to make points that ignore $4bln in economic damages
Cricket anyone? Croquet? I have never been to Australia (more likely to go to NZ), but I must apologize for posting a simplistic observation in the company of Australians. For those that don’t know offhand, the land mass of AUST is just slightly larger than the US 48, so “saying drought in Australia” is too undefined, like saying polar vortex in America. Didn’t happen in the west, but nonetheless it happened and we had extreme variability vs historic averages in opposite directions depending on which side of the country you were on. But also citing a few full damns and flooding in Australia is equally misleading and reveals inherent bias and intent. It’s a really big country! It’s even a continent. There are droughts in Australia though, fact. There was a much deeper and longer one that ended in 2012, fact, but one might think they hit bottom and the droughts will only get better. Who knows? That would be awesome though, droughts are bad. What is more curious to me though is why is no one willing to address these realities here, instead of just bashing the IPCC, which is just another institution bound for failure like most and yet you are so happy to cheer less warming than a model, but nonetheless warming. It’s like cheering about the degradation of the Great Barrier Reef. On that note, maybe someone should start a sub-site called wattsupwiththatreef and you can cheer it’s demise and say EPIC FAIL, HA HA! He he, etc.
Linking to Wikipedia and the BoM, classic fail!
“Leland Neraho
April 24, 2015 at 6:08 pm
I have never been to Australia (more likely to go to NZ), but I must apologize for posting a simplistic observation in the company of Australians. For those that don’t know offhand, the land mass of AUST is just slightly larger than the US 48,..”
The BoM uses some ~112 land based thermometers, mostly located in cities and at airports, to calculate a national average (A totally meaningless practice). What that means is there is 1 thermometer for every ~68,500 sqaure kilometers. In 2013, the BoM changed the way they calculate that average using satellites in areas never “measured”, or used in average calculations, before. Surprise surprise, 2013 was the hottest evah! Funny that on their own website, there is acual data to disprove that! BTW, I live in Sydney, New South Wales, about 1/3 bigger than texas in land area if memory serves.
With regards to drought, yes we have drought here, but that affects farmers more than most others. Reason? Farmers are trying to grow stuff, non-native plants, where the rain usually does not fall regularly, relying on, in large part, irrigation especially along the Murray-Darling river basin.
There is a river system in North Western Australia, I don’t recall all the details, which can fill the Sydney Harbour basin every few minutes!
The real problems with the assertions made above are that a) the models (from what I make out in the top article) still use the old far-too-high estimates for the effect of aerosols and haven’t been retuned for the new, much lower estimates that drop ECS to well under 2 C; and b) the individual model runs don’t have the right physics in them as is obvious at a glance.
I just don’t get it. With a few exceptions that are difficult to see in spaghetti graphs like this that obfuscate the weaknesses in the models by creating a false “collective envelope” that one can then assert includes reality at some barely acceptable confidence level (untrue, as only two individual models are at or below reality across the board — the collective obviously fails a hypothesis test, although one can argue that four or five of the individual models do not) the individual model runs, in addition to producing far too much warming, have fluctuations that are almost an order of magnitude larger than those observed in the real world and have completely incorrect timescales.
In the real world, the longest stretch of unbroken warming is five years. After five years, there is at least a break in warming if not a round of cooling or flat trendless meandering. This general pattern persists all the way back to 1850 in HadCRUT4 — there are only rare periods where the climate trends up or trends down for longer than 5 years. This by itself is a critically important clue regarding the underlying dynamics.
Well over half of the models visible in the second graph above have warming trends a decade or more long. Some of them have NO cooling trends or level patches. When they hit things like ENSO or Pinatubo, the fact that they exaggerate the cooling effect of aerosols by a factor of 2 to 5 cause them to overshoot the actual change observed in global temperature by a factor of (wait for it) 2 to 5. Since they used this exaggerated cooling to cancel exaggerated warming, once the volcanic aerosol bolus goes away they produce warming at 2 to 4 times the rate of actual warming because CO_2 keeps going up but aerosols don’t keep up with it. At a glance, quite aside from the exaggerated warming predicted, the temperature has a very different fourier transform down there inside the timescales where if they had the right physics, the FTs should be matching up pretty well.
The fluctuation-dissipation theorem is the key theorem describing how the fluctuations observed around some sort of mean trend in an open system necessarily reflect the dissipative modes the system uses to maintain local equilibrium. Those modes are, in turn, the self-organized structures created by the full nonlinear physics of the open system that are the most important for describing or understanding that equilibrium. Getting this wrong simply means that the model physics is fundamentally wrong.
This is hardly surprising given that they solve the Navier-Stokes equations for the atmosphere-ocean coupled system at a spatiotemporal scale 30 orders of magnitude larger than the scale we really expect to give good answers. One could argue, of course, that they do clever things with mean field theory and averaging that make the ignored detail irrelevant and that produce the right dissipative structure and hence predict a meaningful local equilibrium. In science, however, making such an argument in the teeth of an obvious failure to satisfy fluctuation-dissipation and given a set of models that are apparently systematically diverging from reality is not very convincing. Arguing that just because some of the models some of the time can produce a “hiatus”, but that they still end up producing the exact same warming blithely ignores the fact that some of the model runs actually produce no warming all the way out to the end of the 21st century. All kinds of superaveraging is being done without any meaningful statistical basis or reason to think that the superaverages produced are predictive.
Technically, England is correct — the models haven’t been falsified. This is because the way the models are run it is literally impossible to falsify them any more than the IPCC already has — as long as one model, somewhere, some time, produces a single run that is close to reality, there is a chance that reality is just very unlikely compared to the statistical universe of possible climate trajectories. If you refuse to subject the models to a hypothesis test and reject ones that have an incredibly low p-value, then they will never be falsified, just like an ostrich who leaves his head in the sand will never see a lion even while the lion is eating him alive. If we never pick up our final exams and look at the grade, we can persist in our belief that we passed the course indefinitely even after failing every single quiz and exam along the way. Reality never actually happens if you don’t look at it.
However, nobody could claim that a comparison between models and reality provides evidence that the models are correct. That’s just absurd.
rgb
Speaking rationally religiously fanatic warmunists is futile. England is beyond hope. This paper makes clear the pause has driven him out of whatever he originally possessed of a scientific mind.
RGB,
Just for clarification, are you assuming a pseudo-equilibrium climate state where the natural evolution along a chaotic trajectory is of sufficiently long time scale for FD to be validly applicable?
Also, along a similar line, wouldn’t the plateau group necessarily require low climate sensitivity, and thus be expected to produce significantly lower 2100 temperatures? (You don’t suggest this-just asking.)
The FT isn’t going to be useful on multidecadal scales, but with 165 years of data it is probably not terrible for timescales up to a decade or even two. Again, the point of the analysis arises from the fluctuation-dissipation theorem. Chaotic or not, the FT is going to reveal important things about the dissipative mechanisms. For example, if one looked at the data on a monthly scale, the FT would clearly reveal the annual global temperature oscillation that is in counterphase with the eccentricity. The temperature data alone would tell us that a “year” exists and that something changes in the the way heat flows through the system in association with the year.
At some point the FT of a finite data segment will be dominated by artifacts, of course, so I wouldn’t take the 67 year cycle clearly evident in the data seriously even though it is a very strong peak. 165 years isn’t long enough to resolve a 65 year period, and chaos probably does do unusual things to the dissipative modes (like spontaneously switch attractors and hence multidecadal periods). But the point I’m making is that (most of) the models don’t get the short time dissipation right. They don’t get it close to right. They get it so wrong that it is perfectly clear that they don’t get the physics itself right. Whatever structures are emerging that transport heat and ultimately dissipate it in the fluid flow are the wrong structures with the wrong timescales and the wrong length scales, and I’m fairly certain that this extends all the way down to spatiotemporal scales we cannot see — I’d bet that they are off on an hourly, daily, weekly, monthly basis as it is the cumulation of this that we see as being spectrally off across the range of periods from 1 to 15 years (which ought to be resolvable with a 165 year base — that’s 10+ periods, enough to make artifacts from end effects a roughly 10% effect or less).
To give you a metaphorical model — suppose you have a marble that is rolling on a surface without slipping or dissipation. The surface it rolls on is not flat, however — it consists of many interconnected (smooth) nvalleys that wiggle from side to side and run roughly parallel and with ridges in between the valleys that can vary between no height at all to quite high. If you give the marble a random starting push along any initial valley, it will basically run up one side of the valley as it curves, then roll down and overshoot and roll up the other side, then roll back down and up the other side, repeat. Every now and then, however, instead of hitting a confining wall it makes it over the variable height ridge and into the next valley. We can imagine that the valley minima themselves are arranged on a larger scale, much flatter valley. We can even imagine a fractal distribution of the valleys and can imagine giving the marble a gentle push or a strong push, giving it the energy to easy jump between valleys at some scales but not others.
If you plot the motion of the marble transverse to its direction of motion as a function of time, local dynamics (within the current valley) gives you a “relaxation time” back to the local equilibrium at the bottom of the track. A period would emerge that tells you about the width and curvature of the locally confining valley. However, it also jumps over into nearby valleys, which might have a somewhat different width and curvature. Over time it can drift away from the initial valley altogether, although if the valley bottoms are themselves on a larger scale valley the marble will find itself confined on a larger scale and a new relaxation time will emerge as the marble “diffusively” bounces between the larger scale valley energy bounds. There can be many such times, and there is nothing that says that the width of single valleys has to remain constant or that the the larger scale valleys of valleys remain constant.
Still, as you accumulate data you learn a lot about the structure of those valleys. Things like an overall tip in the valley floors can emerge as the marble has a clear bias and is more likely to jump to the next valley on the right than on the left, although it can be difficult to differentiate this from simple cumulation of a random walk with no bias at all in a completely untipped set of valley floors.
That’s a pretty good metaphor for what the climate is doing and what we can infer from the temperature record. The climate is locally reasonably stable. It warms for a bit, then it cools for a bit, bouncing off the wall on the right that keeps it from running away in that direction, then off of the wall on the left that keeps it from running away in that direction. Sometimes it slips over into a nearby valley that has a slightly higher or lower bottom, but once there it finds itself still confined and the timescale of its confinement remains roughly the same. This results in a picture of “punctuated equilibria” — in a state of local equilibrium for a while, but with enough variability as it goes over bumps, finds holes in the confining walls, and is sometimes given a kick in a random direction by a pesky lizard that it jumps to a new nearby equilibrium now and then.
Discerning structure of the valley floors themselves is much more difficult, of course. For one thing, the valley floors aren’t usually very different in height. For another, Poissonian distributions have long tails, so it takes a lot of data to resolve bias in right vs left drift as the marble jumps valleys, and we cannot see the big picture of the surface on which the marble rolls.
In this metaphor, CO_2 plays the role of a tip in the valley floors. As it increases, it makes it a bit more likely to jump to the valley on the right with slightly higher mean (local equilibrium) temperatures than the one on the left with slightly lower temperatures. But HadCRUT4 makes it pretty clear that there is other large scale structure that can produce at least as much of a slope in the opposite direction, hence the “pause” in warming (or even cooling) from 1940 to the mid-1970s in spite of steadily increasing CO_2 throughout that period, hence the current “pause”. A correct dynamic model should capture both the gradual accrual of the tip, and the decadal dynamics of sloshing from side to side around the local equilibrium. A really good one would capture the multidecadal variation as well, which is almost certainly not (just) chaos per se, but is rather reflective of the named self-organized dissipative structures that we know have a significant impact on the climate because that’s how they were discovered and named — they are usually climate structures! These are things like the multidecadal oscillations (especially), the thermohaline circulation, the solar cycle, hurricanes and typhoons, thunderstorms, “winter”, monsoon(s), blocking highs, with timescales ranging from minutes through several decades out to as many as a thousand years (that we know of). There are even much longer timescale motions (Milankovitch stuff) and quite possibly unknown stuff thrown in on top. We have a pitifully short base of instrumental observation of any sort, and an even shorter base of global observations made with good/modern instrumentation from e.g. satellites or ARGO buoys or halfway decently sited weather stations. IMO, no more than 60 or 70 years, and arguably only 30 or 40 or even 10 or 15 (ARGO hasn’t been online very long yet).
The climate models fail this simple test long before they fail in other ways! They don’t oscillate with the right sub-decadal spectrum, and that spectrum is well resolved in the data! Worse, they overshoot badly — the marble careens up too-steep sides too fast and too far, and overreact to lizard kicks in the form of e.g. volcanic eruptions. Finally, the worst of the models just tip the damn plane to where the marbles just jump to the right every year. They never even regress to their local equilibrium because the model creates so much tipping from CO_2 that it exceeds the slope of the local valley wall. You can easily see these trajectories above — they just steadily get warmer, year after year, without ever cooling at all, without ever having a “pause” as long as a single year!
This is what is absurd in the figure above. How can any sane scientist with the slightest understanding of dynamical trajectories on rough landscapes take a look at reality over 165 years and the predictions of the CMIP5 models and not just pitch all but four or five of them directly into the dustbin? They are obviously wrong. Not because of chaos, not because of a lack of knowledge of initial state, but because they have the wrong sub-decadal dynamics. They also don’t match the multidecadal dynamics, but there we have inadequate real world data to positively resolve the problem and can only say that it is is highly probable that they have the wrong multidecadal dynamics. This isn’t a small problem, it is a large one. It is perfectly obvious that (most of) the models generate an absurdly large warming bias compared to the regressing local dissipation that makes local temperatures generally stable rather than otherwise and hence generate diffusive transitions to higher temperatures at far too great a rate, a random walk that is no longer random because instead of taking steps to the right (say) 55% of the time as opposed to 45% to the left so that a random walk on average drifts right, they’ve just built a model that takes steps to the right 100% of the time.
Seriously? And you want us to take this seriously?
Let’s reduce it to even simpler terms, Bayesian terms. You are given a coin. The coin has some probability of heads and some probability of tails, but you don’t know what they are! They could be literally anything, because a clever magician built the coin and you have no idea how he weighted it. Worse, the coin has a memory — successive trials aren’t independent! And you don’t know what the autocorrelation behavior is, how much getting heads on one flip influences the probabilities of the next flip.
You also have a computer. You wish to build a model of the coin that you can use to predict its long term behavior.
You start by flipping the coin 165 times. In that sequence, roughly 55% of the time the coin comes up heads, and roughly 45% of the time it comes up tails. But the heads and tails are clustered — you are more likely to see (say) three heads in a row or three tails in a row than you would expect if you just flipped a pure bernoulli trial coin, although in the long run there are slightly more runs of three heads than three tails and so on. As you always expect, there are a few runs of much more than three heads or three tails, and if you form the cumulated distribution function as you flip with 1’s given to heads and -1’s to tails, you see a cumulant that gradually grows but has stretches where it goes up several times in a row as well as down several times in a row.
Now you build your supposedly microscopic model! Curiously, however, your coin always lands on heads, and even more amazingly, lands at an angle so that instead of getting occasional tails, it just gets a fraction of a head. It never produces a single tail, let alone three or four in a row.
Forget about whether or not you have tweaked this model so that the angle distribution manages to smoothly interpolate the observational cumulant with its ups and downs. The model is not a model of the coin! It is the model of an imaginary coin, a coin that doesn’t exist. It doesn’t have the right probability of heads or tails, it doesn’t have the right autocorrelation behavior. It is a Bad Model. Its cumulant trace will never look like any data collection built with the real coin, and one cannot even reasonably argue that it is a predictor of the mean behavior of the cumulated distribution of coin flips because it has absurdly different and nonphysical dynamical behavior. You would do just as well fitting an arbitrary function with roughly the right shape to the cumulated distribution and not bothering to call it a microscopic model and pretending that this function can be extrapolated to predict the future of the CDF.
That’s how bad the worst CMIP5 models are, but even the not-quite worst models don’t come close to having the right decadal spectrum or fluctuation properties or dynamical responses to e.g. aerosol boluses. And yeah, then they fail to predict LTT, rainfall, drought, frequency and violence of storms, the rate of SLR, and the list goes on. Basically, they don’t correctly predict much of anything run to run, and the statistical distribution of outcomes (per model) doesn’t come out anywhere near the one result we actually can measure, reality.
This is not repaired by superaveraging the models together. Why would it be? You don’t get closer to a correct model of the coin flip by averaging any number of absurdly incorrect ones that allow coins to land at an angle and never produce a tail.
If England really wants the models to be taken seriously, he can start by rejecting models that fail a fairly detailed hypothesis test, one model at a time, in comparison with reality. I won’t even begin to address the nonsense of picking model traces that have “some” hiatus and extrapolating them to show that it isn’t quite impossible for the models to be right and yet for there to be such a profound disagreement between model results and reality all the way back to 1850 and still have crazy-talk 5 C warming by 2100 because you cleverly retain the models that have a slightly higher chance of landing the coin on the edge only slightly tipped towards heads so that they can generate a “pause” of ten or fifteen edge-on flips in a row while still cumulating those head-biased large angle flips like crazy most of the time.
rgb
Hello rgb.
You talk well and long. Thanks.
But if you allow me to ask one simple question.
At the moment we are ~400ppm..
~150 years ago there was only ~280 ppm CO2.
How do you think we got from there to now with such ppm increment?
Any idea?
Thanks
Cheers
I’m not sure what you are asking — why CO_2 is increasing in the first place or why temperature is increasing. Personally, I think that CO_2 is increasing at least in part because we are burning large amounts of coal. I think nearly all other forms of burning are nearly irrelevant in comparison. I have no opinion on the half-life of carbon in the atmosphere, but think it is plausible that the burned coal will stick around in the carbon cycle for quite a long time with at the very least more carbon in play before nature “sequesters” it in reservoirs at a new semi-stable equilibrium. But what “a long time is” I could not say, and am not convinced by any of the carbon models so far as I think that we still lack too much information to assert that one is “correct” and alternatives that also “work” are “incorrect”.
As for why the temperature is on average increasing — it is very plausible that a significant fraction of that increase, as much as “all of it”, is due to the increase in CO_2. If you look at the simple model I fit up above, this assumption fits the data remarkably well, and is backed not by complex microscopic model physics but by very simple, mean field physical arguments. On average, more CO_2 in the atmosphere should warm the surface in fairly predictable ways within some range of possibilities, and the observed best fit is within the general ballpark of that range. However, the data also clearly demonstrates that there is more going on than just CO_2, and since we cannot reasonably separate out or predict this unknown component in a simple radiative model fit, the fit must necessarily lead to a large uncertainty. The total all-feedback climate sensitivity to CO_2 could be as low as (probably just above) 0 C, say a few tenths of a degree C, although this low is pretty unlikely. It is probably in the ballpark of 1 to 1.5 C, and it also could be as high as 2 to 2.5 C, although at this point this high is pretty unlikely as well.
Getting aerosols right will substantially improve this sort of estimate. Figuring out thunderstorms and the water cycle and feedbacks will improve it still more. But ultimately, in a chaotic system, our best efforts are limited by a kind of “ceteris paribus” assumption that may not be justified — the assumption that the system itself cannot confound our best efforts to describe it in simple terms by spontanenously shifting one of its major modes of dissipation. For example, the emergence of the so-called “Pacific Hot Spot”. Suppose that this is a new, stable mode for the entire Pacific Ocean circulation. Suppose that it has the effect of basically permanently blocking ENSO phenomena, or else limiting them to being consistently weak and biasing the basin towards La Nina events. It would simultaneously shift the entire average global distribution of heat and change everything in the long run, quite possibly causing the planet to heat, or to cool, completely differently than models that assume a simple progression of a predictable PDO and semi-predictable ENSO would predict.
There is strong evidence that the planetary climate does this sort of thing without help all of the time on millennial timescales. California was mostly desert for a very long time, then it switched to become comparatively wet for most of the last couple or three centuries. It could switch back to being desert dry in a heartbeat. It may have already switched. Not because of CO_2, but because the multidecadal oscillations in the Pacific switched, because of pure chaos. We might never be able to predict such a switch, except to be almost certain that within some sufficiently long timeframe the switch will occur. That’s chaos for you.
CO_2 might (paradoxically) actually help suppress such switches and eventually give us a much more predictable and stable climate. Its increase is already directly responsible for roughly 15% of the food put on the world’s table every day, and it may be a factor in the slight decrease in the frequency and violence of storms, although that isn’t a well-supported conclusion statistically.
It may well be that increasing CO_2 will eventually lead to a “climate catastrophe”. Up to now, the additional CO_2 has almost certainly been beneficial and we might well have chosen to burn lots of coal just to get the benefits, as over a billion people are dining today courtesy of the additional CO_2. The world has never been lusher or greener in recent history, except where we persist in cutting down trees to burn them for fuel, and burning coal instead helps out with that as well. It is quite plausible that our climate “optimum” would be 450 or even 500 ppm. It is not at all clear that running it up to 1000 ppm will be totally beneficial, or even beneficial in excess of catastrophic. Personally, I think that RCP 8.5 is fairly absurdly unlikely even if we do nothing, or nothing more than is already being done. If thermonuclear fusion has indeed been cracked by e.g. Lockheed-Martin or others working on the problem (or is cracked in the next 10-20 years) the issue is totally moot for all time — we will not in this case come anywhere close to 8.5. Even without fusion, thorium and uranium fission, if we ever get over the collective fear associated with nuclear energy, would keep us from getting close to 8.5. Photovoltaic solar will probably keep us from getting close to 8.5 as its differential cost drops and the differential/marginal cost of coal based energy increases, especially if there is any sort of breakthrough in storage. We need to wait on and invest in these technologies, not engage in panicked and expensive measures that even if implemented at the cost of an ongoing human catastrophe right now would have little impact on our eventual “carbon footprint” by the time we quit using coal one way or another.
In the meantime, there are roughly 2 to 3 billion really, really poor people around the planet that are starved for energy, the fundamental resource that puts limits on nearly all other economic scarcities. Given enough, cheap enough, energy, we can literally make the deserts bloom by desalinating the oceans, we can mine scarce material out of seawater or build them out of the air. We can make fertilizers and develop access to clean water and sewage treatment in countries where the bathroom for hundreds of millions of humans is the field behind their back door, or it would be if they had a door. I am fortunate to live in an air conditioned house with clean water and super health care and more food than I can or should eat every day, all built with and enabled by cheap, copious energy. Who am I to tell those people “Sorry, you have to live another couple or three generations in abject poverty because we won’t permit the coal burning generation of electricity that would convert your poverty to plenty“?
Who is anyone? Especially with the CO_2 score so far at Benefits — 1 billion fed as a statistical certainty, every day; Penalties — absolutely statistically invisible against the background of confounding variables.
rgb
[Well summarized. Thank you. .mod]
rgbatduke
April 24, 2015 at 9:06 am
Hi again.
Let me say it one more time……..You talk well and long. Thanks.
But never the less …. let me use my wild card……the arrogant one…….you completely wrong as far as I can tell.
Is no any way in any imaginable math that our coal CO2 emissions can make up or fill the gap from 280ppm to 400pppm.
That is the hard truth.
you fail as far as I can tell.
Sorry….. please do ignore me if you do not understand what I am trying a tell you.
GCMs are far much better than you, these GCMs do give a confirmation how that can be, and these GCMs do support Dr Salby not you, as far as I can tell.
thank you for your reply.
cheers
“Penalties — absolutely statistically invisible against the background of confounding variables.”
Or Penalties: “drought, 9 feet of snow in 4 weeks in an urban city, mass migration to cities in the middle east, increased terrorism, border tensions between Bangladesh and Pakistan, riots in Sao Paulo (forecasted), no more skiing in Tahoe (sorry 2-3 billion poor people, we gave at the office), and potentially what is most catastrophic is the risk of dramatically lower grape harvest in Napa. Florida can flood, not a catastrophe.”
As you wish, since I haven’t a clue what you are trying to tell me, partly because you don’t actually tell me anything except “you’re wrong”. If you read my statement above, you will note that I openly acknowledge both my lack of certainty — so being wrong wouldn’t crush my soul or cause me to beat my breast — and my opinion. My opinion is due to a mix of looking up and reading out the numbers — which do, actually, have ample room for burning coal to be responsible for all or most of the CO_2 increase — and discussions with people who are actually good at math, as far as I can tell, and who actually work on this and have access to far more, far better data. Ferdinand Engelbeen discusses this topic on WUWT fairly regularly. Here is some of his research and study of this issue: within a whiff of 1. The other observable sources and sinks would have to perfectly mimic anthropogenic CO_2 to be as good a fit — but they don’t, and aren’t. They aren’t even close. This is perfectly obvious when you think about how temperature (for example) has varied relative to how CO_2 has varied. There is also direct evidence in the form of a clear lag in NH and SH concentrations, where the NH is the primary source of human emissions but the SH has by far the most ocean. If the ocean were the source, one would expect the lag to go the other way. If the ocean source were driven by temperature change, one would expect to see variations in the rate of increase with temperature. None of this is observed — the pause, for example, continues but CO_2 marches right on up. CO_2 increased from the 1940s through the 1970s, when temperatures were flat to slightly descending.
http://www.ferdinand-engelbeen.be/klimaat/co2_measurements.html
and especially:
http://www.ferdinand-engelbeen.be/klimaat/co2_origin.html
Personally I find these articles well researched, well written, and quite conclusive. Your statement that there is no way in any imaginable math that our coal CO_2 emissions can make up or fill the gap is simply not true, in detail. It is absurdly wrong. We generate twice as much additional CO_2 annually as actually appears in the atmosphere every year. The rest of the system acts as a sink, not a source, as one expects as the new CO_2 pushes the dynamical system towards a new equilibrium. All of Engelbeen’s statements are backed by graphs, data, and very cogent arguments, and the arguments are not monolithic — there are many independent lines of evidence that all point to the same conclusion. I find them completely convincing.
In the end, it is pure common sense. As he puts it — the match between anthropogenic CO_2 emissions and the atmospheric increase is almost perfect — one can establish a monotonic relation between the two that fits with
So, my friend, right back at you. The math not only makes it possible that human emissions are the probable cause of the increase, it makes it probable, and simple arithmetic suggests that since humans routinely kick in more CO_2 per annum than the atmosphere actually accumulates so that without any question the overall effect of the rest of the system is to act as a sink, the elimination of that input would very likely cause atmospheric CO_2 to decrease, at least until the atmosphere was again in balance with the sinks.
So personally, I think you are wrong, badly wrong. I’m aware that there are counter arguments, but those counter arguments usually ignore any of the data that they are not consistent with, such as the C13/C14 ratios or direct measurements of relative partial pressure of CO_2 in atmosphere relative to ocean. It isn’t that the arguments are completely implausible, but the preponderance of evidence at this point solidly favors anthropogenic CO_2 as the primary source of the increase over the last 165 years. It also doesn’t positively identify or verify the rates and balances that go into things like the Bern model — the system is without doubt very complex and we may be quite wrong in our guesses about things like long term residence lifetimes, even though the estimates are based on reasonably good assumptions and data in at least some cases. But the anthropogenic origin argument, in my own reasonably well informed opinion which could obviously be wrong but is the best I can do working pretty hard to discern the probable truth, is pretty much over, as is the argument over whether or not increased atmospheric CO_2 (all things being even approximately equal) is causing at least some greenhouse warming of the planet. How much, one can argue about. Whether it is enough to override natural variation, we probably don’t know yet (since we don’t really know what fraction comes from natural variation to be able to subtract it out). But the physics is in good agreement with the real world data, as I show above with direct fits. There are still large error bars, and the data being fit may well be suspect, but it certainly doesn’t stand as evidence against the anthropogenic global warming hypothesis per se, and there is no convincing alternative theory that can also explain why the simple radiative physics argument is wrong.
rgb
As for why the temperature is on average increasing — it is very plausible that a significant fraction of that increase, as much as “all of it”, is due to the increase in CO_2.
Do you look at past historical climatic data? It refutes your conclusions on CO2’S role in the climate and shows it to be a symptom of the climate not a governor of the climate.
Data makes a strong case that the PDO/AMO when combined with the sunspot averages correlate very nicely to the climate trends.
Salvatore, past historical climate data doesn’t “refute” my conclusions on CO_2’s role in the climate. See the fit I personally generated up above, for example. That fit doesn’t refute it at all, it makes it rather plausible since it is in excellent agreement with both the data and the predictions of the radiative-only (no feedback) theory. And I understand that theory well enough to be very, very strongly inclined to think that it is correct, if not necessarily terribly accurate. My fit, however, is well within the range of values consistent with the theory and can hardly be said to refute it.
Outside of that, I have a couple of other problems with your assertion. I’ve tried hard to get good data on the PDO. For example, I have a file that contains the monthly PDO index all the way back to 1900 (except for a few that are missing). As far as I know, it is increasingly difficult to come up with any sort of accurate index prior to this date, certainly not on a monthly basis and based on actual broad measurements. ENSO itself was only discovered/named maybe 10 years earlier. So assertions that we can correlate the PDO to climate trends back substantially further in time I will have to respectfully doubt, at least until I see and understand where the data is coming from. Recall, I have my doubts about things like the accuracy of the temperature record itself prior to 1950, let alone 1900 or 1850. Nobody ever publishes graphs with error bars in this game, at least in any document that will be seen by the public, so that every line is just (supposedly) a perfect representation of reality, end of story. I don’t know how accurately, or how far back, the AMO is known, but I’d guess once again that 1900 is probably a pretty good boundary, and that prior to 1850 or 1800 it was almost certainly completely unknown. Sure, there might be proxies — but the proxies are almost certainly both low resolution in time and subject to rather large errors that make them useless for the purpose of establishing probable truth as opposed to an argument that is plausible, that isn’t directly refuted by the data.
Finally, there is the problem of sunspots. Personally, I have thrown my hands up and at this point refuse to think about them — yet — as anything more than plausible factors in the climate. Again, the issue is the same thing — there have been multiple subtle changes in the ways sunspots have been counted over the years and decades, and while I think e.g. Lief’s efforts to go back and rationalize the sunspot counts using multiple consistent proxies is very reasonable, I also think that efforts to correct past data can only be undertaken with the full acceptance that the cost in possible error is always going to be a substantial chunk of the supposed improvement. I can’t go back in time and remeasure the “true” sunspot count consistent with modern instrumentation and methods in 1850, and neither can anybody else. You can just try to infer a consistent bias or error subject to various assumptions and then hope that your inference is correct. It can never be verified in the usual sense that scientific assertions or conclusions can be verified by independent observations. It’s too late for that.
That’s why I don’t offer any explanation for the 67 year period I can fit on top of the CO_2 model in the graph above. You might say that 67 years is the collective period of the PDO/AMO and/or the sun, but I’ve got the data more or less in my pocket for two out of the three, and no it is not. The PDO, in fact, if you actually plot is, isn’t particularly periodic or orderly, and adding the PDO index in any sort of simple model form to my fits above did not really improve them or correlate in any reasonable way to the global temperature data. Sunspots are less clear — they obviously don’t correlate on any sort of microscopic basis, but there has been so little variation over the 20th and 21st century up to now that if they have any sort of smoothed impact on climate, it is once again not possible to convincingly — to me — fit the data — by me. The good news is that the current solar cycle is going to be very low, and the “prediction” for the next one is to be even lower, and if there is a causal link to the climate we should know it any decade now.
That’s what I think about the climate in general. We’ll know a lot more about it quite soon. Any decade now. Fitting CO_2 to temperature isn’t very informative when CO_2 monotonically increases and global temperature, while not monotonic, has a corresponding increasing trend. We could fit that trend with the stock market and claim that the Dow Jones Industrial Average causes global warming just as easily. The difference that makes the former science and plausible and the latter funny is the physics of atmospheric radiation, which is well understood. I agree with you that the multidecadal oscillations are very likely major factors in global climate variation, and do not think at all that they are bounded by any sort of ceteris paribus argument in their effect. I also think that we have such a short reliable observational basis for understanding them and their effect that establishing that connection in a believable, quantitative way, might take anywhere from decades to centuries of observation and computation! After all, the system is chaotic. The entire pattern of these oscillations could easily shift, shift dramatically, even without anything perturbing the system. But we are kicking the shirt out of the system with a huge bolus of CO_2, and anything at all could happen as a consequence (including nothing interesting at all). Or it could shift tomorrow, and might have shifted tomorrow without the help of CO_2 (or might have shifted even earlier without the additional CO_2). We are — truly — clueless about this. Who would be surprised? Who predicted the Pacific Hot Spot that has emerged and now is apparently persisting for its second year? Who can predict its effect on the general PDO and other coupled oscillations and major heat transport mechanisms? Who can tell me whether it will vanish by July as mysteriously as it appeared or will persist for the next century, “permanently” altering the climate as much as anything in the climate can be said to be permanent?
That’s how unknown things are. Maybe you are right. Maybe not. Either way, I don’t think that you can prove that you are right any more than I think that you can easily be proven wrong. Time will tell, but it will probably take more time than I have years remaining in this life to find out, so I will reluctantly bow out of the argument pending more data or another lifetime.
rgb
http://hockeyschtick.blogspot.com/2014/09/new-paper-finds-natural-ocean.html
Time will tell. A this point that is where the situation stands. Nothing can be ruled in or out and that is the point I think you just made which I agree with.
“This shows that the slowdown in global warming has no bearing on long-term projections – it is simply due to decadal variability. Greenhouse gases will eventually overwhelm this natural fluctuation,” said lead author and Chief Investigator with the ARC Centre of Excellence for Climate System Science, Prof Matthew England”
This is possible but the problem is that if you don’t understand the decadal variability(can’t pinpoint what is causing it and why) then you can’t quantify it’s contribution/weighting to global temperature fluctuations.
Plotting a graph of CO2 vs temperature during the past 150 years and drawing a long term trendline from beginning to end is the main case for CO2’s warming effect(besides the physics).
There have been several periods when the warming stopped, even cooled slightly for up to 30 years………then it resumed.
I would expect, all things being equal, using long term chart analysis, that the warming will resume at some point. If I was projecting the price of a stock or other measure, based purely on the chart, this is the conclusion.
All things are not equal however. All the physical relationships that were valid with CO2 at 280ppm, then 350ppm can’t be assumed to be the same with CO2 at 400ppm, then 450ppm.
How can we possibly make that assumption when all things have never remained equal in the past climate system?
Will all past variations be overwhelmed by increasing CO2?
This is possible but we only have speculative theories about what caused the past variations. We can’t even explain the physical causes of this decadel warming slow down or the modest cooling in the 50’s-70’s(other than ocean circulations and heat redistribution).
Changes in water vapor and clouds are not well understood. Maybe recent changes in the sun have nothing to do with recent climate………but it bothers me that many scientists are somehow positive of this. Another cycle with the sun similar to the last cycle will quiet those who think it is………or provide evidence of an effect
Wouldn’t it be nice if all we needed to do was to plug in the value for CO2 in the atmosphere to know what the global temperature was going to be.
The same side that insists on this also includes experts who completely rewrote climate history to wipe out the inconvenient Medieval Warm period because it showed natural warming equivalent to what we’ve experienced the past 150 years and the Little Ice Age that featured natural cooling that created severe adversity to life on this planet.
The same side that won’t give weight to the massive positive contributions of CO2 to atmospheric fertilization, with trillions of dollars worth of benefits.
Even if I wasn’t an operational meteorologist that sees we are NOT experiencing the big uptick in extreme weather/climate that one side insists is happening, how would I even be able to trust sources that I know are intentionally exaggerating and at times not telling much of the truth?
When its clear that somebody is intentionally misleading or claiming to have absolute knowledge or extremely high confidence about something that I know is impossible to have(even if they really think this), it causes me to spend extra time finding the authentic reasons for why they are wrong.
I get what you’re saying.
For instance there was no net warming from the start of the HADCRUT series until ~1935 (90 years) which is hard to reconcile with the Law Dome ice core CO2 record, given that at the lower concentrations CO2 is at its most potent as a greenhouse gas.
Similarly there was the 1940 – 1975 dip or hiatus depending on what to believe.
The ‘climateers’ would argue that is the way overwhelming CO2 forcing works (which doesn’t make sense) but if that’s the case, why aren’t there similar pauses in the model predictions/projections?
Mr. Maguire,
Well said sir.
I think that statement of yours could be the last word ever said about this whole charade, and would sum things up very well.
Instead of spending time finding authentic reasons why they are wrong (it is likely that base case will be binary–one side will be right and one wrong), wouldn’t it be more important to understand the probability of being right or wrong and the risks/costs associated with each outcome? Last time I proposed this someone threw out hundreds of trillions, which is absurd since the costs are marginal and there are corresponding benefits (less asthma let’s say), and we are also comparing economic outcomes for a relatively narrow group of people passing through in a very inconsequential amount of time vs. a conceivable positive feed back loop catastrophe that last for centuries. In other words, when they write the history books 100-200 years from now (not books..I know), they will likely never mention GDP of 1.7 vs 2.8 if we take the action set with no gain or loss, but what will they write about what about when they assess the impact of a bunch bible thumping idiots who were driving 8k pound trucks to get a latte? The probability in that case is very that they won’t be kind.
Once I understood our limitations regarding our ability to properly survey climate systems, I began to relax. Yes its frustrating that certain zealots get so much air time, claiming to be confident that the earth is screwed. But its just fluff. We are miles away from making those kinds of claims.
So the “evidence” is comparing the models to each other? Seriously?
Careful these guys are getting smarter now fudging their predictions for a time when no-one alive will remember what they predicted anyway…….
For the same reason that Santa Claus has always lived at the North Pole, heh.
The other day I was wondering if the IPCC will be the Nostradamus of the 25th century.
People will try to read some meaning into their words, and much head scratching will ensue.
Well, I just got a personal invite from Mr Gore, to attend the Climate Reality Project in Iowa. It looks like he got my email address from some human rights campaigning work I did a while back. He says I can train to be a Climate Reality Leader, and learn all about climate science. Wow. So, they have science. I would never have imagined that.
I think you can guess my answer.
You should go, and show them what reality really means.
“You’ll meet a dark handsome man” , but when you’ve met a blond ugly guy, then the argument will be: “Hey, look, in the dark everybody looks handsome, so my prediction was valid.”
Sounds like pathological science to me.
No, wait, it’s called “post normal science” these days.
lol, … then the
fortune tellerIPCC will say:You just didn’t wait long enough. Wait till you’re about 85.
hey, I will be 85 this century, I can wait 🙂
But, let’s not forget, over 6 billion people will die this century. This is a solid prediction.
It is no accident that the “Climate {Virtual} Reality Project” is in Iowa.
.
Source: http://www.usatoday.com/story/money/business/2013/05/09/wind-energy-investment-iowa/2147657/
Except it doesn’t. They may have an installed capacity of 20% of Iowa’s electricity demand. But if they get 20% of that, they are very lucky. And often, the wind just does not blow at all. Particularly at night, when solar cannot do it’s loser job – haha.
Nameplate capacity vs. observed output. I believe this is a common, convenient tactic of reporting the wonders of solar and wind whereby “minor technical details” are helpfully omitted from press releases and media reports.
According to Mid-American Energy, as of 2013 their generating capacity was 45% Coal; 30% wind; 19% Natural Gas; 6% nuclear, hydro, other. They have expanded wind in several projects since then. So it is very feasible that they are actually producing 20% of kilowatt hours by wind. When power demand is low, it is normal to take out the larger assets: (i.e. coal) for maintenance, so in low demand times wind is an even greater portion of the active generating capacity than 30%. Mid American is not the only player in Iowa, just the largest, others play in the wind as well.
Although articles about technical subjects written by non-engineers or scientists are frustratingly non specific, it is likely that in this case, it is correct that 20% percent of the electricity produced in Iowa is by wind the installed nameplate capacity is even greater.
I saw a report not too long ago that in England the amount of wind power that could be counted on at all times was 2% of nameplate capacity.
“This shows that the slowdown in global warming has no bearing on long-term projections…”
Adjustments and Homogenization will validate the IPCC projections.
Not if Anthony and the rest of the team has anything to say abut it.
“Greenhouse gases will eventually overwhelm this natural fluctuation” There is no way the greenhouse gases (CO2) can cause significant warming. Only the feedbacks can do that and they only exist in the models.
Exactly. As an engineer, I understand what positive feedback does, and if there were a positive warming feedback in the atmosphere, we would have all fried before we even existed.
If we go into a new ice age, it will eventually end. Would that signal the end of the pause?
Rising temps after the PDO flip to positive in ~20 years. Another ~30-year rise. Then another pause.
fact will not overwhelm ideology.
Why is it that the darn graphs never have the “mean line” added to them?
Predictions – the 104 runs – are for about +2.0 C per century. Actual has been chugging near +0.5 C/century. I just don’t think the world’s coming to an end. Of course, perhaps unusually (which we can’t expect politicians, senators or cheerleaders to have accomplished) I learned to count and COMPARE numbers in the 3rd grade. Grammar school.
The models are run from 1983 which means they cover one period of warming and one period of pause. There’s no satisfactory history match so it is folly to think the models are OK. If the model runs are initiated in 1900 and there is a match with the temp rise from 1920 to 1940 and a match for the drop in temps from the mid 40s to 1980 then I might conclude the models have some use. Also, logically, natural variability might be the reason for the temp rise from 1980 to 2000.
Of course the end of warming 2 decades ago doesn’t effect these pseudo-model forecasts. Plug in: delta T = fn [CO2] … and it will show warming as long as {C02} is increasing.
CO2 forcing is constant. It is modified by PDO cycles: 1950-1976, pause. 1977-2007, double-warm. 2007 for ~30 years: pause. 2xwarm. Pause. Etc.
Man oh man, I knew there was a lot of mess that one day has to be cleaned up and a science scrapped and started over again with cleaned data. I knew that new universities, and scientific societies and learned journals had to be created to let the others die because there is no hope of rescuing them and straightening them out, but for Australia, I realize we need a couple of Marshall Plans to save it. The previous thread was on Aussies at the U scrapping democracy to save the planet. Now it’s hide the divergence between the models and reality, or at least hide the reality. They are a hazard to navigation to Antarctica..Please, enough excellence already.
When will they give up?
2 days after the Sun stops, 7 billion years from now.
According to the paper, only the future is certain.
Where has one heard that before?
Someone please ask him, in what decade to the models go from completely wrong to precisely right? They must be able to project that or there would be no way to project they are magically correct in 85 years.
A pseudoscience at work: rewriting reality.
Wow, so according to this GROUPTHINK is advantageous and sufficient grounds for confirming their confirmation bias as correct.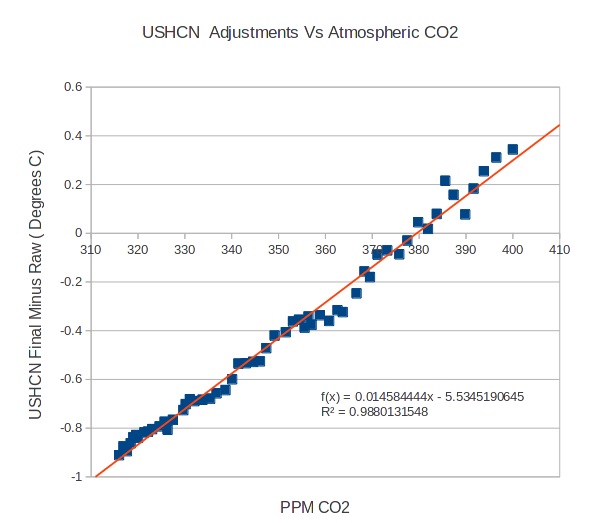
When the strongest correlation anyone has found to CO2 is the magnitude of the post-hoc adjustments being made to the temperature datasets, you know the fix is in.
Tarajunky, I’ll have you know that you are exhibiting a truly cynical attitude!
Gentlemen, get this straight once and for all. The GISS isn’t there to create hysteria, the GISS is there to preserve hysteria.
(In case you’re unfamiliar with the ’68 DNC, I love it.)
Where did you get the data for this graph, and what exactly are the points? Also, the span of the data appears to be over 1 C. There is some structure in it — is this structure associated with known changes in their algorithm? It gets increasingly noisy in the present, which is the exact opposite of what one would expect based on the probable quality and coverage of the data. And why linear in CO_2, when CO_2 itself was nonlinear across the same time in a very particular way (one could present the same graph in terms of date, in other words, but then it would not be linear!) In short, the graph as it stands doesn’t really make sense. But I’m very curious to know how it was built?
rgb
Prof Matthew England is a chief investigator at the centre of excellence at UNSW which is also home to Prof Chris Turney, the famous leader of the ship of fools that got stuck in Antartica due to natural variations. If that’s a centre of excellence, what does a centre of mediocrity or worthlessness look like?
Excellence is not descriptive of what a department does, it is a value judgment. In corporations it often refers to a department that allegedly can tell other departments who actually do stuff how to do it “excellently”.
Any group or department that has “excellence” can be immediately flagged as a gaggle of befuddled self-aggrandizing bureaucrats.
What is amazing and amusing about climate models other than the identity crisis of not knowing whether they are predictions, projections or forecasts, is they never project cooling. Sticking with the term projections, the models suggest the earth is never to cool again. Which brings up the question at what point in the future will the people of Maine have the same climate and ocean temperatures of the lovely Bahamas? Projecting further into the future when do the oceans become hot enough to make for a pleasant hot tub experience?
Any dimwit knows the earth has gone through warming/cooling cycles, and it is reasonable to expect it will continue to do so. So if models cannot project both warming and cooling they cannot claim to predict, project or forecast Global temperature.
Of course Alex, models , the GCMs should show cooling at a given point, but these models donn’t, as far as I can tell………..and that is a big handicap, yes, especially when projections are treated as predictions or forecasts.
Cheers
I have a theory I describe using words.
I build a computer model.
The model produces the same results as the word description of the theory.
I proved nothing except that I could program a computer to do with numbers what I could use my word processor to do with words.
The only problem with what you say is that the model in question is not in principle set or run according to the theory…
Cheesr
“The only problem with what you say is that the model in question is not in principle set or run according to the theory…”
How do you know? He built it, and he said what it is!
And you come along and tell him he is wrong.
Who are you?
Menicholas
April 24, 2015 at 8:42 am
Very clever Men..
but he is trying to compare to models he has no clue about….that is the point. otherwise he be talking to himself…
comprende?
cheers.
“This study shows the slowdown merely reflects short-term variability”
Remember when science predicted? General relativity -predicts- where your space probe is going to end up, despite overwhelming evidence that it will be correct. But apparently climate models 100 years out that havent worked well to date -show- what is and will happen.
Thanks, Anthony.
The paper’s title should have been “Alarmist warming projections despite the recent hiatus”, “Robust” as you point out cannot be said of a forecast.
Since the models were training on a decadal upswing, it is disingenuous to dismiss prediction errors with excuses of the same type parameter effects. They are at least putting NSW on the map as a center of non-science—to avoid as a waste of time.
http://www.sciencemag.org/content/337/6096/809.summary
This is a quote from the article NASA satellite data shows a decline in water vapor.
The quote is radiosonde data shows that upper atmosphere water vapor declines with warming.
Now data from the patriot post article called Evidence That Demands a Verdict shows quite clearly two items of data of importance one being there has been no warming in the tropical atmosphere at the 12km level or 18 km level and that al the deviations in the upper tropical atmosphere temperatures are correlated with the temperature in Nino region 3.4.
Thus far no lower tropospheric hot spot has materialized.
What the data is saying if one tries to incorporate all of this is first of all it appears that the temperature in the tropical troposphere is correlated to ENSO. When ENSO in in an El Nino phase the temperature in the r tropical troposphere increases and vice versa with no long term change in the temperature of the tropical troposphere overall. In addition radiosonde data is indicating that water vapor concentrations are inversely correlated with the temperature of the atmosphere and from the article I posted it said one of the ways in which water vapor may get into the stratosphere outside of the tropics is via convection. Then in addition, with data still showing no lower tropical tropospheric hot spot here are the objective conclusions that I think have to be drawn based upon the data.
The conclusions I take away from all of this is first the temperature of the tropical troposphere is controlled by ENSO not CO2 and that the concentrations of water vapor irrespective of if water vapor is or is not inversely correlated to the temperature of the atmosphere is going to be tied to ENSO, not CO2.
In addition it looks like sea surface temperatures(PDO) /convection may have much to do with the amounts of water vapor which eventually reach the stratosphere all of which destroy AGW theory which said the amounts of water vapor which will reside in the tropical troposphere will be DIRECTLY tied into the strong positive feedback between CO2 and water vapor which would result in two distinct trends developing in the r tropical troposphere which would be a steady increase in water vapor which would be in tandem with a steady increasing temperature trend in the tropical troposphere which would be more pronounced with altitude relative to the lower levels, and that this steady increase in water vapor /temperature trend which would be evolving would cause a lower tropical tropospheric hot spot to evolve, due to an ever increasing negative lapse rate.
Data however shows no such negative lapse rate trend evolving and no correlation between CO2 and the tropical tropospheric temperature profile, nor no correlation with CO2 and tropical troposphere water vapor profile. Instead data shows the temperature and water vapor characteristics of the tropical troposphere seem to be correlated with ENSO ,and indicate in the case of water vapor (according to radiosonde data) an inverse relationship to temperature all things being equal but this could be obscured by convection changes in the tropics due to sea surface temperature changes and atmospheric circulation changes all of which AGW theory does not address to any degree whatsoever when it comes to the temperature profile and water vapor profile of the tropical troposphere.
In conclusion not only does the resultant tropical hot spot as called for by AGW theory not appear but data shows in addition the reason why it does not appear are because it is not CO2 which governs how the tropical tropospheric temperature/water vapor profile may evolve but rather it is ENSO/PDO phases along with convection changes in the tropics due to atmospheric circulation changes and sea surface temperature changes (PDO).
This all showing that the central theme of AGW theory which is a strong positive feedback between CO2 and water vapor resulting in a tropical tropospheric temperature/water vapor profile which would give rise to a hot spot is flawed. Hence the theory is flawed.
Well you gotta admit they’re worse than we thought and they did come up with the idea first.
If the modelling software is so good, why not try to calculate when the ~0.5C credibility gap will close?
http://wattsupwiththat.com/2014/07/28/new-study-claims-to-confirms-water-vapor-as-global-warming-amplifier-but-other-data-says-no/
Here in this article if one scrolls down you will find the latest data on water vapor trends for various levels of the atmosphere. Does not look to be supportive of AGW theory to me.
Citing articles on this site does not constitute a valid scientific argument since this cite is blatantly biased toward an outcome everyone is already set on. it’s like asking Lebron James if he’s a good basketball player.
Two logical fallacies in one. Argumentum ad lapidem and appeal to motive.
The article argues that two papers are contradictory. Is that true or not? If not please contribute with your refutation.
Try playing the ball.
Clovis Marcus,
True of the specific case. In the general case, this forum frequently trades on appeal to motive, thus rendering …
… a priori absurd. Cribbing a line from a quotable film, charging a person with fallacy in this place is like handing out speeding tickets at the Indianapolis 500.
Just so there’s no doubt about my self-awareness, and if it pleases the court, please allow me tally up my own list of violations in this post:
1) Moving the goalposts.
2) Strawman.
3) Hasty generalization.
4) Guilt by association.
5) Unsupported assertion. [1]
Guilty as charged, Your Honour. Whatever my fine, it’s worth its weight in irony.
——————
[1] As self-evidence rarely goes unpunished in this court, should the jury wish to review exhibits prior to sentencing, I’ll be happy to provide some particularly egregious examples of what I see as blatantly fallacious appeal to motive.
The upshot of that data in the above post is that it follows ENSO/PDO phases and NOT CO2 which nullifies AGW theory.
The basic theme of this theory is not holding up which is a positive feedback between CO2 and water vapor causing a tropical tropospheric hot spot.
Instead the tropical troposphere in regards to temperature/water vapor profile trends seems to be governed by ENSO/PDO phases. So much for CO2/WATER VAPOR positive feedbacks being the cause which clearly is not the case.
The overall objective is to save the theory long enough that currently active climatologists can continue making a living until they secure their retirement.
Everyone who ate peanut butter in 1850 is DEAD!
Therefore peanut butter is:
A- “the origin of a world wide Armageddon. ” , IPCC
B – “food” ,Climate Realists.
Speaking of the danger of peanuts, I bought a large packet of peanuts from the greengrocers a while back (in Oz) and there it was, that ubiquitous disclaimer- ‘Warning this product may contain traces of peanuts’
I certainly hoped so but then I do like living on the edge.
A lot like the posters you see around my burb, once a year, advertising the local Psychics, Mystics and Portents, etc knees up at the local race-course.
Makes you wonder why they bother advertising.
Increase in GHG hey…
Um, given water vapour makes up 97% go GHG, it has been slowly falling since the 1930s.
Matthew England either know this and ignores it, or is a dipstick.
The alarmist standards have become very sloppy, nothing is even believable anymore.
Next 5 years when we go back to cooler La ninas temps will be in the negatives, thats why there is such desperation now.
When the data shows a halt to Anthropogenic Global Warming I change my mind to Climate Change, Climate Variability or Extreme Weather. What do you do sir?
Brandon Gates April 25, 2015 at 9:01 am
So no refutation of the premise of the article quoted. Just a generalisation of my argument to a “well everybody else does it” accusation.
I am only concerned with a particular case. Tarring me with the same brush as all the denizens here is an Ecological Fallacy.
How to Validate Climate Models: A Fable
A bright young fellow stared a horse-racing fan site and with an offer of a tip-sheet subscription making fantastic claims of parlay runs gathered the e-mail addresses of several thousand horse players. Sticking to predictions (a.k.a. projections) of 8-horse-race results he touted a different winner to 625 each of 5000 subscribers at no charge. To the 625 winners he did the equivalent, this time revealing the winner for a mere $10 PayPal® ‘contribution’ with nothing to lose, 600 of the winners — now believers — paid him a cool $6000 and so he only asked a reasonable $100 of the 70 remaining true-believer winners netting a cool $7000 more from the very happy two-time winners. Now he had 8 remaining three-time winners who were ready to bet big money and therefore to invest a $1000 with our bright young fellow on a sure thing. K-ching, $8000 more! Yes, the actual one remaining winner hit a long shot and was happy to pay $10,000 of his take for the next tip. Okay he lost this time, but he had a shot didn’t he? And our bright young fellow took his $31K and enrolled in grad school where he specialized in statistics and climate modeling.