Guest essay by Viv Forbes

Climate alarmists claim incessantly that all bad weather is caused by man’s use of hydro-carbon fuels – oil, gas and coal.
They insist that man-made carbon dioxide is the trump card in the climate game. Their computerised models of doom assume ever-rising levels of carbon dioxide which will trump all natural climate controllers.
Unfortunately for their credibility, since at least the year 2000 global temperatures have trended level despite significant increases in atmospheric carbon dioxide.
The sun is the primary source of almost all of Earth’s heat. It is becoming increasingly clear that this gigantic heat generator, with its varying cycles and emissions, is an Ace in the climate game.
Then there are the massive oceans, whose vast heat capacity and ever-changing currents and oscillations also regularly trump the steady but tiny influence from man’s industry.
In order to explain the failure of their carbon-centric forecasts, the alarmists have thrown several other wild cards into the climate game. These include heat losses into the deep oceans and unexpected variations in earth’s cover of ice, snow, soot, particulates and volcanic dust.
Finally, they have created their own friendly climate Joker – data manipulation. They deal this card from the bottom of the pack onto the climate table to create artificial warming trends and heat wave “records” on demand.

Obviously there are too many Jokers and Wild Cards in the climate game for one simple carbon-centric theory to win a forecasting game, except by cheating or chance.
This is why warmists have not won a “Forecast-the-Warming” game for at least 15 years.
Further Reading
Bogus data in Australian Temperature Records:
Brisbane temperature benchmarks change daily:
https://kenskingdom.wordpress.com/2015/03/15/how-hot-is-brisbane-with-new-improved-daily-benchmarks/
The climate variables in this planet are so many that no model will have every input. So how can “scientists” expect the models to provide sensible climate outputs. GIGO.
Well, you don’t need a model to see that 2015 is starting off as the hottest year on record.
http://www.ncdc.noaa.gov/cag/time-series/global/globe/land_ocean/ytd/3/1880-2015
Barry, have a look at the bottom of the main post under further reading. that crap is australias contribution to the ncdc record. the land/sea record has been adjusted beyond reason. why on earth would one suggest using that over the satellite data anyway?. just playing silly games with numbers.
Barry, They need this year to be hot, hot, hot to put pressure on the delegates in Paris. It’s crap, man utter rubbish.
(Please, always include a few words of explanation when posting a link. It saves the moderators time. Thanks. ~mod.)
Would that be 10% confidence or have they worked their way up to 30% confidence yet?
Of course, the fact that there are so many “cards in the deck” is reason enough to question the dubious nature of the bet that Anthropogenic Climate Change folks are making with their CO2-centric claims. Despite often stacking the deck, the cards still require one to know the rules of the game.
The numbers alone are enough to toss out the idea that our CO2 is having such an impact. Nature 96% vs. man’s 4%.
What kind of moron would think we know enough to model the climate….
…oh, wait
If you think constraining ECS is a sausage-fest, try asking 10 different economists how to determine an appropriate discount rate in a forward-looking macroeconomic model.
Economists don’t even know what the discount rate means; they think it’s a short-term interest rate. This is one of the greatest blunders in all of monetary theory.
See: Interest vs Discount, and the Continental Divide Between Them
http://www.professorfekete.com/articles/AEFInterestAndDiscount.pdf
Now you understand the belly-laugh I get every time Stealey asks me for a CBA.
And therein lies the futility of talking with any liberal about any boondoggle renewable project that gets fianaced using taxpayer monies….like an article posted sometime back about the Tampa Courthouse getting solar panels at a cost of $1.2MM where the assumption was a $60K savings on power bills going forward. A fancy website showing the utility of the project shows that only $27K per
year is being realized….the actual number is at $25.5K per year….but what liberal cares when someone else’s money is being used.
I started debating someone about the payback period which he cleverly gave as straightline division. When I injected the discount rate of 5% and showed him that the project NEVER pays for itself and that tied to the opportunity costs of doing something else with the money, he couldn’t throat what an other opportunity might be…..such as, buying books for another library or paying down unfunded liabilities….let alone that the present value of a $27K payment 50 years from now is ~$1500! (I would have to get back to my spreadsheet on the actual number)
The point is…..liberals do not understand the cost of money.
So what? Just because something else is harder is not evidence that the circulation models are correct.
The train is leaving the station! As often, it’s a bluff.
======
In Switzerland the train run on time.
Heh, got the effect but not the method from south of the border.
==========
But not in Sweden ! If you wont to get too your destination in time you take car, bus or plane.
its a mess.
I used to regularly change trains in Västerås, and one time, just at the beginning of winter, about half a centimetre of snow had fallen, and my train was late. I asked a porter about it, and he was astonished that I needed to ask.
“It’s all this snow, innit? That’s a nacheral phenomenana, that is, wot we can’t do nuffink about!” he said. (RoHa’s translation)
And I saw his point. How could Swedish Rail possibly anticipate that there could be snow in winter in Sweden, let alone be expected to cope with it?
Is there gravy on it?
NO! It’s in the boat!
Wrong way round Kim: The train will be arriving at this station, it’s a bluff 🙂
A chuff bluff?
But Climate Gone Wild TMI, is my favorite show.
Sometimes I agree with Dr. Roy Spencer: http://www.drroyspencer.com/2015/02/on-natural-climate-variability-and-climate-models/
The point of this post is to remind people of what I have stated before: to the extent that a change in ocean circulation has negated anthropogenic warming in the last 15+ years, an opposite change likely enhanced warming during the 1970s to 1990s.
You can’t have one without the other. Natural fluctuations in ocean vertical circulation are cyclical. You can’t attribute the recent warming hiatus to natural forcings without also addressing the role of potential natural forcings in causing the previous warming period. At best, it betrays a bias in reasoning; at worst, it is logically inconsistent.
Alas, in the very next graf he plays his own trump:
This is not just a minor detail that is irrelevant to long-term climate predictions because the models were mostly developed (and modelers’ opinions regarding sensitivity formed) during a period (the 1970s to 1990s) when substantial natural warming was occurring, yet they assumed it was entirely manmade. Correcting for the mistake would alter our understanding of climate change as well as any proposed energy policies to (supposedly) avert it.
Emphasis in original.
lol, well yes … something that serious climate investigators, including its variability, have been taking into account since … forever, for the express purpose of understanding its effects on the planet.
Anyone who can comprehend a temperature time series longer than 20 years understands the merit of this argument so far as it goes:
http://3.bp.blogspot.com/-MW_NJp28Udc/VNS3EAEqpOI/AAAAAAAAAUs/hjhuLZFkdoM/s1600/hadcrut4%2Bhiatuses.png
Always nice when the opposition sets up my own arguments for me. To wit …
… well yes, “the massive oceans, whose vast heat capacity” just mentioned in the previous quote block will tend to gobble up heat, won’t they.
One wonders why the manipulations don’t better match model output. As well, the informed sceptical truth-seeker will note that while GHCN’s homogenization AlGoreRhythm cools the past …
http://1.bp.blogspot.com/-lwQfxPaXFd0/VNoo9h7vUhI/AAAAAAAAAhA/iW8rexGjbgU/s700/land%2Braw%2Badj.png
… HADSST3 warms it …
http://1.bp.blogspot.com/-HGT605CXR7w/VNoo9mjLeuI/AAAAAAAAAg8/QK_0C_L-hYc/s700/ocean%2Braw%2Badj.png
… with the net effect on GAST anomaly being one of overall cooling:
http://4.bp.blogspot.com/-opy7LoBO__w/VNoo9u5ynhI/AAAAAAAAAg4/_DCE5Rzm9Fw/s700/land%2Bocean%2Braw%2Badj.png
The thesis of this article simply does not add up to anything remotely compelling. It’s all but self-refuting by my reading of it.
If I were a skeptic, this blog would convert me to an AGW believer. It’s level of self-refutation, as Gates puts it, is astounding.
He didn’t show a CO2 connection to temperature increase. The Modern Warming trend showed up, as it was supposed to,as shown by past climate fluctuations of around a 900-1,100 years cycle.
Note that Minoan warming,Roman Warming, Medievel Warming all occurred around 1,000 years apart.
What is astounding is that those who subscribe to the AGW conjecture,with the still missing positive feedback loop,continue to overrate the trace molecule,with its demonstrated minor IR absorption rate, of the total leaving the planet.
CO2 by itself has very minor warm forcing effect,thus can’t be the climate engine, some have amazingly claimed. It is the POSITIVE Feedback loop, that AGW believers builds their hope on,something that has no demonstrated past history to refer to. It is all models all the way down, with no testable value to build on.
What’s more, there are still no empirical, testable measurements of AGW. Therefore, AGW must be very small. As Willis points out, CO2 is a 3rd-order forcing, which is swamped by 2nd-order forcings. Those are both swamped by 1st-order forcings. The temperature rise at these levels is minuscule:
Even if CO2 went up to five or six hundred ppm, the temperature rise would be too small to measure. Thus, CO2 is completely over-rated as a global warming agent.
dbstealey,
Still waiting for you to tell us how they were measured.
Gates,
Sure, no problem. Just as soon as you produce the first empirical, testable measurement quantifying whatever fraction of total global warming you believe AGW is.a measurement quantifying MMGW. I asked first. For years. And many, many times. So you answer first.
Anyone who provides a measurement like that, acceptable to the scientific community in general will surely win a Nobel Prize. For one thing, it will tell us exactly what the climate sensitivity number is. Right now that number is all over the map, depending on who you ask.
More and more it’s looking like AGW is *very* small.
dbstealey,
You claim that the above chart is consistent with observation. Where are these measurements already?
Gates,
I’ve asked my question for years with no anwer.
What is it about “you first” that you don’t understand?
dbstealey,
I have answered you several times. Attribution is an estimate, not a direct measurement. I get it that’s not good enough for you, but that’s irrelevant here because — recently you have claimed that your CO2 log plot conforms to observations. Your claim, your burden of proof. Where are these observations which confirm that 0.5 * ln(CO2) is a good predictor of temperature?
Gates,
I don’t predict future temperatures. I point out that the alarmist crowd has been totally wrong in their predictions.
Next, with very few exceptions (the uncertainty principle; measurements that are too small for current instrumentation), everything in science can be measured. $Billions are spent trying to measure subatomic particles, and measurements are involved in every facet of science. The fact that MMGW cannot be measured causes endless consternation among the alarmist cult, but only because they refuse to see the obvious: MMGW is too minuscule to measure. Since AGW cannot be measured, it is ipso facto either too small to measure, or it doesn’t exist.
If changes in global temperature tracked changes in CO2, that would be extremely strong evidence that CO2 has the claimed effect. If changes in global T were half the ∆CO2, that would be strong evidence that AGW was 50% of total warming.
But the only correlation for which there is any measurable evidence shows that ∆CO2 follows ∆T. There is no evidence that ∆CO2 is the cause of ∆T. None at all. For rational folks, that is extremely convincing. Only those who BELIEVE in the ‘carbon’ narrative are convinced that CO2 is the major cause of global warming. But of course, belief is religion, not science. It is total confirmation bias.
Finally, the alarmists are always trying to frame the debate as something that must be proven by scientific skeptics. But saying it repeatedly doesn’t make it true. The entire debate is over man-made global warming (MMGW). Without that narrative, everyone would be discussing something else.
It never seems to sink in: skeptics have nothing to prove. The onus for MMGW is entirely on those who argue that it is occurring, and that it is significant. Since they have never been able to make a case using empirical evidence and verifiable measurements, they try to turn the argument upside down, and make skeptics prove a negative.
That doen’t work, and it will never work. Either MMGW can be shown to exist by measuring it, or it is either too small to measure, or non-existent. Repeatedly asserting anything else is no more than alarmist rhetoric.
The way I’se got it figured is, …….
if the H2O vapor (humidity) can increase from 400 ppm to 25,000 ppm and the increased warmth (temperature) won’t burn the socks off your feet …..
then the CO2 can increase from 400 ppm to 1,000 ppm and the increased warmth (temperature) won’t be enough to feel on the tippy end of your little toe.
dbstealey,
I repeat: Where are these observations which confirm that 0.5 * ln(CO2) is a good predictor of temperature?
Try answering the question this time.
Gates,
You must be operating under the delusion that you set the rules here. You don’t.
I’ve told you several times now: when you answer my question, then I’ll answer yours. But you keep digging that hole.
Question: can you produce empirical, testable measurements acceptable to the scientific community, quantifying AGW?
You’ve pretended to try, but if you really had such measurements, then we would know the specific climate sensitivity number. Right now that guesstimate is all over the map, depending on who you ask.
As I’ve said many times, I accept Prof. Richard Lindzen’s *estimate* of the sensitivity number. You have a problem with that. I suggest contacting him instead of pestering me with your inane, pointless and incessant commentary. Maybe you care; I don’t.
dbstealey,
I have answered that question already: Attribution is an estimate, not a direct measurement.
Again I repeat: Where are these observations which confirm that 0.5 * ln(CO2) is a good predictor of temperature? You said yourself: Those charts accurately reflect observations.
http://wattsupwiththat.com/2015/04/16/climate-naysayers-are-giving-climate-skeptics-a-bad-name/#comment-1908991
Where are these observations already? I’d really like to know, because it sure sounds to me like you’ve stumbled on a way to “produce empirical, testable measurements acceptable to the scientific community, quantifying AGW.”
I personally think you’re just blathering made-up truthy-sounding nonsense as usual. So please, by all means, prove me wrong.
Gates says:
I have answered that question already
As usual: Wrong.
All you did was show that you cannot answer the question. If something in science exists, it can usually be measured (unless it’s just too small for current instrumentation).
You claim MMGW exists. I say, show me. I want to see it. But you can’t. You expect skeptics to take your religious belief as evidence. Sorry, it doesn’t work that way. You’ve got nothin’ — except your incessant, non-stop, interminable commentary that means nothing, and is completely unconvincing as always.
By the way, Sunstettommy is running circles around you. A smart guy in your position would give it up.
@ dbstealey
I feel your frustration, ….. it’s kinda like trying to nail Jell-O to the wall of a moving partition inside of a round-house.
I would like to think that most of us here understand the basics of the PDO by now.
Can you predict it?
Can the models?
Not at present, which is one reason why I am asking … but not the main one.
Brandon Gates
April 18, 2015 at 3:24 pm
Can you predict it?
NO, in much the same way as GISS, NOAA et al have never been able to predict Niño/a more than 6 months in advance. They have sent up manby prayer for a super-mega niño but they just don’t arrive.
Stephen Richards,
No need to repeat what I’ve already stipulated: PDO is a mode of internal variability. We’re not presently able to predict it, nor AMO, nor ENSO.
You’re now the second person in this subthread to miss the point of my asking the predictability question. Here, I’ll rephrase it:
evanmjones wrote: I would like to think that most of us here understand the basics of the PDO by now.
Is predictability a strict requirement of understanding, or isn’t it?
Gates, since you admit that the models can’t handle the PDO, perhaps we should table this whole AGW nonsense until they can.
In all that time, you failed to show that it is a trace gas, that caused the warming.
sunsettommy,
Harries et al. (2001) was published 14 years ago:
https://workspace.imperial.ac.uk/physics/Public/spat/John/Increase%20in%20greenhouse%20forcing%20inferred%20from%20the%20outgoing%20longwave%20radiation%20spectra%20of%20the%20Earth%20in%201970%20and%201997.pdf
In all that time, have you failed to read it?
Did you bother to notice that the postulated warm forcing inferred for CO2,in the paper, is very small?
Where is the “Hot Spot”?
Where is the much talked about POSITIVE Feedback Loop?
Where is the strong deviation upward,from past warming trends, since the 1850’s?
The past during this interglacial period show no connection between CO2 changes and temperature changes:
Are Modern Temperatures “Unprecedented”? Greenland Ice Core Research Finds They’re Not Even Close, U.S. Climate Agency
“Read here, here and here. The UN’s IPCC political leaders, bureaucrats and the Climategate scientists have said for years that today’s temperatures are “unprecedented.” They also claim that all temperatures to the right of the black-dash line on the graph below are natural; and, all temperatures to the left of the black-dash line are unnatural, due to human CO2. The past visible history (as shown) of temperature records makes both these claims flat-out lies. The historical record also indicates that temperatures fluctuate up and down without any relationship to the CO2 level. (click on image to enlarge)”
http://www.c3headlines.com/2009/12/are-modern-temperatures-unprecedented-us-govt-greenland-ice-core-research-finds-theyre-not-even-clos.html
Greenland Ice Core shows significant Temperature variability over the thousands of years,while CO2 levels in the atmosphere hardly change at all.
Since AGW believers for years have claimed that the CO2 levels changed very little up the late 1800’s,from around 180 ppm to around 280 ppm by the 1880’s,with most of the change upward occurring in the first couple thousand years or so.
Where did all those large temperature fluctuations come from,if CO2 is NOT the culprit?
sunsettommy,
I bothered to notice that they noted the decrease in observed brightness temperatures were “significant” and where models expected that they would be. For forcing calculations, we can go to Evans (2006): https://ams.confex.com/ams/Annual2006/techprogram/paper_100737.htm
A comparison between our measurements of surface forcing emission and measurements of radiative trapping absorption from the IMG satellite instrument shows reasonable agreement. The experimental fluxes are simulated well by the FASCOD3 radiation code. This code has been used to calculate the model predicted increase in surface radiative forcing since 1850 to be 2.55 W/m2. In comparison, an ensemble summary of our measurements indicates that an energy flux imbalance of 3.5 W/m2 has been created by anthropogenic emissions of greenhouse gases since 1850. This experimental data should effectively end the argument by skeptics that no experimental evidence exists for the connection between greenhouse gas increases in the atmosphere and global warming.
He’s such an optimist ….
Going from the ground may be the better way to go. Feldman et al. (2015): http://www.nature.com/nature/journal/vaop/ncurrent/full/nature14240.html
The time series both show statistically significant trends of 0.2 W m−2 per decade (with respective uncertainties of ±0.06 W m−2 per decade and ±0.07 W m−2 per decade) and have seasonal ranges of 0.1–0.2 W m−2. This is approximately ten per cent of the trend in downwelling longwave radiation. These results confirm theoretical predictions of the atmospheric greenhouse effect due to anthropogenic emissions, and provide empirical evidence of how rising CO2 levels, mediated by temporal variations due to photosynthesis and respiration, are affecting the surface energy balance.
You’re Gish Galloping. But if you insist, Po-Chedley (2015): http://www.atmos.uw.edu/~qfu/Publications/jtech.pochedley.2015.pdf
Dang, you expect a lot of information to be crammed into one paper, don’t you. Go read any IPCC AR WGI report, you can’t miss discussions of feedbacks.
Seriously?
http://climexp.knmi.nl/data/ihadcrut4_ns_avg.png
http://climexp.knmi.nl/data/igsl.png
Yes, the Sun is a factor …
http://climexp.knmi.nl/data/itsi_wls_ann.png
… but bearing in mind you need to divide TSI by 4 to account for geometry, it doesn’t even come close to a 3.5 W/m^2 difference from 1850.
In all that time, you failed to show that it is a trace gas, that caused the warming.
Arrhenius’ experiments are reproduceable. Recently the mechanism has been observed in the field. That is good evidence, and correlates well with empirical observations..
Brandon, your paper talked about a variety of “Greenhouse” gases, while I was talking about CO2 only. You failed to show the significance of it. Collectively they still show a small increase. Skeptics have long accepted a small warm forcing effect from CO2 itself, but dispute the never seen dominant Positive feed back loop, that AGW believers are waiting to show up.
The “Hot Spot” as according to the IPCC is far warmer than what YOU showed in your link,it is still failing to support the AGW narrative, that CO2 is a strong driver of temperature change in the tropics.Here is what the IPCC actually said: “The ability to distinguish between climate responses to different external forcing factors in observations depends on the extent to which those responses are distinct (see, e.g., Section 9.4.1.4 and Appendix 9.A). Figure 9.1 illustrates the zonal average temperature response in the PCM model (see Table 8.1 for model details) to several different forcing agents over the last 100 years, while Figure 9.2 illustrates the zonal average temperature response in the Commonwealth Scientific and Industrial Research Organisation (CSIRO) atmospheric model (when coupled to a simple mixed layer ocean model) to fossil fuel black carbon and organic matter, and to the combined effect of these forcings together with biomass burning aerosols (Penner et al., 2007). These figures indicate that the modelled vertical and zonal average signature of the temperature response should depend on the forcings. The major features shown in Figure 9.1 are robust to using different climate models. On the other hand, the response to black carbon forcing has not been widely examined and therefore the features in Figure 9.2 may be model dependent. Nevertheless, the response to black carbon forcings appears to be small.” They show a chart where they say CO2 is the one that causes the hot spot.
However actual data shows no such spot at all,as shown in this link,where the Radiosonde data shows minimal warming: The missing hotspot http://joannenova.com.au/2008/10/the-missing-hotspot/
I had to cut and paste this part (The link) because the two links inside, have been shut down,but the charts and data are still visible.
It is clear to you, there is still no positive feed back loop, as predicted by the AGW conjecture,to be in force or you would have pointed it out. That alone relegates CO2 to the status of a minor warm forcing agent,the very point most skeptics have been saying for years. Positive Feed back loop has yet to show up.
Dr. Jones himself stated in his BBC interview with Roger Harrabin, that ALL of the short warming periods,dating back to the mid 180’s are statistically similar with each other. Here is the link and quote from the Interview:
The Question,
“A – Do you agree that according to the global temperature record used by the IPCC, the rates of global warming from 1860-1880, 1910-1940 and 1975-1998 were identical?”
His answer in part,
“….So, in answer to the question, the warming rates for all 4 periods are similar and not statistically significantly different from each other.
Here are the trends and significances for each period:”
He then shows the list of trends and they are the following: 1860-1880 .163 C per decade warming
1910-1940 .15 C per decade warming, 1975-1998 .166 C per decade warming, 1975-2009 .161 C per decade warming.
http://news.bbc.co.uk/2/hi/8511670.stm
Dr. Jones a noted AGW believer admits there are no significant differences in the periodic warming trends, back to the 1800’s.
Here is a chart that drives the point home clearly: http://globalwarmingskeptics.info/thread-1103-post-8790.html#pid8790
You have failed miserably to show any significant AGW effect on the weather at all. I have showed you this and you completely IGNORED it because it is a catastrophic devastation to the AGW conjecture with that never before existing dominant Positive feedback loop.
“For the next two decades, a warming of about 0.2°C per decade is projected for a range of SRES emission scenarios. Even if the concentrations of all greenhouse gases and aerosols had been kept constant at year 2000 levels, a further warming of about 0.1°C per decade would be expected.”
http://www.ipcc.ch/publications_and_data/ar4/wg1/en/spmsspm-projections-of.html
Temperature data shows no warming at all:
http://www.woodfortrees.org/plot/hadcrut4gl/from:2001/to:2015.3/plot/hadcrut4gl/from:2001/to:2015.3/trend/plot/rss/from:2001/to:2015.3/plot/rss/from:2001/to:2015.3/trend
You keep relying on modeled papers,while I rely on actual temperature data showing no such CO2 effect driving the weather or climate.
Unfortunately, the IPCC made a rather specific temperature projection for the first two decades of this century of about .35C warming to this time frame:
“For the next two decades, a warming of about 0.2°C per decade is projected for a range of SRES emission scenarios. Even if the concentrations of all greenhouse gases and aerosols had been kept constant at year 2000 levels, a further warming of about 0.1°C per decade would be expected.”
But the reality is no warming at all since 2001,a direct refutation of the AGW conjecture the IPCC build on for their many models they rely on for future forecasts:
http://www.woodfortrees.org/plot/hadcrut4gl/from:2001/to:2015.3/plot/hadcrut4gl/from:2001/to:2015.3/trend/plot/rss/from:2001/to:2015.3/plot/rss/from:2001/to:2015.3/trend
How can I take AGW believers seriously, when you have MANY demonstrated modeling failures to explain?
sunsettommy,
Rational people get it that simulating a planet isn’t the sort of thing one does successfully in their spare time. And certainly not on the 1st try.
Brandon Gates says —
“Rational people get it that simulating a planet isn’t the sort of thing one does successfully in their spare time. And certainly not on the first try.”
So Brandon you must think it a total inanity to use the predictions of such flawed models as a reason to institute laws and regulations that will stifle economic growth world wide, condemn the third world to eternal poverty and actually lead to ten of millions of deaths?
Remember, Brandon, those models are used to justify just such laws and regulations. So you must believe that the governments of the world should not be passing any form of climate laws and regulations, right? To do, based on “first try” models would be irrational, right?
Eugene WR Gallun
@Eugene WR Gallun. And what solution do you propose? And what is your source or data for such an astounding claim of world poverty if those solutions are put in place?
warrenlb says:
…what is your source or data for such an astounding claim of world poverty if those solutions are put in place?
It’s covered in Econ 1A. Read up on Bastiat’s Broken Window Fallacy.
Eugene WR Gallun,
warrenlb has it pretty much covered, but I’ll double-down. We’re up to CMIP5, having skipped CMIP4 that’s the 4th generation, so this is far from the first try. We also make policy decisions on far less substantial information. Every Fed announcement for starters. Even the infallible Greenspan had to recant under the glare of the hot lights in front of Congress. That one cost me a pretty penny, let me tell you. Not so close to home, but far more costly overall: yellocake uranium, aluminum tubes and smoking guns in the shape of mushrooms. The oil still hasn’t paid for it yet, either. Not that $2 trillion and counting is the biggest tragedy, by far.
The physics packages I stand behind are the easiest part of all this in my view. The human animal en masse … not so much. Think stock markets.
I end with this: we don’t need the models to look into the rear-view mirror. 300-350 ppmv looks to be nice and comfy to me. 560 ppmv? Haven’t seen it in millions of years. We’ve got very little basis for comparison.
Try being consistent about what is predictable and what isn’t if you want to be seen as rational.
@ Brandon,
Who is this “we” of which you speak ?
Brandon says the modellers are hobbyists who do AGW in their spare time and this is their first attempt and that we really have no better choice than to knot our knickers according to IPCC schedule.
He was inspired by warrenlb, a mascot of the Please, panic promptly team.
To Brandon Gates
You replied to my post and apparently you do think it rational to use “first try” models you admit don’t work as an excuse to pass laws and regulations that will have a devastating effect on the world economy.
Brandon, the problem is in the “first try” models that you admit don’t work — not in the real world. (Haven’t you noticed that the real world is dong just fine? None of the crazy climate predictions of those models have ever come true.) The first step in a solution is to delete CO2 as the prime mover in those models. CO2 ain’t important, get it? (Maybe that should be the second step. First step would be to fire all the current climate modelers.)
World development depends on abundant cheap energy. Abundant cheap energy is what lifts nations out of third world status. Developed nations have lower birth rates. Scarce, high cost energy will cause world development to collapse. Grinding poverty and high birth rates will return to the developing world. “Watts Up With That” in its archives has several excellent articles that lay it all out — but the relationship between poverty, high births rates and short life span must of course be already known to you.
So the problem is not in the real world, the problem is in the models. Fix the models and their pseudo-problems will disappear.
Eugene WR Gallun
To warrenlb and Brandon Gates
Yikes!!!!!! I addressed my reply to Brandon Gates when it should have been addressed to warrenlb. So sorry
Eugene WR Gallun
To Brandon Gates —
This time I am replying to your post and not to warrenlb.
YOU’RE THE ONE WHO CALLED THE CLIMATE MODELS “FIRST TRY MODELS” not me. Got that? So when you realized that the truth bites you try to run it back claiming you are up to your fourth attempt?
A change that is no change is no change. These models all use CO2 as the fundamental driver. You know what they say — doing the same thing over and over again and expecting a different result IS INSANITY!.
You have models THAT CAN’T PREDICT THE PRESENT and you expect us to believe that they have the efficiency to predict a hundred year in the future? Have you become so obsessed with models that you live in their virtual world like it were some “matrix”? You need to take a pill to get you back into the real world! (Yes, I am suggesting that maybe you need to see a doctor and get some meds proscribed.)
u.k.(us),
The Royal We. Not really. I consider it a given of human nature that hindsight is always more accurate than foresight. I sometimes despair that the blindingly obvious needs explaining.
mebbe,
Wrong. Read it again. Try crossing your eyes or something this time, it might help.
Eugene WR Gallun,
What model tells you that the world economy will be destroyed?
Sorry, but Arrhenius called it in 1896. Every model since then has been about being less wrong, including Arrhenius’ 1906 paper. Hansen B, 1988 was pretty close to being on the money, but he was right for the wrong reasons. Science is iterative, and it never gets things 100% absolutely correct, especially when such a concept as an entire freaking planet is the scope of the study. If you don’t understand that, you’ve no business discussing science with me or anyone.
Models don’t determine reality. Reality determines reality.
a) There’s no need to shout.
b) I need to remember that when writing to the hair-splitting pedantry brigade that I shouldn’t be so metaphorical.
I expect honest truth-seekers who really care about a particular issue to educate themselves and not use the same tired nonsensical memes over and over and over and over again even after they’ve been given the answer 1,000 times. Go read about internal variability (again?), and its presently inherent annual/decadal unpredictability (again?), then come back when you’ve got something different to say.
Eugene WR Gallun,
I skipped over this section first pass, and on review realize that I should not have. This will not be short, nor to the point … it’s late and I’m a bit pissed off.
No argument here.
The third world has bigger problems than energy availability in my view. Not least of which — and here I’m mostly thinking of Africa — they have learned the hard way that the independence they (understandably and rightfully) sought from the colonial powers put the onus on them to be effective self-governors. This, by and large, they have failed to be able to achieve. As such, I’m not much interested in helping them sort out their own messes and frankly, I seriously doubt you are either. I think most Americans don’t really give a rat’s ass for Africa until a political gambit makes it convenient to do so. Rwanda anyone? Darfur? Yeah, exactly what I thought.
Partially a lifestyle choice, mostly because children in developed nations are net financial drains not assets like they are in the third world.
All you’re doing is pushing the inevitable into the future then. Thoughtlessly spewing slogans crafted by people with vested financial interests in us continuing to buy their products isn’t the way forward here.
Recognizing that “my side” of this debate arguably does the same thing, I read the literature. The literature says we’ve probably got a problem which needs to be addressed soonish rather than laterish. I don’t want to wreck the economy doing it. I don’t think a carbon pricing scheme would do so, however I don’t think a carbon tax has a snowball’s chance in Hades of being passed in the US any time in the foreseeable future. The writing on that wall has been there worldwide since Kyoto in 1992. I don’t expect Paris 2015 to be much different.
In short, I am not seriously riding that bandwagon. The top-down global approach has not been working for on the order of a quarter century — time the literature says we may not have. My emerging view is that it needs to be more bottom-up, and that it is in the best interests of these United States to lead by subsidizing innovation/deployment and doing an as orderly as possible planned cutover to mainly nuclear and geothermal. I’m not even thinking about liquid fuels for surface transport at the moment, the electrical grid is easiest to deal with and the most in reach with present-day off-the-shelf technology.
What we develop with some help from the taxpayer coffers should be saleable products in the worldwide market. Because of the dysfunctional nitwittery of our highly polarized, bought and paid for, Federal legislature, I believe we’re seriously in danger of letting the EU and China get ahead of us. That’s NOT the place that I want to be. Whether you like it or not, whether you see it or not, the rest of the world is not as parochial and stupidly short-sighted as the Twittering buffoons currently infesting the majority of both houses of Congress … and not nearly as incompetent as the Chief Executive mouth-frother has proven to be. Actually, that latter one you’d probably agree with. Bless the man, he gives a good speech but never has learned how to reliably follow up.
If we build it, the world will buy it. We know this already from past history of selling stuff to the rest of the planet.
Let Africa follow when they’re ready and when economies of scale have brought newer technologies down to price levels that are competitive with burning animal dung. Coal likely isn’t going to “save” them — distributed power networks cost a bundle to build out and maintain. Have you thought about the needed infrastructure? I’m thinking not.
With Boko Haram and like bands of hooligans running amok they would also be all but impossible to defend. Africa will get nukes during my lifetime over my dead body — it’s not a solution for them in the near term. For the way far out regions, solar makes perfect sense. At night or during periods of inclement weather, the rusty trusty diesel generator will still be there standing at the ready. It’s not a total solution, but every little bit helps and I’m not big on all-or-nothing thinking — that’s part of the reason why I think we’ve been in this 25 years of gridlock to begin with.
But as I said, I don’t think much about Africa … we’ve got to help ourselves first before we can help anyone else. If we don’t do that, we’ll be the one buying the stuff from elsewhere, and in my mind, there’s already too much stuff in our marketplaces stamped with Made in China.
Brandon Gates
You write
Most of your stuff is not short and not to the point so why mention it this time?
And it seems you may have tried to proof read what you wrote because people get “pissed off” by your posts which are usually irrelevant drivel that mostly consists of long passages you don’t understand but copy&paste from elsewhere.
Don’t waste the space on threads that is taken up by your posts if you don’t want them to make you “pissed off”. Just go away instead.
Richard
richardscourtney,
Most of your posts to me of late exhibit nothing of content … they’re just drivel about my alleged drivel. I suggest you take your own advice and simply not read me.
In response to Eugene Gallun’s common sense comment that Africa needs cheap energy, Gates goes into his typical long, off-topic, rambling response:
The third world has bigger problems than energy availability in my view. Not least of which — and here I’m mostly thinking of Africa — they have learned the hard way that the independence they (understandably and rightfully) sought from the colonial powers put the onus on them to be effective self-governors. This, by and large, they have failed to be able to achieve… &etc., etc., etc. And etc.
The comment was that poor countries need cheap energy to raise their standard of living. Not what kind of government they have, or the EU, or China, or Boko Haram, etc.
That’s what is so frustrating. Reams of pixels that go off on endless tangents and which settle nothing. I suppose it adds some small amount to the site traffic. But it’s no more than a stream-of-consciousness rant that convinces no one of anything.
That was a terrible reply Brandon,since it was coming from the IPCC report that I quoted.
“For the next two decades, a warming of about 0.2°C per decade is projected for a range of SRES emission scenarios. Even if the concentrations of all greenhouse gases and aerosols had been kept constant at year 2000 levels, a further warming of about 0.1°C per decade would be expected.”
http://www.ipcc.ch/publications_and_data/ar4/wg1/en/spmsspm-projections-of.html
They say WOULD BE EXPECTED, if……..
Why can’t you admit the short term IPCC projection, is an epic fail and go on? Or are you going to say the temperature data from HadleyCrut4 and RSS are wrong?
http://www.woodfortrees.org/plot/hadcrut4gl/from:2001/to:2015.3/plot/hadcrut4gl/from:2001/to:2015.3/trend/plot/rss/from:2001/to:2015.3/plot/rss/from:2001/to:2015.3/trend
@dbstealey and Eugene WR Gallun: So your position is it’s OK to claim the solutions to AGW will induce poverty without specifying what solutions, how they are to be implemented, or what Economic studies make those conclusions.
warrenlb,
• Neither you nor anyone else has ever measured AGW. You have no idea if it matters. Based on all evidence, it doen’t matter.
• Expensive energy will bring about poverty.
• Cheap energy is the single biggest factor in a nation’s increasing wealth.
• Reducing CO2 emissions will not only cause poverty, it will also cause starvation in the poorest countries.
The “carbon” scare is based on falsified catastrophic AGW predictions, not one of which have ever come true. Reducing CO2 output is a direct consequence of the AGW scare. That is its purpose. Hatred of humanity is part of that equation.
The only verifiable evidence we have regarding CO2 is that it is beneficial to the biosphere; more is better, and the rise in CO2 has caused agricultural productivity to rise right along with it. There is less starvation in the world as a direct result of more CO2.
There has never been any global harm identified due to the rise in CO2. Rational folks conclude that CO2 is “harmless”, especially since the rise is measured in parts per million. It is a tiny trace gas that does not do what is claimed regarding global warming. Further, changes in CO2 always follow changes in temperature. The alarmist crowd got cause and effect backward.
CO2 is just as essential to life on earth as H2O is. But for entirely political and self-serving purposes, CO2 has been demonized. The people who buy into that scare are either scientifically ignorant, or they have serious mental and social problems — or they are using it as their agenda to achieve global power.
On net balance, CO2 is an unmitigated good. There is zero downside to emitting more of it. The past eighteen years proves beyond any doubt that the rise in CO2 has not caused any identifiable global warming. That narrative has been completely debunked.
Finally, even if the purveyors of the ‘carbon’ scare could find any problem from adding more parts per million of CO2, they never consider any cost/benefit analysis. To them, it is completely evil, with no possible good associated with it.
Inescapable conclusion: The climate alarmist crowd is wrong about everything. As always.
@dbstealey. I love your unsupported rant about how an unspecified solution to AGW will end prosperity as we know it, without any sources or Economic studies referenced. Its of a piece with your absurd claims about the behavior of the Climate — you’re not a Scientist and have no idea about the behavior of the Climate, yet you ‘know’ that dangerous AGW –as concluded by every peer-reviewed study and Institution of Science on the planet – is false. And your justification for that position is that there is no ‘testable measurement’ of AGW, as if it’s a problem in metrology instead of a multi-disciplinary conclusion from many lines of evidence and explained by the underlying physics. Dunning-Kruger is a psychology in which the less one knows, the stronger their views. You certainly qualify.
sunsettommy,
AR4 hmmm? Based on CMIP3, yes?
http://www.climatechange2013.org/images/figures/WGI_AR5_FigFAQ10.1-1.jpg
CMIP3 a tenth of a degree hotter than CMIP5. Science is iterative. Doesn’t get things right on the first try. Sometimes not the 4th try. IPCC notes in AR5 when it was published that CMIP5 runs ~10% hotter than it should based on observation. Am I getting through yet?
Well, that would be because the IPCC make it very clear that it’s not yet possible for them to predict internal variability. It’s easy for you to “falsify” your strawman hypothesis of AGW, isn’t it.
I trust HADCRUT4 and RSS just fine. Unfortunately, the satellite record doesn’t show the part of the surface record you cherry-picked out:
http://3.bp.blogspot.com/-MW_NJp28Udc/VNS3EAEqpOI/AAAAAAAAAUs/hjhuLZFkdoM/s1600/hadcrut4%2Bhiatuses.png
Two 40 year pauses, each followed by rising temperatures resulting in the next pause happening higher than the previous.
Are you going to say the temperature data from HadleyCrut4 is wrong?
warrenlb,
I note that you always hide out when anyone asks you for your accomplishments and your education.
You are badly afflicted with psychological projection, always imputing your own faults onto others. If it were not for your constant Appeal to Authority logical fallacies, you wouldn’t have much to say. Those fallacies are only exceeded by your psychological projection.
Certainly it is projection for you to accuse anyone of being afflicted by Dunning-Kruger, since that effect permeates all your comments. And it’s clear you know nothing whatever of Metrology, which forms the basis of all calibration. You don’t know this because you’re ignorant, but most readers know that satellites could not operate without rigorous, traceable calibration. The fact that you downplay it demonstrates your scientific illiteracy, which always seems to be on display.
Yes, I know plenty about calibration and Metrology. You don’t. In fact, you appear to know nothing about those subjects at all. You are incapable of showing any global harm due to the rise in CO2 — the basis for the entire climate scare. There is zero indication that CO2 is not completely harmless at current or projected concentrations.
And you keep squirming around, trying to avoid the plain fact that there isn’t a single credible measurement of AGW. Not one. There are as many measurements of MMGW as there are of unicorn farts. But you don’t need any measurements, because that’s what real scientists need. All you need is your eco-religion.
After following your baseless opinions for a few months now, it is crystal clear that you are an uneducated know-nothing, with a religious conversion to climate alarmism. No wonder you have no credibility. You have no real understanding of science or economics (my minor). In reality, you’re nothing but a crank.
warrenlb: Rational people wait for proof that there is a problem before they decide to restructure the entire world’s economy to fix that problem.
There is no evidence that we need to do anything at all.
BTW, if you really believe that making energy expensive and unreliable will have no impact on the economy, then you are nuts.
Was there a point you were trying to make or did it slip away into the Twilight Zone. You took up all of this space and said nothing.
Gates ays:
… I read the literature. The literature says we’ve probably got a problem which needs to be addressed soonish rather than laterish.
Yep. That’s what ‘the literature’ says. Of course, it’s self-serving rank speculation trolling for grant loot. But yeah, that’s what ‘the literature’ says. Some of it, anyway.
To Brandon Gates —
You really say dumb stuff, you know.
1) You ask, “What model tells you that the world economy will be destroyed?”.
“Model! We don’t need no stinkin’ model.” We can look at the rise and fall in oil prices and compare it to surges and slowdowns in the global economy. We can look at the situation the Germans have got themselves into with their turn to green energy — their goods are no longer competitive in the world market. We can look at the surge of people in England who have been unable to heat their homes this winter due to higher energy costs instituted by their government. Food prices are rising worldwide meaning the poor get even less to eat.(though the recent drop in oil prices will give the poor a break.)
The world economy and the people of the world prosper when energy is cheap. As it rises in price the world economy falters and people suffer. And the real surge in energy prices caused by crazy green energy policies has not even begun yet. You reply to one of my statements with the words, “Models don’t determine reality. Reality determines reality.” I am talking about reality. It is you who are talking about models.
2) I said, “Fix the models and their pseudo-problems will disappear” and you replied, “Model don’t determine reality. Reality determines reality.”
That is the basis of science. If the data refutes the hypothesis the hypothesis is wrong. The models all predict that rising CO2 with cause unrelenting rising temperature. Temperatures have been flat for 17-20 years even though CO2 levels have continued to rise. Therefore the hypothesis the models rely on has been falsified at better than a 95% level of certainty. A hypothesis doesn’t get more wrong than that, buddy.
So I say again fix the models and their pseudo-problems will disappear. You fix the models by deleting CO2 as a major cause of warming. The idea that it is a major cause of warming has been falsified. Get it?
3) I pointed out to you that you were the one who called climate models “first try models”.You have now replied to that by saying, “I need to remember that when writing to the hair-splitting pedantry brigade that I shouldn’t be so metaphorical.”
Do you even know what a metaphor is? God, the self-satisfied ignorance, it burns. A good definition is — a metaphor is a figure of speech that identifies something as being the same as some unrelated thing for rhetorical effect thus highlighting the similarities. So you were metaphorically comparing climate models to “first try models” — meaning that climate models and “first try models have great similarities. “First try models” are generally considered to be highly flawed and not reflective of reality. So climate models, according to you, are the same — highly flawed and not reflective of reality. At least you were being 100% honest even though you didn’t realize it and now are trying to denied it.
4)i said, you have models THAT CAN’T PREDICT THE PRESENT and you expect us to believe that they have the efficjency to predict a hundred years in the future? You replied saying partly, “Go read about internal variability (again?) and its presently inherent annual/decadal unpredictability.(again?).” (I don’t get the “agains” but then most of what you say doesn’t make much sense.)
Got to laugh at you. The model are based on the premise that rises in CO2 cause rises in temperature. Only when this did not happen (and the models were falsified) did all sorts of excuses start to appear from people like you. The heat is hiding in the arctic (where conveniently there are no sensors to measure it). The heat is hiding in the deep oceans (again where conveniently there are no sensors to measure it). The models have an annual/decadal unpredictability (temperatures have not been rising for 17-20 years, that is the present your models did not predict.)
Now if you want to be honest admit that the annual/decadal unpredictability you talk about was solely concerned with the amount temperatures would rise and an actual cessation of rising temperature was never ever even considered by the modelers. None of the models predicted a cessation of temperature rise. Go ahead, prove yourself an honest man by admitting that. Your talk about “annual/decadal unpredictability” is just so much bullshit. The models have been falsified.
So I say to you again — you have models THAT CAN’T PREDICT THE PRESENT and you expect us to believe that they have the efficiency to predict a hundred years in the future?
Eugene WR Gallun
I am too tired to proofread this.
.
Eugene WR Gallun,
Model ensembles project an unrelenting rise becaue the internal variability gets smoothed out. You were supposed to read about internal variability, remember?
Yes. Not to be taken literally, which you insist on doing in the case of “certainly not on the first try”. We didn’t get it on the first try — whichever model one chooses for “first” — and we don’t have it now. We’re NEVER going to get it exactly right because models are always wrong, especially for such a large, massive and complex system. Are you happy now? Can we move beyond the hair-splitting trivial objections already?
Thank you.
What part of internal variability is not presently predictable do you not understand?
Not really. The IPCC are very clear that what they produce are projections based on a number of assumptions about future emissions which we cannot possibly know. I consistently argue that such forward-looking uncertainties are about the best case for stabilizing CO2 that I can think of. Doesn’t work for people like you because you can’t get it out of your head that a 20 year pause in surface temps is twice precedented in the instrumental record …
http://3.bp.blogspot.com/-MW_NJp28Udc/VNS3EAEqpOI/AAAAAAAAAUs/hjhuLZFkdoM/s1600/hadcrut4%2Bhiatuses.png
… and that below the surface there isn’t a Pause in sight:
http://climexp.knmi.nl/data/itemp2000_global.png
Brandon Gates
As usual, you cite information you don’t understand when you reply to Eugene WR Gallun having written
Clearly, Eugene WR Gallun was writing about the most recent “17-20 years” and what the models “all predict”. He was not talking about the suggestions of “model ensembles”, but you replied saying
You are wrong and the IPCC says Eugene WR Gallun is right.
The explanation for this is in IPCC AR4 (2007) Chapter 10.7 which can be read at
http://www.ipcc.ch/publications_and_data/ar4/wg1/en/ch10s10-7.html
It says there
In other words, the IPCC said it was expected that global temperature would rise at an average rate of “0.2°C per decade” over the first two decades of this century with half of this rise being due to atmospheric GHG emissions which were already in the system. As Eugene WR Gallun said, this prediction was for all models because it was an effect of GHGs (mostly CO2) already in the system and pertained to real-world outcomes dependent on emissions outcomes as described in the “SRES scenarios”.
The multi-model average warming was a long-term projection for the hypothetical case of “all radiative forcing agents held constant at year 2000”.
Simply, Eugene WR Gallun pointed out what ALL the models said as a result of their having been programmed to emulate the hypothesis of atmospheric GHGs (mostly CO2) and there are GHGs already in the system, while “Temperatures have been flat for 17-20 years even though CO2 levels have continued to rise” within the range of SRES scenarios so “About twice as much warming (0.2°C per decade)” was “expected”.
Your response – as usual – was to run off to find something which you don’t understand but you thought seemed to be related and then you provided it as a reply in attempt to deny what was “expected”.
I repeat my above suggestion to you; viz.
Don’t waste the space on threads that is taken up by your posts if you don’t want them to make you “pissed off”. Just go away instead.
Richard
dbstealy: Apparently Gates only reads some of the literature.
That sub-set that agrees with what he wants to believe.
Funny all this data is from the cheaters, how is that suppose to convince me? After all an embezzler’s books almost always balance.
“An embezzler’s books always balance”.
I like that. I like that a lot.
Books in an honest shop also always balance.
After reading the Climategate I, II, and III emails, there doesn’t appear to be an honest scientist among them. Just varying degrees of rent-seeking charlatans pushing a debunked narrative.
Why oh why then do the models not more perfectly conform to the overtly “manipulated” instrumental temperature data? Where’s the email from Al Gore telling Mike Mann by how much to suppress the MWP?
Recall your own words, Stealey: when they start attacking the man(n), you know they’re out of arguments.
Gates,
As usual, you set up a strawman and knocked him down, you brave strawman fighter, you.
You claimed “Books in an honest shop also always balance,” implying that your side is honest.
They aren’t. They are a bunch of rent-seeking opportunists who have gamed the peer review system until it is ‘pal review’. There doesn’t appear to be an honest one among them. Those are the self-serving charlatans on your side, pushing the MMGW HOAX.
So deflect all you want; not one of them has ever said the Climategate exposé isn’t true. That includes ‘Harry the programmer’, who blatantly admitted fabricating years of temperature data!
We’re supposed to believe them?? In your dreams.
dbstealey,
No. By way of pointing out that the books balance in both an honest and dishonest shop. Zero sum argument, see? No, of course you don’t.
Hoax is a serious charge, requiring serious evidence. It’s long past time for you to put up or shut up:
1) Why don’t the models better match the allegedly falsified temperature time series?
2) Where’s the email from Al Gore to Mike Mann telling him what shape to make the Hokey Schtick?
We’ve covered this before. My answer has not changed: http://wattsupwiththat.com/2015/01/02/climate-and-truth-a-tale-of-immorality/#comment-1828755
I already know you’ve made up your mind, DB. Magical “natural variaibility” is pretty much it, which you believe in based on … what — ice core data from Petit (1999) and Alley (2000)? Those two aren’t in on the game? You know this how?
Do you even know what the word “consistency” means?
Gates says:
Hoax is a serious charge, requiring serious evidence. It’s long past time for you to put up or shut up
HOAX:
• Climategate i
• Climategate II
• Climategate III
• Harry_read_me file
HOAX.
I put up, in spades. Now shut up.
If you can’t, you really need a girlfriend. Or a life. Or a hobby. Or a new shovel, because you never stop digging your hole.
dbstealey,
You have trouble answering direct questions directly. Again:
1) Why don’t the models better match the allegedly falsified temperature time series?
2) Where’s the email from Al Gore to Mike Mann telling him what shape to make the Hokey Schtick?
Gates,
You go find whatever emails you want. All you are doing is deflecting as usual, changing the subject to Algore or whatever stream of consciousness thought pops into your cluttered mind.
As Mark says above,
Funny all this data is from the cheaters, how is that suppose to convince me?
You asked for evidence of the ongoing man-made global warming HOAX, and I gave it to you, good and hard. But nothing will convince an eco-religious True Believer like you of anything, so continue on with your endless, non-stop, insufferable posting on everything and anything. You can wake me when you’ve found a single scientific skeptic that you’ve converted to your globaloney belief system. After millions of impotent words, maybe you’ll find one someday.
dbstealey,
Did that when they first leaked. I’ve reviewed them many times since then because, as you yourself say: when they’re out of scientific arguments, they attack the man(n).
Case in point.
I repeat:
You have trouble answering direct questions directly. Again:
1) Why don’t the models better match the allegedly falsified temperature time series?
2) Where’s the email from Al Gore to Mike Mann telling him what shape to make the Hokey Schtick?
Got answers, or will it be yet again another diversion about my putative cognitive clutter?
Brandon nice graphs pure adult bovine fecal matter, here is what is actually going on. https://stevengoddard.wordpress.com/2015/04/17/ncdc-hiding-the-decline-in-us-temperatures-by-data-tampering/ Steve may not have it completely correct but it is a lot closer to the truth than the BS you spew. When you go and get the original paper record and compare it against the graphs you posted above I am very certain it won’t even be close to what you have do that for the Grand Canyon that should open your eyes, but I assume you are paid not to have you eye dpen, or the alternative you just a simple idiot.. As George Carlin put it ‘Never argue with an idiot. They will only bring you down to their level and beat you with experience.’ I don’t know if you qualify for that quote but what I have seen late from you it certainly looks that way. So this will be my last comment tonight on this thread
Mark Luhman,
Goddard’s post is about Tmax for USHCN. Plots I’m showing are Tavg for GHCN. Apples meet oranges.
Accusations of “data tampering” are hilariously nonsensical when the “conspirators” give you the before/after data and the codes used for doing the adjustments.
Use your head for something other than a tin-foil hat rest.
Goddard has the original paper records?
I have the entire GHCN monthly raw/adjusted files stashed in a database, as well as the SST raw/adjusted (gridded) files used by HADSST3. My results are virutally identical to the plots shown above, which were generated by Zeke Hausfather of BEST. Victor Venema explains them, with references (something that Goddard consistently fails to do, and is all the less credible for it): http://variable-variability.blogspot.ch/2015/02/homogenization-adjustments-reduce-global-warming.html
That happens to be one of my favourite Carlin bits, though I note he borrowed it from Twain: Never argue with a fool, onlookers may not be able to tell the difference.
Good, I was already getting bored by your conflations of the US with the global network, Tmax with Tavg, and declarations of “truth” you’ve in no way substantiated.
Brandon is smart. Just ask him.
So what is the mechanism that causes the oceans to “gobble up heat” now, but caused them to ignore it when the temperatures were rising before the pause?
The PDO flux.
@ Evan…that brings up the next question. Why didn’t the climate wizards predict that the oceans were going to take in extra heat when the PDO switched? That would have been impressive, and would have showed merit for their cause. Instead they were caught flat footed, and that showed everyone the lack of understanding which they have for the overall system. No wonder their models never worked, and still don’t work.
The point of this post is to remind people of what I have stated before: to the extent that a change in ocean circulation has negated anthropogenic warming in the last 15+ years, an opposite change likely enhanced warming during the 1970s to 1990s.
You can’t have one without the other.
Bingo, BG. Excellent point. neither side can have it both ways.
Flat period s followed by double-warming periods. Coinciding with the PDO. So far as CO@ is concerned: no pause. No tipping point. Steady forcing @ the rate Arrhenius projected: ~1.1C/century.
evanmjones,
Technically it’s Dr. Spencer’s point, and I do think it’s a good one. I chuckle to myself whenever someone says, “yeah, warmists are praying for an El Nino” because it’s part of a bizarre calculus quite similar to this:
1) Blizzards are climate.
2) Heat waves are weather.
Or as I said recently elsewhere, a 70% chance of El Nino this year is a 70% chance that climate contrarians will remember the power of internal variability.
The problem is that they included the affect of changes in ocean circulation under the category of “caused by CO2”.
We were assured that most if not all of the warming from the 70’s through the 90’s was caused by CO2.
If the ocean circulations are sufficient to cancel out the affect of CO2, then by definition, at least half the previous warming was caused by those same circulations.
When the models are updated to reflect this fact, let me know.
The purpose of this little exercise is to illustrate the power of water vapor in controlling the climate’s heat load.
For this example 350 W/m2 is the approximate heat flux at ToA.
A watt is a power unit, energy over time, and equals 3.4 Btu/h.
In 24 hours the entire atmospheric volume will rotate through this heat flux and accumulate x.xxE? Btus.
For dry air, no moisture, 0% RH, to absorb this heat would result in a temperature rise of 1.34 F.
The evaporation of water into vapor at 950 Btu/lb without any increase in temperature, i.e. isothermal, would increase the atmospheric water content by about 14%, i.e more clouds, more albedo, less heat.
It’s the H2O thermostat that controls the greenhouse, not CO2. It’s the H2O thermostat that controls the simplistic blanket analogy as well.
Power Input, W/m2 350
Btu/h per W, Btu/h 3.4
Heat Input, (Btu/h)/m2 1,190.0
Earth Cross Sectional Area, m2 1.28E+14
Time, h 24.0
Heat/Energy Input over 24 Hours, Btu 3.64E+18
Atmospheric Dry Air, lb 1.13E+19
Dry Air Heat Capacity, Btu/lb-F 0.24
Dry Air Temp. Rise over 24 Hours, F 1.34
Water Vapor Heat Capacity, Btu/lb 950
Water Vapor Increment, lb 3.83E+15
Water Vapor in Atmosphere, lb 2.80E+16
Incremental Water Vapor, % 13.70%
Miatello explains water vapor using calculus.
http://principia-scientific.org/publications/PSI_Miatello_Refutation_GHE.pdf
http://www.writerbeat.com/articles/3713-CO2-Feedback-Loop
Let me just give you one word son… one word…aerosols
I think it is obvious that mankind, at this point in time, does not really know how the earth’s weather machine works. Most of climate science is off on the wrong trail and the prevailing paradigm is just plain wrong. Someday, we will get back on track — once we finally say that CO2 is “not guilty”.
How come evaporation, the ocean and surface’s cooling mechanism never gets mentioned? The silence is deafening.
because it doesnt matter
“because it doesnt matter” … to the alarmist narrative of gloom and doom unless we ditch our industrialized civilization.
Well over 80% of the oceans cooling is attributable to evaporation and you claim it doesn’t matter Mosher?
Macbeth said it best about Climate ‘Science’
it is a tale
Told by an idiot, full of sound and fury,
Signifying nothing.
Mosher….honestly what do you think that it does matter…..lets hear it….
For example lets start from that it matters a lot that GCMs project do not predict, the outcome is projections not predictions….
what would you say?
cheer
“because it doesn’t matter”
Wow, how forgetful. Below find a reference from one of your own sides site (I’ll let you chase it down). Dr Spencer’s research also indicates that the feedback is in fact negative. Well of course you can’t agree with that,BUT even if you did, then you can always start throwing in as many confusing factors as possible to save the day. However if the feedback factor is inaccurate, then the models are way off also:
“As water vapour is directly related to temperature, it’s also a positive feedback – in fact, the largest positive feedback in the climate system (Soden 2005). As temperature rises, evaporation increases and more water vapour accumulates in the atmosphere. As a greenhouse gas, the water absorbs more heat, further warming the air and causing more evaporation. When CO2 is added to the atmosphere, as a greenhouse gas it has a warming effect. This causes more water to evaporate and warm the air to a higher, stabilized level. So the warming from CO2 has an amplified effect.
How much does water vapour amplify CO2 warming? Without any feedbacks, a doubling of CO2 would warm the globe around 1°C. Taken on its own, water vapour feedback roughly doubles the amount of CO2 warming. When other feedbacks are included (eg – loss of albedo due to melting ice), the total warming from a doubling of CO2 is around 3°C (Held 2000).”
ok so what does matter
because it doesnt matter
I wouldn’t go that far. It goes back and forth (with the positive and negative PDO).
According to “the models” a warmer world causes more evaporation, yet the cooling that such evaporation causes “doesn’t matter”.
Nice of the modelers to continue to ignore everything that doesn’t help their cause.
What bothers me is the probability that we just might enter into something like the Medieval Warm Period. Then what will “we” say as the temperature starts to climb back to those levels? There will go any link (for 20-30 years) to claimed low sensitivity of additional CO2. Suppose most will just worry about that- if and when it happens, but to crow mildly or loudly about the “pause”, leaves one wide open for the next ratchet “up” in temperatures, which is likely based on historical records.
Your concern, your observation is valid. And we do not know the answer, and will not “see” the answer until after it has occurred. The Medieval Warm Period was not a single, 250 year period of “hot weather’ either: It was high plateau of “usually-than-normal” periods, punctuated by irregular drops and jumps and valleys.
Likewise, the Little Ice Age was NOT a continuous period of cold weather everywhere for 250 years. It too was a 400 year “low point – on average everywhere – but with short cycles of warmer periods.
So, as we have asked before:
Is today’s Modern Warm Period a peak at 2000-2010, and we will begin sliding down into the Modern Ice Age 450 from now?
Is today’s Modern Warming Period (2000-2010) only a step (like the 1935-1945 60 year short cycle step), and the actual MWP maximum will be in 2070-2080?
Will there be two more short cycles before we slide into the MWP’s actual maximum in 2120-2130?
There is a good chance that this is the peak, and that there will not be a higher peak even if this Warm Period has more life to it. Note that in both of the 2 last WPs, the peak developed mid way in the Roman and somewhat earlier during the Medieval. Then it was all sideways with a few dips until the end point where there was a sharp drop. However, no two cycles are ever exactly the same. There could be a higher peak, but I would say that is a low probability. The upcoming cool trend should shed light on this depending on how weak or deep it gets.
The self appointed climate gurus, Mann, Schmidt, Karl, and their groupies have too much ego to ever back off and admit they could be wrong with their models. Governments slather at the idea of carbon based tax. Socialist greens see the distribution of wealth and ‘climate justice’ as tools to create their imagined world utopia.
All three groups, with their different motives, need a dose of reality along the lines Ms Forbes writes about.
Thanks dave, you just reminded me tomorrow is garbage day I have to take it all down tonight.
Help – we need an alarmist to post something, anything. I need some fun today.
“The sun is the primary source of almost all of Earth’s heat. It is becoming increasingly clear that this gigantic heat generator, with its varying cycles and emissions, is an Ace in the climate game.”
Yep !
http://www.vukcevic.talktalk.net//SUN-AMOa.gif
and details are here
http://www.vukcevic.talktalk.net/SUN-and-AMO.htm
vukcevic,
That gives us a nice 60 year cycle. Bottom plot doesn’t show much of a secular trend from 1850 to present, however.
Mr. Gates
Periodic osculations do not exhibit up/down trends and consequently neither do the interactions .
Mr Gates
Looking for uptrend in the N. A. SST cause?
The AMO is de-trended N. Atlantic SST. Multidecadal oscillations are found in other apparently ‘not related’ (as science would have it) N. Atlantic events. One of those is tectonic activity at northern section of the Mid Atlantic Ridge, an enormous crack in the ocean’s floor due to the continental drift.
http://www.vukcevic.talktalk.net/SST-NAP.gif
Since tectonics leads the NA SST by about a decade, it is more likely to be the cause (or closely related to it) than the consequence of the temperature oscillation.
@ Brandon Gates April 18, 2015 at 3:54 pm
Brandon, and in which year on that “bottom plot” did the actual measurements …. begin replacing the proxy calculated measurements?
Not my plot, ask vukcevic.
Reblogged this on Colorado Right and commented:
NASA itself has been caught faking temperature data so it will fit the “template”.
@ colorado, Yep and they missed the frost one morning.in Florida and let .. oh you all know what happened..
It was worse than a frost. It was 17degrees that morning at my family’s plant nursery, about 50 miles west of Cape Canaveral.
I still recall the heavy coat I was carrying when I walked out of a P Chem lecture and looked up at the dissipating Y-shaped cloud of vapor from the explosion.
They didn’t miss the cold, they just forgot that rubber seals don’t, when they get too cold.
@ Menicholas: A terrible, terrible day. Wish you hadn’t reminded me. The TV news kept replaying the image of that cloud, until it was burned into my memory.
Christa McAuliffe, the “teacher in space,” grew up here in Framingham, MA; they named a branch library after her.
/Mr Lynn
“Too many wild cards in the climate game.”

Don’t forget the Royals.
Carbon Connie by fenbeagle
You had me at “hydro-carbon fuels”. The people who will restrict their discussion to just science are few and far between, and actually quite rare.
The [anthropogenic] global cooling/warming, climate change/disruption activists are evolutionary rejects from the human-centric school of philosophy attempting to regain relevance in our society through flat-Earth consensus or politics.
That said, rational and reasonable conservation, not envirofascism and corruption.
Quite a rant. Got science?
Try this:
http://wattsupwiththat.com/2015/02/24/are-climate-modelers-scientists/
I liked this part:
“Here’s an illustration: the Figure below shows what happens when the average ±4 Wm-2 long-wave cloud forcing error of CMIP5 climate models [1], is propagated through a couple of Community Climate System Model 4 (CCSM4) global air temperature projections.
CCSM4 is a CMIP5-level climate model from NCAR, where Kevin Trenberth works, and was used in the IPCC AR5 of 2013. Judy Curry wrote about it here.
In panel a, the points show the CCSM4 anomaly projections of the AR5 Representative Concentration Pathways (RCP) 6.0 (green) and 8.5 (blue). The lines are the PWM emulations of the CCSM4 projections, made using the standard RCP forcings from Meinshausen. [2] The CCSM4 RCP forcings may not be identical to the Meinhausen RCP forcings. The shaded areas are the range of projections across all AR5 models (see AR5 Figure TS.15). The CCSM4 projections are in the upper range.
In panel b, the lines are the same two CCSM4 RCP projections. But now the shaded areas are the uncertainty envelopes resulting when ±4 Wm-2 CMIP5 long wave cloud forcing error is propagated through the projections in annual steps.
The uncertainty is so large because ±4 W m-2 of annual long wave cloud forcing error is ±114´ larger than the annual average 0.035 Wm-2 forcing increase of GHG emissions since 1979. Typical error bars for CMIP5 climate model projections are about ±14 C after 100 years and ±18 C after 150 years.
It’s immediately clear that climate models are unable to resolve any thermal effect of greenhouse gas emissions or tell us anything about future air temperatures. It’s impossible that climate models can ever have resolved an anthropogenic greenhouse signal; not now nor at any time in the past.
Propagation of errors through a calculation is a simple idea. It’s logically obvious. It’s critically important. It gets pounded into every single freshman physics, chemistry, and engineering student.
And it has escaped the grasp of every single Ph.D. climate modeler I have encountered, in conversation or in review.”
But sunsettomy, they run the models several times over to be sure that they are accurate!
warrenlb,
That’s a funny question coming from a guy who, when actually engaged in a discussion of the science, immediately retreats to the position that he’s not a scientist, so doesn’t understand the material. Then he stammers out that his “knowledge” is based on his knowing which climate scientists to believe. How, given that he doesn’t understand the science, he can know which ones to believe, we are left to guess.
Davidmhoffer. You claim I said I don’t understand science? No, I never said that. In fact I do. But you and Stealey don’t, although you claim to have proven all the world’s climate scientists are wrong..
Warren, you took on Frank,in the link BFL posted, and got taken down hard,but you never seem to notice.
“But sunsettomy, they run the models several times over to be sure that they are accurate!”
Yes, they are accurate, but we wait until year 2100 to find out!
warrenlb says:
Davidmhoffer. You claim I said I don’t understand science?
As David Hoffer, Sunsettommy, and plenty of others here have made clear, you don’t have a clue about how the scientific method works. Everything you post is alarmist nonsense, and none of it withstands even the mildest scrutiny.
But you do serve a purpose here. You show that your alarmist cult has no arguments that hold water. Everything you write is based on your religious belief in the demon ‘carbon’ being the control knob for the entire planet. You seem to actually believe that nonsense.
That provides constant amusement to thinking readers. And sorry about your pals like j.peter, Ron House, david socrates, and the rest of the trolls. You’re prettty much the only one left now doing your wacky eco-proselytizing. It must be getting lonely there in your mom’s basement.
davidmhoffer:
Isn’t it obvious, he believes the ones that tell him what he wants to hear.
Sigh…CO2 is written with a subscript.
Hmmm. I read ‘complete obloquy squared’.
============
I had to look that up in a dictionary, but you are right, people that even can’t write CO2 right loose my respect entirely.
“people that even can’t write CO2 right loose my respect entirely.”
I have similar feelings towards native English speakers who can’t spell “lose”. However, I suspect that someone who writes “even can’t” rather than “can’t even” is not a native speaker, and I respect non-natives for making the effort.
…people that even can’t write CO2 right loose my respect entirely.
Then I assume that is the correct way to write CO2.
[But RoHa is right: it’s ‘lose’ when you’ve lost something.]
1 Carbon atom linked to 2 Oxygen atom is CO₂ (Hope that worked.), and not “CO2”. But it’s easier to not make the “2” a subscript. In some things, as this comments section, people don’t know how.
[The mods actually find it easier when “most people’ don’t even try. .mod]
(Guess I don’t know how either!8-)
In that case, I’ll stop trying to figure out how to do it here. Whatever is easier for the mods.
My keyboard doesn’t have a subscript for the 2 at the end of the O. Otherwise, we’d all use it. Being very specific and redundant eliminates confusion among some.
1. ” Climate alarmists claim incessantly that all bad weather is caused by man’s use of hydro-carbon fuels – oil, gas and coal.”
Wrong. the argument takes the following forms
A) in a warmer world the will be an INCREASE in the frequency of some types of extreme weather.
B) in a warmer world, the magnitude of extreme weather may increase.
Nobody, especiallly not the IPCC, argues that ALL “bad” weather is caused by increasing GHGs.
They do argue that the frequency of some bad weather may increase and/or that the magnitude may increase.
Starting you essay with a strawman.. isn’t the best way to write.
2.” It is becoming increasingly clear that this gigantic heat generator, with its varying cycles and emissions, is an Ace in the climate game.”
Looks like time for a bet. the sun is near it’s maximum. the next 6 years TSi will head down.
bets?
I’ll bet the Arctic will be ice free in 5 years, tornados and hurricanes will be much more frequent and effect the US historically, England will have no snow during the winters and we will be closing all the ski resorts in the Northeast due to the warm winters.
Steven,
Sure, I’ll fade you. 5,000 quatloos.☺
But does Al Gore know that?
http://upload.wikimedia.org/wikipedia/en/1/19/An_Inconvenient_Truth_Film_Poster.jpg
Al Gore is getting filthy rich, has the carbon footprint of Sasquatch, and lies for a living. It is in his best interests, to ignore the truth!
Mosh,
http://1.bp.blogspot.com/-nn7LJ6E7y7E/VTLjXocCBuI/AAAAAAAAAas/UdNuc_Z_1_Q/s1600/CMIP5%2Bto%2Bactuals%2Bwith%2Bmod%2Bprojection%2B01.png
From Nov. last year. I can’t recall how I did TSI, but I think I just carried forward some reasonable 11-year cycle. IIRC, aerosols are how I knocked down the trend from what the CO2 forcing alone would predict.
Looks like I may have lucked out on ENSO this year … time will tell.
In other words Mosher, nothing has really changed for hundreds and hundreds of years. Weather is what weather does. All the genius comments can’t change that fact. It is what it is and has been what it has been for eons. The people on this world are just along for the ride and whatever comes about we will deal with it (adapt). To think these geniuses really believe we can change the world climate are indeed full of themselves. Never has so much been said about so little by so many. All absolutely useless.
“In a warmer world there will an increase in the frequency of some types of extreme weather.” Which types? What’s the definition of “extreme”? And then farther down- “they argue that the frequency of some bad weather may increase.” So we have a “will increase” and a “may increase”, along with, as far as I’ve seen, no set definition of what extreme is, whenever it may, or will happen. Or for that matter, “bad weather”. What’s bad weather? How very scientific.
What’s bad weather?
Here it is:
If it rains on your parade, then that is very bad.
jl
You are making the unreasonable assumption that a post from Steven Mosher is intended to be rational and to say something related to reality.
Richard
You want to bet ?
So, it would be something like the future of mankind vs its hubris.
Never mind the ongoing genocides, we’ll just pretend a 1 degree temperature change is a real problem.
Meh, the argument has long been greater energy in the system causing more extreme weather vs decreased polar/equatorial temperature gradient causing less extreme weather.
No one knows the truth of the proposition, but it amuses the heck out of me that they are countervailing tendencies.
====
kim: Newton’s law steps in…
For every action, there is an equal and opposite reaction.
Some science has been used a s a political bitch for global entities with untapped money reserves. On the opposing side are the real scientists who actually care. Hence the countervailing tendencies.
1) I’m guessing that you never watch the news. The number of people who constantly claim that every big storm is the result of global warming is legion.
2) It’s already started down.
I have spent years making computer models to analyze the various probable and regulatory required accidents needed to obtain a license to operate a nuclear power plant or to use different fuel and other license changes. I have concluded that “It should be intuitively obvious to the most casual observer” that any person that could write a computer model that takes into account enough of the variables to predict the global temperature even ten years in advance could easily make a model for the stock market or at least enough stocks/bonds to make a fortune. So where are all of the multi-billionaire climate modelers?
I suspect that those modelers aren’t up to the level of computerized trading by the big corps.
http://en.wikipedia.org/wiki/Algorithmic_trading
“Algorithmic trading may be used in any investment strategy, including market making, inter-market spreading, arbitrage, or pure speculation (including trend following). The investment decision and implementation may be augmented at any stage with algorithmic support or may operate completely automatically. In March 2014, Virtu Financial, a high-frequency trading firm, reported that during five years it made profit 1,277 out of 1,278 days, losing money just one day.”
“High Frequency Trading strategies utilize computers that make elaborate decisions to initiate orders based on information that is received electronically, before human traders are capable of processing the information they observe. Algorithmic trading and HFT have resulted in a dramatic change of the market microstructure, particularly in the way liquidity is provided.”
“American markets and European markets generally have a higher proportion of algorithmic trades than other markets, and estimates for 2008 range as high as an 80% proportion in some markets.”
If you dabble in the stock market, you might be feeling a little inadequate about now.
“High frequency trading” involves capturing the orders placed in NYC on their way to NJ trading houses, reading them, and transmitting identical orders over a faster network to those same trading houses. The shares that would have been bought by the (slower) incoming orders are bought first, then resold to the original order placer for a fraction more than they would have been a few microseconds before.
It is a clever and soon-to-be-illegal form of insider trading. The ‘algorithm’ is to tap the order stream and run ahead to buy the shares and become a middleman for a few cents per trade, millions of times per day.
Crispin:
I could only find a law suit that will try and put some correction on this practice without other government involvement (and law suits can take a very long time to resolve). Unfortunately I fear that much like the the CDO’s and Derivatives that saw no CFTC oversight at Greenspan’s request (re: 2008), Wall Street and their corporate cronies who own D.C will prevail. Though Dodd-Frank did attempt to close that loop hole, Congress has reduced funding for the CFTC which is charged with implementing Dodd-Frank.
See below what can happen without corporate oversight which the “Right” constantly supports (no doubt because of monetary kickbacks, errrr I mean political support):
“In 1998, a trillion dollar hedge fund called Long Term Capital Management (LTCM) was near collapse. Using mathematical models to calculate debt risk, LTCM used derivatives to leverage $5 billion into more than $1 trillion, doing business with fifteen of Wall Street’s largest financial institutions. The derivative transactions were not regulated, nor were investors able to evaluate LTCM’s exposures. Born stated, “I thought that LTCM was exactly what I had been worried about”. In the last weekend of September 1998, the President’s working group was told that the entire American economy hung in the balance. After intervention by the Federal Reserve, the crisis was averted.[6] In congressional hearings into the crisis, Greenspan acknowledged that language had been introduced into an agriculture bill that would prevent CFTC from regulating the derivatives which were at the center of the crisis that threatened the US economy”
http://www.newrepublic.com/article/115511/cftc-funding-will-prevent-it-regulating-derivatives
http://en.wikipedia.org/wiki/Brooksley_Born#Born_and_the_OTC_derivatives_market
Thanks, Viv.
Just this morning I had a friend tell me how CO2 is to blame for the very recent activity of tornadoes in the USA. Not matter what I said, he knew.
Hurricanes? Maybe fewer, he said, but stronger. He declined my offer to show him the ACE data that shows otherwise.
Pause? What pause when 2014 was the warmest year on record? My answer explaining by how much and the margin of error? Confusing and irrelevant in any case. He knows.
Here is Lomborg’s opinion from his WSJ article about death rate decline from natural disasters over the last 100 years. This is the quote—————
“This is important because if we want to help the poor people who are most threatened by natural disasters, we have to recognize that it is less about cutting carbon emissions than it is about pulling them out of poverty.
The best way to see this is to look at the world’s deaths from natural disasters over time. In the Oxford University database for death rates from floods, extreme temperatures, droughts and storms, the average in the first part of last century was more than 13 dead every year per 100,000 people. Since then the death rates have dropped 97% to a new low in the 2010s of 0.38 per 100,000 people.
The dramatic decline is mostly due to economic development that helps nations withstand catastrophes. If you’re rich like Florida, a major hurricane might cause plenty of damage to expensive buildings, but it kills few people and causes a temporary dent in economic output. If a similar hurricane hits a poorer country like the Philippines or Guatemala, it kills many more and can devastate the economy.” End of quote
Here is more of the WSJ article from the HS site. http://hockeyschtick.blogspot.com.au/2015/02/the-alarming-thing-about-climate.html
Indur Goklany backs up the above from Lomborg. The huge decrease in deaths from natural disasters has occurred BECAUSE of the increase in the use of fossil fuels. The wealthier countries become the safer are the citizens in those countries.
http://www.thegwpf.com/indur-m-goklany-global-death-toll-from-extreme-weather-events-declining/
The climate models don’t fall within even 90% confidence limits of the temperature measurements, not even the “adjusted” temperature measurements. When are climate “scientists” actually going to do science, give up the models, and propose something that does agree with the observed temperature measurements?
With their sagging intellectual potential, that’s not going to happen as long as the grants keep rolling in.
http://wattsupwiththat.com/2015/04/18/claim-graduates-shunning-climate-studies/#comment-1910461
Here is a look at the UN IPCC’s Super-Supreme Beyond Human Computational Battalions taking stations in Paris this month for the next UNFCCC meeting. What Joy. What Pageantry. Our hands tremble at the thoughts of the millions to be killed to appease Angela Merkel and her lap dog Barak Hussein [not that other Hussein] Obama for her rise to EU Supremacy, Most Important Human Being Born to Planet Earth For Now And All Time To Come and anointment as Grand Supreme-Tsar of all of EU and the World irregardless of whatever protests.
The Baby Boomers have made sure Germany has taken over Europe via the EU, after their parents spent their lives to stop it.
Here’s one of the sex-drug-occult prophets who knows a good Third R ch photographer when he sees one.
Mick Jagger with Leni whats her name.
Zeke, thanks for your tireless efforts to warn of the Runaway Baby Boomer Menace – your regularity is commendable – but wouldn’t a picture of Gore (1948), Clinton (1946) or GW Bush (1946) be more appropriate, as all three are boomers, whereas neither Jagger (1943) nor Leni Riefenstahl (1902) is?
The Baby Boomers are often described as having been born 1946-1964.
http://upload.wikimedia.org/wikipedia/commons/f/f0/U.S.BirthRate.1909.2003.png
We can all agree there were many who were born during that period and did not identify at all with that cohort, and there are others who were born before that and are fully identified with it, and even iconic.
And yet I think it is very helpful and it is entirely worthwhile to discuss the Baby Boomers because they are now in control of more wealth than any previous generation, and have filled the ranks of media, academia, schools, federal bureaucracies, UN depts, and the NGOs.
The reason it is important and useful to use this generalization is because so many of that generation’s philosophies and pet theories are getting very close to being implemented on the rest of us. Their drug use, divorces, profanity, occultism, ongoing sexual revolution, veganism, vegetarianism, environmentalism, organic- and local- only food fetishes, eugenics/population control fanaticism, contempt of the middle class, coldness towards and betrayal of English-speaking countries, and warm love of foreign interests (esp. int’l bodies – the UN and EU) are just a few examples. They have carried out their experiments this far, and the only reason I am bothering to say anything at all is because the Boomers fully intend to continue this same trajectory – at accelerated rates! But I would argue it is time to observe, acknowledge, and publish the results of their pet theories. Maybe some of you can think about repenting from the darkness and turning to the light. Come to the Rock, you don’t have to get stoned anymore.
PS Obviously that Witch Mick Jagger (“Sir”) adores is not a Boomer – I said she is a Third Re ch film maker. Is he a boomer? As I said, look at where his uncles, aunts, and parents were when he was born – in the throes of battle with the Wehrmacht. And they won.
Now here is a beautiful woman of the Greatest Generation, who sold her piano to try to save England from joining the EU. This is the real queen of England. I’d like to know what she thinks of that picture of the Superstar Boomer and Leni Whoever.
UKIP – Betty Simmerson Early EU Protester
And notice the date of Britain’s joining of the EU Common Market – she was very upset that they did it on the anniversary of D-Day! I do not think that was a coincidence.
Correction. Betty Simmerson objected to her leaders joining the EU on the date of the Anzio Beachhead Landings. She was a nurse during WWII. So she threw a bag of very finely sifted flour in protest.
The Anzio Landings
The landing at Anzio took place on January 22nd, 1944. The initial hours of the landing were relatively bloodless for the Allies. Yet Anzio was to turn into one of the bloodiest battles fought in Western Europe by the Allies in World War Two.
“Climate alarmists claim incessantly that all bad weather is caused by man’s use of hydro-carbon fuels”
A geocentric climate paradigm would readily arrive at such a conclusion, as it excludes the possibility of weather driving climate, and of differentiating between natural or otherwise, and of prediction of either.
BFL April 18, 2015 at 4:17 pm Re: Spencer’s comments
CO2 emitted energy (microwaves) radiative forcing heats up water through sensible heat, 1 Btu/lb-F.
When water evaporates it cools, that’s how an evaporative cooler works, those canvas water bags, the water soaked bandana tied around your head, and the sweat on your body. Latent heat of evaporation/condensation, around 1,000 Btu/lb, is how the water vapor cycle thermostat moderates the climate.
One of the popular global heat balance diagrams shows about 340 Wm-2 (can’t do superscripts in these boxes.) IPCC AR5 says that the additional radiative forcing due to man caused GHGs between years 1750 and 2011 is less than 3.0 Wm-2.
Is that what the fuss is about? Less than 1% of ToA!
Look up “negative radiative feedback” on Google.
Yes, climate science has a concept to account for the increased energy transferred back to space from increased evaporation, from the surface and atmosphere heating up. As matter gets warmer (even 1.0C from doubled CO2), it emits more energy back. If the Earth warms up, it will emit more long-wave photons back to space.
But climate science has been very cagey about what the negative radiative feedback means, should it be included in the calculations.
Then they go on to just ignore it.
It appears to be one of the biggest little wild cards left out of the theory but could answer the question about why the Earth ‘s climate is so stable in paleohistory, why we are not seeing the warming that the CO2 released to date is supposed to have caused.
400 ppm CO2 is supposed to raise temperatures by 1.4C. All we have seen is 0.5C not counting Mosher’s fake temperature adjustments.
What the heck is CO squared?
One of the “cards” says “CO²”, which is not at all the same thing as “CO2”. Someone created that graphic, who does not know how to write the chemical formula for Carbon Dioxide, but can make pretty pictures. And their vote counts the same as mine.
The Pause means the Null Hypothesis is not falsified, and no factors other than natural variation need be considered.
Brian is exactly right. Not that it will be convincing to alarmists. This is politics to them, not science. They lost the science debate about eighteen years ago.
I do hope it is a pause not the last plateau in the Holocene interglacial period which began about 10,000 years ago.
We know the middle of the Holocene was warmer than today.
Since length of the current interglacial has already exceeded the length of the most recent few, any forthcoming cooling may be an ominous sign and should be a warning to future inhabitants of N. American and European communities above 50 degrees north. Density of the current population long before inevitable onset of a new glacial can not be sustained; even return to the LIA temperatures would more than decimate crops of N. America and European plains. Anything worse than the LIA may initiate unprecedented human cataclysm.
http://www.qpg.geog.cam.ac.uk/research/projects/englishchannelformation/1453389260_3dcecb561c.jpg
What he said!
As you freeze or starve to death, let me tell you how warm you are.
http://www.breitbart.com/big-government/2015/04/18/think-global-warming-is-bad-wait-until-you-meet-sustainability/
The argument over AGW is SOOOOOOOO 2014.
For several years now I have been trying to draw attention to Agenda 21 and all I get are “tin hat” comments, and worse. It is nice to see that some are starting to open their eyes. Don’t think it affects you? The program is being forced down our throats even though the US has not signed onto the UN Agenda 21 program.
Are you thinking of buying a house? Then – Next, and very soon, government backed home loans will require your home to meet or have certification that they meet “Sustainability” requirements before they approve the loan. 2nd mortgage applications will follow. Look up “LEED” on Wikipedia and then look at the Agenda 21 sustainability B/S. It is obvious LEED is following Agenda 21. Now do a search on “LEED problems.”
Still don’t think it affects you? Google “DOD Sustainability,” or “IRS Sustainability,” or any other government department or agency. [The] words in their program were “cut-and-pasted” from the UN agenda 21 program that the US has not signed on to!!!! Every university that receives federal funds has a “sustainability” program GOOGLE IT.
While you are reading UN Agenda 21, think about the impact this program will have on life in third world countries. As usual all UN handouts will go to the dictators, and the population will suffer even more. What good is a windmill to power a small village away from any grid? Can wins/solar pump and store water, yes – these units are sold at the local farm suppliers in the western states – but how can they rely on it for perishable food storage? All it is good for is to hook up to the internet or watch propaganda on TV when the wind is blowing or the sun is shining – when they should be tending to their crops!
“By 2014, we are predicting that will be 0.3 degrees warmer than 2004…”
Dr Vicky Pope, (then) Head of Climate Change Advice, UK Met Office, in 2007.
What a babbling buffoon. Her Team makes up things that turn out to be severely wrong and none of them face any consequences or take any responsibility for anything.
https://ipccreport.wordpress.com/2013/11/20/the-skillful-predictions-of-climate-science/
Yes – but thus buffoon was in charge of the Met Office’s advice to the UK Government, which resulted in the Climate Change Act 2008, whose catastrophic effects are slowly becoming apparent.
If I understand her correctly, what she s saying is ” We are predicting that something very dire will happen very soon. So it is apparent that dire things will soon happen.”
The oceans affected by human activity, naval and merchant ships operating and sailing the seas back and forth should have been the hottest topic in the debate on climate change since meteorology was established as a science in the late 19th century. Instead of that, oceans were ignored up to the late 20th century and not even today do they enjoy the significant position they deserve. Oceans are a decisive climatic force, the second after the sun. I suggest visiting http://www.1ocean-1climate.com, in order to find out more about the oceans’s role in climate change.
Viv Forbes,
One might get the impression from your article that the climate science community members who are players in your statement of the climate change alarm game are too myopically focused on their activities to realize it is a game and not a science.
If one assumes that is the case, then there is question as to whether or not the game is controlled from outside of the entire climate science community.
Where would you think the control of the game is per your statement of the game.
John
John
Where do you think the control centers? I remember when G.W Bush desperately desired Americas consent to fight terrorists. His camp drew up a massive fear campaign and set about on his agenda. Every time I’m asked to be deathly afraid, to throw my cash into a bottomless pit..I start to question. And ultimately others are doing exactly what I’m doing, and we share info. This site is that mechanism.
(Snip. Now you’re off onto ‘Chemtrails’. Stop it. -mod)
= = = = =
warrenlb,
Ahhhh, young grasshopper . . .
John
owenvsthegenius on April 19, 2015 at 4:58 pm ,
– – – – – – – – –
owenvsthegenius,
I do not think the climate change alarm movement is a game like the analogy Viv Forbes is a describing.
But, since Viv Forbes approached the climate science process and community with the analogy to a game then I was wondering where he thinks control of the game resides. I would still like to know his view.
Again, I do not agree that it is a meaningful intellectual strategy to use an analogy to a game in analyzing or discussing the climate change alarm movement that does exist within the climate science community and process.
John
Reblogged this on 4timesayear's Blog and commented:
Been saying this for years. But they want to blame CO2 – and not just any CO2, but our measly 4%.
0.4%. For millenia, atmospheric CO2 was ~ 0.28%, and Earth’s temperature was maintained 60F above its natural temperature (ie, if it had no atmosphere) of 0F. CO2 is now 40% higher. What do you conclude from this?
No CO2 was about .26 to.28 for thousands of years,while temperature had large swings, as shown in the Greenland Ice core:
http://c3headlines.typepad.com/.a/6a010536b58035970c01287656565a970c-pi
Sorry Warrenlb
CO2: 0.04% and 0.028%.
So much for your credibility .
warrenlb is incapable of identifying any global harm from the rise in (harmless, beneficial) CO2. Therefore, CO2 is “harmless”. QED
Further: changes in CO2 always follow changes in global temperature. Effect cannot precede cause, therefore the alarmist cult got their causation backward. If they were honest, they would admit it.
warrenlb is just being Chicken Little, running around in circles and clucking that the sky is falling. It isn’t. It was just a tiny, harmless acorn. But try convincing Chicken ‘warrenlb’ Little.
dbstealey,
Five separate studies carried out in Australia all concluded that the heat waves Australia experienced in 2013 were linked to increased atmospheric CO2 levels: http://news.sciencemag.org/climate/2014/09/australias-2013-heat-waves-linked-human-caused-climate-change-studies-conclude
The paper is here: http://www2.ametsoc.org/ams/assets/File/publications/BAMS_EEE_2013_Full_Report.pdf The section on Australia’s heat wave starts on p. 41
@chris:
In my reply to the eco-religious numpty above I wrote:
warrenlb is incapable of identifying any global harm from the rise in (harmless, beneficial) CO2. Therefore, CO2 is “harmless”. QED
Nothing you wrote changes that fact, or anything else in that comment. All you did was cherry-pick one location, and try to argue that GLOBAL warming is due to human activity.
But of course there is ZERO empirical, testable scientific evidence showing that what we have observed globally over the past twenty years is outside of past parameters.
Therefore, what is observed is nothing but natural variability. You may see a “human fingerprint”, but it is entirely in your imagination. People constantly see patterns that aren’t there. That’s why we use the Scientific Method.
Go back to you eco-church and tell them about the climate Null Hypothesis, which has never been falsified. They probably have some canned response for their lemmings, which should keep you in line.
For thinking folks, though, all you are doing is searching for cherry-picked factoids like Australian weather to support your MMGW confirmation bias. That may impress unthinking acolytes. But real scientific skeptics know better.
@dbstealey,
In your comments to warrenlb, you said: “warrenlb is incapable of identifying ANY global harm from the rise in (harmless, beneficial) CO2. Therefore, CO2 is “harmless”. QED”
I provided a link to a paper that proved that the Australian heat wave of 2013 was exacerbated by AGW. Therefore, I identified place where harm occurred. You did not refute the article. Trotting out phrases like the Scientific Method and Null Hypothesis does not disprove the article. Specifically in what way does the paper not follow the Scientific Method?
What I found is not a cherry picked factoid, it’s an example of AGW worsening a heat wave. You said they were no examples of AGW contributing to global harm, I proved that there have been. Therefore, AGW is real. QED
Chris,
You ‘proved’ nothing, because your link says nothing of the sort. Right at the beginning it states:
This year three analyses were of severe storms and none found an anthropogenic signal. However, attribution assessments of these types of events pose unique challenges due to the often limited observational record. When human-influence for an event is not identified with the scientific tools available to us today, this means that if there is a human contribution, it cannot be distinguished from natural climate variability.
That link is filled with what amounts to nothing more than speculation, opinions and conjectures based on models. But at the conclusion the authors admit:
None of these analyses found an anthropogenic signal, in part because attribution assessments of storm events such as these pose unique challenges due to the often limited observational record. As stated earlier, this failure to find anthropogenic signals does not prove anthropogenic climate change had no role to play in these events. Rather, a substantial anthropogenic contribution to these events cannot be supported by these analyses. [my emphasis]
Your link says exactly the opposite of what you claimed. No anthropological signal was found.
After decades of searching by thousands of highly paid scientists using the latest equipment, no “human fingerprint of global warming” has ever been found. But you can be certain that if any real evidence of AGW was found, it would not just be published in a supplement to a journal. Rather, it would be trumpeted everywhere as proof that AGW had finally been found.
What will it take to convince you that every observation shows only normal natural climate variability? At some point you must ask yourself if you believe simply because you want to believe, since there is no supporting confirmation of human-caused global harm caused by the rise in that harmless and beneficial trace gas.
@dbstealey,
Well that’s very interesting. I pointed you to a report, and to a specific place in the report (page 41 onwards, as well 37-41) that relates to the point I made about AGW being attributed to the Australian heat waves of 2013. And what did you do? You cited a completely different part of the report that talks about extreme storms in the US.
Some quotes from the section I was referring to:
“When isolating 1984–2012, the 2012/13 heat wave frequency increased three-fold due to human activity, while heat wave intensity increased two-fold, compared to a climate with no anthropogenic forcings.”
“Thus, the risk of maximum temperatures above the 2002 threshold is extremely likely to be 23 times greater now than in the late 19th century. Large increases in the likelihood of extremely hot seasons
and years across Australia related to human-induced climate change have been documented previously
(Lewis and Karoly 2013).”
The document I posted summarizes the research and findings related to about 20 different climate events/conditions that occurred globally in 2013. The section you quoted determined that for the 3 severe storms you mentioned, there was not an AGW fingerprint. Neither climate scientists nor I have ever said there is a link between AGW and ALL adverse weather, so your point does not refute anything. As an aside, I guess by your definition the science is rock solid when it states there is no AGW footprint (US storms), and junk when it does (Australian heat waves).
The section I directed you to clearly indicates a link between AGW and the Australian heat waves of 2013, and nothing you posted refutes that in any way.
Has anybody factored in the effect of nuclear and high energy weapons testing during the second half of the 20th Century? Does anybody consider that the Earth is still thawing out from the last Ice Age?
If everyone in the world knew just two facts this scam would be finished, dead and buried. One: Carbon Dioxide is a minuscule trace gas representing less than one half of one tenth of one percent of the atmosphere. Two: On an annual basis Mother Nature puts most of it there (apparently over 90%).
Unfortunately the alarmists have succeeded in getting Joe Public to believe that Carbon Dioxide represents a large percentage of the atmosphere (I have heard some people guess as much as 50%) and that we put it all there.
I find it amazing that anyone can believe that by cutting down our tiny contribution to a minuscule trace gas by a small percentage we can control the weather.
Steve Reilly
Indeed it is mistake to think that because they failed to produce good science they not succeeded, when in reality in many ways they have while failing to produce good science because often this is simply not a scientific argument in the first place.
You do know that before the Industrial Age, 0.28% atmospheric CO2 maintained earth’s temperature about 60F above its theoretical thermal equilibrium temperature of 0F with no atmospheric greenhouse effect? You would think that a 40% increase in atmospheric CO2 since then might have an effect on that 60F temperature elevation, wouldn’t you?
No, it didn’t. You constantly make those baseless assertions.
Changes in CO2 follow changes in temperature, not vice versa. Effect cannot precede cause… except in your world.
What I love most about warmists, is their hearted support of the coming doom. We all agree that we will see some warming via Co2 increase. But warmists must have death and flooding and giant spiders. Despite their demand that we pay trillions of dollars to fund a global governing body to halt the impending cataclysm, we try to be nice; saying things like “calm down”, ” relax” and “don’t scare the kids”. Because we are kind people who care about the stress levels of warmists. We love them despite their paranoia.
owenvsthegenius,
Cue warrenlb and his climate alarmist nonsense, topped with his usual Appeal to Authority logical fallacies.
When you say ‘warmists’ or ‘alarmists’ are you referring to the Scientists working in the worlds Science Academies? Or in the worlds Scientific Professional Societies? Or the major Universities, or NASA, or NOAA? All those institutions conclude Man’s burning of fossil fuels are warming the Earth, dangerously so. Are those the individuals you’re referring to?
“When you say ‘warmists’ or ‘alarmists’ are you referring to the Big Government-paid and educated Scientists working in the worlds Science Academies? Or in the worlds Scientific Professional Societies who gain political power and their press from Big Government? Or the major Universities, or NASA, or NOAA? All those institutions (are paid billions of dollars every year) to conclude Man’s burning of fossil fuels are warming the Earth, dangerously so.”
By a Big Government that has decided that an entirely potential beneficial rise of 1/2 of one degree in global average temperatures in 85 years is the most dangerous national security interest the US faces today ? Those jokers, liars and political hacks?
So you do say this IS a conspiracy of all the World’s governments, eh? Going so far as to control the minds of Scientists in the Science Academies of the US, China, Japan, France, Germany, and the UK, all Scientific Professional Societies, all major universities, NASA and NOAA. All those governments must have quite an enforcement mechanism, wouldn’t you say?
warrenlib says:
So you do say this IS a conspiracy of all the World’s governments…
He did not say that, which means you are once again misrepresenting what someone wrote — an incorrigible fault of yours. It reflects your dishonesty.
I try to set the example for people like you: cut and past the writer’s words, verbatim. That way you will not look quite so devious.
And:
Going so far as to control the minds of Scientists…
It is clearly your own mind that has been colonized by the MMGW false alarm. That bogus Narrative is controlling your mind. In your case that’s easy-peasy, but we would appreciate it if you would not try to spread your misinformation to new readers. Thanx.
Mr. Gates, now falls into the twilight zone since he tries to make excuses for previous IPCC temperature projection failures of 2007, with idiotic rationalization:
“AR4 hmmm? Based on CMIP3, yes?”
Then goes on with his excuse that newer Chimp5 is better,but fails to realize that earlier versions of Chimps have been all wrong too.
“CMIP3 a tenth of a degree hotter than CMIP5. Science is iterative. Doesn’t get things right on the first try. Sometimes not the 4th try. IPCC notes in AR5 when it was published that CMIP5 runs ~10% hotter than it should based on observation. Am I getting through yet?”
Real science runs on REPRODUCIBLE research, not on regular pattern of readjusting failed temperature models,the way the IPCC has been doing since 1990. Chimps has become Wimps these days…..
He then responded to my rational statement, “Why can’t you admit the short term IPCC projection, is an epic fail and go on?
Gates quality thumper!:
“Well, that would be because the IPCC make it very clear that it’s not yet possible for them to predict internal variability. It’s easy for you to “falsify” your strawman hypothesis of AGW, isn’t it.”
But of course he didn’t read carefully right below what I quoted,in the 2007 IPCC report,where the IPCC sure seem to say they have a good grasp on their scenarios. I will quote what he responded to,then additional words that came right after that:
“For the next two decades, a warming of about 0.2°C per decade is projected for a range of SRES emission scenarios. Even if the concentrations of all greenhouse gases and aerosols had been kept constant at year 2000 levels, a further warming of about 0.1°C per decade would be expected. {10.3, 10.7}”
These are the very next two paragraphs,
“Since IPCC’s first report in 1990, assessed projections have suggested global average temperature increases between about 0.15°C and 0.3°C per decade for 1990 to 2005. This can now be compared with observed values of about 0.2°C per decade, strengthening confidence in near-term projections. {1.2, 3.2}
Model experiments show that even if all radiative forcing agents were held constant at year 2000 levels, a further warming trend would occur in the next two decades at a rate of about 0.1°C per decade, due mainly to the slow response of the oceans. About twice as much warming (0.2°C per decade) would be expected if emissions are within the range of the SRES scenarios. Best-estimate projections from models indicate that decadal average warming over each inhabited continent by 2030 is insensitive to the choice among SRES scenarios and is very likely to be at least twice as large as the corresponding model-estimated natural variability during the 20th century.”
http://www.ipcc.ch/publications_and_data/ar4/wg1/en/spmsspm-projections-of.html
Note the confidential words:
“strengthening confidence in near-term projections.”
“Best-estimate projections”
“is very likely”
Ha ha,
But alas Brandon sweeps it all away in his desperate attempt to support weak science where they update their Strengthening confidence,best estimate,very likely quality based models, with a new version, that somehow never seem to meet the reality of the real world anyway.
I showed this chart,that destroys it away, even their chimp5 model is still wrong, as it STILL says it is supposed to be warming the first two decades:
http://www.woodfortrees.org/plot/hadcrut4gl/from:2001/to:2015.3/plot/hadcrut4gl/from:2001/to:2015.3/trend/plot/rss/from:2001/to:2015.3/plot/rss/from:2001/to:2015.3/trend
But he goes on with his willfull blindness,since I was talking about warming TRENDS per decade,here I quote what I wrote that he manage to miss the obvious:
Mr. Gates amazingly says: “I trust HADCRUT4 and RSS just fine. Unfortunately, the satellite record doesn’t show the part of the surface record you cherry-picked out:”
He then show a chart from 1850 and concludes:
“Two 40 year pauses, each followed by rising temperatures resulting in the next pause happening higher than the previous
Are you going to say the temperature data from HadleyCrut4 is wrong?.”
I had shown what Dr. Jones said about warming trends since the 1850’s. Somehow he thinks I am “cherrypicking” the data when I used the same time line, Gates did.
Ha ha ha….
I had stated;
“Dr. Jones himself stated in his BBC interview with Roger Harrabin, that ALL of the short warming periods,dating back to the mid 180’s are statistically similar with each other. Here is the link and quote from the Interview:”
Then backed it up,by quoting what Dr. Jones said and what he posted for the interview:
““A – Do you agree that according to the global temperature record used by the IPCC, the rates of global warming from 1860-1880, 1910-1940 and 1975-1998 were identical?”
His answer in part,
“….So, in answer to the question, the warming rates for all 4 periods are similar and not statistically significantly different from each other.
Here are the trends and significances for each period:”
He then shows the list of trends and they are the following: 1860-1880 .163 C per decade warming
1910-1940 .15 C per decade warming, 1975-1998 .166 C per decade warming, 1975-2009 .161 C per decade warming.
http://news.bbc.co.uk/2/hi/8511670.stm
I was talking about TRENDS per decade! They are almost the same each time there was a warming trend.
I posted a chart based 100% on what Dr. Jones stated in the interview,and you manage to miss the obvious point:
http://globalwarmingskeptics.info/thread-1103-post-8790.html#pid8790
The chart is 100% based on Hadcrut3
The point was to show no unusual change in the warming trends of at least the last 150 years. An obvious point you completely missed in your silly zeal to defend unverified modeling claims,that is unusually changeable very 5 years,after it become obvious they keep running too high.
One last thing, this time a chart from Girma Orssengo:
http://globalwarmingskeptics.info/thread-1103-post-8791.html#pid8791
Note what it would be like if the still current IPCC warming projection of .20C per decade warming continues from year 2000,versus the pattern of OBSERVED warming and cooling periods, going back to the 1880’s,where it is falling on a oscillating sine wave,that has been holding very well for over a 120 years now.
I thought you are a scientist, but I wonder……………………..
sunsettommy,
Starting at the end because the beginning is only a rehashing of your initial talking points:
No need to wonder — I’m not. Doesn’t take much training to read a chart though, nor to parse the meaning of the words: internal variability. Your “trend per decade, trend per decade!” mantra isn’t real compelling when any dummy with a working set of eyeballs can see +/- 0.25 K 40-year cycles in the temperature record. The IPCC have, in fact, seen your endlessly recycled weak-sauce nonsense, and answered it: https://www.ipcc.ch/pdf/assessment-report/ar5/wg1/WG1AR5_Chapter11_FINAL.pdf
Climate scientists do not attempt or claim to predict the detailed future evolution of the weather over coming seasons, years or decades. There is, on the other hand, a sound scientific basis for supposing that aspects of climate can be predicted, albeit imprecisely, despite the butterfly effect. For example, increases in long-lived atmospheric greenhouse gas concentrations tend to increase surface temperature in future decades. Thus, information from the past can and does help predict future climate.
Some types of naturally occurring so-called ‘internal’ variability can—in theory at least—extend the capacity to predict future climate. Internal climatic variability arises from natural instabilities in the climate system. If such variability includes or causes extensive, long-lived, upper ocean temperature anomalies, this will drive changes in the overlying atmosphere, both locally and remotely. The El Niño-Southern Oscillation phenomenon is probably the most famous example of this kind of internal variability. Variability linked to the El Niño-Southern Oscillation unfolds in a partially predictable fashion. The butterfly effect is present, but it takes longer to strongly influence some of the variability linked to the El Nino-Southern Oscillation.
Or in short form, the IPCC did not commission long-term weather forecasting models with CMIP5. Time for you to stop pretending that’s what they’re selling.
Your link is 78 pages long, I will ignore it,the same way you ignored the fact that ALL the short warming trends,going back to the 1850’s,fall in a very tight range, centering about .16C per decade.
The significance of this clearly flies over your head,since it is clear there is no significant CHANGE in past 150 years on warming trends, there is no reason to think that a small increase in atmospheric CO2 levels,has made such a noticeable impact on warming over the decades.
DR. Jones who showed that all the warming trends, are statistically the same with each other was an tactic admission that CO2 impact on temperature, is much smaller than what the IPCC were claiming it to be for years.
The IPCC made it clear they accept the Chimp5 modeling set, therefore your attempted misdirection,is full of misleading crap. It is indeed part of the AR5 IPCC report, just as earlier Chimp versions were, in earlier IPCC reports.
“Climate model results provide the basis for important components of IPCC assessments, including the understanding of climate change and the projections of future climate change and related impacts. The IPCC’s Fifth Assessment Report (AR5) relies heavily on the Coupled Model Intercomparison Project, Phase 5 (CMIP5), a collaborative climate modelling process coordinated by the World Climate Research Programme (WCRP).”
http://www.ipcc-data.org/sim/gcm_monthly/AR5/index.html
From Watts Up With That, is an Annotated form of the Dr. Jones Interview,you have a hard time understanding the significance about those unchangeable warming trends you try so hard to ignore:
Phil Jones momentous Q&A with BBC reopens the “science is settled” issues
“Excerpts from the Q-and-As, with annotations [in brackets], follow.
Q&A: Professor Phil Jones
… The BBC’s environment analyst Roger Harrabin put questions to Professor Jones, including several gathered from climate sceptics. The questions were put to Professor Jones with the co-operation of UEA’s press office.
A – Do you agree that according to the global temperature record used by the IPCC, the rates of global warming from 1860-1880, 1910-1940 and 1975-1998 were identical?
An initial point to make is that in the responses to these questions I’ve assumed that when you talk about the global temperature record, you mean the record that combines the estimates from land regions with those from the marine regions of the world. CRU produces the land component, with the Met Office Hadley Centre producing the marine component.
Temperature data for the period 1860-1880 are more uncertain, because of sparser coverage, than for later periods in the 20th Century. The 1860-1880 period is also only 21 years in length. As for the two periods 1910-40 and 1975-1998 the warming rates are not statistically significantly different (see numbers below).
[This indicates that the recent warming is not exceptional. Moreover, even if it had been “exceptional,” that would not prove it is due to greenhouse gas emissions?]
I have also included the trend over the period 1975 to 2009, which has a very similar trend to the period 1975-1998.
[The fact that the magnitude of the trend for 1975-2009 is smaller than the trend for 1975-98 indicates that there has been no warming OR A DECLINE IN THE RATE OF WARMING from 1998-2009, which is not necessarily the same as saying there has been cooling during this period. HOWEVER, SEE KERR (2009), WHICH INDICATES NO WARMING FROM 1999-2008. Regardless, this is at odds with the IPCC’s model-based claim that were emissions frozen at 2000 levels then we would see a global temperature increase of 0.2°C per decade. This, in turn, suggests that the IPCC models have overestimated the climate sensitivity for greenhouse gases, underestimated natural variability, or both. This also suggests that there is a systematic upward bias in the impacts estimates based on these models. See here.]
So, in answer to the question, the warming rates for all 4 periods are similar and not statistically significantly different from each other. [This indicates that the recent warming is not exceptional. Moreover, even if it had been “exceptional,” that would not prove it is due to greenhouse gas emissions?]”
http://wattsupwiththat.com/2010/02/14/phil-jones-momentous-qa-with-bbc-reopens-the-science-is-settled-issues/
1860-1880 21 0.163 Yes
1910-1940 31 0.15 Yes
1975-1998 24 0.166 Yes
1975-2009 35 0.161 Yes
THINK Brandon,think!
There is no specific evidence of “unusual” warming ongoing since the 1850’s, the trend rate of warming remains essentially UNCHANGED!
There is no obvious AGW signal in it!
sunsettommy,
http://1.bp.blogspot.com/-rP0aIGI9Nfw/VTSlkgnYiVI/AAAAAAAAAbA/vmKrQ-M9IQk/s1600/HADCRUT4%2B40%2BYear%2B1st%2BDerivative.png
Basically, you’re either blind or thoroughly dishonest.
Brandon Gates
sunsettommy made clear statements based on provided evidence that demonstrated recent global warming has been in a series of similar warming periods, and he concluded
Your reply is to provide a graph that shows two of the warming periods which concur with what sunsettommy wrote and you say to him
NO!
Brandon Gates, your post demonstrates beyond doubt that YOU are “dishonest”.
Richard
What’s dishonest is the deliberate ignorance of the fact that Global Average Temperature trends shorter than 30 yrs have no meaning when trying to discern long term Climate Trends.
warrenlb
Your comment confirms what was already known: i.e.
you are so dishonest that you don’t know what honesty is.
And the confidence of global temperature trends depends on the variance of the data and NOT whether or not the time series is 30 years long.
Richard
richardscourtney,
And everything in between. Let’s look at it again, shall we:
http://1.bp.blogspot.com/-rP0aIGI9Nfw/VTSlkgnYiVI/AAAAAAAAAbA/vmKrQ-M9IQk/s1600/HADCRUT4%2B40%2BYear%2B1st%2BDerivative.png
That’s the 1st derivative of a centred 480 month running mean, 12 month “compression” to remove monthly noise, and multiplied by 10 to give decadal rate of change.
The linear trend across the entire interval has a positive slope. A positive slope on the 1st difference means what?
It’s always possible he simply doesn’t understand calculus. What’s your excuse?
Brandon Gates
I don’t need an “excuse” to complain at your dishonesty. You need an excuse for the dishonesty and you have displayed that you don’t have one.
Richard
richardscourtney,
Indeed. Much better to have a reason. Typically, all you’ve got are hand-waving assertions.
Brandon Gates
“Handwaving assertions”?! NO! This detailed complaint.
As usual, when called on your behaviour you display psychological projection.
Richard
Ha ha ha,
You accuse me of dishonesty, when it is straight from DR. Jones who made the claims. I QUOTED from the BBC interview, I posted HIS periodic warming trends temperature data,dating back to the mid 1800’s, posted a chart,Jo Nova made, that is 100% based on HIS temperature trends data he provided to Roger Harrabin for the interview..
The ENTIRE nearly identical warming trends claim came from Dr. Jones!
You are proving to be an irrational being here, or just plain stupid instead.
sunsettommy,
Except for these bits: http://news.bbc.co.uk/2/hi/science/nature/8511670.stm
E – How confident are you that warming has taken place and that humans are mainly responsible?
I’m 100% confident that the climate has warmed. As to the second question, I would go along with IPCC Chapter 9 – there’s evidence that most of the warming since the 1950s is due to human activity.
I – Would it be reasonable looking at the same scientific evidence to take the view that recent warming is not predominantly manmade?
No – see again my answer to D.
Why leave those out, hmmm?
Phil Jones: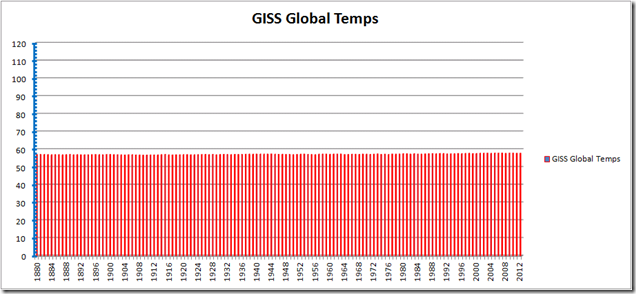
Would it be reasonable looking at the same scientific evidence to take the view that recent warming is not predominantly manmade?
“No”.
As Sunsettommy says: “Ha ha ha”!
Jones flatly contradicts himself:
http://jonova.s3.amazonaws.com/graphs/hadley/Hadley-global-temps-1850-2010-web.jpg
As usual, the numpty brigade (both of them) are running around in circles, clucking that MMGW is a giant problem just around the corner. I am beginning to suspect they actually balieve that nonsense. But normal folks know better. There is nothing unusual or unprecedented happening:
Even the left-of-center mass media now admits that global warming has stopped:
http://www.washingtonpost.com/blogs/capital-weather-gang/files/2014/06/newchart.jpg
And the only way the “authorities” keep their true believers in line is by fabricating scary temperature charts:
Skeptics think for themselves. Others should try that for a change.
Hey Stealey:
http://2.bp.blogspot.com/-RqcviJ-LBFo/VTWzaE5AFNI/AAAAAAAAAbk/J2BX64yHG9A/s1600/GISS%2BGlobal%2Bvs%2BCMIP5%2BTemps%2BF.png
Those models are lookin’ pretty good, hey?
“Hide the decline” they weren’t talking about temperatures were they.
Having seen a claim of a one day heat wave in a BBC weather forecast for the UK on a summer day in 2013, the cartoon sadly has more than an element of truth to it.
Anyone who believes this climate change fantasy is a fool:
— One tiny 22 year period from 1976 to 1998, the only time in the past 4.5 billion years, when manmade CO2 and average temperature rose at the same time, which to leftists is sufficient “proof” that only humans caused the warming from 1976 to 1998 … but … ALL the warming and cooling in every other period during the past 4.5 billion years had only NATURAL causes!
.
More CO2 in the air is good news for green plants, and good news for green plants is good news for humans.
.
Slight warming in the past 135 years is also good news, since the climate was relatively cool in the mid-1800s.
.
Average temperature on a planet not in thermodynamic equilibrium is a meaningless statistic whose compilation is a waste of the taxpayers’ money.
.
AVERAGE TEMPERATURE:
There are very rough estimates for a mere 135 years.
.
4.5 billion years of average temperatures are unknown.
.
Therefore, no one has any clue what a “normal” average temperature is.
.
Even if the measurements from 1880 to 2015 were 100% accurate (a laugh, since 1880s thermometers were so inaccurate, and so few, that all the warming measured since then could be measurement error) … no one could say if the slight warming was good news or bad news.
.
Tiny changes in the average temperature should be ignored.
.
A one degree change in 100 years is a meaningless random variation.
.
If another ice age was starting, that would be worth studying.
.
As with most leftists beliefs, the ‘CO2-caused coming climate catastrophe’ is complete nonsense — just another phony leftist scare (boogeyman) to justify ramping up central government powers (which is the leftists’ solution to all the “problems” they see in life)!
.
Climate knowledge for non-scientists:
http://www.elOnionBloggle.blogspot.com
Warren comes along to make a fool of himself as he pushes an arbitrary 30 year number:
“What’s dishonest is the deliberate ignorance of the fact that Global Average Temperature trends shorter than 30 yrs have no meaning when trying to discern long term Climate Trends.”
You just like Brandon missed the OBVIOUS point, that ALL of the warming TRENDS are nearly identical,going back to 1860,which if you can count past 30 is 115 years.
DR. Jones states they are statistically significant, quoting him:
“Temperature data for the period 1860-1880 are more uncertain, because of sparser coverage, than for later periods in the 20th Century. The 1860-1880 period is also only 21 years in length. As for the two periods 1910-40 and 1975-1998 the warming rates are not statistically significantly different (see numbers below).
I have also included the trend over the period 1975 to 2009, which has a very similar trend to the period 1975-1998.
So, in answer to the question, the warming rates for all 4 periods are similar and not statistically significantly different from each other. ”
He clearly think they are with his YES to each of the individual trends,two which are over THIRTY YEARS LONG!
“1860-1880 21 0.163 Yes
1910-1940 31 0.15 Yes
1975-1998 24 0.166 Yes
1975-2009 35 0.161 Yes”
Please go away……
Sunsettommy: There is no response that can do justice to your lack of comprehension — willful or not– that a 25 year (+/-) pattern cannot define a climate trend, but several such periods strung together does.
warrenlb
You write this nonsense to Sunsettommy:
Say what!?
Where did you obtain such a silly and untrue idea as “a 25 year (+/-) pattern cannot define a climate trend, but several such periods strung together does”?
Also, are you saying the IPCC was wrong to use three successive 4-year periods in its 2004 so-called Scientific Report and if so then why?
Richard
The period usually required to separate climate from weather is 30 years, ie climate is considered the average of weather over a period that long or longer.
The climate of the past 30 years (1985 to 2014) has arguably been warmer than the preceding interval (1955-84) but might not have been warmer than 1925-54 in reality rather than GISS & HadCRU “data”. It is however warmer now than 300 years ago, during the LIA, but cooler than ~3000 years ago, during the Minoan Warm Period (or just after it). It is definitely a lot warmer than 30,000 years ago, during the last big ice age.
milodonharlani
You assert a common misunderstanding when you write
Sorry, but No. That is a misunderstanding.
Any time period can be used for climate but the period must be stated. In fact, a value of GASTA (n.b. global average surface temperature anomaly) for a single year is a datum indicating part of the global climate state for that year.
The 30-year period pertains to a ‘climate normal’ period. It was decided as part of the International Geophysical Year in 1958 because it was thought that no more than 30 years of global climate data then existed.
Correcting the misunderstanding is not helped by the IPCC Glossary including an apparent contradiction. That Glossary defines
That definition clearly says a climate parameter can be stated for “over a period of time ranging from months to thousands or millions of years”.
However, that definition ends by providing the apparently contradictory statement that the “classical period of time is 30 years” and refers to the WMO without the IPCC Glossary itself stating that the 30 years is ‘climate normal’ period.
The ‘climate normal’ period exists so an average of 30 years of data is used as a basis against which climate data is compared. Thus, for example, global average surface temperature anomaly (GASTA) is presented as a difference from an average of 30 years of global surface temperature data. But each team that provides values of GASTA (i.e. GISS, HadCRU, etc.) uses a different 30-year period as its climate normal.
The adoption of 30 years for the climate normal period was completely arbitrary and is to some degree unfortunate: 30 years is not a multiple of the 11-year solar cycle, or 22-year Hale cycle, or etc..
My question about the IPCC 2004 so-called Scientific Report using 4-year periods was intended to clarify that a climate datum is valid for any “period of time ranging from months to thousands or millions of years”.
Richard
Brandon,attempts to undue the damage to himself, with a patented deflection, from my argument,which was about warming TRENDS.
He quote from my link:
“E – How confident are you that warming has taken place and that humans are mainly responsible?
I’m 100% confident that the climate has warmed. As to the second question, I would go along with IPCC Chapter 9 – there’s evidence that most of the warming since the 1950s is due to human activity.
I – Would it be reasonable looking at the same scientific evidence to take the view that recent warming is not predominantly manmade?
No – see again my answer to D.”
You that blind Brandon?
After he already stated that ALL of the short warming trends are nearly identical with each other,and backed it up with data. But here he provides an OPINION, based on climate models.
YOU still fail to notice that the most recent warming trend he claims is man made,is not statistically different from the “natural” ones before 1950. The AGW temperature signal is not visible,from the supplied temperature data.
Pathetic attempt at a feeble deflection.
sunsettommy,
No that would be you. Or dishonest. Or perhaps you don’t understand calculus. Who knows, I’m not a mind-reader. However, for the benefit of those with working eyeballs, intellectual integrity and some proficiency in maths:
http://3.bp.blogspot.com/-MW_NJp28Udc/VNS3EAEqpOI/AAAAAAAAAUs/hjhuLZFkdoM/s1600/hadcrut4%2Bhiatuses.png
1) The overall trend across the entire interval is positive, indicating long term warming.
2) There are two previous 40-year surface warming pauses, from 1870-1910 and 1935-1975. The latter hiatus shows a slightly less negative slope than the former. The present hiatus since 2001 shows an even slighter cooling.
Both are consistent with a mechanism which slows the rate of heat loss. Notice I said consistent with, not conclusive of. Quoting Dr. Jones again:
C – Do you agree that from January 2002 to the present there has been statistically significant global cooling?
No. This period is even shorter than 1995-2009. The trend this time is negative (-0.12C per decade), but this trend is not statistically significant.
Statistically too close to call, in other words. However, 30-40 years’ time is generally regarded as climatologically significant:
http://1.bp.blogspot.com/-rP0aIGI9Nfw/VTSlkgnYiVI/AAAAAAAAAbA/vmKrQ-M9IQk/s1600/HADCRUT4%2B40%2BYear%2B1st%2BDerivative.png
Instead of arbitrarily selecting endpoints for trend analysis as the BBC asked of Dr. Jones, and which my first hiatus plot above does, this plot takes a 40 year centred moving average, takes the 1st derivative to get rate of change, “compresses” the results at 12 months to remove monthly “noise”, and multiplies by 10 to get the final decadal rate of change.
This is a superior method to calculating linear trends from arbitrary end-points. The positive slope of the 1st derivative over the entire interval indicates that positive rate of change has been accelerating. This is consistent with accelerating levels of radiative forcing.
Again, that would be you, for here is how you evidently operate: Your link is 78 pages long, I will ignore it, the same way you ignored the fact that ALL the short warming trends,going back to the 1850’s,fall in a very tight range, centering about .16C per decade.
The evidence for AGW comes from more than just one BBC interview with Dr. Jones, and certainly from more than your quotemined hack job of that interview. Here’s another Q&A you are “ignoring”:
D – Do you agree that natural influences could have contributed significantly to the global warming observed from 1975-1998, and, if so, please could you specify each natural influence and express its radiative forcing over the period in Watts per square metre.
This area is slightly outside my area of expertise. When considering changes over this period we need to consider all possible factors (so human and natural influences as well as natural internal variability of the climate system). Natural influences (from volcanoes and the Sun) over this period could have contributed to the change over this period. Volcanic influences from the two large eruptions (El Chichon in 1982 and Pinatubo in 1991) would exert a negative influence. Solar influence was about flat over this period. Combining only these two natural influences, therefore, we might have expected some cooling over this period.
Got it? CO2 is not the only factor to consider. Go read about internal variability and learn something. Perhaps see also: http://en.wikipedia.org/wiki/Multivariate_statistics
Brandon,fails to notice he is arguing with Dr. Jones,who supplied all the nearly identical trend line data,Brandon now idiotically disputes.
“It’s always possible he simply doesn’t understand calculus. What’s your excuse?”
You have yet to show that Dr. Jones is wrong about his temperature trends.
You don’t even notice that YOUR own chart is making a fool out of you,since the latest warming trend rate is about 50% LOWER,than the earlier warming trend rate,that you stopped at the 1998 date line.
Why did you exclude the last 17 years of data?
This is HadCrut4 since 1998:
http://www.woodfortrees.org/plot/hadcrut4gl/from:1998/to:2015.3/plot/hadcrut4gl/from:1998/to:2015.3/trend
This is HadCrut4 for this century only:
http://www.woodfortrees.org/plot/hadcrut4gl/from:2001/to:2015.3/plot/hadcrut4gl/from:2001/to:2015.3/trend/plot/rss/from:2001/to:2015.3/plot/rss/from:2001/to:2015.3/trend
The rate of warming trend went down,down and…..zzzzzz
Ha ha ha….!!!!
sunsettommy,
Please point to the exact text where I said that the trends the BBC asked Dr. Jones to speak to are in dispute.
I didn’t. Here’s the first step of the plot: http://www.woodfortrees.org/plot/hadcrut4gl/mean:480
See, no date filters. Ponder the meaning of a 480 month centred running mean.
So sorry to keep you awake past your bedtime, sunset. I imagine that my droning on and on about internal variability and multivariate statistics applied to a complex dynamic system would tend to get boring to folks who already have their minds made up based on their simplistic, wilfully ignorant way of being “sceptical”.
@Brandon Gates
“Are you going to say the temperature data from HadleyCrut4 is wrong?”
Irrelevant.
Of COURSE that HadCrut4 data from 1850 to present shows WARMING. If it didn’t, we would still be in the Little Ice Age.
If you would actually PREFER that the temperatures were still the same as they were back in 1850, please just come out and say so!
Then, you post some really cool graphs on Natural and Human Forcing, which are based upon the CMIP models; however, you fail to use any sort of logic whatsoever.
The models ASSUME that CO2 drives temperature, so OF COURSE the model output is going to SHOW enhanced CO2 FORCING as CO2 increases in the atmosphere!!! (DUH). The one MAJOR PROBLEM is that you forgot to prove that the models are actually CORRECT in any way, shape or form.
So, all you have shown in those posts is that the temperature has indeed risen since the end of the Little Ice Age (which is a really GOOD thing, in my opinion), and you have shown that models that are tuned to show CO2 as the major forcing component in the atmosphere actually do show CO2 as the major forcing component… but that doesn’t actually mean anything whatsoever unless you can show that the models are actually CORRECT and have any real predictive power whatsoever.
So, to cut to the chase, simply show us that the CMIP models are actually correct and useful, and then we can go from there.
Gates says: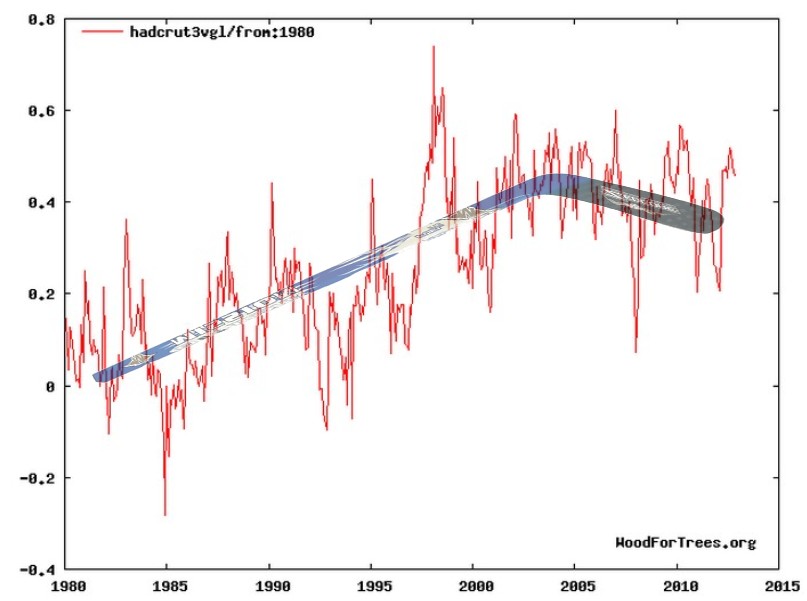
I imagine that my droning on and on…
As always. Next:
warrenlb’s incessant fixation with his appeals to authorities continues:
…the worlds Science Academies… the worlds Scientific Professional Societies… the major Universities… NASA… NOAA… All those institutions…&blah, blah, etc.
Those are just false Appeal to Authority logical fallacies that warrenlib always hides behind. He can’t think for himself, so he needs someone to give him talking points. If they told him to join the other lemmings and jump off a cliff, he would probably do it for the simple reason that they have a title, and warrenlb is infatuated with titles.
Fools don’t think for themselves; they are unquestioning when it comes to official government narratives. Anyone who cannot see governments’ ulterior motives (carbon taxes and political power) is a truly naive and credulous numpty. The old Soviets used to call them ‘useful fools’.
If global temperatures had been rising steadily for the past 18+ years, scientific skeptics (the only honest kind of scientists) would be working hard to find solutions to the problem.
But there is no problem. It’s all good. Global warming has stopped; even the head of the IPCC admits that. The MMGW scare is a false alarm. It simply is not happening:
Read my lips Stealey: internal variability.
http://1.bp.blogspot.com/-oxFP6mUKqIY/VTWEdb3gJzI/AAAAAAAAAbU/YiRjFJ8Zb8M/s1600/HADCRUT4%2B12%2Bmo%2BMA%2BForcings.png
So between 1910 and 1940 human emissions caused the same warming trend as 1980 – 1997??
That makes no sense. CO2 emissions were far higher in the last half of the century.
Yes, it’s variability: Natural variability. That is what your chart shows.
Once more: MMGW is a conjecture. Nothing more. It is a measurement-free belief; an opinion. And it requires suspension of faith in the scientific method, and in Occam’s Razor, and in common sense.
But by all means, believe anything you want. It’s a free country.
PeterB in Indianapolis,
Quite relevant to the context of the discussion: sunsetttommy had just asked me if I disputed HADCRUT4 trends over the past 18 years.
I presume you don’t believe in magic and can offer a plausible physical mechanism to explain the observed temperature rise.
Ok, 1850 looks reasonably comfy to me. I don’t think it’s reasonable to get there any time soon however, and I’m not one for wishful thinking.
lol, ok. This ought to be good.
Ah. The reason we humans do science is because we’re not omniscient and are trying to better understand how things work. When we don’t know stuff, we start with assumptions and then test them. IOW, doing science without making assumptions is impossible.
Sorry, but your mind-reading skills are abysmal. I didn’t “forget” to “prove” anything. In the context of that particular discussion, the plots of CMIP3 and CMIP5 I posted were meant to demonstrate that from AR4 to AR5 the IPCC have downgraded their near term projections of temperature trends. I also pointed out that the IPCC say that CMIP5 runs ~10% hotter than observation. IOW, the models are WRONG, as all models are — else they’d be reality.
But I can’t do that. See again: All models are always wrong. Nor can I “prove” that your opinion of us being better off warmer than the LIA is “wrong”.
Utility is a personal choice. I can tell you why I think CMIP5 is useful, whether you accept my reasons or not is entirely up to you. If that’s what you like me to do, ask me that question, and we can go from there.
Brandon Gates
You repeatedly assert that it is “internal variability” which causes the empirical data to refute your assertions.
Please state what you mean by “internal variability” and how you determine when it is and when it is not altering the empirical data.
Richard
richardscourtney,
See again this plot I posted in response to dbstealey:
http://1.bp.blogspot.com/-oxFP6mUKqIY/VTWEdb3gJzI/AAAAAAAAAbU/YiRjFJ8Zb8M/s1600/HADCRUT4%2B12%2Bmo%2BMA%2BForcings.png
And my follow-on description of it: http://wattsupwiththat.com/2015/04/18/too-many-wild-cards-in-the-climate-game/#comment-1912694
Also my response to your similar questions below: http://wattsupwiththat.com/2015/04/18/too-many-wild-cards-in-the-climate-game/#comment-1913182
Your question makes no sense to me. As I see it, internal variability does not alter empirical data — it is manifest in empirical data.
Brandon Gates
I asked you
You have NOT answered either question.
Instead, you have copied&pasted irrelevant graphs and linked to meaningless waffle with which you have polluted this thread.
The nearest you provide to and answer is in this link
http://wattsupwiththat.com/2015/04/18/too-many-wild-cards-in-the-climate-game/#comment-1912694
which you provided.
In that link you say
Clearly, what you call “internal variability” is an undefined excuse for all disagreements of the models with reality. In other words, your “internal variability” is magical mystery.
Richard
dbstealey,
Nope. CO2 is the only anthropogenic effect I take into consideration, top plot, light blue line. From 1910-1940 CO2 contributed about 0.05 K, solar (same plot, yellow line) about 0.10 K. 1980-1997, CO2 just shy of 0.20 K, call it 0.18, solar maybe about 0.05 K.
No kidding. Look at the light blue line, clearly labelled ln(CO2/280) * 2.23 in the upper most plot. That 2.23 is the regression coefficient that comes out of the multiple regression from which the TSI and AOD (volcanic aerosol) coefficients are also derived.
The MIDDLE plot shows internal variability. Dark blue line is the residual of the external forcings (CO2, solar, volcanic aerosols), the magenta line is calculated based on AMO, NINO and length of day anomaly (LOD). The bottom plot breaks those three out so that you can see their individual contributions to the overall trend.
Make up your mind already, Stealey:
http://wattsupwiththat.com/2015/04/16/climate-naysayers-are-giving-climate-skeptics-a-bad-name/#comment-1909004
They are graphs from different sources, and they all show the same thing because they are based on radiative physics. They accurately reflect real world observations.
Show us the observations already. Tell us how the measurements were performed to confirm them. Walk us through these radiative physics you apparently know so much about.
Cat got your tongue or something?
PeterB…,
“So, to cut to the chase, simply show us that the CMIP models are actually correct and useful, and then we can go from there.”
He already admitted they are not when he said earlier:
“CMIP3 a tenth of a degree hotter than CMIP5. Science is iterative. Doesn’t get things right on the first try. Sometimes not the 4th try. IPCC notes in AR5 when it was published that CMIP5 runs ~10% hotter than it should based on observation. Am I getting through yet?”
http://wattsupwiththat.com/2015/04/18/too-many-wild-cards-in-the-climate-game/#comment-1911812
He fails to notice that even the most up to date,most accurate Chimps5 is still wrong as it runs hot,just like all the other Chimps models do,since it STILL projects a warming trend the first two decades,while the temperature data show NO warming at all, the first 13 plus years of the new century:
http://www.woodfortrees.org/plot/hadcrut4gl/from:2001/to:2015.3/plot/hadcrut4gl/from:2001/to:2015.3/trend/plot/rss/from:2001/to:2015.3/plot/rss/from:2001/to:2015.3/trend
Brandon is a silly man here.
sunsettommy,
Yup, that’s what I wrote. That’s what the IPCC says.
ROFL!!! How can I fail to notice something that I explicitly pointed out?!?
Well yes, I “admit” … I am at risk of getting a severe case of giggles watching you tie your own shoelaces together. This brings me full-circle the self-contradiction I pointed out in my first post which stared this whole circus:
Then there are the massive oceans, whose vast heat capacity and ever-changing currents and oscillations also regularly trump the steady but tiny influence from man’s industry.
In order to explain the failure of their carbon-centric forecasts, the alarmists have thrown several other wild cards into the climate game. These include heat losses into the deep oceans and unexpected variations in earth’s cover of ice, snow, soot, particulates and volcanic dust.
So far, nobody has been able to unravel for me whether Viv thinks the oceans can affect temperature trends or not. How many times must I write internal variability in BOLD before you Jokers get past the dissonance and stop blubbering, “bbbbbbbutt MODELS”?
Brandon, the models you drools on fails EVERY TIME! Meaning the AGW conjecture they base it on is a failure.
The Scientific Method make clear that it MUST pass tests made against it,before it can gain credibility,but those Chimp models have failed for YEARS,somehow still tickles Brandon’s fancy, despite a 100% failure rate.
They have NO demonstrated credible predictive value, they have been wrong for 20 years now.!
Unreal…..
You make no sense, sunsettommy. How about addressing the substance of Gates reply.
sunsettommy,
You said that. I read it the first time. Of course they fail every time, they’re models.
lol. Of the thousands of things that can be wrong with an AOGCM, you pick the one thing which obviously isn’t.
Yes, your departure from reality has been quite apparent for some time now.
Brandon Gates
You dispute the accurate statement of sunsettommy that the models consistent failure demonstrates their predictions are wrong.
Please say anything you think the models have got right because decades of study convince me that they get nothing right.
Or are you claiming the mythical “internal variability” – which you repeatedly cite but don’t define – explains the models’ failure as you have repeatedly claimed it explains why the empirical data refutes your assertions?
Richard
richardscourtney,
All models are always wrong. The question is whether or not they’re useful. See also: model skill is not an all-or-nothing proposition. Skill scores are also relative. Much depends on the reference model used in the evaluation.
In short, “[the models] get nothing right” is ignorant gibberish. Whether yours is an incidental, wilful or feigned ignorance I cannot tell. Incidental ignorance is something I deem pardonable. The latter two types, not so much.
The CMIP5 ensemble is best at hindcasting within the bounds of annual- and decadal-scale natural variability, of which internal variability is the largest component. Forward-looking projections are not as good. It is my understanding that one main reason is that the hindcast portion of a CMIP5 model run uses empirical observations for solar output, volcanic aerosol forcing, and atmospheric GHG mixing ratios to drive the radiative forcing calculations. We do not know what those will be in the future with any certainty. This is especially true of GHGs, since the overtly stated policy goal is to reduce them — a goal which meets some significant resistance, to put it quite mildly.
Hence, Representative Concentration Pathways or RPCs, assumed emissions scenarios designed to give policy makers bounded estimates of the potential impacts of various policy choices. Not predictions or forecasts, but projections based on assumed scenarios. CMIP5 is more a policy tool than a scientific tool in this regard.
Component models of the CMIP5 ensemble do have scientific uses, namely hypothesis formulation and some limited testing. They are also used to make inferences in cases where data are sparse. In my view, the best use of such inferences is to assist researchers in directing their efforts toward the most promising avenues of empirical research rather than allocating scarce fiscal and human resources to turning over every rock they happen upon simply because it’s there.
What empirical data refutes which of “my” assertions? Specifics, please.
Again, I quote the paragraph which was central to my very first post in this thread:
Then there are the massive oceans, whose vast heat capacity and ever-changing currents and oscillations also regularly trump the steady but tiny influence from man’s industry.
In order to explain the failure of their carbon-centric forecasts, the alarmists have thrown several other wild cards into the climate game. These include heat losses into the deep oceans and unexpected variations in earth’s cover of ice, snow, soot, particulates and volcanic dust.
How do you reconcile the apparent self-contradiction? You should not need to appeal your opinions regarding model failures to answer.
Brandon Gates
Your asserted magical mystery of “internal variability” is superstitious nonsense.
And you repeatedly make the daft assertions that
A model is wrong when it fails to provide predictions and/or descriptions that are within their determined accuracies and precisions.
All climate models are wrong.
Useful models are NOT “wrong”: they provide predictions and/or descriptions that are “right” to within their determined accuracies and precisions.
All climate models are wrong and, therefore, they are NOT useful.
Forecast skill is determined by comparing a series of predictions with empirical outcomes. No climate model has existed for the decades required to provide a series of future predictions of climate. Hence, although climate models may be useful heuristic tools, no climate model has any demonstrated predictive skill.
Climate models have the same demonstrated predictive skill as the casting of chicken bones.
Scientific models are evaluated by comparison with reality and NOT by comparison with other models selected as reference. Skill scores of models are relative to the models’ ability to predict outcomes in the real world and NOT what some other model does.
Evaluating a model by comparing its performance to the performance of another model is pseudoscience.
Brandon, you have polluted almost every part of this thread with your nonsense.
Richard
IPCC bases its various predictions on four model cases:
Case CO2 Radiative Dry air, ΔF Increment in global water content
Concentration Forcing to absorb heat of CO2 RF
RCP 2.6 421 ppm 3.0 W/m2 0.011 incremental global water vapor 0.12%
RCP 4.5 538 ppm 4.5 W/m2 0.017 incremental global water vapor 0.18%
RCP 6.0 670 ppm 6.0 W/m2 0.023 incremental global water vapor 0.23%
RCP 8.5 936 ppm 8.5 W/m2 0.033 incremental global water vapor 0.33%
A watt is a power unit, energy over time, and equals 3.4 Btu/h.
In 24 hours the entire atmospheric volume will rotate through this RF heat flux and accumulate x.xx Btus.
For dry air, no moisture, 0% RH, to absorb this x.xx Btu would result in a temperature increase of x.xx F.
The evaporation of water into vapor at about 950 Btu/lb, absorbing that x.xx Btu, without any increase in temperature, i.e. isothermal, would increase the atmospheric water content by about x.xx%, i.e more clouds, more albedo, less heat.
It’s the water vapor thermostat that controls the greenhouse, not CO2. It’s the water vapor thermostat that controls the simplistic blanket analogy as well.
The hiatus heat went into a few more clouds, not the ocean.
Same old straw men presented again and again – dull.
harrytwinotter
You say
Yes, but I and others have tried to stop Brandon Gates from polluting the thread with those “same old straw men presented again and again”. Sadly, our failure to stop him doing it has – as you say – made the thread “dull”.
Richard
I think you know full well I was referring to the article.
harrytwinotter
What on Earth gave you that idea? I answered what you wrote.
Richard
How can we say that humans are not the cause of the increase in CO2 in the atmosphere when since the Industrial Revolution, our CO2 levels have done nothing but increased? As humans, we have the potential to emit nearly 29 gigatones of CO2 per year. While CO2 that is emitted from humans may not be more than what oceans and plants emit,the CO2 from humans cannot be contained the Carbon Cycle. The CO2 emitted from plants and oceans is cycled back into these locations; whereas from humans….it just stays in the atmosphere because the land and ocean cannot absorb any more.
Therefore we cannot definitely say that the sun is the “Ace” in the game when humans have caused the increase in CO2.
Not to mention, clear un-manipulated data shows us that while temperature has gone up in recent years, solar activity has gone down.
Not only has solar climate forcing slightly decreased as you say, the magnitude of solar climate forcing is quite small compared to the enhanced greenhouse effect. Good luck getting your restatement of basic science accepted on this forum.
“the CO2 from humans cannot be contained the Carbon Cycle.” >Ah It’s the wrong kind of CO2!
It has nothing to do with it being the “wrong kind of CO2.” My point here is that the CO2 nature emits from the ocean and land is then reabsorbed back into these locations. The CO2 emitted from nature is anywhere from 220 (Land) to 332 (ocean) gigatonnes per year. While this is more than the 29 gigatonnes that humans emit, the problem is that this CO2 we emit is not reabsorbed into nature like the CO2 the ocean and land emits. The natural balance is upset when only about 40% of the CO2 we emit can be absorbed, the rest stays in the atmosphere.
Water vapor runs the climate, not CO2. Whatever miniscule heating man caused CO2/GHGs cause, water vapor just soaks it up. IPCC says man caused GHGs added less than 3 W/sq m between 1750 and 2011. Compare that to the 340 W/sq m at the top of atmosphere. CO2 is a bee fart in a water vapor hurricane.
While water vapor is a dominant greenhouse gas, it actually creates a positive feedback loop that amplifies the changes in temperature caused by CO2. The water vapor in our atmosphere does not increase drastically like the CO2 in our atmosphere has been doing for years. As CO2 increases, the water vapor that has remained constant just furthers the temperature increase causing many to think that global warming is caused solely by water vapor. We could only rule out CO2 as the main contributor to global warming if it had not increased so much since the Industrial Revolution and wasn’t continuing to increase today.
“Without the inclusion of clouds, water vapor alone contributes 36% to 70% of the greenhouse effect on Earth. When water vapor and clouds are considered together, the contribution is 66% to 85%.” Wiki
Water vapor concentration is 2,500 ppm compared to CO2’s 400. It’s not “a” dominant GHG it’s “the” dominant GHG. Water vapor doesn’t have to change drastically. Because of the enormous latent heat of evaporation/condensation a little bit goes a long way.
IPCC AR5
7.2.1.2 Effects of Clouds on the Earth’s Radiation Budget
The effect of clouds on the Earth’s present-day top of the atmosphere (TOA) radiation budget, or cloud radiative effect (CRE), can be inferred from satellite data by comparing upwelling radiation in cloudy and non-cloudy conditions (Ramanathan et al., 1989). By enhancing the planetary albedo, cloudy conditions exert a global and annual short¬wave cloud radiative effect (SWCRE) of approximately –50 W m–2 and, by contributing to the greenhouse effect, exert a mean longwave effect (LWCRE) of approximately +30 W m–2, with a range of 10% or less between published satellite estimates (Loeb et al., 2009). Some of the apparent LWCRE comes from the enhanced water vapour coinciding with the natural cloud fluctuations used to measure the effect, so the true cloud LWCRE is about 10% smaller (Sohn et al., 2010).
!!!!!The net global mean CRE of approximately –20 W m–2 implies a net cooling!!!!
(emphasis mine)
Anthropogenic GHGs add less than 3 W/m2. CRE cooling is six times as much as GHG warming.
Water vapor runs the climate? I don’t think so, and neither does any scientist, or any engineer who understands that water vapor in the atmosphere is a function, almost entirely, of temperature…so the total average water vapor content Is roughly constant when averaged over time and the globe. So the large contribution of water vapor to the Greenhouse effect is roughly constant…whereas CO2’s contribution, the 2nd largest, is increasing each year, adding to the greenhouse effect., and thus is the largest contributor to the industrial eras warming of the Climate.
“Without the inclusion of clouds, water vapor alone contributes 36% to 70% of the greenhouse effect on Earth. When water vapor and clouds are considered together, the contribution is 66% to 85%.” Wiki
Water vapor is 2,500 ppm, CO2 400 ppm.
The latent heat of evaporation and condensation by water vapor absorbs/releases heat a thousand times more effectively than CO2.
This BSME & PE with 35 years in energy knows so.
IPCC AR5 TS.6 Key Uncertainties is where climate science “experts” admit what they don’t know about some really important stuff. They are uncertain about the connection between climate change and extreme weather especially drought. Like the 3” drought that hit Phoenix. They are uncertain about how the ice caps and sheets behave. Instead of gone missing they are bigger than ever. They are uncertain about heating in the ocean below 2,000 meters which is 50% of it, but they “wag” that’s where the missing heat of the AGW hiatus went, maybe. They are uncertain about the magnitude of the CO2 feedback loop, which is not surprising since after 17 plus years of rising CO2 and no rising temperatures it’s pretty clear whatever the magnitude, CO2 makes no difference.
http://www.writerbeat.com/articles/3713-CO2-Feedback-Loop
Barring some serious flaw in science or method, Miatello’s paper should serve as the death certificate for AGW/CCC.
http://principia-scientific.org/publications/PSI_Miatello_Refutation_GHE.pdf
http://www.climatism.net/facts-about-global-warming/
Is my reply to warrenlb in moderation? Lost? Don’t want to repeat it.
Now for something completely different.
https://pielkeclimatesci.wordpress.com/2006/05/05/co2h2o/
This analysis shows that
1. The effect of even small increases in water vapor content of the atmosphere in the tropics has a much larger effect on the downwelling fluxes, than does a significant increase of the CO2 concentrations. Thus, the monitoring of multi-decadal water vapor trends in the tropics should be a high priority. While the increase in CO2 concentrations, and resulting increase in downwelling longwave flux can result in surface ocean warming, and thus increase evaporation into the atmosphere, it is the atmospheric water vapor signal that should be monitored for long term trends, as it is the dominant greenhouse gas that has the greater climate response.
2. The fractional contribution of the effect of added CO2, relative to a 5% increase of water vapor in the subarctic winter is significantly larger than in the tropical sounding. This is because the subarctic sounding is quite dry. An increase in absolute terms of water vapor similar to a 5% increase in the tropical sounding would, however, dominate the increase of downwelling longwave fluxes. This again indicates that the assessment of long term water vapor atmospheric concentrations needs to be a climate science priority.
Your voluminous posts miss the point entirely. Water vapor accounts for the largest portion of the 60F elevation of earth’s temp above that which it would be without atmosphere (about 0F). But that portion is constant. The smaller greenhouse portion is rising.. Assessment of w,ate vapor, as you state, is a vital art of overall understanding of the climate, but that research confirms its not the reason or increasing global temperatures.
warrenlb
As usual, your post only serves to demonstrate your ignorance and bias.
Pielke is assessing the existing atmosphere in which the absorbtion of IR by CO2 is in the 15 micron and 4 micron bands. These bands (especially the 15 micron) are so near to saturation in the existing atmosphere that they only increase absorbtion by band broadening.
Water vapour in the existing atmosphere also absorbs in the 15 micron and 4 micron bands so its absorbtion of IR reduces any absorbtion possible by CO2 and – very importantly – water vapour also absorbs over almost all the IR spectrum with most IR wavelengths NOT nearly saturated.
For these reasons, as Pielke says,
“The effect of even small increases in water vapor content of the atmosphere in the tropics has a much larger effect on the downwelling fluxes, than does a significant increase of the CO2 concentrations.”
and
“… the subarctic sounding is quite dry. An increase in absolute terms of water vapor similar to a 5% increase in the tropical sounding would, however, dominate the increase of downwelling longwave fluxes.”
Pielke argues for monitoring of atmospheric water vapour and your response is to say to not ‘look behind the curtain’.
Richard
richardscourtney.
I say (to nickreality65): “Assessment of water vapor, as you state, is a vital art of overall understanding of the climate, but that research confirms its not the reason for increasing global temperatures.”
You say (to me): “your response is to say to not ‘look behind the curtain’.
So are you claiming that I don’t want to look at water vapor, even though I said research IS looking at water vapor’s role?
And are you claiming, in contradiction to the science, that water vapor, not CO2, is the largest contributor to the RISE in global temperatures since 1950?
Water vapor is not added to the atmosphere like CO2, it is a constant function of temperature like warrenlb mentions. CO2 is added to the atmosphere constantly each year and its addition is amplified by water vapor, causing temperatures to rise even more. So while you want to believe that water vapor is the reason behind climate change, its actually CO2 that essentially pushing people to believe water vapor is the problem. CO2 is the culprit in all of this and this is backed by 96% of scientists world wide.
96% is total bunk!
To nickreality65 – many people do not want to believe we are the issue because they focus on the information they want to believe. Many deniers do not want to look at the actual peer reviewed research that goes against what they believed for so long. Between 1991 and 2012, nearly 14,000 scientific peer reviewed journals were reviewed, and only 24 did not believe in global warming or did not believe we were the problem. The reasons these 24 papers presented against global warming were all further debunked.
The popular 96% consensus stems from four aged surveys: Doran & Zimmerman, Anderregg, Oreskes, and Cook. Poorly written with ambiguous questions, badly executed, and thoroughly cherry picked. Google such.
The 96% consensus boils down to this: A selection of self-proclaimed “climate” scientists (self-important Chicken Little blowhards) actively researching and publishing in their field (insert getting paid) coauthoring and pal reviewing each other’s repetitious, derivative, yet voluminous works and numbering fewer than 100.
Some consensus.
Part One: Heating the earth
A popular global heat balance shows 340 W/m2 incoming radiative flux at the top of atmosphere. A watt is a power unit, energy over time, equaling 3.41 Btu of energy/heat/work per hour. Over a 24 hour period the earth’s ToA semi-spherical surface would collect 7.13E18 Btu of energy.
Dry air is mostly nitrogen and oxygen with a heat capacity of about 0.24 Btu/lb-F. For dry air to absorb 7.13E18 Btu would require a temperature increase of about 2.63 F. Over 24 hours.
Water vapor evaporates/absorbs, condenses/releases, energy/heat at about 1,000 Btu/lb. For atmospheric water vapor to absorb 7.13E18 Btu through evaporation would require an amount equal to 25.5% of the current atmospheric water vapor content, i.e. more clouds, more albedo, more reflection, a self-correcting thermostat. That’s the entire ToA!
Part Two: IPCC RCPs
IPCC AR5 states that between the years 1750 and 2011 man generated GHGs increased the RF by less than 3 W/m2. (Is that the downwelling?) Contrast that figure with the ToA.
IPCC bases its various computer model predictions on four cases:
Case………….…CO2 ………….……Radiative……Dry air, ΔF………..Increase in atmospheric
………………….Concentration……..Forcing………………………………water vapor content
RCP 2.6…………421 ppm CO2……..3.0 W/m2………0.02……………..……….0.2%
RCP 4.5…………538 ppm CO2……..4.5 W/m2………0.03………………………0.3%
RCP 6.0…………670 ppm CO2……..6.0 W/m2………0.05………………………0.4%
RCP 8.5…………936 ppm CO2……..8.5 W/m2………0.07………………………0.6%
It’s the water vapor thermostat that controls the greenhouse, not CO2. It’s the water vapor thermostat that controls the simplistic blanket analogy as well. The hiatus heat went into a few more clouds, not the ocean.
Yes, the IPCC is consistent with what I said –Water vapor is responsible for the substantial (60F) elevation of earth’s temperature above its thermal equilibrium of 0F without atmosphere. And CO2 is driving that degree of elevation higher, and as Melissa b 206 says:
“While water vapor is a dominant greenhouse gas, it actually creates a positive feedback loop that amplifies the changes in temperature caused by CO2. The water vapor in our atmosphere does not increase drastically like the CO2 in our atmosphere has been doing for years. As CO2 increases, the water vapor that has remained constant just furthers the temperature increase causing many to think that global warming is caused solely by water vapor. We could only rule out CO2 as the main contributor to global warming if it had not increased so much since the Industrial Revolution and wasn’t continuing to increase today”
All consistent with the IPCC, and established science.
Sensible heating of water vapor due to CO2 “downwelling” radiation exhibits a relatively trivial positive feedback.
Evaporation of water vapor at a constant temperature, absorbing heat from the air, is a negative feed back by a factor of 1,000. That’s how evaporative coolers work, that water soaked canvas water bag, the damp sweat band around your forehead, the sweat on your body.
Water vapor is an extremely effective heat modulating thermostat. But water vapor is not caused nor cured by man and therefore outside IPCC’s mandate and consideration.
“And are you claiming, in contradiction to the science, that water vapor, not CO2, is the largest contributor to the RISE in global temperatures since 1950?”
Evaporating water absorbs heat without increasing the temperature and explains the 20 year pause. CO2’s radiative forcing is trivial in comparison. IPCC AR5 TS6 even admits uncertainty about its magnitude. The rise since 1950 was from some other source than CO2, e.g. ocean floor geothermal heat flux or simply natural variability, noise in the data.
“…in contradiction to the science…”
Is this your own observation and research or simply one of the plethora of talking points on the clipboard they gave you to hang in your cubicle. I guess $7.50 an hour in the internet version of a call center beats selling plasma.
As someone else noted, on the internet nobody can tell whether you are a talking dog, 12 year old in a basement, or a trained monkey.
Schmidt et al. (2010) analysed how individual components of the atmosphere contribute to the total greenhouse effect. They estimated that water vapor accounts for about 50% of the Earth’s greenhouse effect, with clouds contributing 25%, carbon dioxide 20%, and the minor greenhouse gases and aerosols accounting for the remaining 5%. The study is based on the 1980 atmosphere as a reference.
So, some questions for you:
1) How much do you say this effect from water vapor is increasing over time? Why is it increasing? Your own words, please. .
2) How much has atmospheric CO2 increased since 1750? Why is it increasing?
1) The GHE w/o the latent heat of water vapor, only the sensible heat from “downwelling.” Sensible heat has a positive feedback (makes the atmosphere hotter), latent heat a negative feedback (makes the atmosphere cooler) orders of magnitude larger.
2) a) See WG1AR5_SPM_FINAL B.5 and C. I’s in there somewhere. b) natural variability.
The sea ice/sheets/caps on Antarctica/the Arctic/Greenland/Iceland are shrinking/growing yes/no/maybe depends on who’s counting.
Polar bears and penguins are endangered/having a hard time/pretty much as usual yes/no/maybe depends on who’s counting.
The sea levels are rising, land is subsiding yes/no/maybe depends on who’s counting.
The global temperatures are rising/falling/flat lining based on satellite/tropospheric/sea surface/land surface with or without UHI/TOB/homogenization/adjustments/bald faced lying yes/no/maybe depends on who’s counting.
Nothing but sound and fury, tales told by people missing the point, signifying nothing. The only meaningful question is what does CO2 have to do with any of this? How are these contentious topics connected to CO2?
IPCC’s dire predictions for the earth’s climate are based entirely on computer models, models which have yet to match reality. The projections began with a 4 C increase by 2100 which has since been adjusted down to 1.5 C.
The heated discussions mentioned above attempt to retroactively validate or refute those models, models driven by the radiative forcing/feedback of CO2 and other GHGs. IPCC AR5 TS.6 says that the magnitude of the radiative forcing/feedback of CO2 “…remains uncertain.” (Google “Climate Change in 12 Minutes.”) Implying that IPCC was also uncertain in AR4, 3, 2, 1.
IPCC is not uncertain about one issue, though, redistribution of wealth and energy from developed countries to the underdeveloped ones to achieve IPCC’s goal of all countries enjoying above average standards of living.
Besides, the greatest threat to mankind isn’t CO2, it’s hot lead.
http://www.writerbeat.com/articles/3713-CO2-Feedback-Loop
@nickreality: My posts questions were directed to you. Care to try to answer?
The sun becoming hotter is not the cause for global warming. Evidence shows that in the last 35 years of global warming, sun and climate have been going in opposite directions.
1) Global warming has stalled for nearly 20 years.
2) The time integral of TSI matters more than TSI for a single year, decade or multidecadal interval.
3) TSI is not the metric that matters most. Its spectral composition & magnetic flux are more important for climate.
1b) In the least cooked books (RSS & maybe balloon data, but haven’t checked lately), the globe is already cooling. Further decline in solar activity is likely to accelerate this trend.
Global warming has not stalled. In terms of climate, 20 years is a relatively short period of time. Climate is a long term thing, not a short term thing. While we can say that 2005 and 2010 are tied for the hottest years on record globally, that is not looking at the long term. To do so, we have to look at Oceans, that contain 90% of the heat that comes from global warming. Data shows us that ocean temperatures are still rising today. Also, global warming cannot “Stall” when CO2 is still being released into the atmosphere.
Melissa,
Yes it has stopped warming this century,in complete contradiction to the IPCC’s “best estimate”modeling projection.:
“For the next two decades, a warming of about 0.2°C per decade is projected for a range of SRES emission scenarios. Even if the concentrations of all greenhouse gases and aerosols had been kept constant at year 2000 levels, a further warming of about 0.1°C per decade would be expected. for at least a .20C per decade warming rate for the first two decades:”
http://www.ipcc.ch/publications_and_data/ar4/wg1/en/spmsspm-projections-of.html
The official temperature data shows about ZERO after 13 plus years:
http://www.woodfortrees.org/plot/hadcrut4gl/from:2001/to:2015.3/plot/hadcrut4gl/from:2001/to:2015.3/trend/plot/rss/from:2001/to:2015.3/plot/rss/from:2001/to:2015.3/trend
As Melissa correctly says, the build up of thermal energy in the Earth’s system hasn’t stalled –cannot stall unless GHGs are by some miracle removed from the atmosphere– and they continue to increase every year. Less and less IR escapes Earth as GHGs build up in the atmosphere; it goes wherever the laws of physics direct it –into the oceans mostly (90+%) and 3 % into the atmosphere.
Weather cycles can trump the impact of that 3% to the atmosphere for decades — and the oceans can absorb more for decades — the research points to both effects for the last 18 years. (And the models aren’t capable of an 18 year projection, nor do the modelers claim so –in spite of your strawman argument).
The heat energy being absorbed by the planetary system will eventually be seen in the Climate –unless you think the oceans have infinite heat capacity. There’s no where else for it to go but into water, land, and the atmosphere.
Global warning has not stalled. Evidence show that over the past couple years earth’s average temperature continues to rise. Not just that but cO2 numbers have also risen therefore enhancing global warming.
What alternate universe do you live in.
https://stevengoddard.wordpress.com/2015/04/24/state-of-the-climate-scam-report/
Based on the last few posts from Melissa, Sheldon, and myself, and more importantly on the science, it appears you have missed the point about thermal energy buildup in the Earth’s system –the driver of long term climate change.
Yes, with zero warming trend for this century as well.
http://www.woodfortrees.org/plot/hadcrut4gl/from:2001/to:2015.3/plot/hadcrut4gl/from:2001/to:2015.3/trend/plot/rss/from:2001/to:2015.3/plot/rss/from:2001/to:2015.3/trend
RealClimate admits that CO2 simply doesn’t warm the ocean waters.which most skeptics long understood.
RealClimate admits doubling CO2 could only heat the oceans 0.002ºC at most
“According to the IPCC, a doubling of CO2 levels allegedly increases forcing by 3.7 Wm-2 at the top of the atmosphere and by only about 1 Wm-2 at the surface. The paper cited by RealClimate is measuring the effect of longwave forcing at the surface, therefore we assume 1 Wm-2 from doubled CO2 at the surface. Using the slope of the relationship, 0.002ºK (W/m2)-1, we find that doubling of CO2 concentrations could only reduce the temperature gradient 0.002*1 = 0.002ºC.”
http://hockeyschtick.blogspot.co.uk/2012/09/realclimate-admits-doubling-co2-could.html
It is really Sun> Ocean> Atmosphere> Space, cycle.
Glad to see you’re reading and quoting Realclimate! It’s a Real Science site. But it’s your interpretation that’s wrong…..The temp rise in the oceans is small because the specific heat of water is high,not because the amount of heat energy being absorbed is small…rather THAT is enormous—The thermal energy being absorbed by oceans is equal to 4 Hiroshima sized atomic explosions per second, continuously, over the last 18 years. Enormous amounts of heat that ultimately must be exchanged to the atmosphere.
And real climate accepts the consensus finding of Science for climate sensitivity of the atmosphere…1.5C to 4.5C , for a doubling of CO2. Same as the IPCC.
IPCC AR5 Figure 6.1
Between 1750 and 2011 the global CO2 balance increased 240 ± 10 PgC/yr . Fossil fuels & cement production were responsible for 7.8 PgC/y or 3.25%. (Peta gram = E15 g = Giga Tonne E9 Tonne. E3 g = kg E3 kg = Tonne)
Anthropogenic sources of CO2 are currently adding about 2 ppm/y to the atmosphere’s current 400 ppm.
IPCC AR5’s worst, worst, worst case model RCP 8.5, 985 ppm, 8.5 W/m2.
At the current rate it will take about 300 years to reach that concentration.
RCP 8.5 predicts 1.5 to 6.6 meters of sea level rise – in the year 2500.
Coincidence? I think not!
“At the current rate (2 ppm/y) it will take about 300 years to reach that concentration (RCP 8.5)”
Are you saying the IPCC uses ‘current rate’ of CO2 increase for its ‘worse case projection”? Doesn’t sound right. Have you checked that assumption?
More importantly, what is your point, please?
And how does your post relate to the point of my post re: Heat addition to the oceans or Climate Sensitivity of 1.5C to 4.5C?
IPCC bases its various computer model predictions on four cases:
Case………….…CO2 ………….……Radiative……Dry air, ΔF………..Increase in atmospheric
………………….Concentration……..Forcing………………………………water vapor content
RCP 2.6…………421 ppm CO2……..3.0 W/m2………0.02……………..……….0.2% (No change from today, not much happens)
RCP 4.5…………538 ppm CO2……..4.5 W/m2………0.03………………………0.3%
RCP 6.0…………670 ppm CO2……..6.0 W/m2………0.05………………………0.4%
RCP 8.5…………936 ppm CO2……..8.5 W/m2………0.07………………………0.6% (Hundreds of years before bad things happen)
A almost undetectable change in water vapor content will absorb the additional heat with no change in temperature.
Heat evaporates from the ocean a lot faster than “downwelling” radiation heat it up.
It’s obvious from the pause that climate sensitivity is not what IPCC says they don’t know. AR4 was 4 C, AR 5 was 1.5 C, AR 6 will be “Never mind!”
IPCC AR5 TS.6 (They haven’t got a clue!!!)
Paleoclimate reconstructions and Earth System Models indicate
that there is a positive feedback between climate and the carbon
cycle, but
“!!!!confidence remains low in the strength of this feedback,!!!”
particularly for the land. {6.4}
The simulation of clouds in AOGCMs has shown modest improvement
since AR4; however, it remains challenging. (Well, duh!) {7.2, 9.2.1, 9.4.1,
9.7.2}
• Observational uncertainties for climate variables other than temperature,
uncertainties in forcings such as aerosols, and limits in
process understanding continue to hamper attribution of changes
in many aspects of the climate system. {10.1, 10.3, 10.7}
• Changes in the water cycle remain less reliably modelled in both
their changes and their internal variability, limiting confidence in
attribution assessments. (Duh!) Observational uncertainties and the large
effect of internal variability on observed precipitation also precludes
a more confident assessment of the causes of precipitation
changes. (& more Duh!) {2.5.1, 2.5.4, 10.3.2}
You’ve simply posted IPCC statements about uncertainties in the Science that are well known to the Climate researchers whose work the IPCC is summarizing. And you note that the IPCC updated the lower bound of Climate Sensitivity from 2.0 to 1C, as learned from recent research.
Once again, what is your point?
Typo Correction: Updated Climate Sensitivity from 2.0C to 1.5C. (not 1C)