Guest Essay by Kip Hansen
 “…we should recognise that we are dealing with a coupled nonlinear chaotic system, and therefore that the long-term prediction of future climate states is not possible.”
– IPCC AR4 WG1
Introduction:
The IPCC has long recognized that the climate system is 1) nonlinear and therefore, 2) chaotic. Unfortunately, few of those dealing in climate science – professional and citizen scientists alike – seem to grasp what this really means. I intend to write a short series of essays to clarify the situation regarding the relationship between Climate and Chaos. This will not be a highly technical discussion, but an even-handed basic introduction to the subject to shed some light on just what the IPCC means when it says “we are dealing with a coupled nonlinear chaotic system” and how that should change our understanding of the climate and climate science.
My only qualification for this task is that as a long-term science enthusiast, I have followed the development of Chaos Theory since the late 1960s and during the early 1980s often waited for hours, late into the night, as my Commodore 64 laboriously printed out images of strange attractors on the screen or my old Star 9-pin printer.
PART 1: Linearity
In order to discuss nonlinearity, it is best to start with linearity. We are talking about systems, so let’s look at a definition and a few examples.
Edward Lorenz, the father of Chaos Theory and a meteorologist, in his book “The Essence of Chaos” gives this:
Linear system: A system in which alterations of an initial state will result in proportional alterations in any subsequent state.
In mathematics there are lots of linear systems. The multiplication tables are a good example: x times 2 = y. 2 times 2 = 4. If we double the “x”, we get 4 times 2 = 8. 8 is the double of 4, an exactly proportional result.

When graphing a linear system as we have above, we are marking the whole infinity of results across the entire graphed range. Pick any point on the x-axis, it need not be a whole number, draw a vertically until it intersects the graphed line, the y-axis value at that exact point is the solution to the formula for the x-axis value. We know, and can see, that 2 * 2 = 4 by this method. If we want to know the answer for 2 * 10, we only need to draw a vertical line up from 10 on the x-axis and see that it intersects the line at y-axis value 20. 2 * 20? Up from 20 we see the intersection at 40, voila!
[Aside: It is this feature of linearity that is taught in the modern schools. School children are made to repeat this process of making a graph of a linear formula many times, over and over, and using it to find other values. This is a feature of linear systems, but becomes a bug in our thinking when we attempt to apply it to real world situations, primarily by encouraging this false idea: that linear trend lines predict future values. When we see a straight line, a “trend” line, drawn on a graph, our minds, remembering our school-days drilling with linear graphs, want to extend those lines beyond the data points and believe that they will tell us future, uncalculated, values. This idea is not true in general application, as you shall learn. ]
Not all linear systems are proportional in that way: the ratio between the radius of a circle and its circumference is linear. C =2πR, as we increase the radius, R, we get a proportional increase in Circumference, in a different ratio, due to the presence of the constants in the equation: 2 and π.

In the kitchen, one can have a recipe intended to serve four, and safely double it to create a recipe for 8. Recipes are [mostly] linear. [My wife, who has been a professional cook for a family of 6 and directed an institutional kitchen serving 4 meals a day to 350 people, tells me that a recipe for 4 multiplied by 100 simply creates a mess, not a meal. So recipes are not perfectly linear.]
An automobile accelerator pedal is linear (in theory) – the more you push down, the faster the car goes. It has limits and the proportions change as you change gears.
Because linear equations and relationships are proportional, they make a line when graphed.

A linear spring is one with a linear relationship between force and displacement, meaning the force and displacement are directly proportional to each other. A graph showing force vs. displacement for a linear spring will always be a straight line, with a constant slope.
In electronics, one can change voltage using a potentiometer – turning the knob – in a circuit like this:

In this example, we change the resistance by turning the knob of the potentiometer (an adjustable resistor). As we turn the knob, the voltage increases or decreases in a direct and predictable proportion, following Ohm’s Law, V = IR, where V is the voltage, R the resistance, and I the current flow.
Geometry is full of lovely linear equations – simple relationships that are proportional. Knowing enough side-lengths and angles, one can calculate the lengths of the remaining sides and angles. Because the formulas are linear, if we know the radius of a circle or a sphere, we can find the diameter (by definition), the area or surface area and the circumference.

Aren’t these linear graphs boring? They all have these nice straight lines on them
Richard Gaughan, the author of Accidental Genius: The World’s Greatest By-Chance Discoveries, quips: “One of the paradoxes is that just about every linear system is also a nonlinear system. Thinking you can make one giant cake by quadrupling a recipe will probably not work. …. So most linear systems have a ‘linear regime’ –- a region over which the linear rules apply–- and a ‘nonlinear regime’ –- where they don’t. As long as you’re in the linear regime, the linear equations hold true”.
Linear behavior, in real dynamic systems, is almost always only valid over a small operational range and some models, some dynamic systems, cannot be linearized at all.
How’s that? Well, many of the formulas we use for the processes, dynamical systems, that make civilization possible are ‘almost’ linear, or more accurately, we use the linear versions of them, because the nonlinear version are not easily solvable. For example, Ian Stewart, author of Does God Play Dice?, states:
“…linear equations are usually much easier to solve than nonlinear ones. Find one or two solutions, and you’ve got lots more for free. The equation for the simple harmonic oscillator is linear; the true equation for a pendulum is not. The classic procedure is to linearize the nonlinear by throwing away all the awkward terms in the equation.
….
In classical times, lacking techniques to face up to nonlinearities, the process of linearization was carried out to such extremes that it often occurred while the equations were being set up. Heat flow is a good example: the classical heat equation is linear, even before you try to solve it. But real heat flow isn’t, and according to one expert, Clifford Truesdell, whatever good the classical heat equation has done for mathematics, it did nothing but harm to the physics of heat.”
One homework help site explains this way: “The main idea is to approximate the nonlinear system by using a linear one, hoping that the results of the one will be the same as the other one. This is called linearization of nonlinear systems.” In reality, this is a false hope.
The really important thing to remember is that these linearized formulas of dynamical systems –that are in reality nonlinear – are analogies and, like all analogies, in which one might say “Life is like a game of baseball”, they are not perfect, they are approximations, useful in some cases, maybe helpful for teaching and back-of-an-envelope calculations – but – if your parameters wander out of the system’s ‘linear regime’ your results will not just be a little off, they risk being entirely wrong — entirely wrong because the nature and behavior of nonlinear systems is strikingly different than that of linear systems.
This point bears repeating: The linearized versions of the formulas for dynamic systems used in everyday science, climate science included, are simplified versions of the true phenomena they are meant to describe – simplified to remove the nonlinearities. In the real world, these phenomena, these dynamic systems, behave nonlinearly. Why then do we use these formulas if they do not accurately reflect the real world? Simply because the formulas that do accurately describe the real world are nonlinear and far too difficult to solve – and even when solvable, produce results that are, under many common circumstances, in a word, unpredictable.
Stewart goes on to say:
“Really the whole language in which the discussion is conducted is topsy-turvy. To call a general differential equation ‘nonlinear’ is rather like calling zoology ‘nonpachydermology’.”
Or, as James Gleick reports in CHAOS, Making of a New Science:
“The mathematician Stanislaw Ulam remarked that to call the study of chaos “nonlinear science” was like calling zoology “the study of non-elephant animals.”
Amongst the dynamical systems of nature, nonlinearity is the general rule, and linearity is the rare exception.
Nonlinear system: A system in which alterations of an initial state need not produce proportional alterations in any subsequent states, one that is not linear.
When using linear systems, we expect that the result will be proportional to the input. We turn up the gas on the stove (altering the initial state) and we expect the water to boil faster (increased heating in proportion to the increased heat). Wouldn’t we be surprised though, if one day we turned up the gas and instead of heating, the water froze solid! That’s nonlinearity! (Fortunately, my wife, the once-professional cook, could count on her stoves behaving linearly, and so can you.)
What kinds of real world dynamical systems are nonlinear? Nearly all of them!
Social systems, like economics and the stock market are highly nonlinear, often reacting non-intuitively, non-proportionally, to changes in input – such as news or economic indicators.
Population dynamics; the predator-prey model; voltage and power in a resistor: P = V²2R; the radiant energy emission of a hot object depending on its temperature: R = kT4; the intensity of light transmitted through a thickness of a translucent material; common electronic distortion (think electric guitar solos); amplitude modulation (think AM radios); this list is endless. Even the heating of water, as far as the water is concerned, on a stove has a linear regime and a nonlinear regime, which begins when the water boils instead of heating further. [The temperature at which the system goes nonlinear allowed Sir Richard Burton to determine altitude with a thermometer when searching for the source of the Nile River.] Name a dynamic system and the possibility of it being truly linear is vanishing small. Nonlinearity is the rule.
What does the graph of a nonlinear system look like? Like this:

Here, a simple little formula for Population Dynamics, where the resources limit the population to a certain carrying capacity such as the number of squirrels on an idealized May Island (named for Robert May, who originated this work): xnext = rx(1-x). Some will recognize this equation as the “logistic equation”. Here we have set the carrying capacity of the island as 1 (100%) and express the population – x – in a decimal percentage of that carrying capacity. Each new year we start with the ending population of the previous year as the input for the next. r is the growth rate. So the growth rate times the population times the bit (1-x), which is the amount of the carrying capacity unused. The graph shows the results over 30 years using several different growth rates.
We can see many real life population patterns here:
1) With the relatively low growth rate of 2.7 (blue) the population rises sharply to about 0.6 of the carrying capacity of the island and after a few years, settles down to a steady state at that level.
2) Increasing the growth rate to 3 (orange) creates a situation similar to the above, except the population settles into a saw-tooth pattern which is cyclical with a period of two.
3) At 3.5 (red) we see a more pronounced saw-tooth, with a period of 4.
4) However, at growth rate 4 (green), all bets are off and chaos ensues. The slams up and down finally hitting a [near] extinction in the year 14 – if the vanishing small population survived that at all, it would rapidly increase and start all over again.
5) I have thrown in the purple line which graphs a linear formula of simply adding a little each year to the previous year’s population – xnext = x(1+(0.0005*year)) — slow steady growth of a population maturing in its environment – to contrast the difference between a formula which represents the realities of populations dynamics and a simplified linear versions of them. (Not all linear formulas produce straight lines – some, like this one, are curved, and more difficult to solve.) None of the nonlinear results look anything like the linear one.
Anyone who deals with populations in the wild will be familiar with Robert May’s work on this, it is the classic formula, along with the predator/prey formula, of population dynamics. Dr. May eventually became Princeton University’s Dean for Research. In the next essay, we will get back to looking at this same equation in a different way.
In this example, we changed the growth element of the equation gradually upwards, from 2.7 to 4 and found chaos resulting. Let’s look at one more aspect before we move on.

This image shows the results of xnext = 4x(1-x), the green line in the original, extended out to 200 years. Suppose you were an ecologist who had come to May Island to investigate the squirrel population, and spent a decade there in the period circled in red, say year 65 to 75. You’d measure and record a fairly steady population of around 0.75 of the carrying capacity of the island, with one boom year and one bust year, but otherwise fairly stable. The paper you published based on your data would fly through peer review and be a triumph of ecological science. It would also be entirely wrong. Within ten years the squirrel population would begin to wildly boom-and-bust and possibly go functionally extinct in the 81st or 82nd year. Any “cause” assigned would be a priori wrong. The true cause is the existence of chaos in the real dynamic system of populations under high growth rates.
You may think this a trick of mathematics but I assure you it is not. Ask salmon fishermen in the American Northwest and the sardine fishermen of Steinbeck’s Cannery Row. Natural populations can be steady, they can ebb and flow, and they can be truly chaotic, with wild swings, booms and busts. The chaos is built-in and no external forces are needed. In our May Island example, chaos begins to set in when the squirrels become successful, their growth factor increases above a value of three and their population begins to fluctuate, up and down. When they become too successful, too many surviving squirrel pups each year, a growth factor of 4, disaster follows on the heels of success. For real world scientific confirmation, see this paper: Nonlinear Population Dynamics: Models, Experiments and Data by Cushing et. al. (1998)
Let’s see one more example of nonlinearity. In this one, instead of doing something as obvious as changing a multiplier, we’ll simply change the starting point of a very simple little equation:

At the left of the graph, the orange line overwrites the blue, as they are close to identical. The only thing changed between the blue and orange is that the last digit of the initial value 0.543215 has been rounded up to 2, 0.54322, a change of 1/10000th, or rounded down to 0.54321, depending on the rounding rule, much as your computer, if set to use only 5 decimal places, would do, automatically, without your knowledge. In dynamical sciences, a lot of numbers are rounded up or down. All computers have a limited number of digits that they will carry in any calculation, and have their own built in rounding rules. In our example, the values begin to diverge at day 14, if these are daily results, and by day 19, even the sign of the result is different. Over the period of a month and a half, whole weeks of results are entirely different in numeric values, sign and behavior.
This is the phenomena that Edward Lorenz found in the 1960’s when he programmed the first computational models of the weather, and it shocked him to the core.
This is what I will discuss in the next essay in this series: the attributes and peculiarities of nonlinear systems.
Take Home Messages:
1. Linear systems are tame and predictable – changes in input produce proportional changes in results.
2. Nonlinear systems are not tame – changes in input do not necessarily produce proportional changes in results.
3. Nearly all real world dynamical systems are nonlinear, exceptions are vanishingly rare.
4. Linearized equations for systems that are, in fact, nonlinear, are only approximations and have limited usefulness. The results produced by these linearized equations may not even resemble the real world system results in many common circumstances.
5. Nonlinear systems can shift from orderly, predictable regimes to chaotic regimes under changing conditions.
6. In nonlinear systems, even infinitesimal changes in input can have unexpectedly large changes in the results – in numeric values, sign and behavior.
# # # # #
Author’s Comment Reply Policy:
This is a fascinating subject, with a lot of ground to cover. Let’s try to have comments about just the narrow part of the topic that is presented here in this one essay which tries to introduce readers to linearity and nonlinearity. (What this means to Climate and Climate Science will come in further essays in the series.)
I will try to answer your questions and make clarifications. If I have to repeat the same things too many times, I will post a reading list or give more precise references.
# # # # #
Great stuff, can’t wait for the rest, thanks!
What the IPCC, like many others, has long recognized is false. Linearity and chaos apply to models, not to the real world. Whether models are linear often depends merely on the scale factor applied. A system is linear if f(ax+by) = af(x)+bf(y). Equation do not exist in the real world to apply the definition. Models and equations are strictly manmade.
Chaos does not exist in the real world because the real world has no initial conditions to which it might be sensitive. Only models do. Climatologists and physicists alike often confuse the real world with their models.
+100
Ditto.
I like to paint. If I “paint a tree”, my model of the tree is not the tree.
http://www.maxphoton.com/let-light/
It is mind-blowing how many full-grown, professional adults can’t maintain that separation. In fact, the entire climate catastrophic fiasco hinges on this Tyranny of the Model.
Max Photon:
I was standing gazing at a distant mountain, thinking about how to paint a picture of all those trees with all the contrast and textures.
A friend asked me what I was thinking about.
I replied: ‘I was thinking about how to paint all those trees.’
I realized how ambiguous that statement was and added: ‘It would take a heck of a lot of paint to paint all those trees. There are thousands of them.’
Richard,
All you can do is create symbols (by placing pigment on fiber) that make the viewer’s mind say “tree.”
Max
Or put a coat of paint on each tree. Something about not seeing the painting for the trees.
Reply to Jeff Glassman ==> “Chaos does not exist in the real world” If only it were so. The natural dynamical systems of the world are almost all, exclusively, nonlinear and subject to chaos.
Turbulence in fluid flows of all kinds, including the atmosphere. Heat transfer through and between materials. Everyday population dynamics. Passage of radiant energy through a translucent medium (the atmosphere). All nonlinear dynamical systems, and subject to all the behaviors of nonlinearity.
Stay tuned to the whole series, and see if I can’t convince you of this.
Thanks for reading here.
..if this trend continues
It is so. And what makes it so is logic applied to our definitions of chaos. Many definitions exist, but one essential they all share is system sensitivity to its initial conditions. When Mitchell Feigenbaum (you quoted below; a reference would help) expressed chaos in terms of rapid growth, he was undoubtedly referring to rapid growth from its initial conditions (ICs). Devaney provide a definition that is popular, and several papers use that as a starting point for even more definitions. But I still have an opening in my collection of chaos definitions for one from a scientific field that does not have this IC property.
In Lorentz’s work, his systems were systems of equations. His domain was models of the real world.
One thing is certain. Nothing in the real world has initial conditions. Nor, for that matter, parameters, units, equations, coordinate systems, dimensions, sets, taxonomies, clocks, logic. These are all manmade constructs, expressed in human languages, from what impinges on our senses and instruments from the real world.
Jeff: one feature of nonlinear dynamics is that you can close your eyes and point to any point in time and say “these are my initial conditions.” So that means every chaotic system in the real world has initial conditions. Such systems are sensitively dependent on those initial conditions, so humans can never estimate them accurately enough to insert a model that can predict the future. However as Kip says, knowing that the systems are chaotic means that we understand better why the models don’t work.
Reply to Jeff Glassman ==> It has been some time since I heard someone claim that their own sense of logic trumped the Real World. There are so many real world examples of these chaotic behaviors in natural systems that I find your continuing assertions to the contrary difficult to understand.
Did you read the linked study Nonlinear Population Dynamics: Models, Experiments and Data by Cushing et. al. (1998)? It is a marvelous example of truly exemplary science on this topic.
I can only suggest reading any of the four books listed in the Introduction to Chaos Theory Reading List.
Reading any one of them should manage to bring you around…I hope!
“All nonlinear dynamical systems, and subject to all the behaviors of nonlinearity.”
That doesn’t make them chaotic. You beautifully demonstrate how some population equations behave chaotically, however, do actual populations exhibit such characteristics. Sure they’re complicated and subject to random events (like hurricanes) but that’s not chaos. I’m not going so far as to say there are no real world systems that are chaotic but they seem to be really rare to me. Let’s take squirrel populations for example, to be chaotic in the real world equivalent to the minute changes that significantly alter virtual populations a population of a hundred squirrels would have to be noticeably altered by an oak tree producing 2% less acorns (or the removal of 1 inch of one squirrels tail) a few years after the change. These kind of incredibly small changes don’t seem to be significant in the real world, in other words, the real world population of squirrels is not nearly as sensitive to initial conditions as would be required to consider it chaotic. Oh, and butterflies don’t really set off hurricanes except in virtual worlds. Admittedly, engineers are notorious for only looking at 3 significant digits (often 2, sometimes 1), but really I haven’t ran across many instances in which I really needed more than 2 in 25 years of real world electro-chemical processing which tells me they’re not chaotic even though they are “dynamical” and nonlinear (and sometimes really really complicated in what is certainly a variable rich environment subject to all sorts of random events).
Reply to John West ==> I will try one more time.
Please read any one of the books in the reading list for general understanding, or even just the Wikipedia article on Chaos Theory.
Read the paper I linked on Nonlinear Population Dynamics: Models, Experiments and Data by Cushing et. al. (1998). It is a marvelous example of truly exemplary science on this topic. This paper finds the very odd behaviors of nonlinear population dynamics in actual living populations in tightly controlled lab experiments — not just fooling around with numbers on a computer. Seeing, should be, believing.
As a chemist, try reading this paper Nonlinear Chemical Dynamics: Oscillations, Patterns, and Chaos . The BZ reaction and subsequent discoveries. It is all in there…right in your field.
Good luck.
It is not necessary to get any more complicated than the example a “real world” pendulum (with bearing friction) to demonstrate chaos in most all physical systems. Once released, the best you can do is calculate an envelope outside which the swinging bob CANNOT BE at any given moment in time thereafter, leaving a band of possible “where it is at any given point” in time values.
The bigger and more complex the physical system, the more difficult it becomes to calculate the envelope of possibilities. The 500,000 year record of reconstructed global temperature does a pretty good job of painting such a chaotic envelope for our grandaddy of all earthly non-linear systems. Within that envelope, the system pretty much has life of its own in which specific responses to specific forcing functions are impossible to calculate. Neither episodes of horrific volcanic activity nor cataclysmic meteor strikes has taken global climate outside that cyclic envelope of temperature values.
Mr. Hansen, et.al., I think you and Mr. Glassman are making different arguments, his philosophical and yours physical. In the real world the initial conditions occurred so long ago there is really no way to mentally get from there to the present. Equations, chaos, thought, and all the processes linear or otherwise are all chaotic in the sense that they are unpredictable because it is impossible to describe them in any mathematics accurately enough to match reality. Even the idea of predicting the a solar eclipse hundreds of years from now rests on the idea that no large disturbance in the solar system, say a Jupiter sized planet from far out in the Oort cloud passing between the earth and Venus, will happen. We just don’t know. As Dr. Essex so adroitly shows in several of his presentations, we don’t even know how we could know.
The simplest definition of chaos is unpredictability. Simplest example I can think of is a machine with two buttons, labeled “press a button to start, press a button to stop”. When you press a button the innards do some pseudo random calculation and assigns start and stop to each of the buttons. Every time you press a button the process repeats. When you press a button the machine starts. Press a button and it may stop, or it may not. Every time you press a button it may stop, or not. When it does stop pressing a button may start or maybe not. After an initial button press there is virtually no way to reliably predict what will happen on the next button press, the response is essentially unpredictable and chaotic. It’s also neither linear or non-linear, it’s a simple binary response.
One question- In your graph(7) of xnext = 4x(1-x), after a million or so iterations, is it possible to derive the original equation from the output?
Jeff the natural world certainly had an initial condition if you believe it did not then I am to assume that you do not believe or accept the big bang theory. I personal don’t know if it is truly correct but I am will to admit that is true and if it is that was the initial state of all the chaos that has happen since! Of course it worthless for a climate modeler since all the computing power in the world now or what every will be develop will never be capable of modeling ten years of climate let alone the all the states and chaos since the big bang. Even if you could the model would still not work since the model is not capable of forecasting anything in a chaotic system since chaos cannot not be predicted. I would assume you are with me on the point the people who model climate to the most part are fools on a fools errand.
Jeff
What’s your point – that everything is a cloud of unknowing and only religion can make sense of it. That making an image of nature, let alone God, is forbidden idolatry?
Have you been tasked with evading the implications of ubiquitous chaos and nonlinearity that are uncomfortable for CAGW?
Thanks for trying one more time.
Note in the paper “Nonlinear Chemical Dynamics: Oscillations, Patterns, and Chaos” the authors say “A small but growing number of chemical systems are now known to exhibit chaotic behavior”.
In other words, it’s rare.
They also note: “three fundamental classes of dynamical behavior (stationary, periodic, and chaotic)”.
Hmmm… Exactly how does one differentiate between an amalgamation of coupled complex periodic oscillating systems (with various damping) and a chaotic system? Sensitivity to initial conditions?
Furthermore right in their intro they say “Chemical reactions with nonlinear kinetic behavior can give rise to a remarkable set of spatiotemporal phenomena. These include periodic and chaotic changes …” [bold mine]
So nonlinear (even in the dynamical systems realm) can be something other than chaotic, i.e. periodic.
It seems to me these days we can be too quick to label something chaotic; chaos in the gaps of understanding (or possibly computational ability) if you will. The quintessential question being ‘is weather chaotic?’. Many say it is and while weather simulating models certainly behave chaotically I’m unconvinced that weather is chaotic. Call me a skeptic.
I’ll try to “let it go” for the next two parts and just leave this particular objection (of going from linear to chaotic too quickly) here.
Mr. Glassman’s point is shown in the squirrel population figure where the squirrel population values go to 0 at times. If this really happened just once, there would be no more squirrels on May Island.
I wondered about that too. But it appears one cannot assume that the change in squirrel population is based only on reproduction. Heck, if that were true a population of one squirrel is the same as zero and the population would never recover. So there must be a way for squirrels to arrive from afar, perhaps as stowaways on a visiting supply ship or with a boat of researchers. Of maybe they swim from a neighbouring island, assuming they can swim of course. I guess that’s another part of the chaos.
Reply to DHR and PaulH ==> Couple of points — in the population dynamics graph, it appears that the squirrel population has reached zero — in actuality, it is a very small number. In the real world, this could represent an local extinction event — or it could represent a common ecological case where a plant or animal becomes so locally rare that it appears to have vanished, only to be discovered again in the exact same place some number of years later.
Mr. Glassman seems to be railing against mathematical models in general and incorrectly believes that the chaos is a product of the math — which it is not. The chaotic behaviors are natural phenomena, only recently being discovered to also exist in the very mathematics of the systems described.
Maybe there’s half a squirrel. That’s a start,
100 %
Jeff Glassman
March 15, 2015 at 10:19 am
“Chaos does not exist in the real world because the real world has no initial conditions to which it might be sensitive. Only models do. Climatologists and physicists alike often confuse the real world with their models.”
Any momentary state can count as the initial state of what comes after it, so, you’re wrong. Chaos exists in the real world. It was OBSERVED by Lorenz before the entire branch of chaos mathematics and simulation came into being.
No. You are introducing the man-made element by assigning a point in time. Chaotic progression demonstrable from a point in time is still an arbitrary man-made condition. Chaos exists in the real world only within our context, not nature’s. If we are prepared to describe climate as “non-linear and chaotic”, we are basically saying, that for us, it is unknowable. We attempt to describe it and model it, but we can do so only imperfectly. And since our knowledge is imperfect, our models are even more so. Neither arrives at truth. Schrodinger!
Dirk, I agree. I’m not sure I even understand Jeff Glassman’s point. ALL of our idea’s are simply models of the reality “out there”. Those models may be understood as algorithms. We supply inputs to the algorithms, such as initial or boundary conditions. We turn the crank and produce some prediction for the output.
If the models are good ones and the initial/boundary conditions are chosen appropriately, then the predicted outcomes can be of great value in allowing us to anticipate and thus control, ACTUAL outcomes in the real world.
Consider a man throwing a baseball. If he is good at it (meaning his brain stores an excellent algorithm for the process of throwing the ball), then he can with a high degree of certainty deliver the ball to some precise location at a precise time given inputs such as a visual field (boundary conditions), and the state of play at a given moment (initial conditions). That is the value of the model that is in his head.
Furthermore, this is a highly non-linear system. A change amounting to only fractions of a degree in direction and azimuth can make the difference between a strike or a ball. A Home Run or an Out. Winning the World Series or losing the World Series.
I have chosen an active, participatory example. If that is not to one’s taste we could choose a more passive example. We can use the models (algorithms) of orbital mechanics to predict solar eclipses 100s of years ahead. Newton’s laws plus observations of the sun / earth / moon positions (boundary and initial conditions) permit prediction of a total eclipse on let us say the island of Tahiti beginning at 11:05am on May 5, 2034. That sort of pre-knowledge can also be very useful for controlling outcomes. (Mark Twain provides an interesting fictional instance of that in Connecticut Yankee in King Authur’s Court.)
In what sense is it useful to argue that initial / boundary conditions “don’t exist in the real world”? It makes just as much sense to fuss that MODEL’s “don’t exist” in the real world. True, and so what?
Paul Coppin: If you are trying to say “we don’t know what’s going to happen, but Nature does”, that’s wrong. There is chaos and uncertainty, down to the quantum level. Especially at the quantum level. “Nature” has no idea when an radioactive atom is going to decay. Or exactly where a leaf dropped in a rushing stream will be in 30 seconds, etc., etc.
The Universe is simply not predictable no matter how closely it is measured.
Dear Eustace Cranch,
To be sure you did not miss my apology to you here: http://wattsupwiththat.com/2015/03/12/claim-climate-communication-needs-to-be-less-optimistic-more-climate-disruption/#comment-1881285
here it is!
Take care,
Janice
DirkH,
Look more closely at what Lorenz did. He input what he thought was a previous state (and later discovered it was not) into his model and got something completely unexpected. THIS is what he observed. It was his model which was chaotic. He was in never in a position to claim his model was an accurate description of reality.
In fact, it would be difficult if not impossible to prove any physical system was chaotic unless you could define a model which accurately followed the physical system thus demonstrating it. The difficulty is that chaotic mathematical functions are subject to initial conditions which, in turn, implies that building such a demonstrator is very hard. Regardless, this is a statement about the modeler’s limited knowledge and not the physical system. You can never rule out the possibility that some modulating variable or groups of variables can be found which would simplify the model.
Think about it.
Eustace Cranch,
There is chaos and uncertainty, down to the quantum level. Especially at the quantum level.
There is indeed but only to the observer. The claim that, even if you knew all of the causes and their precise states and STILL get different answers, ultimately means that cause and effect is an illusion. The illusion may BE reality but It is a proposition that is not likely provable as you would be hard pressed to show you know all of the inputs.
Until such a proof comes along, it is better to assume that “random” (even when constrained, i.e., “chaotic”) is a description of modeler limitations and not reality.
Epistemological and not Ontological.
Yes Jeff, but really there is chaos. Chaos, not in the sense of the Physics definition, but in the sense of the state of mind of the proponents of the alarmist theories. They are quite literally in a, “state of extreme confusion and disorder”, that is to say their thinking and indeed subsequent actions, are chaotic.
From a Confucius scholars point of view this sort of malfunction in thinking is inevitable. …….
In the Western tradition, dominated by cosmogonic myth and speculation, in the beginning, at the origin, there is chaos. The transition from religious to philosophic and scientific speculation occurs in terms of the transition from mylhos to logos. In our tradition, because of the dominance of scientific thinking in the last four or five centuries, it is forgotten that, before there was a logos of mythos, there had to be a mythos of chaos; before scientific thinking could rationalize the myths, the myths had to organize chaos. In this view, reasoning is twice removed from the sources of individual and social experience in the primordial chaos at the time of the beginnings.
It is good to see a distinct and culturally different philosophical view expressed here.
Really? Why don’t you try it with physical systems from the real world to see if chaos does not exist in the real world? Do you best to prepare them ‘identically’ and watch them evolve over time.
A lot depends upon how close? What precision do you need. For a circle, pi = Circumference/diameter = C/d and therefore: C=Pi*d and conversely, d = C/pi. Since Pi is not a rational number and is transcendental. Try as you will you can never get an exact value for Pi. Therefore, if you know d exactly then C is always approximate and vice versa if C is known exactly then d is only approximate. In the practical world we can know C and d to our limits of measurements by starting with a good value of Pi with many digits. (Sometimes the constants have relatively large uncertainty in the real world due to measurement error).
Now if know d exactly and approximated C, then used C in n recursive calculations for a large n, number of times, then your final value of F(n,C) will be a function of n and C calculated with m digits of Pi. If your calculations are sensitive to round off error, then at some time for large n F(n,C) would be nonsense. And thus, they would be different depending upon on the initial value of Pi used in the calculations (i.e. the value of m, the number of digits used to estimate Pi).
Sometimes the models can be perfect C=Pi*d but because of our limits in specifying Pi, the calculations will always fail for large n. Now consider a global climate models with a very large number of constants that cannot be measured very well and run it over and over for a 1000 years where each value of the global mean temperature is dependent on the previous years values of global mean temperature and the previous years calculations of all “constants”, then we can see that their long- term predictions can go far astray.
The above discussions refer to cascading errors in the value of approximately known constants. Now introduce many parameters estimated with relatively large errors. Aye Yi Yi,! Now consider the uncertainty of the global climate models.
Wise guys in college used to say,” Constants aren’t and Variables won’t”.
Somebody says, “Really? Why don’t you try it with physical systems from the real world to see if chaos does not exist in the real world? Do you best to prepare them ‘identically’ and watch them evolve over time.”
=======================================================================
Such mathematics are not my area at all. However, philosophically I see the arguments against chaos as having some legs. In some recent debates with Brandon Gates, he kept informing me that all models are wrong. (It did not matter that I told him over and over of course they are, but in the engineering world you learn from your wrong models, the IPCC does not) The question is, why are all models wrong?
The answer is no models are infinitely precise, and all errors propagate. Beyond, and additive to that, not all fundamental forces are absolutely understood on every level including the quantum level.
Take the modeled pool table and classic pool break. The model says this and this will happen, and predicts where all the balls will end up. But it changes every time, despite all attempts to model it. The felt varies against what is known. One ball is slightly out of round. The humidity varies The cue is imperfect, or the cue ball is struck a hemi demi semi bit off. The error in the model vs. reality propagates, and it never gets it right.
Math is a symbol of something. Thus one apple plus one apple equals exactly two apples. As an idea this is perfectly true. But no two apples are exactly alike, therefore the “perfect” answer, is not in truth perfect.
Macroscopically, and microscopically, nothing is know perfectly or infinitely precisely, and errors propagate. Is chaos nothing more then the truth that all models have errors vs. the material reality? . . .
David, mathematical chaos is not necessarily a completely unordered state where not further entropy can occur, which is how the word is used philosophically. If you consider snow flakes, you look at a system that is fully determinant and yet which, except in the broadest of terms, you cannot predict, ever. There are many other natural systems that are governed by fully determinant yet cannot be forecast. All systems following fractals rules are in this case (moutains eroding, trees branching and distributions of leaves on trees).
David A,
Because that’s a ridiculous assertion stated so broadly.
My bottom line in this argument is that if you have little to no faith in models, you should be the first in line arguing for no change. Consistency goes a long way in a debate.
Now from my point of view, I not only want to know why CMIP5 models are wrong, I want them to be fixed. Realizing of course that they’ll never be perfect. Normally I’d then be asking how wrong they can be and still be useful. In this context, I see it as a moot question: they’re the best we’ve got, and I don’t see them getting much better any time soon as much as I wish that were so.
We have an infinitely better idea what CO2 at 280 ppmv looks like, because that era is in the rear-view mirror.
Do you get it yet? No? Very well, keep talking about chaos and unpredictability. Some day yet it may sink in.
Brandon Gates quotes me.
David A,
“In some recent debates with Brandon Gates, he kept informing me that all models are wrong. (It did not matter that I told him over and over of course they are, but in the engineering world you learn from your wrong models, the IPCC does not)
===========================================
Brandon states….”Because that’s a ridiculous assertion stated so broadly”
==========================
Full stop Brandon. My “broad assertion” comment was here. In the thread I gave you several graphics, explained how the IPCC chooses, and then utilized for future projections the “modeled mean” of knowingly wrong in ONE direction models. (They purposefully chose a KNON to be wrong answer to keep their scary stories alive. I also gave you links to detailed analysis of why this is political based post normal science, as opposed to real science.
You answered, with arm flapping detail, mute points about why all models are wrong, continually avoiding the FACT, that the IPCC does CHOOSE to use the mean of the error in one direction wrong models.
If they were building aviation instruments required for doing instrument landings, every one of their planes would crash into the runway because they thought they were higher then they were. (Were yet, they would face murder charges because they KNEW their modeled mean was telling them the planes were higher then they actually were, ad they sold them anyway. Arguing the broad term general about all models have errors”
You did in that post, exactly what you accused me of in this post….”arguing the broad term general about all models have errors” while ignoring the real story, no matter how clearly or how often it was pointed out to you. The rest of you comment follows this pattern.
David A,
You are ascribing motive, which is opinion. The factual statement is demonstrably false; the CMIP5 ensemble results as published in AR5 do not err in ONE direction:
http://1.bp.blogspot.com/-ZY_oL2cq4r4/VQiX3rRH2aI/AAAAAAAAAYo/0VNOKoRIQJw/s1600/CMIP5%2Bvs%2BHADCRUT4%2Btrend%2B1860-2014%2B01.png
Rate of change for all series computed with a least squares linear regression over the interval 1860 through 2014. This plot shows the result of subtracting the HADCRUT4 trend from each individual model trend. As you can see, roughly half of the models in the ensemble understate the observed trend over the entire interval. On balance, the CMIP5 ensemble is hot by 0.07 °C/century, but NOT as you ignorantly claim, because all models the IPCC have chosen are wrong in ONE direction.
All data from KNMI Climate Explorer.
The balance of your post ignores my central point: We have an infinitely better idea what CO2 at 280 ppmv looks like, because that era is in the rear-view mirror.
If you have any ability to be logically consistent, you will realize the import of my point.
Chaos for sure exists in any model of the real world though, and it doesn’t matter what you say, in the end all we have is models of the real world.
That is ultimately the only sane conclusion anyone who studies metaphysics can arrive at. There almost certainly is a real world out there, but we never deal with it directly. We only deal with models of it in our own heads and perceptions.
The game is not to throw models away and deal with reality directly – we can’t – or at least according to the mystics, all you end up with is bliss and no sense of identity 😉 – so we have to be in the business of better models, and in those better models chaos is for sure the best tool we have to describe what happens.
For sure models ain’t reality. That is the first step. The second step is to realise that reality is unattainable and we are stuck with models of it.
Chaos absolutely exists in the real world, Read James Gleick’s book “Chaos: Making A New Science”, if you understand that, and it’s amazingly understandable, you’ll know more about chaos that I’ve seen Climatologists demonstrate.
Paul, so you disagree with this statement…
ferdberple
March 15, 2015 at 12:48 pm
Predictable systems can be thought of as having a single attractor. A planet orbiting a star is predictable. However, when you add a third body the system becomes chaotic, except in the case where all 3 bodies lie in the same plane.
Chaotic doesn’t mean unpredictable, but it does mean unpredictable for all practical purposes. Given infinite precision and infinite time, you can predict a chaotic system.
Reply
======================
Kip Hansen
March 15, 2015 at 1:33 pm
Reply to ferdberple ==> Yes and Yes — think of a child learning to ride a bike — pedaling fast enough to get the bike up to speed, while steering close enough to straight, will get the bike on that stable “Look at me Mom, I’d riding a bike!” point
Nicely formulated Jeff. The map is not the territory. The distinction used to be called a priori/ a posteriori.
I highly recommend the work of Gregory Chaitin. He has continued the work of Goedel and Turing on the efficacy of modeling and meta-modeling. In essence it can be proved that no model can model reality, because the model would have to be more complex and bigger than said reality in order to model it.
Skip, reality may be complex or chaotic in a vulgar usage, but in a technical usage we are just describing reality as complex or chaotic. These theories while useful now will most likely themselves pass in time for more useful theories, at which time Reality will no longer be chaotic 😉
I think my post here, “http://wattsupwiththat.com/2015/03/15/chaos-climate-part-1-linearity/#comment-1884218 is articulating what Fred said below, “Chaotic doesn’t mean unpredictable, but it does mean unpredictable for all practical purposes. Given infinite precision and infinite time, you can predict a chaotic system.”
In this sense a chaotic system does not refer to the physics involved but to our capacity to predict and analyze them. Of course I understand some factor increase in a linear manner, and many are exponential, and in nature, many systems interact. I think however it may be fair to say, nature is not chaotic, but are capacity to predict it is.
Philosophy
The Hindu word for creation is maya, which literally translates as to divide that which is indivisible. In affect from the singularity of infinite energy beyond space and time solutions, comes all relative cause and affect. observations. To focus on one, is to by nature miss the interaction of all. Thus science can know nothing perfectly, as infinite precision and omniscience would be required.. To measure is to see only a part of the whole picture.
Below from a book published in the 1940s.
“The ancient Vedic scriptures declare that the physical world operates under one fundamental law of maya, the principle of relativity and duality. God, the Sole Life, is an Absolute Unity; He cannot appear as the separate and diverse manifestations of a creation except under a false or unreal veil. That cosmic illusion is maya. Every great scientific discovery of modern times has served as a confirmation of this simple pronouncement of the rishis.
Newton’s Law of Motion is a law of maya: “To every action there is always an equal and contrary reaction; the mutual actions of any two bodies are always equal and oppositely directed.” Action and reaction are thus exactly equal. “To have a single force is impossible. There must be, and always is, a pair of forces equal and opposite.”
Fundamental natural activities all betray their mayic origin. Electricity, for example, is a phenomenon of repulsion and attraction; its electrons and protons are electrical opposites. Another example: the atom or final particle of matter is, like the earth itself, a magnet with positive and negative poles. The entire phenomenal world is under the inexorable sway of polarity; no law of physics, chemistry, or any other science is ever found free from inherent opposite or contrasted principles.
Physical science, then, cannot formulate laws outside of maya, the very texture and structure of creation. Nature herself is maya; natural science must perforce deal with her ineluctable quiddity. In her own domain, she is eternal and inexhaustible; future scientists can do no more than probe one aspect after another of her varied infinitude. Science thus remains in a perpetual flux, unable to reach finality; fit indeed to formulate the laws of an already existing and functioning cosmos, but powerless to detect the Law Framer and Sole Operator. The majestic manifestations of gravitation and electricity have become known, but what gravitation and electricity are, no mortal knoweth.”
=========================================
http://www.ananda.org/autobiography/#chap30
.
“Chaos does not exist in the real world because the real world has no initial conditions to which it might be sensitive.”
There is hysteresis, especially in oceanic modes, providing greatly ranging initial conditions. That has though little to do with whether what came before and what follows is actually chaotic or not.
At some point introduce the distinction between nonlinear, and nonlinear dynamic (lagged feedback) systems. A pendulum is the former. Old clocks show pendulums are still well behaved. Squirrels and climate are both the latter. And are not.
Reply to Rud ==> Yes, gently kicked pendulums are wonderfully predictable and constant. However, kick them too hard, or break the pendulum into two sections and they devolve into chaotic behaviors.
I knew about the double pendulum behaviour.
pendulum math gets really messy once you get to the point where sin(x)~=x breaks down.
This needs to be taught in schools, together with physics and calculus. And it should be required that anyone who aspires to have an influence on public policy pass a test at this level of mathematics.
All scientists who study the causes of climate and weather pattern variations need most of their master’s coursework at this level of mathematics.
“This level of mathematics” is stripping the basics down to the bone! I would certainly pray that climate “scientists” know a hell of a lot more mathematics than this!!!
(You’re making me nervous.)
Don’t forget economics.
Very interesting, I look forward to the next part.
@Jeff Glassman: I would offer up one of the hardest physical phenomenon that there is to model, to disprove your assertion – turbulence in fluids. It is inherently chaotic and it dominates so many important aspects of our lives, from the weather to corrosion of pipes to the way our bodies work.
Re: pipe turbulence — good point rxc
–That we have not (and likely cannot) solve the equation describing it,
Dr. Christopher Essex gives as one example of why climate is NOT simulatable:
(from my 2/24/15 comment here: http://wattsupwiththat.com/2015/02/23/inconvenient-study-la-nina-killed-coral-reefs-4100-years-ago-and-lasted-over-two-millenia/#comment-1867617)
“{Essex video here on youtube: https://www.youtube.com/watch?v=19q1i-wAUpY}
{25:17} — Solving the closure problem. {i.e., the “basic physics” equations have not even been SOLVED yet, e.g., the flow of fluids equation “Navier-Stokes Equations” — we still can’t even figure out what the flow of water in a PIPE would be if there were any turbulence.}”
Janice
If this were so then chemical and petrochemical plants requiring thousands of pressure drop flow calculations (and ultimately power consumption calculations ) involving turbulent fluid flow and transfer through pipes could not be designed. If turbulent flow through pipes cannot be figured out then how do these plants get designed, built and operated.
Robert Stevenson
The industries absolutely do “use” turbulent flow approximations all the time. Just like they “use” linear approximations of beam stress-strain and linear approximations of resistance curves. No one at any time can “predict” the exact start of turbulent flow, nor what happens inside the pipe during turbulent flow – All that the designers can do is deliberately select a pump power and valve diameter and pipe diameter sufficient to guarantee that turbulent flow must occur (at some point in the pump discharge path) and that fluid speed and pipe roughness and fluid temperature and pressure are sufficient for that turbulent flow to STAY turbulent all the way through the pipe from end-to-end.
But – to answer the question about “What is the fluid “doing” at any point inside the pipe?” … That we cannot answer.
I agree that turbulent flow in pipes is chaotic but it has been adequately modeled; for turbulent flow in smooth tubes the Blasius equation gives the friction factor accurately for a wide range of Re nos.
f= 0.079/Re^0.25 4000 < Re <10^5
Pipe flow models developed using dimensional analysis give excellent predictions in the turbulent region for velocity and pressure drop. Why in your view cannot models be developed for turbulent flow in the atmosphere to be used to predict the effects of man made global warming and future climate changes?
To invalidate (not disprove; this is about science, not symbolic logic) what I said, you would need to provide a (necessarily new) definition for either linearity or chaos, and then show how turbulent fluid flow is either nonlinear or chaotic according to either definition and without resorting to a model for turbulent flow.
The existence of hard and unsolved problems shows only the limitations of our abilities to model, including poor choices for observations, parameters, or scale factors.
Dear Mr. Glassman,
It would be helpful, I think, so that other commenters could even possibly invalidate or respond precisely to your statements at 10:19am and 11:02am today, if you would define your terms and write more clearly. It appears that you and everyone else (John West, too, perhaps…) are writing past each other here… . And you know what happens when computations start to diverge from reality….. !!!!! 🙂
That is: people are responding to what they THOUGHT you meant,
however,
from your reply, it appears that
what you meant is not what they thought.
#(:))
Janice
Janice, 3/15/15 @ 11:19:
What I believe to be the essentials of the definitions were contained in my opening paragraph. For linearity/nonlinearity, the essence is the equation I gave. For chaos, the key criterion is a heightened sensitivity to initial conditions. If scientific definitions exist without these properties, I hope the posters here will illuminate the dialog.
You might, though, enjoy these related, circular definitions from IPCC, intended for laymen (e.g., Policymakers):
>>Chaos A dynamical system such as the climate system, governed by nonlinear deterministic equations (see Nonlinearity), may exhibit erratic or chaotic behaviour in the sense that very small changes in the initial state of the system in time lead to large and apparently unpredictable changes in its temporal evolution. Such chaotic behaviour may limit the predictability of nonlinear dynamical systems. AR4, Glossary, p. 942.
>>Predictability The extent to which future states of a system may be predicted based on knowledge of current and past states of the system.
>>Since knowledge of the climate system’s past and current states is generally imperfect, as are the models that utilise this knowledge to produce a climate prediction, and since the climate system is inherently nonlinear and chaotic, predictability of the climate system is inherently limited. Even with arbitrarily accurate models and observations, there may still be limits to the predictability of such a nonlinear system (AMS, 2000)
By the way, IPCC’s definition of climate system is a good-enough real world system, but its definition of nonlinearity is a property of simple models sans mathematics.
So in IPCC speak, a real world system is chaotic and unpredictable if the models of it do not produce predictable results. This implies a certain arrogance that climate models are perfect. But more importantly, IPCC blames the failure of its models to predict climate on the climate, not the models.
I think Mr. Glassman is quite clear. He understands the difference between the model and that which is being modeled.
Others should be so clear.
If you by “chaotic” mean “random but constrained” or even plain old “unpredictable” then you are making a statement about your knowledge of the world as expressed in your model. Assuming your model is the world is reification where the models become the reality. In no way does the difficulty in modeling turbulence disprove what Jeff Glassman has said.
.
Glassman: “Chaos does not exist in the real world … .”
rxc: “…– turbulence in fluids. It is inherently chaotic … .”
— This is the crux of the difference that Mr. Glassman needs to clarify. As it is, he has left great ambiguity. What does he mean precisely? Until he clarifies his meaning, we might as well just ignore what he writes. Those who applaud and those who attempt to refute him are equally likely to be mistaken.
You as well, Janice. What could “chaotic” mean and what does it mean to you. So far the best definition would be “random but constrained” but “random” really means “unknown or incalculable”. It can only mean something regarding the extent of one’s knowledge and never about the real world which I think obviously doesn’t suffer from this unknowability.
Glassman: “Chaos does not exist in the real world … .”
Why would anyone think otherwise?
Reply to DAV, Glassman, and janice ==> Perhaps this is my fault, as author, in assuming that my use of the word “chaotic” would be understood in the sense intended when we speak of nonlinearity and ‘chaos theory’.
Amongst the many scholarly definitions of CHAOS is this from Mitchell Feigenbaum:
Edward Lorenz offers this:
Fort readers who think that “chaotic” means the same thing as “entirely random” — see the Wiki article for a brief introduction.
Much of this I hope to make clear in the second and third part of this series.
Dear Mr. Hansen,
Thank you for that very nice definition of terms. That you can explain your position so clearly to a layperson like I shows that you are a master of your subject. It is clear from your writing in your post and your above comment that Glassman and DAV are either: 1. honestly mistaken; or 2. using ambiguity and imprecision deliberately (for what purpose, I will not guess).
Thank you for the great education. Starting a building with the foundation — only way to go!
Janice
Kip, thanks. I hope the future articles make it clear that “chaos” is only an expression of out ability to predict and not something actually present in physical systems. The models are not the reality.
.
Janice,
The fluid is not chaotic. It knows exactly what it is doing at all time.
It only appears chaotic to the observer.
Chaos is in the eye of the modeler, not in what is being modeled.
“It only appears chaotic to the observer.
Science is about observation.
That’s why “chaotic” is the term used to describe that situation.
It is a useful concept. Mr. Glassman is using “chaos” in some obscure, largely unhelpful, way.
Max Photon,
It only appears chaotic to the observer.
An apt description but some people will fail to see that happens only when the observer becomes a modeler and sees chaotic behavior in the model predictions. There is a tendency to see one’s model as being the reality. Climate modelers and the IPCC seem to have fallen into this trap (called reification) as demonstrated, e.g., by their hunt for “missing” heat. “Missing” because it was predicted by the models so it should be present.
As long as the difference between models and reality is maintained or at least commonly understood there isn’t really anything wrong with shortcut descriptions. However, it is quite evident some here can’t see the distinction. From some of Kip Hansen’s comments it seems he may be one of them.
Janice and Mr. Glassman, do my layman thoughts expressed in this post here, “http://wattsupwiththat.com/2015/03/15/chaos-climate-part-1-linearity/#comment-1884218
articulate some of the same thoughts Mr. Glassman is expressing in a more detailed manner?
Missed the link to my comment…
http://wattsupwiththat.com/2015/03/15/chaos-climate-part-1-linearity/#comment-1884218
rxc; Many years ago we were on holiday and I wanted to see if water came out of the shower head in streams, like the single stream from a hosepipe. I turned the shower on and took two photographs through the shower towards the light. The first exposure at about 1/30th second showed streams of water, the second at a wider aperture and 1/1000th second showed droplets all in lines. I reasoned that the turbulence in the shower head prevented a linear egress of the water. I would also hazard a guess that the greater number of holes there are in the shower head, the less chance there would be of predicting how many droplets would come out of each hole.
I will add that I do enjoy swimming, good food, wine and sight-seeing when I go away!!
http://www.sciencealert.com/this-tap-saves-water-by-creating-incredible-patterns
That’s what quantum mechanics is about. You can’t predict the path an individual photon takes but there is an overall ‘order’. From one perspective it is chaotic but from another perspective it is ordered. It’s like Schrodinger’s cat-chaos exists and doesn’t exist at the same time
Alex, chaos and order only exist in the mind of the observer.
Everything is in the eye (or brain) of the modeler. Doesn’t mean there is nothing outside the modeler’s brain for him to model.
E.g., for those who say that evolution (for example) is “only” a theory — they beg the question, a theory of what? In order for there to be a theory at all, there must be something, some phenomenon/a, for the theory to be about. A theory with no real-world referent is like a map that isn’t a map OF anything.
Chaos was observed. Chaos is still observed. Go ahead, draw me a map that doesn’t represent -anything-, not even that weird house-like place you dreamed about the other night.
The model is not the thing modeled. And it can’t exist without the thing modeled.
Chaos was observed
Actually it was only observed in models. If anything it would mean that the models were far from complete.. To say that whatever the model is trying to predict is chaotic because the model predictions are is saying the model is accurate when quite obviously it is not.
Max, you appear to make a novice mistake. Chaos in the mathematical sense is not an absence of order. It is a level of complexity that defies long term precise predictions.
Excellent topic, a very good read. Thank you for taking the time to put this together.
“1) nonlinear and therefore, 2) chaotic” … “Nonlinear systems are not tame – changes in input do not necessarily produce proportional changes in results.”
There are plenty of nonlinear yet “tame” (in that they are completely predictable) systems. Nonlinear includes exponential and logarithmic neither of which are chaotic. This post is oversimplification past the point of absurdity.
I disagree. It is very simplified and could do with more caveats that people can follow up on if they are interested.
But this is an introduction.
It is the level that should be taught to 11 to 13 year olds in schools, but isn’t.
I think this article is useful.
Initial introduction to trigonometry and logarithms are typically taught in 9th-10th grade in US public schools, about 14-15 yr olds. That would be their first real exposure to nonlinear math functions.
“1) nonlinear and therefore, 2) chaotic”
I disagree with this, too. Non-linear and chaotic are quite different and should always be presented as such – even at an introductory level.
joelobryan, That seems a little later than I recall from my schooldays. I’m sure it was long before we started studying for our GCSEs.
Maybe it’s different between the US and England. It would be interesting to know what variation there is in the world’s mathematics teaching.
But I still think these ideas ought to be taught to children of around 11 to 13 years old.
Reply to the “Nonlinear/Chaotic” point ==> I am talking here quite specifically about nonlinear dynamical systems.
Nonlinear mathematical functions are math….not dynamical systems.
For those who are stubbornly holding to “what I learned in college mathematics” — please read any one, or all, of the following books:
Gleick is fun. Explains nonlinear dynamics in context of the people and their discovery process. Stewart is more straightforward technical. Both highly recommended.
There are of course many nonlinear dynamical systems that are not chaotic. It is usually very difficult to prove that a system is chaotic in the mathematical meaning. There are also many well behaved non linear systems that can be easily analyzed and simulated, a car, a robot, celestial motions, a bridge to name a few. There are not many linear systems analyzed in robotics but it is still possibly to get very good results.
The only valid point in your article seems to be that you need to be careful when handling non linear systems but everyone with any knowledge about the subject knows that.
Would you please say what you mean by dynamical systems? What would make a system non-dynamical or partialy dynamical, for instance?
God does not play dice, hirelings do. God owns the Casino!
Reply to Will ==> The Wiki gives:
“A dynamical system is a concept in mathematics where a fixed rule describes how a point in a geometrical space depends on time. Examples include the mathematical models that describe the swinging of a clock pendulum, the flow of water in a pipe, and the number of fish each springtime in a lake.
At any given time a dynamical system has a state given by a set of real numbers (a vector) that can be represented by a point in an appropriate state space (a geometrical manifold). Small changes in the state of the system create small changes in the numbers. The evolution rule of the dynamical system is a fixed rule that describes what future states follow from the current state. The rule is deterministic; in other words, for a given time interval only one future state follows from the current state.”
(Sorry that is so dense, but you did ask for it).
In plain English a dynamical system is a real world process, a series of events (any continuum is a series of discreet events, one after another) in which the next state of the system depends on the current state. In our population example — squirrels on May Island — the calculation for the number of squirrels next year starts with the ending value of this year. The thing we are measuring is moving through time.
And “In physics and other sciences, a nonlinear [dynamical] system, in contrast to a linear system, is a system which does not satisfy the superposition principle – meaning that the output of a nonlinear system is not directly proportional to the input. …. Nonlinear problems are of interest to engineers, physicists and mathematicians and many other scientists because most systems are inherently nonlinear in nature.”
Kip Hansen, 3/15/2015 @ 12:14 pm
Thinking that I might be able to help you, I found all four of your references available for preview on-line, including the indices and the ability to search the contents. I found some discussions about competing definitions of chaos, but these authors support you: none of you can define the term you pretend to discuss. How easy it is to write volumes about something undefined. Real science articles do not enjoy that luxury.
So too, zero change in inputs can have these results??
Reply to RobRoy ==> Very good question! The answer is “No”. Re-running calculations (re-doing an experiment) with exactly the same inputs gives exactly the same results, assuming you are using the same computer (more on this next time).
I like this definition of chaos.
Kip Hansen
March 15, 2015 at 11:50 am
“Chaos: When the present determines the future, but the approximate present does not approximately determine the future.”
It seems like global climate is the sum of all the regional weather events in a constant chain reaction. It’s never really any one thing at any one time.
Yes RobRoy -That effectively defines a non-linear system. it is the division by zero or where something tangible or measurable happens in zero time or zero space.
Yes, I’m in agreement with Jeff G and John West
We really do have to get our heads around something that is ‘straight-line’ linear Y=Ax+B for instance or something not straight line, such like x-squared, Log(x) or sin(x)
They are still linear functions.
A pendulum is linear no matter what size swing it takes but limiting calculations to small swings is sheer laziness (for lack of a better word) by people who do not want to be bothered to do the actaul calculations. The pendulum is always responding in a linear fashon to whatever forces are applied to it no matter what size swing.
Likewise water in a pipe or swirling in a bucket. Each individual molecule is always responding in a linear fashion to whatever forces are being applied to it at all times.
It is the fact that there are about 36 million million million million molecules in just one liter of water makes the calculation ‘a bit difficult’ Present-day digital technology is not up to the task but that does not make it non-linear system. Basically, its ’rounding error’
Likewise applying the tag ‘chaos’
Each molecule of water knows exactly where its going, where its been and what force is acting on it at all time and responding in a linear fashion – how can it do otherwise? If each molecule is linear, how can the body of water be non-linear?
If we really do want to solve the problem of what a liter of water does in a pipe, simply get a liter of water and a pipe and let the water solve it for you.
Until the digital computer can resolve the forces on each of the 3.6x10e25 water molecules in each litre, in (at a guess) sub-nanosecond timescales – their behaviour will appear chaotic or non-linear.
As skeptics we must not fall into the beguiling trap of thinking (digital) computers are some sort of all powerfull wonder machines -just as the warmists do. Their unquestioning gullibility and naivety is mindblowing sometimes…
Peta in Cumbria ==> Both Gleick and Stewart (see reading list pull quote) insist that the very systems themselves are nonlinear in nature — not just that we have linearized them out of laziness (which is also true). These systems appear nonlinear because they are nonlinear. Nonlinearity is not a trick of lazy mathematicians or physicists.
Read this paper: Nonlinear Population Dynamics: Models, Experiments and Data by Cushing et. al. (1998) and check back in here with your opinion.
P in C, you raise two deep philosophical history of science points, both going back now centuries, amd noth crucialy important. Bravo.
First, is Pascal’s notion that if you knew everything about some state of the universe (the position, momentum, … of every atom, plus all the laws of physics like Newton’s), then the future would be in principle computable and knowable. Also known as LaGrange’s Demon (since the Devil could also do the calculations). Pascal quit math for Christian asceticism shortly after founding probability theory to solve a compulsive Paris gambler friend’s question about how to divide the table stakes if the game stopped short… LaGrange stayed mathematician to the end. This was the deterministic Clockwork Universe idea that Newton inspired.
It eventually foundered on two problems. First, the present state is not precisely knowable (PI has an an infinite number of digits, underlying the Lorentz butterfly effect problem of sensitive dependance on initial conditions, undoubtedly coming in a subsequent installment of this excellent primer). It was Poincare who originally finally laid the celestial clockwork metaphor to rest, by showing that Newton’s three celestial body was not solvable ( because of nonlinear dynamic ‘chaos’ theory, although Henri did have that nomenclature in his time).
Second, Turing computability. Some things are not practically computable (in the digital sense) EVER! See a nice little supplemental reading book, Computability and Unsolvability, by Martin Davis (1958). Which is why GCMs must be parameterized…
The IPCC dogma versus skeptic stuff highlighted by Kip Hansen’s excellent first in his series of posts (if the rest are as good as this one, beyond excellent and worthy of a book) has very deep intellectual roots. ‘Those who do not study history are doomed to repeat it…’ Something like that.
The pendulum starting from “true north” presents special difficulties because of the sensitivity to initial conditions.
PoC, these are deep waters. If you are making the observation that the laws of nature appear to be linear and satisfy the superposition principle at the microscopic classical level, and appear to be strictly reversible at that level, I certainly wouldn’t argue with you, although quantum theory introduces a sort of nonlinearity at the very smallest length/time scales via pair production and vacuum polarization, there is the puzzle of mass (there are nonlinear Higgs models that are still not ruled out as candidates, given that the Higgs boson is not yet really ruled in), and ultimately all of this is empirical probable truth, true so far as we can tell, and we may or may not find some fundamental nonlinearity somewhere.
However, you are also conflating a few things. One of the first things one learns (and subsequently teaches) in physics is that it isn’t laziness that keeps us from treating ever elementary particle in a physical computation. It is that it cannot be done. Not just in the fashion you describe, because there are too many particles to be able to complete the computation of the motion of a pendulum one quark and one electron at a time, not just because we cannot use classical physics to do so and hence must include the vastly greater number of particles in the fields that govern the interaction at all length scales including the ones we currently handle via “renormalization” to avoid the highly nonlinear divergences in the “linear” fields themselves. Because of information theory. We tend to idealize problems — you do it above when you refer to “a pendulum”. If you want to treat the pendulum as a collection of quarks, photons, electrons, gravitons, heavy vector bosons, gluons, and Higgs particles (assuming that there are not other particles such as “darkons” that we cannot yet observe but that play an important role) then you cannot call it a “pendulum” any more. It is simply a very, very long vector of particles, a list that isn’t even stationary in time as you compute. You have to dice spacetime itself up all the way down to the Planck scale, because it is at that scale that vacuum polarization due to pair production and annihilation occur. You have a Heisenproblem — you cannot measure the initial condition of the system at that scale (to do so would be to alter it) so your knowledge of the initial conditions is intrinsically uncertain. Suppose, however, that we pretend that we can, and assign a big, imaginary, pile of particles on a finite space-like sheet of spacetime specific initial conditions.
We still cannot solve the problem for the following reason, and this is one most physicists do not usually think about or fully appreciate. We have now defined a precise knowledge of a system, yes, but it isn’t the right system. There is only one system one can integrate in the way you describe and get the correct answer, because at least two of the interactions have infinite range and one of them directly couples all of the massive particles out to at least ~14 billion light years away. That is the whole thing. The cosmos itself. The “system” you refer to is a strict subsystem of the whole thing. Worse, it is an open subsystem, constantly interacting with the rest. You cannot turn this interaction off, although out of ignorance and/or a certain perversity of the sort used when we present proofs that 1 = 2 (if you divide by zero and don’t tell) we make up “paradoxes” such as Schrodinger’s Cat or the Einstein-Rosen-Podolsky paradox that assume in the one case that the cat is in an adiabatic box that is perfectly decoupled from the physical Universe, and in the other too many things to list, all wrong.
The right way to formulate the problem is then: Write an equation of motion — ideally a quantum, relativistic, equation of motion — for the entire Universe. Fine, I can do that formally easily enough — I simply pretend that I know the density matrix for the entire Universe on a single spacelike sheet that spans the Universe. Note well that this sheet has to represent the precise state of all of the intermediate fields, as those fields from earlier times are by assumption propagating on that sheet and we have to be able to include the effects of e.g. photons en route or molecules in our “pendulum” will spontaneously bounce out of sheer magic when photons from a supernova six billion light years away happen to hit it, introducing error into our pristine computations. Second, I split the Universe into two pieces. One, I will call “the system” (our pendulum). The rest is usually referred to as “the bath”, as it is represented in the simplest cases that can be treated approximately at all a thermal bath with e.g. fixed temperature. The system is now properly an open system, and it interacts with itself via internal interactions at the same time it interacts with everything else (while everything else interacts with itself and with it, the entire systems is coupled).
To solve this system at least approximately in a local differential formulation, one goes through the Nakajima-Zwanzig construction to form a Generalized Master Equation for the “pendulum” — partition, form a projection-valued operator from the bath onto the system, describe the bath semi-classically in terms of probabilities (since we cannot possible know its detailed state) and end up with a non-Markovian set of coupled ODEs for the density matrix of the subsystem with a nontrivial time kernel describing the “memory” of the system for prior states. This does complicate starting the integration, but we are approximate already so we make simple assumptions and do the best we can. We can eliminate the Markov problem by assuming delta-correlated interactions and recover the Langevin equation — which works remarkably well for things like delta-correlated photon interactions in a collection of particles being treated only electromagnetically but is more problematic for gravitation and which does assume a lot of stuff about the bath that may not be true if the “bath” includes your hand as it gives the pendulum a push (ooo, how to predict/compute that).
To solve it exactly, however, is not possible at the human cognitive level because, to put it bluntly, the representation of information in the Universe itself is already maximally parsimonious. It is impossible because of information theory. It is non-computable because one cannot encode the information needed to specify the state of the system, let alone compute it, in a strict subset of the particles of the system being solved, period. The information content of the whole is greater than the information content in any encoding you like of the part. Hence the problem is not computable, period.
It is not laziness. It is that it is a priori impossible for us to integrate any strict subset of the Universe forward in time using a computer that is itself a strict subset of the Universe because for the computation to be exact, the computer has to be able to represent the state of the entire Universe in some encoding (and have room left over for things like the actual computation — normally it would take 2-3 times as much memory to advance a coupled ODE solution) and this is formally, provably, impossible.
The point is this. The entropy of the Universe is zero, because as you note all interactions are reversible. But the entropy of any subset of the Universe, even if you force it to be zero by pretending that you know its initial state exactly when in fact you cannot possibly measure or know it exactly, will not remain zero because the entropy of the rest of the Universe will instantly start to bleed through into the system unless you turn all interactions with the rest of the Universe off or otherwise idealize so that you are no longer solving the same problem, and in any event are not solving the actual problem exactly.
There are then several more things one could note. As my mentor in this sort of thing, Dr. Richard Palmer (ex associate director of the Santa Fe Center for Complex Systems and on the short list to become director until his tragic stroke) once taught me, “more is different”. The physics that best describes quarks interacting with gluons and electrons interacting with quarks is not the physics that best describes an atom. Only a madman would try to solve for the state of an atom in direct terms of quarks, gluons, and electrons. Instead we turn the quarks and gluons into nucleons that have their own rules for interacting with electrons, we turn the nucleons into nuclei that have rules that are again different from those of nucleons, we dress the nucleus with electrons and make an atom, and we have all sorts of rules for the atom that are not at all like the rules for nucleons or nuclei or electrons. When we build molecules we invent an entire science — chemistry — with rules that don’t look much like electromagnetism even though they inherit structure from the atomic rules, the Pauli principle, and so on. Organic chemistry and Biochemistry have new rules once again.
This sort of layering of systems with emergent order and quasiparticles (stable, named structures that become the “nouns” of the new layer, things like “electrons” or “holes” in semiconductor theory) and quasiparticle interactions (e.g. “plasmons”) that have highly nonlinear interactions in many cases. Once again this is not laziness — it is recognizing that the relevant degrees of freedom have self-organized into new structures and new interactions that we name and compute with because the microscopic description is a) not computable; and b) meaningless. This process proceeds at least up to the scale of life and human thought. Yet nobody sane would claim that my thoughts as I type these words are solutions to an initial value problem in physics that can be solved at the level of quarks, gluons, leptons, photons, etc.
Note well that everything you can name that isn’t an elementary particle is a recognizable/nameable spacetime collective quasiparticle. Almost all of these quasiparticles will interact according to nonlinear dynamical schemes, although we spend a lot of time and energy teaching idealized versions of them where “an atom” interacts with other atoms via stately, linearized, means such as “dipole-induced dipole” (Van der Waals) forces, Lennard-Jones potentials, hard sphere models, or as electrostatic ions. Again, this is usually done to make a problem solvable at all in at least an approximate way, one that gives decent agreement with experiment. But there are all too many regimes where really interesting things happen in the sense of the chinese curse — regions of emergent order, critical regions — places where an interaction is trying to make a new quasiparticle but the quasiparticles formed are evanescent and interact so nonlinearly during their brief lifetime that the system isn’t computable using them, but it also has entered a region where the old interaction that is producing the quasiparticles is not computable either.
On top of this is the problem of deterministic chaos. Note well that the problem is shared equally by quantum and classical theories — that’s the point of the Nakajima-Zwanzig equation. Both ways one is simply seeking to integrate a system of coupled differential equations, and in both cases even if the system itself is nominally linear, by the time one partitions and approximates the (far) greater part, one gets crazy stochastic stuff like “wavefunction collapse” in the quasiparticle description of the open system (note well that all processes of measurement are described properly by the Generalized Master Equation as the measuring apparatus is not a part of the system and its state is at best known in an approximate, stochastic semiclassical description, hence our conclusion that the measurement projects out one of the possible quantum states of the system on a purely stochastic basis — we simply don’t know the quantum phases of the measuring system, we don’t know its state, we don’t know the retarded fields, and so we cannot solve the correct problem with is the purely deterministic quantum evolution of system and measuring apparatus and the rest of the Universe all together).
Hope this helps…;-)
rgb
Division by zero is a singularity, a point where an equation or process is not just non-linear but boldly discontinuous. A condition well beyond chaotic that (I hope) has no relevance to climate.
Good article. I wish more people actually had a clue about just how, err, “chaotic” chaos really is and what a joke it is to assume that the last 165 years out of the entire climate record would have been dead solid stable in temperature and flood/drought patterns if only we hadn’t added CO_2 to the atmosphere by burning stuff.
The second problem, of course, is that the GCMs exhibit chaos (if they didn’t NOBODY would take them seriously) and sometimes warm the planet for the next century, sometimes cool it, sometimes do something in between, again from starting values butterfly-effect perturbed to “sample” the phase space of possible outcomes. The resulting trajectories are then averaged per model, and then superaveraged across models without even reweighting the results to reflect the number of perturbed parameter ensemble runs contributing or the non-independence of the CMIP5 models themselves and this “multimodel ensemble mean” is used as the most likely trajectory for the climate.
It is difficult for me to even start on this one. Its stupidity literally takes my breath away. It is not justified by observation. It is not justified by any possible application of statistical science. It is precisely antithetical to the actual climate trajectories produced by the models themselves, which — flawed as they are, with egregiously incorrect autocorrelation times, fluctuation amplitudes, and predictions for things like tropospheric warming, alterations in the frequency or severity of storms, and the patterns of drought and flood — are at least still possible trajectories.
This is something that should be pointed out even more firmly than you do above, with more examples. The average of many chaotic trajectories is not a chaotic trajectory, and is not, in fact, a good predictor for any actual trajectory produced by the nonlinear system.
A final thing to note is that your examples above — Volterra-Lotke, iterated maps — are textbook examples (which is good) in very low dimensionality which is bad. The climate isn’t just nonlinear and chaotic, it is highly multivariate indeed and given that we have no idea what even its present state truly is to any precision at all any attempt to solve a climate system using time-local equations of motion necessarily makes a Markov approximation that cannot possibly be justified in what is a highly non-Markovian dynamical system. Variations well within our uncertainty (not a very difficult hurdle to jump, given that our uncertainty is enormous) in the state of the ocean alone could completely alter the pattern of chaotic attractors and cause the planet’s climate state to jump to almost anything quite independent of what CO_2 is doing. We don’t even have a good grip on the feedbacks involved.
And this is before one gets to the issues with data tampering and the incredible and systematic bias in the pattern of temperature “adjustments” that have been applied to the raw thermometric data to generate what is not presented to the public in the major temperature anomaly estimates. At this point we are building models to chase models built to alter the data so that it fits the models that people are building to fit the data.
It’s very amusing to look at North Carolina’s climate record, “unadjusted”. It is almost completely flat over more than a century. Yet the greenhouse effect should be (by its very nature) warming the planet everywhere, if one uses the linearization argument.
So we have an interesting pair of arguments that are mutually contradictory but are trotted out and presented at will. When we look at the flat, boring climate of NC (indeed of the entire continental US) that is to be expected, because the climate is chaotic and the heating is not uniform, some places are warmed by CO_2 and others are not or may even cool. But when we look at the global temperature anomaly (adjusted or not, for whatever average warming may or may not have occurred over the last 150 years) that we can explain as the linearized response of the climate to more CO_2. Both of these arguments assume that the average climate is stationary. But climate is obviously, empirically, manifestly non-stationary. Not even in NC is it stationary, however flat the overall temperature record is.
rgb
RB, well said,
If today’s public were truly aware of the on-going climate model pseudoscience and temp dataset adjustment fraud being foisted upon them by the Climate change witch-doctors, the CO2 swindle would utterly collapse. At some point in future history of science books, the public and science historians will look back on this IPCC period with a sense of both derision for the climate modellers (for advancing their obviously flawed outputs) and with wonderment at how so mainstream scientists uncritically remained silent and allowed it happen. (pursuit of funding grants and prestige, and fear of grant retribution is the likely human failure IMO).
Reply to Dr. Brown ==> Thank you for weighing in.
In this very introductory — almost kindergarten — essay, I hoped only to familiarize readers with the vaguest of issues surrounding linear vs. nonlinear dynamical systems.
In Part 2, I will introduce readers to some of the most common features of nonlinear dynamical systems, and in Part 3, make some vague, non-technical observations on why this should matter in our understanding of the world at large and in climate science in particular.
I have posted a Chaos Theory Introductory Reading List above (see the pull quote) for those intrigued or incensed by this piece today.
RGB, I concur this is a great article. Climate science was hijacked 25 years ago by space cowboys and computer geeks. They need to stick to data archiving with no adjustments allowed.
If you want a simple introduction to real climate science, which is a biological science, pick up a seed packet from a garden store and look on the back. You should find a map of climate zones something like this
http://planthardiness.ars.usda.gov/PHZMWeb/
By rights climate science is a taxonomy of real live biomes and as such can be mapped in real world terms, not computer guess work. If the real world were some average temperature, the map would be all one color, sillies.
Oh, I’d even allow adjustments, provided that two things were manifestly true when they were made. One is really simple. There is no a priori reason to expect “data adjustments” themselves for any of the usual statistical reasons/methods one might use to adjust data — rejecting some stations, accepting others — to be biased regarding sign. That’s why it is usually best to a) not adjust data except POSSIBLY to reject outliers so far away from the physically reasonable that they are probably errors; b) use random numbers and Monte Carlo as often as possible to ensure a random (iid) sampling. That way one assumes that the unbiased errors will, on average, cancel out when one uses the whole reasonable dataset. This is almost always best practice and is of course the absolute rule in most statistical analyses. If we are computing the mean height of eleven year old males, we don’t “adjust” the data by assuming at all measurements were made rounding up, we assume that the measurers rounded up or down indifferently and hence just use the measurements “as is”. In this case, we cannot even reliably reject most outliers because there are actual eleven year olds who may be much taller or much shorter than everybody else due to e.g. hormonal/glandular disorders. If we throw away a two meter tall eleven year old because that is “impossible”, we may be biasing our result as there might well actually be a two meter tall eleven year old somewhere in the world. There are certainly one meter tall eleven year olds who will never grow larger than 1 meter, even though nearly all eleven year olds are likely around a meter and a half tall. Sifting through the data one record at a time to sort all of this out means ultimately that you are going to apply a heuristic in a statistical computation and if you do it honestly it will cost you just about exactly as much in the precision of your final answer as your final answer would have been imprecise anyway — no real gain, just the impression of your heuristic on the final answer because it fits your preconception of what the answer “should” be.
If we look at adjustments to the temperature record, then, we would expect them to increase warming as often as they increase cooling. We can even compute the p-value for probable bias in the adjustments by applying the binomial distribution to the problem with p = 0.5. If nine adjustments have been made, and all of them produce more warming, that is unlikely in a world where errors are a priori distributed without bias at the level of 1/512, which permits us to reasonably reject the null hypothesis “there is no bias in the corrections being applied”.
The second case is trickier. There can easily be good reasons to think that there are systematic biases in the data record. For example, suppose that the dataset one is using to compute the average height of eleven year olds worldwide has been drawn 90% from U.S. middle school records collected over the last 165 years.
At the beginning of that record, one would be sampling almost exclusively white children, but the diet of those children would have been comparatively poor, the prevalence of childhood diseases (such as polio) that affect growth compartively high, and in those respects it might be unbiased relative to the rest of the world in those respects. The racial mix would still be a problem, as some racial groups are known (know) to have distinct average heights, moreso in the past before much racial mixing occurred.
Over time, however, the diet and healthcare of the children sampled in the record would have improved, and with it (almost certainly) the mean height. Child height is not stationary over 165 years almost anywhere on the planet. At some point black students would start being a substantial part of the record. At a different point hispanic students would become a substantial part of the record. By now the record would be sampling almost every racial group on Earth at some level, and the white/caucasian component would be correspondingly reduced. How can one use the (still mostly US) sample data to “correct” the average obtained both over time as the diet/health of US students diverged from the diet/health of the far more populous Chinese, or Indian or African populations, and for the non-stationary racial balance of global population?
The answer, of course, is that one can’t. Not without information that one simply does not have. If we had an equally reliable set of measurements of (say) the height of eleven year old Indian children, we wouldn’t use it to compute a correction to the US data, we’d use it in the computation. Now the dataset isn’t 90% or more US white kids in 1865. Of course we’d need to know the Chinese data as well. Note that India is not racially homogeneous, and that food and health are not uniformly distributed there either. Ditto China. There are very tall Chinese, and there are very short Chinese. In India the very tall are rather rare (to the best of my recollection). We’d need the African data. Note that collectively there are, and were far more of these children than there were in the US, that the US data only selected a biased fraction of all of the eleven year olds in the US, and that the probable biases compared to the rest of the world change over time.
The solution in real statistics is to take what data one does have, try your best to form e.g. regional averages over time, and develop the world average eleven year old height over the last 165 years with much, much greater error bars in 1850 than one has in 2015. The pristine US data you started with cannot be “corrected” to reflect this. If you have no data at all from China in 1865, you cannot even take modern data on China, compare it to modern US data, compute a “correction” or “scale factor”, and apply that scale factor to the 1865 US data and pretend that it now represents China too, because the mean heights are not stationary and have a time varying racial bias as well!
This is what the temperature records are trying to do, and yet somehow end up doing backwards. For example, we might well examine the US data and find that the non-stationary average height systematically increases from 67 centimeters in 1850 to 74 centimeters in 2015. Let’s call this correction the “Urban Diet Effect”, the combined effects of improving diet and healthcare plus the admixture of new racial groups. We are pretty certain that all the way to the present, this group has a substantially greater, systematically growing height compared to the average height outside of the group. We can sample (for example) the mean heights of all eleven year olds in 2014 with an unbiased sampling and in a truly global way, and find that at the present time the global average including the predominant rural population is only 71 centimeters. We are pretty sure that the US data has been too high across the entire range all the way back to 1850, but that in 1850 the correction is probably small. We can, and in this case probably should, try to build a model for data correction since for whatever reason we are constrained to use the biased, non-stationary, incorrectly localized US data to compute the whole height record.
One would guess that the effect of applying the model would be without question to cool the present relative to the past, systematically, over the entire record. Yet this is the one correction that HadCRUT4 does not make, instead applying a long string of other corrections that always end up with a net warming of the present relative to the past (and generating in the process a near-certainty of systematic bias somewhere, although they would argue that that bias arises from the way temperatures were measured in 1865 compared to the way they are measured today). GISS, IIRC, actually does include a UHI correction and somehow it warms the present as often as it cools the past! The one correction they can apply that almost certainly is actually biased in a monotonic way across the data they apply so that it works out neutral (and hence in “agreement” with HadCRUT4 that ignores it completely, two “independent” routes to the same desired result. Leaves me speechless.
In the end, the comparison of the “corrected” average to the simple average is pretty astounding. Something like half of the observed warming in the record is due to the corrections. In a sane and rational Universe, those corrections would have come with a cost in estimated error almost as large as the correction, because you cannot manufacture information you do not have by means of building a model of it, so building an imperfect model at all to e.g. interpolate, krige, smooth, infill, all comes at a substantial cost in error because one has to make Bayesian assumptions that one cannot usually justify and at the very least these approximations will smooth temperatures and hence cut off temperature extremes. For most of the spring, NC temperatures have been nowhere near their average. If we did not have the real data that revealed that, replacing its temperature with its average would simply have reduced the variance/error of the global temperature estimate at the same time it biased it high, but that reduction would have been entirely artificial.
The most telling symptom of this is in HadCRUT4’s total error estimate. It is just under 0.2 C at the present. It is just under 0.4 C in 1850. And that is absolutely, positively, totally absurd.
I’m very tempted to address the problem with anomalies in this same reply — again using the metaphor of measuring the nonstationary average height of eleven year olds from a biased (not independent, not identically distributed) sampling of eleven year old height data. In particular, consider this. The “anomaly” of this non-stationary distribution is (say) the difference between the true average over the entire record and the average in any given year. We’ve already agreed that the true average is enormously difficult to compute in any year — to put it bluntly, our uncertainty in global temperature today is around 1 C either way, which is actually larger than the 165 year “anomaly” change. Yet they assert that the anomaly is known to 0.2 C today, 0.4 C in 1850!
We are left with a statistical miracle as astounding as that of the loaves and the fishes. We don’t know the temperature of the planet in 1850 to within 1.4 C (being generous!). We don’t know the present temperature to within 1.2 C, which is also probably generous. But we know that it has warmed 0.8 C in the meantime.
Now, I could believe that if people recorded “anomalies” independent of the actual temperature data. This would be the equivalent of making a mark on the schoolhouse wall in 1850, and recording how much above or below that mark the height of eleven year olds were, year to year. We then would end up with no idea what the absolute height of eleven year olds was, but we might — I say might — be able to resolve a statistically significant trend in the timeseries data over 165 years as long as the schoolhouse never burns down, nobody replaces the floor, students don’t start to be measured in their shoes after 1870, etc. We might actually end up knowing the anomaly more accurately than the measurement itself.
However, that is not what we have. We have the actual heights, the actual temperatures. There is no point in forming a local timeseries, fitting a linear trend to it, computing an “anomaly”, and averaging the anomalies on a grid. Just average the damn temperatures on the grid! You cannot do any better than that! If students started wearing shoes halfway, or the schoolhouse floor sagged over the centuries, you aren’t going to magically eliminate that by means of averaging a fit to the data or a delta of the data any more than you would eliminate things by averaging the data itself. The problem isn’t that anomalies are better or worse than the data itself. It is that they inherit almost all of the problems of the data itself no matter what. You are still making an assumption when you elevate the anomaly over the straight average, and unless you allow for the extra error associated with the assumptions you will have the absurdity of knowing the change in height over 165 years more accurately than you know the height itself from the same height data!
rgb
I have recently published a study on this subject.
Adjustments Multiply Warming at US CRN1 Stations
A study of US CRN1 stations, top-rated for their siting quality, shows that GHCN adjusted data produces warming trends several times larger than unadjusted data.
The full text and supporting excel workbooks are available here:
https://rclutz.wordpress.com/
Linearized small changes in a nonlinear system are commonly used where the output control response is rapid and single step..
For example f(x) = sin(x), is of course is a non-linear equation. But over small values of x close to zero,
f(x) ≈ x.
In radians: (0.01 radian = 0.573º)
For example sin(0.01)=0.010000 (six decimal places).
sin(0.02)=0.019999
sin(0.03)=0.029996.
Thus (dx)/(dt) in a system of equations, as long as the deltas are small and the values of x are small, this linearization works quite well for functions of sin.
In control systems, where the angle inputs and deltas can be kept (physically bounded) small, then this approximation works well to linearize the control equations.
The big key CAUTION though is the system control error will rapidly increase if this approximation is iterated several or more times to achieve the output in phase delay. This is 1 big reason why linearized climate models fail, as the small errors propagate rapidly as the system equations are iterated in time, ie. the butterfly wing-flap in Brazil problem.
I would have stated this somewhat differently. For any continuous function of a single variable, say time, one can perform a Taylor series expansion of that function around any given reference time. The most general — if you prefer, “likely” case — in almost any such expansion is that the first order (linear) term will be dominant for sufficiently short times. One can of course generate exceptions or counterexamples, such as fitting a pure quadratic function around its minimum that has no linear term in the Taylor series, but at more general points even a pure quadratic will get the largest contribution from the linear term for sufficiently small steps away.
The problem is unless the system really is a linear system and has no quadratic or higher order dependence, if one keeps going away from the initial point where one linearized, eventually the higher order terms are quite likely to dominate.
This argument is quite general, BTW. I don’t really care what system(s) one is talking about. It is one of the many, many, serious problems with trying to statistically analyze a timeseries so that one can predictively extrapolate it. I’m tempted to just say “it can’t be done”, but that’s not entirely fair as all of human knowledge (including physics itself) is the result of a systematic process of self-consistent statistical extrapolation (inference). However, it is entirely correct to say that it cannot be done without making assumptions that are not, themselves, part of the timeseries data being fit. Assumptions like “the way physics worked yesterday and appears to be working today is going to be pretty much the way it works tomorrow”, which is (if you think about it) impossible to justify by any statistical extrapolation that does not beg the question. One can wait until tomorrow and go “Aha! I was right again!” and use that to strengthen your belief that it will be true for tomorrow again, but it is very difficult to explain why things that appeared to be true yesterday should persist in being true today, without assuming the conclusion. Hume noted this several hundred years ago, and it remains a predominant problem in the philosophy of mathematics and science today.
rgb
Reply to Joel Bryan and Dr. Brown ==> Yes and Yes. As we shall see in the next part of this series, nonlinear dynamical systems often start out quite well behaved, predicable, and offer useable practical solutions.
In the essay above, the squirrel population on May island is wonderfully well behaved, settling down to a steady state slightly above 0.6 of the island’s carrying capacity when the growth rate is below 3. Many, most, nonlinear dynamical systems have this trait — an apparent linear regime and devolving to nonlinear behaviors at some point. Below the point of transition to chaos, we use these functions every day in electronics, audio systems, dynamic fluid flows, etc.
Just an additional comment to the above. Many numerical methods of solving coupled (partial) differential equations work by linearising the problem, so taking small steps in time and space. As Dr Brown points out, this assumes that the higher terms of a Taylor’s expansion of the function in question. One difficulty in this approach is that to reliably linearise climate models, extremely small steps are required in both time and space, which imposes very large grids and very small time steps that is far beyond any computer.
The approach used is the parameterise the space and time meshes to enable a solution that is said to work. This is not necessarily correct because the parameterisation, that is used to compensate for the higher (non-ignorable) terms of Taylor’s series at large steps, is essentially an arbitrary interpolation. This is a real problem in mathematical analysis of cardiac activation and abnormal cardiac rhythms (highly non-linear) where very small changes in parameterisation lead to wildly different results and the meaning of the results in terms of what the heart actually does is questionable.
I had a large book on chaos theory but it was a bit too much for me to get to grips with, I could understand the flight or fight analogy where say a mother animal might back off from a predator then suddenly switch to another state of attack as distance to offspring reduced but I couldn’t see how that applied to air circulation.
I did have a star dot matrix printer tho’ and everytime I printed with it my crickets ( lizard food) would start chirping.
Reply to zemlick ==> Thanks, made me laugh. Chaos Theory is not for the timid…even at an introductory level. In our home, the lizard food always managed to escape and keep us entertained at night with their songs. My boys solved this my releasing a gecko to gobble them up — worked too.
While the gecko was growing up did you ever think to create a linear graph that projected when it would reach Godzilla-like proportions?
Reply to Piper ==> No, but it did eat a lot of escaped crickets! Crickets were easy prey as they couldn’t seem to give up the chirping that gave away their position.
I don’t mean to sound like a jerk, but I have found a lot of “chaos theory” — at least that which has a deterministic basis — to be very accessible, visual, and … well … easy to follow.
For example, the tome titled “Chaos and Fractals: Frontier in Science”, despite its imposing size, is really a rather fast read.
http://www.amazon.com/Chaos-Fractals-New-Frontiers-Science/dp/0387979034/ref=sr_1_2?s=books&ie=UTF8&qid=1426471178&sr=1-2&keywords=chaos+and+fractals
zemlik,
IMO ‘”fight or flight” doesn’t work in animal behaviour, either.
Some rather dubious overlap in physiological phenomena in situations that are far from being similar gives rise to a glib alliteration that seems immediately to make sense to people that, perhaps, have never had to fight nor flee.
To me, it’s like global warming causing cooling.
Fleeing is not a bit like fighting except for the exertion required.
It’s generally described as an immediate excitement of the sympathetic nervous system, but actually, I contend, the initial response to surprise is parasympathetic; the reptilian freeze manoeuvre. It may not last long but it’s the time it takes to realize that what has suddenly appeared before you is not a receptive female but a hairy predator.
Chaos is a good synonym for incomprehensible.
Climate models use non-linearity as a means to an end, averaging them out to produce their projections. Initiating atmospheric-oceanic conditions are randomly varied to simulate the random walk we call weather pattern variations. What they fail to understand is that at most, when fudge factors are removed, only a tiny fraction, if ANY, of their model runs will be the correct ones and will reasonably match observations. The problem with their “chaos runs” now not matching observations is that each and every run has the same fudge factor (a temperature rise “calculation” based on %increase in CO2/water vapor) applied regardless of initiating conditions, thus guaranteeing a rising result for each run. I wish I knew when that fudge factor is applied. Does it enter into the beginning of dynamical calculations or is it tacked on at the end just before the printer springs to life. I am guessing they tried it in the beginning but it either sent the results spiraling past reason or the chaotic nature of the system removed it. To me it seems likely this fudge factor is tacked on at the end to make every stinking one of those runs rise depending on how large the fudge factor is.
No need. The system of equations presumes detailed balance — in the long run, power in has to equal power out. In the dynamics they have terms that represent the greenhouse effect in the radiative transport of heat, attached to assumptions about the time variation of CO_2. As they turn up CO_2, this basically cranks all of the models in a certain (warming) direction along a partial derivative contributing to the overall global temperature. All that they then require is that more models produce (in response to this linearized additional driving) more warming than cooling.
Of course they do get hundred year runs out that produce little or no warming, or that even cool, in spite of the additional forcing. They in fact get a huge envelope of possible future climates, per model. Individual runs warm up far too much, then suddenly cool, then spike back up again. The annual through decadal variance of the individual model runs is many times greater than the observed variance, and fails to exhibit characteristic patterns (like warming in strong ENSO events) simply because the models cannot themselves generate strong or weak ENSO events, or predict any of the multidecadal oscillations, or predict the state of the sun, or predict what humans are really going to do, and of course none of the models is started out at anything like the correct initial conditions because those initial conditions are simply not known. The present conditions are not known, not on the scale needed to initialize the models (which is still far short of what it needs to be for the models to reasonably be expected to be accurate).
The failure of variance and autocorrelation is then hidden by averaging over many trajectories, and then averaging over many models, including models that nobody seriously thinks are right any more because they are seriously out of touch with observed reality — basically they are falsified by the data already but are still included in order to beef up the average warming. The variance of the superaveraged trajectories is still not right, but now it starts to “look like” it produces “realistic” fluctuations.
Nick Stokes recently argued to me that CFD codes work OK even though they don’t compute all the way down to the Kolmogorov scale. However, the counter argument to this is the following. Who in their right mind would ride in an airplane designed using CFD codes that showed in every run that stresses on the airplane would tear it apart, but where the average of those runs stayed solidly within safe tolerances? Who would ride in the airplane when it was easily shown in wind tunnel tests that the airplane design in question doesn’t behave like any of the individual runs or the average over those runs?
You can argue all you want to that CFD code, applied in a sane and rational way to problems that are sufficiently “smooth” and simple, can overcome at least some of the problems associated with meso-scale turbulence without going down all the way to the microscopic scale, but that hardly justifies solving the most difficult CFD problem in the world, an insanely difficult CFD problem, at a scale that doesn’t come close to the scales of many phenomena that are extremely important in its dissipative properties, in a way that no engineering firm would ever accept (for very good and sane reasons!) in the actual engineering of supersonic aircraft where making tiny mistakes in the design can cause the airplane to exhibit sudden, nonlinear, catastrophic failure.
rgb
Hi Kip Hansen – I am glad you are discussing this subject. Here are two of our papers that can contribute to this discussion.
Pielke, R.A., 1998: Climate prediction as an initial value problem. Bull. Amer. Meteor. Soc., 79, 2743-2746. http://pielkeclimatesci.wordpress.com/files/2009/10/r-210.pdf
Rial, J., R.A. Pielke Sr., M. Beniston, M. Claussen, J. Canadell, P. Cox, H. Held, N. de Noblet-Ducoudre, R. Prinn, J. Reynolds, and J.D. Salas, 2004: Nonlinearities, feedbacks and critical thresholds within the Earth’s climate system. Climatic Change, 65, 11-38. http://pielkeclimatesci.wordpress.com/files/2009/10/r-260.pdf
I also recommend searching on my weblog under this topic [https://pielkeclimatesci.wordpress.com/?s=chaos and https://pielkeclimatesci.wordpress.com/?s=nonlinear%5D
Best Regards
Roger Sr.
The second paper, especially, establishes something that I don’t emphasize enough because it is difficult enough to convey the notion of “simple chaos” but have been trying to nudge people on-list to understand at least in principle. The Earth isn’t just chaotic, it is complex. The problem with a term like complex is that it has many meanings (and I don’t want to explain, so I don’t use it in list discussions very often) but the sense in question is complex as in complex (highly multivariate) systems capable of spontaneous self-organization past some critical threshold, along the lines suggested by Nobel Laureate Ilya Prigogene. There is absolutely no doubt that the climate is a complex system, and in fact it may be that its complexity is even more important to understanding and being able to predict is nonlinear dynamics than it chaosity per se. For one thing, we have lots and lots of named self-organized climate structures — ENSO, the PDO, the AMO, the NAO, Hadley circulation, the Gulf Stream (indeed each and every named oceanic current), the jet stream, the monsoon — all of these are recurrent or quasi-stable patterns that participate in the transport of heat from where it is first appears as “new energy” in the Earth’s climate system to where it finally takes off for 3 K outer space.
A tiny variation in just one of these major patterns can have profound global climate effects. It can completely shift the “efficiency” of the system at moving heat from one place to another and hence the distribution of temperatures worldwide. ENSO rather obviously has just such an effect, often a persistent one. Within such a system responses can be completely counterintuitive. Increasing CO_2 could — as it warms the system initially — trigger the system to shift spontaneously to a new, more efficient dissipative pattern that rapidly cools it, quite possibly in a persistent way for timescales of centuries or more (until something shifts it back again). Not only can the system switch between two or more attractors, it can suddenly change the entire landscape of attractors, even without an external forcing change.
I plan to read the paper in some detail, as I did work on optical bistability back in the 80’s and the Earth is manifestly (when viewed at the right timescales:-) an optically bistable, if not multistable, system. Historically, it spontaneously switches regimes (accompanied by rapid warming or cooling), then slowly varies within a regime, then switches again. In even simple systems, the mean field equations exhibit things like hysteresis, dynamical critical phenomena, and much more. In a complex, messy, noisy, chaotic system those same phenomena occur but now resemble the original the way spiders on drugs weave webs that resemble normal spider webs. Unlike a regular web, where seeing one part of the pattern allows at least approximate reconstruction of the whole, the organization deteriorates until (on LSD) it is barely “a web” at all:
http://fractalenlightenment.com/600/chill-out/spiders-weave-better-on-lsd-25
That’s the interesting thing about adding CO_2. Are we adding an anti-psychotic drug to a system that is already crazy, stabilizing it before it might have plunged over the threshold into the next glacial episode, or is it more like LSD, something that destabilizes to where anything could happen — warming, cooling, nothing, both, wild oscillations between the two? According to the best evidence, the climate is already pretty psychotic, as likely to produce 200 to 300 year droughts across the entire Pacific coast as not if you look back over the last 2000 years instead of the last 150 years of comparatively adequate rainfall, and that’s without CO_2. With CO_2 does this become more or less likely?
This is hardly a silly question. Chaotic (simple) systems, chaotic (complex) systems, self-organized systems, have a variety of “critical points” where things can rapidly switch around, but they also have regimes where they do not switch around, where they are comparatively stable. At this point in time we have no idea at all whether adding anthropogenic CO_2 to the atmosphere has been the best possible accident, one that acts like a stabilizing agent so that global climate finally becomes as stable and predictable as climate scientists would have us believe that it would be without it, or is the trigger to a disaster. We don’t even know the sign of the temperature change in the disaster in the event that it turns out to be a disaster. We are decades of very hard work away from being likely to offer even marginally plausible answers to any of these questions — at this point in time we cannot even measure the state of the Earth’s climate system precisely enough to know what a single projection of it (e.g. “global average temperature”) is to within a whole degree Centigrade, and of course we probably don’t know the temperature in our own backyard or in a single cubic kilometer of ocean or atmosphere to that precision either.
rgb
Not a silly question at all – a very good one. Thanks.
Now that video was funny!!!
Explains a lot about why the Obama Admin is so incompetent… the drug-addled have risen to positions of authority in government. I’m just wondering who is the human US political equivalent of the crack spider? Maybe Putin? Maybe the Ayatollah? Maybe the Chinese owning the US national debt?
rgb, I beg to differ in terms of tiny things making big things happen. It takes a lot to scrub out a high pressure blocking system, a LOT of energy. Think jet stream energy. Big strong jet airplanes ride against it like a bucking bronco on speed and just after a hornet stung its nose. Riding with it results in a quick trip from point A to B with quite the jet fuel savings. I think we have been lulled into thinking that a butterfly’s flapping wings in one corner of the world can create a hurricane in another. I don’t think so. We may be missing the real causes by focusing only on tiny things.
Reply to Pamela Gray ==> You are speaking of the infamous butterfly’s flap….
What that is really about is “sensitivity to initial conditions”. One of my examples above speaks to this issue, in a very simple way. The graph is labeled 2×2-1 and shows orange and blue traces.
In this system, the initial input was changed from 0.54321 to 0.54322 — you can see the change in the numeric values and the behavior of the graph over time. Moving the change to the right even further, such as 0.543219876 to 0.5433219877 would only delay the arrival of the chaotic divergent behavior — but arrive it would. It is this feature of nonlinear dynamical systems that is referred to in the so-called Butterfly Effect. In the complex actual world climate, the eruption of a volcano in South America could change the weather in New York a week later.
Reply to Pamela. It is a matter of perspective – big things, little things.
Trying to tie Earth’s entire climate system to just one thing- CO2- is like saying you can predict everything I’m going to do today based on how much caffeine I had this morning.
Reply to Dr. Pielke Sr. ==> Thank you sir, for the compliment and the references.
The subject of “complexity meets chaos” probably is too deep for my 3-part introductory series — but of course, it is at, it may be, the very crux of the Chaos-Climate problem. (I see that Dr. Brown discusses this above).
No a volcano in South America could not change weather in New York a week later. For such a claim to be true there has to be an example of it ever happening.
:@TT
will this do ?
A volcano erupted in southern Chile early Tuesday
morning, spewing ash and lava high into the sky.(2 Mar)
http://www.accuweather.com/en/weather-news/thousands-evacuate-after-explo/43264196
Unusual temperature fluctuations about a week later.
From the graph we see that temperatures were higher than predicted,
http://www.accuweather.com/en/us/new-york-ny/10007/march-weather/349727
It’s an example of the weather in New York changing
about a week after a volcano erupted in South America,
Of course correlation does not prove causation, however
it is interesting nevertheless.
Kip, a very good article, thank you.
Would I be right in saying that anything linear must, by definition be very simple? For example your x2 analogy is a good one, but if it was changed to 2 squared eg 2, 4, 8, 16, 32 etc it would be a curve which is non-linear but still a relatively simple calculation.
Climate has very many variables and I would guess that there are too many to process even in a super- computer to get an accurate assessment. I would think that the mistake that the programmers have made when trying to predict GW is based on one factor (CO2 concentration). Therefore predictions are attempted on probably the most complex non-linear system that exists, with one linear variable (CO2 concentration), logically the models must always be wrong.
Reply to andrewmharding ==> “…anything linear must, by definition be very simple? ” Your “curve” is linear, but not a straight line. You notice at once that no angle is needed, and that every point on the curve is an input/solution pair, and that the whole is proportional. In that sense, it is simple.
I leave talking of climate for a subsequent essay in this series.
Thanks for reading and sharing.
See my essay above on complexity. Actually, there are a couple of them in this thread at this point. The fundamental microscopic interactions that govern all of nature appear to be linear, and “simple”, but in application they are anything but, because when you put many simple objects together, they can self-organize into new structures that are temporally persistent, namable, and that can have all of their properties and interactions given independent of the microscopic rules that give them birth.
More is different.
A fun example of this is Conway’s Game of Life (a computer simulation of a particular kind of iterated map intended to be a crude spatial representation of reproduction in nature). The rules for the game are very simple:
http://en.wikipedia.org/wiki/Conway%27s_Game_of_Life
(which includes a running example of a “glider gun”, BTW, as well as gives the four rules:-). Note that “gliders” are named objects that are commonly seen in the time evolution of many initial states, and that even these simple rules can produces temporally persistent, nameable, complex objects.
Another fun example is “you”. Microscopically your component parts are all, as far as we can tell so far, governed by strictly linear, reversible interactions. Macroscopically you yourself don’t know what you’ll do ten seconds from now, even though the you of ten seconds from now will do it almost without thought (or almost AS the result of a continuous thread of thought that is in no possible way “linear” or “simple”).
rgb
“Would I be right in saying that anything linear must, by definition be very simple?”
Not really, you can have very complicated linear dynamical systems (but I doubt that many people on this thread even know what a linear dynamical system are).
The worst example of “linearizing a non-linear system” must be the entire concept of ECS (Equilibrium Climate Sensitivity)… the temperature change resulting from a doubling of CO2 equivalent.
The natural log is not a linear function, so this simply isn’t true. What you mean to say is that when they idealize the climate system and show that the idealized system will warm (on average) by around 1 C per doubling of CO_2 in a first-principles computation (but one with many idealizing assumptions and neglecting a ton of other stuff going on) that is far from sufficient proof that warming will occur, on average, according to this functional prescription. I agree — it is reasonable, but far from sufficient or proven. Going beyond this and presuming we know the feedbacks from things like water vapor and cloud albedo and plant growth in response to a doubling of CO_2 and using them in an even more idealized model to conclude that we’ll still follow a logarithmic schedule but now warming will be doubled, or tripled, per doubling of CO_2, is to add unverified insult to unverified injury. It is still reasonable, BTW — it’s just that the assertion needs to be taken with a great big grain of error bar salt. A warming of 1 C plus or minus 2 C is more like it. Although how one would reasonably estimate the probable error is not an easy question.
The best statement of this is probably: All things being equal, we expect (for sound reasons) a temperature increase of around 1 to 1.5 C per doubling of CO_2 from the direct effect of the CO_2 on the equilibrium temperature. But since the natural variation of the temperature independent of the CO_2 is not known or computable, since the feedbacks are not well understood or computable, since attempts to compute both are in poor agreement with past observed temperatures or weather patterns, the safest thing to say is that we don’t know any more than this. The actual change in temperature from all factors including ones we do not know or fully understand yet could be bigger, or smaller, or zero, or even negative.
We just don’t know.
But still, the 1 C per doubling is a good and reasonable baseline estimate, one well-justified by physics.
rgb
Well said. That needs to be pointed out incessantly since most people have no clue about the mathematics involved in describing the systems that are used to predict weather. It should also be reiterated on a daily basis that no climate model has any predictive power whatsoever — even when starting from known conditions. Lorenz showed that, but the busybody know-it-alls forever ignore that detail.
What it comes down to is that Green has replaced Red and the color of oppression.
Westerners are particularly liable to this sort of straight-line thinking. SE Asians, and Easterners generally, tend to think that a straight line is likely to run out of steam and return to normal or the mean–or even to morph into a contrary trend. They see reality as cyclic, not progressive. See the book, The Geography of Thought: How Asians and Westerners Think Differently … and Why, here:
http://www.amazon.com/Geography-Thought-Asians-Westerners-Differently/dp/0743255356/ref=sr_1_1?ie=UTF8&qid=1426445166&sr=8-1&keywords=the+geography+of+thought
Reply to rogerknights ==> Thank you for the reading suggestion. I studied Eastern Religions at university and am somewhat aware of the vast difference in basic cognitive approaches in life. Hope my library has a copy!
University of Palembang, Sumatra, Indonesia,
uses this book as part of the Geography coursework
http://v.ht/37nF
The IPCC correctly stated that climate is nonlinear and therefore cannot be predicted. However without telling you, they do assume that the statistical properties of the climate can be predicted by the models. If that weren’t true, the entire program would be worthless. It turns out that a deeper understanding of nonlinear dynamics does make the whole program worthless.
Let’s suppose that I have a mini-climate model that is supposed to predict the climate of Boston. Since it is nonlinear, the results will depend on the initial conditions. If I enter today’s noon temperature as 40 F and run it forward for a year, it might predict 39 F. Since I know there are errors in the temperature measurement, I enter initial temperatures of 39 F and 41 F. The one year predictions for them turn out to 50 F and 27F. This confirms what is known about nonlinear systems, it’s not possible to make good predictions due to sensitive dependence on initial conditions. However, I can run my model for, say, 100,000 model years and collect information on the average temperature, the average high and low, and the maximum high and low. [1] What I will find with the “simple” nonlinear system is that the statistical properties will be the same for any reasonable range of initial temperatures.
Now suppose that I add pressure, wind speed, and several other variables to my model with all their equations and nonlinear couplings to each other in an attempt to improve my model. Since I know that I can’t predict the future with any accuracy I simply plug in 40 F for today’s temperature and crank away for 100,000 model years and extract all the averages and ranges. The results look like Boston weather, more or less. Just to be sure I restart the model with a temperature of 41 F and repeat the process. But instead of getting Boston weather, it looks much more like the weather in Rio de Janeiro. Uh Oh. Try 39 F. This time it’s the South Pole. Double Uh Oh.
This requires further investigation so I restrict the initial temperature to the range 40 +- 0.1 F and choose a bunch of random temperatures in that interval. The same thing happens. Some initial conditions lead to the climate of Boston, but others produce Rio or the South Pole. Try again but with a really tiny range of +- 0.00001 F and the same thing happens again, there are initial conditions in that range that lead to each of the three different climates. It turns out that no matter how small the range is there is no way of telling whether a particular starting point will lead to the climate of Boston, Rio, or the South Pole. After plotting which point leads to a particular climate, it turns out the initial conditions for Boston live on a fractal, as do those for Rio and the South Pole, and the fractals are intertwined.
So I now have a model in which I not only can’t make predictions of the future with any certainty, the model has multiple futures and there is no way of knowing which future will appear when setting the initial conditions because of the fractal structure.[2]
The net result is that there are two kinds of sensitive dependence on initial conditions in nonlinear systems: (1) predictions of the future are uncertain; (2) there may be multiple mutually exclusive futures and which future will appear is unknown.
Current GCMs have many, many variables. It would be stunning if they didn’t exhibit both uncertainty in their predictions and uncertainty in what the stable climate would be in the distant future. It’s not even clear that they have the computational power to investigate this problem by running the climate models for thousands or millions of model years.
[1] The model has to be run for many model years to get rid of transients and arrive at a stable climate. One usually throws out early years, say the first 10,000 to be sure.
[2] This was first discovered about 1985. Google “fractal basin boundaries” and the names Grebogi, Ott, and Yorke for technical papers with lots of pretty pictures that discuss this phenomenon.
What are the statistical properties of a non-linear climate?
I would imagine that to select statistical choices, one needs to know well the function from which you are selecting. We admit we don’t know the function.
I appreciate your model runs and initial condition considerations. Revealing, thanks.
Reply to Paul Linsay ==> Paul, you’ll have to read Dr. Brown’s comments (rgbatduke) if you want a deep discussion of climate models and chaos. That is above my pay scale as they say.
Bubba ==> There are and have been attempts at making predictions based on stochastic systems and data (think, stock market hourly averages) My simple analogy is that making 100 wrong predictions based on the wrong formulas arriving at 100 wrong answers and then averaging the results….you give me the chances of arriving at a correct prediction.
“However without telling you, they do assume that the statistical properties of the climate can be predicted by the models.”
It isn’t the IPCC that isn’t telling you. It is those who pass around the truncated quote that heads this article. It goes on to sat exactly that:
“In sum, a strategy must recognise what is possible. In climate research and modelling, we should recognise that we are dealing with a coupled non-linear chaotic system, and therefore that the long-term prediction of future climate states is not possible. The most we can expect to achieve is the prediction of the probability distribution of the system’s future possible states by the generation of ensembles of model solutions. This reduces climate change to the discernment of significant differences in the statistics of such ensembles.”
Nick, let me be clear. The ‘statistical probability distribution of such ensembles’ that you conjur cannot be determined from AR5’s meager 107 individual runs from 42 distinct models. Especially under nonlinear dynamic conditions. RGBatduke has railed sufficiently against that sort of nonsense on this thread and elsewhere. Take that up with him (pro wrestling tagteam). Now, if your team could produce, say 10000 simulations and make a Monte Carlo arguement, we mighthave a discussion about statistical sufficiency. But you cannot because of Turing imcomputability, even with AR5 inappropriately large grid scales that force parameterization of essential GCM climate processes like convection cells, which inevitably introduces attribution assumptions (ah, which themselves result in the ever growing model/pause discrepancy). The more the rest of us understand this stuff, the more your team ‘loses’. First rule of Army holes: if in one and want out, stop digging.
Nick, the point of my comment is that in a model as complex as a GCM there are many different “climates” possible, each with its own unique statistical properties, and it’s impossible to predict which one is being modeled since initial conditions arbitrarily close together can lead to wildly different “climates”. R.G. Brown mentioned above that the models do exactly that in his comments at 11:46, confirming what I expected. It’s meaningless to average the statistical properties of these various “climates” together since it does not represent the dynamical properties of the system you are studying. It is as if you averaged the properties of all the planets together and claimed that you understood the solar system.
Ishould have referred to my original comment. Does averaging the climates of Boston, Rio, and the South Pole produce anything meaningful? I’d say no.
Nick
Okay, where is the hard work that starts with the full climate system and shows that there is a subset of effective equations that will predict the ensemble of possible states. This is the same question as has been repeatedly raised by RGB. There needs to be some convincing showing that you can integrate out all of the irrelevant chaotic variables and arrive at the properties of the ensemble. Where is that work?
Almost precisely correct. I’d only add a couple of words. Is there a subset of the effective equations (computed at what there is absolutely no good reason to think is an adequate scale — the scale is determined strictly by the fact that it is the finest scale we can afford to compute at all, not because there is some argument that says “Gee, let’s use 100 x 100 x 1 km x 300 second granularity because we know that will work well for problems of this sort because… (list of reasons)”) that will predict the ensemble of final states accurately, in a way that we can have any statistically justified confidence at all?
What would the answer to that question even look like? This isn’t just a one-off problem compared to the rest of computational fluid dynamics. It is so far beyond the capability of ordinary CFD applied to enormously simple geometries that it isn’t in the same computational universe of solutions. It’s eerily similar to the problems of artificial intelligence, where we have to believe that our intelligence arises out of a functioning neural network but where any attempt to make a neural network that does anything but simple classification problems that bear no real resemblance to mentation fail miserably because we have no idea how to design a neural net with the right internal structure to give rise to the complex phenomena of actual intelligence, we can at best get some behavior that “looks intelligent” compared to random chance. People generally do better with AI with deterministic or stochastic rules based systems because we can make some sense of the “quasiparticles”, the persistent structures of decision making and stimulus-response. The planet’s climate is in many ways similar to the “thought” of a living organism and is just as difficult to predict. I’ve often thought about building a planetary neural network and training it to predict the climate, but neural networks suffer from the same problem of extrapolation as any other model — they do well at modelling observed behavior that in any reasonable way interpolates the past training data, and get increasingly unreliable when they are used for inputs far beyond the inputs used to train them. They also look for “easy” solutions that may be wrong at the expense of correct but more complex solutions.
The only way I can think of of validating climate models is by (gasp) comparing them to the real world. Sadly, when we do their output fails in many ways quite aside from their failure to predict anything like a reliable future temperature! Indeed, that’s one of the least of their problems — to be expected in a chaotic turbulent nonlinear highly multivariate dynamical system. It is things like the wrong spectrum of correlation times, the wrong dynamical variance per run that people should be worried about.
It’s always fun to post figure 9.8a of AR5:
http://www.phy.duke.edu/~rgb/Figure9.8.jpg
People miss the forest for the trees when they look at the “spaghetti” in this graph. This spaghetti isn’t even individual runs. They are results from all the CMIP5 models. Note the variance! Let me say that again: NOTE THE VARIANCE! The models are running peak to peak variances around whatever their “mean” behavior is supposed to be that are between two and four times larger than the actual variations of the real climate! There’s one classic example over near 1890 — a red trace that varies by around 1 C over a single year! Down and then right back up!
Say what? this behavior has never been observed in any part of the climate record. It is absurd. No reasonable solution to the climate problem can exhibit behavior like this and be taken seriously. It is badly broken.
Why is this model still in the ensemble?
Yet this behavior is visible in many colors across the entire record. In fact, the only place it isn’t visible is (surprise surprise) in the reference interval where the models magicall see to settle down to having only twice the expected variance and with fewer of the bizarre peaks.
The problem is especially visible post the reference period. The models all vastly overestimated the response to Pinatubo (by roughly a factor of 3). It’s not clear if they are responding at all to the super ENSO of 1997-1998 or if they are just both warming and rebounding from the too-deep dip they gave to Pinatubo. Warming seems most likely because they continue to sweep up at an almost unchanged rate across the entire Pause, where they don’t just get the mean temperature wrong, they are getting the variance wrong by at least a factor of five.
The models in this graph have:
a) Absurd, non-physical variance across almost all of the record. This variance cannot be written off to chaos — these are deterministic local models and if they don’t get the right variance, then from the fluctuation-dissipation theorem they have the wrong dissipative dynamics, end of story (since gettting the dissipative dynamics right is the name of the game here).
b) Absurd, incorrect autocorrelation times. It isn’t just the magnitude of the swings, it is their spectrum, which appears to me to eyeball out just plain wrong compared to the actual climate. Here 165 years is admittedly a short span to be sure as the autocorrelation time of the actual climate appears to range from ballpark 5 years to whatever and obviously getting an accurate spectral decomposition on longer times is increasingly problematic, but it looks to me like there is already a problem from 1 to 10 years for many of the models that is within the resolution of the data.
c) The wrong MME mean over climactically significant parts of the record. This isn’t surprising, as the MME mean has no physically or statistically justifiable meaning, especially when one leaves egregiously incorrect physical models in it contributing on an equal basis with models that are actually getting some of the stuff above much more nearly right.
d) And finally — wait for it — post 2000 it very much appears as though the actual climate is pulling right on out of the ensemble envelope itself. Which in statistical parlance means — since nature isn’t broken, it is nature — that it is very, very unlikely that the statistical ensemble of models is in fact a good representation of the actual dynamics of the climate.
Taken all together, I think that the probability that the CMIP5 models collectively represent the climate in a statistically meaningful way is well under 0.001. If one looks at individual models, one might find that a subset of them — perhaps less than 1/3 of them — are not individually rejectable as having the wrong dynamics via fluctuation dissipation or absurdly incorrect mean behavior. If you redo the average with the successful models, something like 2/3 of the predicted warming will disappear — and we will still have no particularly good reason to think that those models are within a country mile of having the right dynamics, especially dynamics that can be integrated 100 years into the future to give a meaningful answer there.
rgb
RGB: “… If you redo the average with the successful models, something like 2/3 of the predicted warming will disappear — and we will still have no particularly good reason to think that those models are within a country mile of having the right dynamics.”
And thank the roll of the dice that they didn’t by pure accident get a good fit earlier on or we would already have shut down fossil fuels, been taxed to death and they could claim the pause was due to their quick action to save the planet. It would take to the end of most our lifetimes to make the discovery that the projections and the theory are lacking.
It’s sort of maths.
If a person sets off in the morning and walks up a reasonably sized mountain then spends the night at the summit and walks down the same path.
The statement is that he will at some place be at the same place at the same time as he was the day before.
Because send a person walking up the mountain following exactly that person’s footsteps from the day before at some place they will meet and it will be the same time.
The inevitability of that has always bothered me.
I’m not sure if there is anything there. because that is another day, everything has changed.
In concept that might happen, but it won’t because everything has changed 🙂
“…we should recognise that we are dealing with a coupled nonlinear chaotic system, and therefore that the long-term prediction of future climate states is not possible.”
That doesn’t matter if we can predict statistical summaries (functionals of distributions in mathematics) such as mean, variance, median and other quantiles. We can not predict when the next heartbeat will occur, but we can show that mean heart rate is reliably related to drugs, body weight, and exercise routine. No one can predict the exact airflow over a wing and wing tip, but engineers can model realistically and accurately the wing lift and drag as a function of velocity and air density. The Earth mean temperature has increased about 0.9C since about 1880; we do not need to know the exact evolution of wind and temperature in each small region of the Earth, we need to know whether, and if so by how much, that increase has been caused by the accumulation of CO2 in the atmosphere; and whether reducing CO2 will change the future and if so by how much. There is an apparent 950 year period in the global mean temperature over the last 11,500 years; we do not need to know next year’s mean temperature and rainfall in Tallahassee, FL or Karachi, PK, we need to know whether that apparent periodicity is the result of a persistent and reliable physical process that we can study.
One can’t predict statistical summaries of unknown functions, but I take and appreciate your point to be that is all distraction form a focus on the CO2 villain (or champion). Of course, they preselected CO2 to focus upon and I believe it an excellent choice for its additional capacity to distract focus.
Bubba Cow: Consider another example: Romps et al calculated that a 1C increase in global mean temperature would cause a 12% (+/- 5%) increase in the cloud-to-ground lightning strike rate in the US east of the Rockies. Right or wrong, the result does not depend on the ability to predict from a model where and when the lightning strikes will occur.
I disagree. Earth’s climate is not an airplane wing or a human heart. The whole point of this article is that chaotically-coupled systems are not predictable, statistically or otherwise. Read rgbatduke’s comment:
“…the state of the ocean alone could completely alter the pattern of chaotic attractors and cause the planet’s climate state to jump to almost anything quite independent of what CO_2 is doing. We don’t even have a good grip on the feedbacks involved.”
As an electrical engineer, I know that a circuit with multiple positive and negative feedbacks can, and most likely will, respond completely unpredictably to a given input.
Reply to Eustace Cranch ==> Thanks for the Electrical Engineer input. To eliminate this problem, we used to use breadboards 🙂
The human heart analogy is especially interesting, given that many forms of heart failure and death are signalled by period doubling as a route to chaotic defibrillation:
http://www.scholarpedia.org/article/Cardiac_arrhythmia
The heart can beat perfectly normally in a young person with no apparent sign of heart disease, and then go into a malignant rhythm almost without warning because of things that in another “identical” person or even the same person on a different day might not have. Some people, sometimes, react to cocaine that way (see e.g. Len Bias and the cause of his death, even though many people have had just as much cocaine and not had a fatal arrhythmia, quite possibly including Bias himself on earlier occasions — one can hardly argue that he was not enormously cardiovascularly fit but died anyway — from chaos).
As for airplane wings — are you serious? Do you have any idea how delicate and carefully the design of the entire airfoil has to be when one passes certain critical thresholds, such as the speed of sound? But even then planes sometimes just rip apart in midair “for no reason”. Why? Probably because at certain thresholds a malignant period doubling route to chaos exists in the turbulence that kicks it from being spectrally predictable and ignorable to where it creates (suddenly) huge overpressures as certain fluctuations are amplified instead of being damped. In smooth air, those fluctuations are rare and the plane is “safe”. But in the wrong kind of turbulent air, the plane gets positive feedback and those fluctuations can grow and do annoying things like strip a section of your wing or pop your tail off. The whole supersonic transition is even worse — as you approach the speed of sound the character of the dynamics changes and lift changes and drag changes and bluff surfaces facing forward become so unstable that they can easily tear the plane apart in a fraction of a second. Read a book about the quest for supersonic flight and all of the disasters that occurred in world war II as airplanes inadvertently got close to it and discovered that their control surfaces no longer functioned and they could not pull out of a dive, or their tails fell off trying. Supersonic aircraft are shaped the way they are for a carefully computed and empirically verified reason, because I very much doubt that any airplane manufacturer would bet the lives of pilots and passengers on an airplane design that had never had empirical verification in a wind tunnel no matter how brilliant it was on the computer…
rgb
Eustace Cranch: The whole point of this article is that chaotically-coupled systems are not predictable, statistically or otherwise. Read rgbatduke’s comment:
That “whole point” was the very point that I was disputing. Their are lots of examples in dynamical systems theory and its applications in which statistical summaries have been computed. Let me repeat the Romps et al example: they may be right or wrong that a 1C increase in global mean temp will produce a 12% +/-5% increase in lightning frequency, but the chaotic nature of either climate in general or lightning generation in particular is relevant to the argument, and there is no necessity to predict exactly when and where lightning discharges occur.
rgbatduke: Supersonic aircraft are shaped the way they are for a carefully computed and empirically verified reason, because I very much doubt that any airplane manufacturer would bet the lives of pilots and passengers on an airplane design that had never had empirical verification in a wind tunnel no matter how brilliant it was on the computer…
I think you missed my point: much useful information can be acquired about chaotic systems despite the fact that we can not predict their time courses exactly. Of course the “knowledge” must be “tested” before we can refer to it as “knowledge” — did I say different? But the unpredictability of specific trajectories does not imply that useful models of summaries (total lift, effectiveness of heart medication) are impossible. Nothing you wrote in response to my comment supports the main thesis of the leading post.
Sure, but precisely why do you think you can believe the models more than you can believe the simple, actually computable, physical estimate of ~1 C warming per doubling of CO_2?
Also, given the enormous range of results obtained from the models, why do you think that the mean of this range is physically meaningful, even if we could assume (which we cannot) that it is possible to solve the problem at all at the current granularity?
Finally, you assert a 0.9 C increase “since 1890” as a given fact, without (as usual) giving even the acknowledged error bars. In the case of HadCRUT4 the acknowledged error in the vicinity of 1890 is around 0.3 C. In the year 2014 it is around 0.2 C. Ignoring the fact that this is batshit crazy absurd, the 0.9 C you cite is uncertain to at least 0.5 C, and that is the acknowledged possible error, and does not include any UHI correction (which should be a strictly cooling bias that HadCRUT4 does not account for, although they eagerly enough include a whole pile of “corrections” that produce more warming).
Our knowledge of the rise is therefore rather uncertain. Perhaps it is enough to state conclusively that it has gotten warmer, but we don’t know by how much. It is pretty certain that it hasn’t gotten any warmer since 1890 in the state of North Carolina, where I happen to live. The linear temperature trend for well over a century of NC data is flat as a pancake (that is, it goes up, it goes down, but there is zero trend). This is a bit difficult to understand or explain in terms of CO_2, since well-mixed CO_2 should warm the entire planet. It should at the very least be keeping NC winter nights warmer than they otherwise would have been. But there is no trend, certainly nothing like the 0.9 C you assert for the entire planet taken as a whole.
I agree that we “need to know” many of these things, but that my need to know something is no guarantee that it is possible to build a model that will tell me what I need to know, or that data exists that will tell me what I need to know either. A model built to replace the missing data really, truly isn’t guaranteeed to tell me what I need to know. All it will do is tell me whatever the model tells me, not what reality actually was, and without the “reality check” the model could be completely wrong and no matter how badly I need to, I’d never know it.
rgb
Finally, you assert a 0.9 C increase “since 1890″ as a given fact, without (as usual) giving even the acknowledged error bars. In the case of HadCRUT4 the acknowledged error in the vicinity of 1890 is around 0.3 C. In the year 2014 it is around 0.2 C. Ignoring the fact that this is batshit crazy absurd, the 0.9 C you cite is uncertain to at least 0.5 C,
No dispute from me on that score, but one post can not address every issue in sufficient detail for all without being infinite in length. With an uncertainty of 0.5C one accepts that the true value could exceed 1.4C with non-negligible probability. The important thing going forward is that we are now collecting better data for use in future decades. I have criticized what I have called “exaggerated” predictions of future warming elsewhere.
Meanwhile, Next Dec in central Missouri will have a higher mean temp than next July in central Missouri. It would be nice to know whether either mean will increase in response to increased CO2 (or has increased in response to increased CO2), but we do not need to be able to predict the temp at any place, or date, or time in order to have a model adequate to the purpose. We do not now have such an adequate model, but we know enough about mid-Missouri climate to get a car that has a heater (that will sound absurd, but I did once meet a man from Belize who bought a car without a heater, and then drove from NY to CA in March), or carry warm clothing if we plan to take long hikes on December and January Sunday mornings.
mrm: Next Dec in central Missouri will have a higher mean temp than next July in central Missouri.
oops. That was backwards.
To me, the article lacked a certain amount of clarity about the differences between systems that are: linear, non-linear and chaotic.
A linear system obeys the law of superposition and is time invariant. This implies that the transfer characteristic will pass through zero. That is zero in will be zero out. The transfer characteristic will aways be a straight line. This implies that there is more to a linear system than just varying the output in sympathy with the input. Non-linear systems can do that. Basically, the concept of linearity is just a simplification that permits some mathematical analysis.
The guitar distortion referred to can be caused by limiting the possible output range of the system. However, the process is well-defined and repeatable. A chaotic system may be predictable but only if you know all the initial conditions exactly. You may well need to be more exact than most computers can easily simulate and you cannot guarantee to even have a complete list of all the relevant initial conditions.
I would also be stronger about the “vanishingly small” number of linear systems. There are no linear systems in real life. The best we can expect is that a system can be considered linear over a small range.
For instance, the most linear electronic component I can think of is the humble resistor. It follows Ohm’s Law over a small range but there could come a time when you apply too much voltage and the device will fail. At this point, both its linearity and its time invariance will have failed. Even before that point, the resistor will heat up and increase its resistance. The plot of voltage against current, the transfer characteristic, will then become curved.
Reply to graphicconception ==> Yes, that is one of the many definitions for linear systems. We are introducing a topic, and I offer Lorenz’s simple definitions of linear and nonlinear. Lorenz uses the characteristic of proportionality of input to output as his defining point.
“Vanishingly small” covers the chance that someone could come up with a real world natural dynamic system that is linear at all possible values.
“Lorenz uses the characteristic of proportionality of input to output as his defining point.” Superposition is a better basis IMHO. Otherwise you won’t be able to explain how you can input a square wave to an amplifier and not get a square wave out yet the system is still working within its linear range.
If you decompose the input signal into its Fourier components, each component can have its own transfer characteristic slope. They don’t necessarily have the same one.
As for “… linear at all possible values” that list will include infinity. Real world systems cannot cope with that. That is why I say there are none.
@ graphicconception. Its in the details. The essay states that Lorenz used “Linear system: A system in which alterations of an initial state will result in proportional alterations in any subsequent state.” Which of course is a very different statement than Kip uses above.
I believe that that the definition that Lorenz use is kind of correct for a system without inputs. The one that Kip used above is of course completely wrong though.
The superposition principle is probably the best one to use and is the one most often used.
A linear system doesn’t need to be time invariant by the way.
The IPCC has long recognized that the climate system is 1) nonlinear and therefore, 2) chaotic. Unfortunately, few of those dealing in climate science – professional and citizen scientists alike – seem to grasp what this really means
This statement is a lilttle presumptious and probably incorrect. Kip. Damages légérement your argument.
Reply to Stephen Richards ==> Read the comments — you’ll see that my statement is correct. There are a few here that have a good grasp on the subject matter — but not that many.
So you really believe that all non-linear systems are chaotic? I am not sure if anyone here has a good grasp of the subject matter and that includes you.
I agree with the coupled and non-linear aspects of climate, not so sure about whether or not chaos is relevant. Turbulence is chaotic and affects aircraft and plumbing systems, but both are adequately predictable. I’d say it was more the coupled and non-linear aspects that make the climate unpredictable, simply because most of the many variables are unknown functions of many of the other variables.
Reply to climanrecon ==> The very nature of the atmosphere that troubles man, and makes the most differences to our everyday lives, are based on the turbulent, the chaotic — thunderstorms, hurricanes, tornadoes, downdrafts, unexpected sudden shifts in the jet stream…..endless list.
It is the IPCC that says “the long-term prediction of future climate states is not possible.”
climanrecon
March 15, 2015 at 12:28 pm
“Turbulence is chaotic and affects aircraft and plumbing systems, but both are adequately predictable. ”
Parametrized simplifications of known wing geometries can be sufficiently well modeled. The real happenings cannot to this day, otherwise we would have long stopped using real wind channels. Because of the microscopic origins and rapid developments of turbulences (amplifying distortions, which is the essence and origin of chaos).
Great article for the discussion generated. The part of Alan’s blog that’s so refreshing is actual science gets discussed in the comments section. Bravo
The climate seems chaotic, because it depends on changing conditions of space. Many of them can not predict. However DEPENDING exist.
Kip,
I would have said just a little more about linear solution spaces before making the jump to nonlinear ones. The point being that the *solutions themselves* don’t have to look like straight lines for linearity to be present (in the sense we wish to discuss it). For example, suppose that both sin(t) and e^t are solutions to some linear model. Then A sin(t) + B e^t is also a solution, for any values of A and B. I.e. if you saw the system behave like sin(t) in one circumstance, and saw the same system behaving like e^t in another circumstance, you could very easily imagine a new circumstance in which the system would behave a little like both — you could predict the existence of a third circumstance in which it would behave like A sin(t) + B e^t. Your ability to make this kind of linear extrapolation is what goes out the window when your system is nonlinear.
I don’t mean to lecture you, as you are doing a very important service, and I’m sure you know more about nonlinear systems than I do. I only want to make the simple conceptual point that we’re not just talking about *solutions that look like a line.*
Reply to Metric ==> Of course, there are always deeper nuances — linear can be curved as well. Proportionality of outputs to inputs is Lorenz’s key. This is, as explained, a kindergarten introduction 🙂
I bring it up because I can see the following frustrating situation happening. A reader comes away with the impression that “climate modeling is likely to be inaccurate because the modelers are applying a linear model to a nonlinear system.” Then they go and look at a climate model prediction and see something that is definitely not a straight line and think “oh, that criticism must be outdated — they are clearly not just doing linear extrapolations anymore.”
Reply to Metric ==> At some point, we hope that readers can, well….read…. and that giving definitions will help them.
I had trouble finding an example from a homemakers life that would produce a linear, but curved, graph that they would be familiar with.
Thanks for the help.
[Solubility of salt in water, and sugar in water as temperature goes up. .mod]
Thanks again .mod!
Also every harmonic oscillator in existence. A simple harmonic oscillator produces those solutions that are so superimposable because the equation of motion is a linear, second order, ordinary differential equation. When things get nasty/chaotic is when you add a nonlinear driving term and/or when you make the ODE itself nonlinear (which just means that it has terms in it that are powers of the solution or derivatives of powers of the solution being sought with the power in question not being “1”).

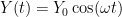
 ,
,  , and the right initial conditions. A pure harmonic solution.

 are completely general nonlinear functions of
  . Here one obviously has enormous problems right out of the bat. For one thing, demonstrating that bounded nontrivial solutions exist at all for a given
  combination is a prior chore — there is no reason to think that they will and it is easy to find combinations where they won’t. Indeed, it is probably correct to say that for nearly all combinations they won’t, but this isn’t my own mathematical forte so don’t quote me on that one as an expert.
 are themselves nontrivial functions of t and/or Y and not constants. Things get more complicated but are still linear in 2 and 3 D as well — but I’m not going to do an essay on elliptical PDEs at this particular moment. When you put a function of t in place of the 0 on the right you get inhomogeneous versions of the ODEs and a whole new solution methodology is required, searching for particular solutions to the inhomogeneous equation and adding them to solutions to the associatedc homogeneous equation to get a general solution to an initial value problem. The point is that if one takes an equation like:

 you will get nice, tame, linearized motion where the oscillator eventually oscillates pretty much at frequency
  . Then you’ll hit a regime where you see a double oscillation in steady state. Tweak and there are four oscillation ampltudes in steady state. Tweak and tweak and the system is suddenly chaotic, unpredictable, aperiodic, where teensy changes in the initial conditions lead you to final states that fill the entire phase space of energetically allowable states after the transients have died out.
is the general second order linear homogeneous ODE. Its general solutions are exponentials. For some ranges of A, B and C those solutions are real exponentials. For others they are complex exponentials. Certain linear combinations of complex exponentials are the trig functions cosine or sine. Hence a solution might look like:
for
A general nonlinear second order homogeneous ODE cannot be written down sensibly as there are an infinite number of them. Something like:
might do it, where
This is the way the mathematics of this stuff looks. Nearly all 1-D equations of motion in physics can be put into a form “like” the first equation where superposition works, even when
which describes a rigid pendulum being driven by harmonic driving torque with an arbitrary amplitude and frequency, for some values of the parameters
There are two or three other “classical” simple chaotic oscillators. I have code written for octave/matlab to demonstrate rigid penduli, or there is the double pendulum that is chaotic all on its own, or there is the “Bender bouncer” — an ordinary harmonically driven linear oscillator but with a nonlinear “‘reflection plane” where the mass “bounces” elastically and instantly reverses its momentum. I used to have code for it, and probably still do. The amazing thing is that even thought the systems are or can be quite different, the advent of chaos is the same. Period doubling to chaos, over and over again. Even in finite difference systems instead of ODE solutions, even in iterated maps. Chaos itself is not unstructured and has namable forms and similarities and patterns, at least until its close cousin complexity gets ahold of it and you have (maybe) chaos in N dimensions where N is not a small number. Hard to know exactly what you have in N dimensions.
rgb
I like your writing style.
Reminds me of reading Martin Gardner.
A question I hope you will answer in the next chapter: in a chaotic climate system like Earth, in which there is a new hypothetical man-made warming component being added to the mix (and that is the only change in conditions from before), then maybe the non-linearity of the system will make it impossible to accurately model, but does that mean it is impossible to even make some general conclusions about what will happen? i.e., can we at least say it is likely that the temperature is going to go up (at some unknown rate)? Or is it possible that the temperature could go down?
And how does the discussion of chaos affect the concept of “tipping points”?
Reply to TBraunlich ==> Thank you for the compliment. Martin’s readers of my generation miss him greatly.
I can not answer your question, neither now nor in the next chapter. Why? We simply do not know enough about how the Earth’s climate system works to make even general conclusions at the scale you ask for — will temperatures go up or down? We do not, for instance, know that “there is a new hypothetical man-made warming component being added to the mix (and that is the only change in conditions from before)”. The sun (responsible for the warmth or the Earth, is also changeable. Land use, forest growth and clearing, row farming or pastures, city building, is changeable. Cosmic rays are changeable and unpredictable. Without knowing the system itself, to some pragmatic level of accuracy, we will not be able to make predictions about the future.
“Tipping Points” are theoretical points at which a system will shift from one regime to another, or from one stable state to another stable state. Ice Ages and Inter-glacials are thought of as semi-stable states of Earth’s climate systems, based on past “experience”. Mostly “tipping points” are being used today as scare tactics in the political debate about atmospheric CO2 concentrations.
Linear behavior, in real dynamic systems, is almost always only valid over a small operational range
============
this is fundamental for bikes, cars, boats, planes. All type of vehicles. They have a stability envelop in which their behavior is near linear. Outside that envelope the behavior is non-linear. Thus, what one must master when learning to drive is to keep the vehicle inside the near linear envelop.
predictable systems can be thought of as having a single attractor. A planet orbiting a star is predictable. However, when you add a third body the system becomes chaotic, except in the case where all 3 bodies lie in the same plane.
Chaotic doesn’t mean unpredictable, but it does mean unpredictable for all practical purposes. Given infinite precision and infinite time, you can predict a chaotic system.
Reply to ferdberple ==> Yes and Yes — think of a child learning to ride a bike — pedaling fast enough to get the bike up to speed, while steering close enough to straight, will get the bike on that stable “Look at me Mom, I’d riding a bike!” point.
Thanks, Kip Hansen.
Excellent essay, I will wait for more.
Good essay, Mr. Hansen. I learned about linear functions way back when some where still trying to disprove Ohm’s Law. (Opppppsss,,,showing my age). As a PS….do you consider logarithmic functions as linear or non-linear, or is this discussed in later parts? As for chaotic….sheesh. Sometimes just waking up is chaotic!
Reply to justthinkin ==> I like the pragmatism of Lorenz’s defintion in which one can count on the output being proportional to changes in the input. As you know, graphing a logarithmic on a log scale is linear — a straight line.
Sadly, not a good answer. Linear refers to the ordinary differential equations being solved (or linearity in the difference equations or iterated map equations). Nonlinear ODEs are everything else. See my discussion, with examples, above.
rgb
Enter entropy into the discussion and see where the reality of the climate models end up.
And to Janice and Pamela….there is nothing more chaotic then a rational, logical mind trying to get a FACT across to a “believer”.
Thanks for that. I didn’t expect to follow it, but it was very clear!
Two trivial points, from my own subject.
Ohms law is not actually relevant to the potentiometer example. It’s just confusing ornamentation here. The current and resistance don’t affect the point you make.
And, P = V²2R? (The “2” should be a / . P is V squared OVER R)!
I thought you’d want to know. Typos easily hide in equations.
Cheers,
Zaphod.
Reply to Zaphod ==> Hmmm — I thought this was my Ohm’s Law quote ” As we turn the knob, the voltage increases or decreases in a direct and predictable proportion, following Ohm’s Law, V = IR, where V is the voltage, R the resistance, and I the current flow.”
Ah, found it, you are referring to “voltage and power in a resistor: P = V²2R” — I think you are right, something in the conversion superscripts and subscripts has fouled me up in this quote.
Let me get it right, you are saying it is correctly Power = Voltage squared over Resistance
Right?
[Current = I = Volts/Resistance
Power = I^2 x Resistance = V^2/R = I x V, but only for DC currents.
For AC currents you have to add in the reactance losses and phase changes.
Those are not imaginary losses, but are calculated using imaginary numbers (sq root of -1) ! .mod]
Thanks .mod!
Does this mean that outputs are usually less and never more than a linear view of the inputs would expect? I assume that waste exists, but not a free lunch.
There are two important implications of Chaos theory for this debate that are missed in this article and elsewhere, yet both were well covered by Lorenz.
The first is that it is the non-linearity of the system that often explains its stability.
This is well explained historically (and by one of the sources to this article, Ian Stewart) in the problem of the stability of the solar system. What if it gets a little bump? What about the complex influence of the other revolving planets? Newton solved the problem with the hand of God. Poincare investigated it with the 3-body problem and therein some of the beginnings of the investigation of non-linear systems. This is not equilibrium, not homeostasis, but stable disequilibrium. We do not require equilibrium for stability – this should be a great relief! Nor do we require predictability. This should be obvious with the common usage of the weather/climate distinction.
Even if the precise condition (weather) of a strange attractor at any time is entirely unpredictable by its condition at a previous time, still it is stable, within its range, against perturbation. Yes, there are tipping points, and the degree of perturbation required to push the system over can vary depending on the condition at the time. But, for the solar system, such a perturbation is very unlikely. And even if we do not fully understand the non-linearity of the system under investigation, the longevity of a system in an environment is empirical evidence of its stability. The solar system has been around for a long time and has taken a lot of knocks. Likewise, the amazing stability of the global atmosphere and the climate in terms of such parameters as temperature.
It is an interesting historical fact of this scare that the ‘tipping point’ is emphasized on the alarmist side (Wallace Broecker has a lot to answer for), but also the ‘untamed’ on the skeptic side (surely this is refuted by the old response that we may not be able to predict what the weather will be like on a particular day next summer, but, eg, with our knowledge of ENSO, we may be able to tell you something about the general climatic trend…due to some predictable linearity in the system). A similar emphasis evolved in the Gaia hypothesis. In the mid-70s Lovelock used it to explain and emphasis the stability of the atmosphere in states of disequilibrium — the hypothesis is biospheric self-regulation of a physical system on the analogy of biological systems (eg a cellular organism).
The other important implication relates to the butterfly effect, and what is seen as its teaching of the ‘sensitivity to initial conditions.’ Actually, this understanding of what is going on is very limited. The root problem is about representation of a continuous system in a discrete system. It has deep philosophical implications to do with the very idea of representation of experience. This is often explained historically with Laplace’s idea that the project of science is to strive to represent the world in a model so as to deliver its perfect predictability. Chaos theory declared Laplace’s project over. The teaching for this scare is this: with the collapse of the empirical science of ‘detection’ in the mid-1990s, and so the resort entirely to theoretical modelling (go look at the transition in the work of Barnett, Wigley, Santer etc), we have entered a realm of SiFi. What is truly remarkable historically is how this SiFi is broadly seen across an educated public as continuous with the empirical science from which it evolved.
Extinctions periods are infrequent on Earth, which proves the stability of the system. Life is fragile.
Reply to berniel ==> Yes, of course, one of the attributes of nonlinear systems is the subject called “strange attractors” or sometimes just “:attractors”. In the kindergarten-level May Island squirrel population example above, we see a nonlinear system that is stable at just above 0.6 of the carrying capacity, As long as we don’t change the growth rate, the system settles down at that value — very stable. In fact, there is a whole range of growth rates that produce stable values near 0.6.
Ordinary biology insists that the squirrel population should grow to approximate the carrying capacity — should grow to or close to 1. It does not in our example, and it does not in the real world.
Thank you for bringing up these points, quite valid, but beyond the introductory level of this essay.
Nice to see the subject introduced to give all a feeling for the insoluble problems that chaotic systems create and to make clear, we’re not talking about something rare. I don’t think nonlinearity is the right term, though. Chaotic systems follow neither linear nor nonlinear functions. For forecasting, there is little help to be gotten from any ‘species’ of math once removed from short term linear (or even nonlinear) approximations. Chaos itself would appear to be in a category all its own.
For climate and I’m sure basically all dynamical systems, we have to go with what we do know for long term changes. We do know that chaotic systems have surprisingly neat geometrical expressions – Kip’s classical paired reflected ‘jelly roll’ pattern with two centres (attractors) which seem to be out of bounds for the mad function of chaos. Moreover, the jellyrolls ‘circles’ are of a dimension, finely spaced, the outermost trace of each seeming to be the outer limit for the trace of the function as far as you take it. The space between coils is probably a function of the error of rounding in a parameter or variable. Finally (?) the traces appear to be confined to two planes in the jellyroll case. This is knowing a lot. It would be fun to see what ‘shapes’ we get in functions by rounding off the value of pi in them as we must with a few million iterations of it . Start with two decimal places and then more. Such studies of chaos are more akin to descriptive studies of biological species behavior.
Now climate’s ‘jellyrolls’ are shaped by two attractors, cold and warm and the outer bounds are +/- 5 degrees C as long as the sun is at least roughly constant. Certainly with presently known orbital dynamics, we have the limits of how much energy is being put in and the there must also be a limit to how much it is possible to “magnify” the surface heat on a water planet or how fast we can remove the heat from the system based on this received energy. The detailed weather is a problem beyond a week or so, but I think we can make somewhat confident prognostications from what we know, that we are more likely heading toward another ice age, hopefully far enough into our future to give us time to adapt or head somewhere else for some of us. We are happily being presented with an excellent opportunity for gathering solid data on the likelihood of runaway climate from CO2. Surely another 10 years of no warming will trim CO2’s effect down to insignificant and we can rely on evidence of net negative feedbacks.
The two centers are not attractors. The object itself is the attractor. And it only has this appearance when looked at from just the right angle. Given the right set of parameters and a starting value ‘close’ to the attractor this shape will result over many iterations. It is infinite in length and non-intersecting, which mean non-repeating. What chaotic means is that if you move the starting point a tiny bit (in any direction), the resulting locations after a few thousand iterations will be far apart, but not predictably far apart. And the same change in a different direction will not lead to a predictable result based on the other change. That is sensitive dependence on initial conditions. It also means that tiny errors can be magnified over time (the butterfly effect). There are patterns in chaotic behavior, but they are unusual – hence ‘strange attractor’ – not a point or group of points, but an infinite line, and the ones I have seen were bounded.
This is the kind of article that makes me keep coming back to WUWT over and over again.
Forgive me for making a comment outside of those constraints and maybe off topic.
One of the great things about WUWT is that there are so many contributors that not only know what they are talking about but they are not attempting to deceive. Honesty is refreshing.
(Carry on.)
The discussion in the article and comments is quite interesting. However, some of it gives the impression that linear systems are always approximate desciptions of the real world and in some sense unimportant. Of course, quantum mechanics and quantum field theory are important and they are, as far as we know, perfectly linear. That said, the implications of non linearity for climate predictions are very important. The modelers seem to acknowledge that they cannot predict weather on the 1 month to 10 year scale. Somehow, they think that they can deduce the basic trends on the 10 to 100 year scale. Why do they believe this? Does it have any justification by for example renormalization theory? Can one lump many of the parameters together on the long term?
“Why do they believe this? ”
Their income depends on it.
Reply to Jim Rose ==> “…quantum mechanics and quantum field theory are important and they are, as far as we know, perfectly linear.”
I’d like some quantum physicists to weight in on this idea. Is Mr. Rose’s statement literally true? Or are the equations for the theories linearized out of necessity or for convenience?
I’m a quantum physicist. Quantum mechanics appears to be perfectly linear. I.E. any sum of valid states results in another valid state. In fact, hypothetical nonlinearities in the state space allow some really crazy stuff to happen that seems like it shouldn’t be possible.
However, the time evolution of certain QFT’s is nonlinear, particularly QCD, causing no end of calculational frustrations when applied at low energy when the nonlinearities are biggest.
Metric thanks for the correction. I guess I am starting to show my age — I was thinking of QED. Its still linear isn’t it?
I suppose I should elaborate on my previous statement just a bit. There are a couple different ways you might think about linearity in QM, and it’s easy to get them confused. Let’s describe the state of 1 particle at position A and 0 particles at position B as |1,0>. Similarly, 0 particles at A and 1 particle at B would be |0,1>, and 1 particle at A and 1 particle at B would be |1,1>. Note that |0,1> + |1,0> IS NOT the same as |1,1> — it has a very different interpretation.
Let the time evolution operator be called U.
Now, when people say “quantum mechanics appears to be ABSOLUTELY linear” they mean the following:
If |0,1> and |1,0> are valid states, then so is A |0,1> + B |1,0>. Also, the time evolution of (A |0,1> + B |1,0>) is U(A |0,1> + B |1,0>) = A U |0,1> + B U|1,0>. This is the part that appears to be completely true, to the best of the knowledge of mankind (with people constantly looking for exceptions that would earn them a Nobel Prize).
However, when people say time evolution is nonlinear, they could mean a few subtly different things: They might mean that U|1,1> cannot be regarded as independent operations on the first particle and the second particle seperately — U has to know about both particles to give the right time evolution. This would be the case, for example, if the two particles are charged and applying forces on one another. They also might mean that the interaction force itself is non-linear — this would correspond to the case (as in QCD) where the force-carrying particles (gluons in QCD) also carry their own charges, and thus the exchange of a single force-mediating particle (representing a single “bump” of force) cannot be treated independently from a bunch of other charge interactions.
To Jim Rose:
You’re absolutely right in the sense described above — the state space is linear for every quantum theory we know of. QED is also said to be “linear” in the sense that the force-mediating particles involved (photons) don’t carry a charge, and thus photons can come and go without adding additional computational nightmares to a system of charges you are trying to understand (though, as you mentioned in your first post, renormalization adds yet another layer to the story). QCD is still linear in the state-space sense of the word, but is no longer linear in the force-interaction sense of the word — the mere act of a force occurring between two particles in QCD means that additional charge is introduced and must be taken into account, leading to an infinite series of equally-important terms that make calculating anything “tricky” to say the least, or “horrendous” to be more blunt.
Why do they believe this?
=================
The arguments that climate is predictable revolve around the central limit theorem, the law of large numbers, and the normal distribution.
Many people are familiar with the law of large numbers, and assume that it holds for climate. While a coin toss isn’t predictable in the short term, in the long term it should even out 50-50. However, this doesn’t work for climate. the law of large numbers works when the system under study has a constant average and deviation. like a coin or a pair of dice. this can be readily shown from the paleo records to be false for climate. the law of large numbers doesn’t apply to climate.
The central limit theorem is a more general case of the law of large numbers, and it tells us that if we sample climate randomly we should get a normal distribution. the normal distribution is quite important, because it allows us to make all sorts of statistical predictions using mathematics developed originally to try and beat the casinos. unfortunately the central limit theorem doesn’t apply for a power series distribution such as climate.
when one looks at climate it becomes apparent that temperature for example is a fractal distribution. When you look at a temperature graph, unless the scale is written underneath, you cannot tell if you are looking at 10’s, hundreds, thousands, or millions of years. When you compare this to a coin toss, you immediately see the difference. The coin toss smooths out the longer the time. Climate doesn’t.
It is the fractal distribution in climate that makes it unpredictable at scale, because we currently lack the mathematics to deal statistically with fractals. Much the same time as chaos theory, they give us a view into infinity we did not suspect existed.
http://en.wikipedia.org/wiki/Benoit_Mandelbrot#/media/File:Mandel_zoom_08_satellite_antenna.jpg
“While in the short term a coin toss isn’t predictable in the long term it should be”. The word “should” is the key word here, because in reality it isn’t. The evidence for this are the many gamblers recording the statistical anomalies on Red, Black, Odd, Even, 1-18 and 19-36 of a roulette table and betting on the option that is at 45% over thousands of spins.
The paradox is that the wheel has no memory of what it did before and the long term trend is meaningless even in this simple “coin toss” scenario. The bank accounts of the people who believe otherwise stand testament to this.
It is of course the number zero that, also paradoxically, does give the house a long term advantage. My understanding of the warmists augment is that the IR absorbtion qualities give their climate models a “house edge”. An extra input that skews the odds in favour of warming over the long term.
Reply to wickedwenchfan ==> In my experience with gamblers, it is their “magical thinking” that gives the House the edge — the “zero” and “double zero” only change the odds. I have a brother who spent years working out a “scientific system” to win at blackjack. It was real and gave him a something <1% advantage — a real statistical advantage but one that could not be taken advantage of — as the gambler can not and will not mechanically follow a system, he always gets and follows a hunch. In the normal course of play, such a small advantage leads to one losing his stake long before his advantage appears as a reality in his pile of chips.
I did know one successful gambler — I was counseling him on personal ethics. I couldn't for the life of me figure out how he managed to not only survive, but get wealthy as a professional poker player in the casinos (not like today's Professional Gambler circuit). I finally got it, "It's simple," he says "I cheat."
This gets a bit beyond my math ability, but if I understand the concept, a non-linear system need not be chaotic, but any two or more coupled non-linear systems cannot be non-chaotic. Like the three body problem. Is that correct?
No. The critical part is that a feedback must amplify distortions, i.e. shift state information to the left over system iterations (when encoding the state vector of the system as a digital representation). You can have nonlinear feedback systems that dampen disturbances, those will not show chaotic behaviour.
Thanks
It might not be possible to answer my query. I took one stats class about 25 years ago while in business school. By the second or third lecture, I realized how terribly deficient my education had been for lack of real statistics training. Alas and alack, I didn’t have the time to take more, and now it’s been quite a while since even that one class.
I’ve read Doug Keenan’s criticism of the IPCC reports, and my ignorance both forthrightly admitted and (I think) notwithstanding, it struck me as powerful and possibly even definitive. However, the rebuttals seemed to criticize Keenan for being over-linear (?) in his analysis. Can anyone here with the gift of clarity and the patience to deal with an intelligent yet sadly ignorant non-specialist post about how chaos and linearity might validate or invalidate Keenan’s work?
If you do it, please go slowly and minimize the jargon (or at least define your terms). Ignorance isn’t stupidity; with some help, I’ll get it. The alternatives are either not to ask or to pretend I know what I don’t know. Thanks in advance.
Reply to Jake J ==> I am not familiar with Keenan’s work. Perhaps one of our reader’s more involved in the issue can help you here.
from 2013 –
http://wattsupwiththat.com/2013/10/30/statistical-analyses-of-surface-temperatures-in-the-ipcc-fifth-assessment-report/
Guest essay by Douglas J. Keenan with link to his full critique (pdf)
I haven’t been all the way through it yet, but could help Jake J.
I will go through it . . .
I’ve read Keenan’s stuff, and the rebuttals. I’m trying to figure out where this article fits in. I’m just not well versed enough to know, hence my request of others here. This is a high-quality site, and I figured someone would know.
Kip, a couple links if you want to read Keenan. His stuff was some of the first anti-AGW stuff I found when I decided to re-examine the issue last year. Definitely got my attention, because it looked like he demolished the IPCC. But I always want to read both sides of an argument; this one’s hard if you’re not well versed in stats.
http://www.informath.org/media/a41.htm
http://quantpalaeo.wordpress.com/2013/05/28/testing-doug-keenans-methods/
Reply to Bubba Cow and Jake ==> Thanks for the links.
Thanks, Kip. I realize you have lots of fish to fry. You might not have the time to lead my “over the hills and through the woods to grandmother’s house.” If anyone else can, I’d be genuinely grateful.
Both the chaoticity and the complexity of the climate system argue strongly that the central equation of the current climate paradigm is not true. This is the uber-linear claim that changes in surface temperature are a linear function of changes in forcing. In particular, the temperature change is said to be the change in forcing times an imaginary constant called the “climate sensitivity”, as simple a linear relationship as one can imagine.
I have never seen any reason, either practical, observational, or theoretical, to believe that temperature is a linear function of forcing.
w.
Reply to willis ==> “I have never seen any reason, either practical, observational, or theoretical, to believe that temperature is a linear function of forcing.”
….and nor are you likely to ever see such reasons. And, yes yes and yes, it is the chaotic and the complexity of the Climate System that tells us that such a relationship does not, can not, exist.
Locally, temperature is a function of input heat (and loss) in a manner that might be appropriately linear. But what if the forcing itself is nonlinear / chaotic?
Exactly. It bothers my last living brain cell to see a climate anything graph with a linear trend. The temperature average is not linear, over time the so called average (falsely referred to by some as normal) is nonlinear.
Willis, I completely agree. Temperature rise is not the force. Especially not on the scale that warmists adhere to. Why? Because the oceanic/atmospheric conditions that lead to temperature changes are powerful entities. The energy available to drive these powerful entities this way or that just is not there in the tiny amount of temperature increase realized by additional anthropogenic CO2, thus additional anthropogenic water vapor, added to the atmosphere.
Kerry is a doofus!
…and ‘warrenlb’ might be an alias.
Thanks Kip. Doing great. I realize that you’re planning on moving into climate later and I appreciate that. Sorry I was unavailable a ways back when you were leading a discussion on accuracy, errors . . . Hope we’ll get back to that.
Still I think it may be useful to include a very general sense of data into the function discussion and a bit on the business of going beyond (and even within) the boundaries of your function –
Regardless of the function, assuming it is known (that’s a very big assumption), the information (data) we deal with are scores for that function that are measured, adjusted or modeled and that are also generally time series forms or from some other incremental variable.
There is a delta period between each datum and the next and perhaps some frequency with which the data are produced.
There have been aggressive efforts to both extrapolate and interpolate from those data. The extrapolation bit is guessing the future, of course, and completely questionable for anything including climate prediction or hind casting. Think that if you gain 10 pounds, you’ll be an inch taller.
But there have also been extremely dubious “predictions” with interpolation. Some have claimed this can produce greater “accuracy” within the data which, I recall, they were calling downscaling. No matter how you connect the consecutive dots (lines, swirls), there is no data between those dots – only a range of guesses – but no real information.
As an example that downscalers were actually trying to pull off –
Taking time series weather imagery from (I can’t remember exactly where this was in the US) say Boston and New York City and downscaling that to show what must have been the weather in Hartford. In the data, there simply is no Hartford.
So we not only have to deal with whatever math functions, but also keep a clear eye on the ball. Even if you have the right function, it takes great care to interpret those data and we have already seen many imaginative efforts to make interpretations, which usually have agendas.
Kip,
Perhaps you will appreciate what I recently wrote on a different thread.
* * * * *
Have you ever played with the logistic equation using a spreadsheet? It’s absolutely fascinating that such a simple device can produce so much interesting complexity. If you haven’t done so, I highly recommend it. (It’s awesome to share the experience with young people!)
In particular, the input points that produce intermittency are a marvel. The output graph will display rhythmic patterns that give way to chaos, and then back to rhythmic … great stuff.
I think those infected with climate rabies would do well to take a shot of the logistic equation to at least ease the symptom of frothing.
Reply to Max Photon ==> Yes, of course, that’s how one cuts one’s teeth in Chaos Theory!
Excel is a terrific tool for repeating (copy and paste down a column) the iterative formula. I use ploy.ly online plotting service to make the graphs, uploading the excel files from by machine.
More on this in the next installment.
Kip wrote:
Oh that takes me back! I would wait for eons for the tiniest portions of Julia sets to print. It was SO EXCITING to see even a little bit of ‘roughness’ appear on the paper.
It’s somewhere between sad and comical that Mandelbrot four-wheel-drove over Gaston Julia (and Pierre Fatou) to stake his claim on fractals. It’s kind of like Gore’s discovering the internet.
except gore discovered the internet only 5 years ago
Two books I would enthusiastically add to the reading list are:
The Art of Modeling Dynamic Systems: Forecasting for Chaos, Randomness and Determinism
http://www.amazon.com/The-Art-Modeling-Dynamic-Systems/dp/0486462951
and
The Self-Made Tapestry: Pattern Formation in Nature
http://www.amazon.com/Self-Made-Tapestry-Pattern-Formation-Nature/dp/0198502443/ref=sr_1_1?s=books&ie=UTF8&qid=1426455838&sr=1-1&keywords=the+self+made+tapestry
Max, have not read either. Homework accepted.
They are two of my favorite books.
Chaos knows not even itself, let alone that the universe exist due to chaos’s outputs.
Man kinds input into chaos is to small to measure by any means let alone man kinds puny input into the mix by driving a car to work.
One of the strangest things with the article is that it seems to be an introduction about chaotic dynamical systems but it doesn’t even say what a dynamical system is and all examples except some plots are about (static) functions.
I would also say that the view that seems to be implied is not very correct. Non linearity doesn’t imply chaos or any problem with simulating the system. The large dependence on initial conditions that is an important concept in regard to chaos depends on the stability of the system and not on the linearity.
The article just seems to look at same systems with chaotic behavior, incorrectly claims that all non linear systems are chaotic so that people should draw the conclusion that the behavior shown is true for all non linear systems.
Chaos, and chaos theory, were invented to explain the behavior of computer simulations.
You might be correct but that doesn’t say anything about all systems that can be simulated without any problems or do you believe that non linear systems like a rocket or a car can’t be simulated with good accuracy?
Reply to Raymond ==> Authors have to assume some level of common understanding or we would have to write dictionaries instead of essays. I quote the Wiki definition of dynamical systems above here.
Of course, my examples are themselves dynamical systems — population dynamics, etc.
Again, don’t let it escape you that many others seem to understand perfectly well what is being discussed here — which might lead to the realization that there is something here to learn. It is no shame not to be familiar with this topic — if everyone understood all this, I wouldn’t have written the essay. Your viewpoint is like that of most of the science world prior to the 1960s. They just couldn’t believe that these phenomena actually existed and were not just errors.
Beginning around then, the world of mathematics began to actively discover that the highly unusual behaviors they witnessed in their physical experiments were not caused by experimental errors or by bad lab equipment, but were, in fact, real results that could be found in the mathematics of their nonlinear functions.
The story of this discovery, which has changed science forever, is details in Gleick’s book: CHAOS Making A new Science. (see reading list). Highly recommended.
A brilliant validation of this is found in the Cushing et al paper linked in the essay.
Strange, I am an engineer with a PhD with my expertize in linear and non-linear dynamical systems. I simulate non linear dynamical systems daily and have taken many courses about dynamical systems and numerical methods after the sixties. The strange thing is that this revolution from the sixties that you talk about don’t really seems to have the implications that you say they have. I have also read Gleick by the way.
So what are your formal knowledge about the topic when you seems to easily believe that I am wrong?
“Authors have to assume some level of common understanding or we would have to write dictionaries instead of essays.”
So you assume that people understand what a dynamical system is but you write an essays about linearity and non-linearity? I doubt that many people that know about dynamical systems don’t understand what a non-linear dynamical system is.
Based on the comments I would also say that many people don’t seem to grasp the meaning of a dynamical system.
“Again, don’t let it escape you that many others seem to understand perfectly well what is being discussed here — which might lead to the realization that there is something here to learn.”
I would rather say that it doesn’t seem that many people seem to understand what is discussed here.
“It is no shame not to be familiar with this topic — if everyone understood all this, I wouldn’t have written the essay.”
Why do you come up with such condensing drivel instead of actually answering the points I have made in my posts?
Do you really believe that all non linear dynamical systems are chaotic?
Do you really believe that all non linear dynamical systems are difficult to simulate and analys?
The trouble with you Raymond, with respect, is that yes, as an engineer you will have had to deal with and model many non linear systems that are not chaotic.
So have I myself. In fact as practising engineers we go to enormous lengths to keep our systems linear, or if we can’t arrange that, at least keep them out of chaotic regions. One designs a car to get to journey’s end, not fly into a thousand pieces at the first corner.
However that is a straw man relative to the arguments presented here: that the general case of a non linear dynamic system is that if it does exist in nature, its probably chaotic. Linear and non chaotic non-linear systems are very much the minority in Nature, but of course, because engineers seek predictability, they are the rule in most engineering.
If we were to design a stable climate, we certainly wouldn’t start from here…
“However that is a straw man relative to the arguments presented here: that the general case of a non linear dynamic system is that if it does exist in nature, its probably chaotic. Linear and non chaotic non-linear systems are very much the minority in Nature”
Interesting, I guess that you have some references for that claim? I really doubt that it is the case.
“The trouble with you Raymond, with respect, is that yes, as an engineer you will have had to deal with and model many non linear systems that are not chaotic.”
Why is that a problem with me? I read an essay written by Kip Hansen and found some quite obvious errors in the essay and some very strange things and have pointed out those. My comments have mostly been ignored by the author for same reasons even though I wanted to discuss them. Why?
My comments have definitely not been a strawman to the arguments presented in the essay but they might be a strawman against your view or what you think you should have been included in the essay or something like that. I don’t know because I cant read minds.
The first sentence in the essay is incorrect and at many places in the essay is he using non linear when it is incorrect and chaotic would be at least a little better. The view about non-linear systems in the essay is just strange or incorrect but if he wanted to talk about a certain class of systems he should have written that.
Good post, As an engineer, I already understand this, but your explication is good for the general reader. Well done.
An engineer is someone who understands the perversity of inanimate matter.
Reply to Robert of Ottawa ==> In my advancing years I take a self-formulated medication called “Damnital” — which bears on the label:
“Take one tablet as needed for Frustration and Peevishness brought on by old age and the perversity of others”.
As an engineer, you might try it to treat frustration caused by ” the perversity of inanimate matter.”
(The bottle contains white TicTacs as a placebo…but I don’t let myself know that.)
>@ Mr. Hansen….”As you know, graphing a logarithmic on a log scale is linear — a straight line.”
Yes…but the climate is not linear, so why do climate “scientists” insist on doing it, even when they don’t know the temp vs CO2 IS logarithmic. Of course graphing a log on a log scale is linear. But why do climate scientists insist on trying to graph linear and log together? Or am I missing something?
Reply to Justthinkin ==> No, you didn’t miss anything. They also draw linear trends on nonlinear results.
Heh….Point taken. Can’t wait for the next installment.
Good post thanks Kip. I hope you address in your next post the issue of how the bounds of the chaotic system are influenced by the configuration parameters and the “chunking” of the parameters.
Climate, when viewed on a short time scale, we call “weather” and weather is famously chaotic (i.e. the butterfly effect), but within bounds. Climate on a longer time scale we call “seasons” and is I suspect less chaotic and even more bounded. Climate on a very long time scale seems to have a couple of strong attractors (e.g. ice age or warm period) but I have no idea how chaotic it is.
When a control system is superimposed on a nonlinear dynamical system it can reduce or eliminate the chaos at some time-scales. The critical question is: what environmental factors is Earth’s control system sensitive to (e.g. subsea thermal venting, increasing CO2) and how large do those factors have to be to “break” the control system and cause climate change?
Reply to Michael ==> If I could answer your final question, I would win the Nobel Prize (they might just give me Al Gore’s).
I suppose you’re right. Do that please and congrats in advance on the Nobel ! 🙂
Ah, hm. Mr. Petschauer?
1. We’re not supposed to discuss CO2 and climate … yet (author’s request).
2. (this, in spite of #1) to at least alert other readers to investigate your claims before believing them)
In short: “You gotta lotta ‘splainin’ to do.” (but, not on this thread)
Your comment is a mixture of truth (“negative feedback from increased clouds and ocean evaporation will more than offset the positive feedback {of whatever causes it — NO causation by CO2 has yet been shown: none}”)
and a lot of
unsupported conjecture, some of which (“The surface temperature change from CO2 will be approximately linear with CO2 content.”) even flies in the face of observed evidence (18 years worth, now…).
For Pete’s sake, Petshauer,
CO2 UP. WARMING STOPPED.
(why do you think Trenberth et. al. so desperately seek heat in the deep oceans?)
Janice, did you ever think of becoming a trial attorney? You just won your case.
Why, Rud Istvan, how kind of you to say so!
To answer your question: yes — many, many, many (sigh), times.
lol, I would only win if I could manage to pick a jury full of Rud Istvans. Defense attorneys do their best to keep engineers and the like off the jury. Oh-I-just-wonder-why… .
#(:))
Janice Moore is right.
As Janice points out, the 18+ years of no global warming is dismissed with a wave of the hand.
But global warming has stopped, as CO2 continues to rise. That used to cause immense consternation among alarmists like Pteschauer, but no more. Now, they just hand-wave and pretend it didn’t happen.
Anything, except admit that their original conjecture has been demolished by Planet Earth.
Re: air turbulence and the MAGNIFICENT engineers who design air planes…
They have done a wonderful job of dealing with turbulence. A plane operates in an acceptably wide margin of safety thanks to those engineers.
They cannot with ANY confidence predict when that turbulence will occur and how great it will be.
In other words, you grossly mischaracterized Mr. Hansen’s point.
With respect Janice we CAN predict when turbulence occurs, and more or less how great it will be. Its critically related to viscosity and velocity.
What we cant predict is exactly what the effect will be at any given time at any given point.
Turbulent airflow is however something that lurks in regions that are clearly marked in red in the pilots manual.
Aeronautical engineers have to deal with it as an every day part of what they do, a huge amount of which is dedicated to making sure its kept to a minimum and never gets to dominate the aircraft’s behaviour, because if it does , nearly all bets are off.
That is really a total red herring though – a trail left by a pedant up-thread. Because where climate is concerned the proposition is that it IS dominated by ‘turbulent behaviour’ at some level or other.
If you are a creationist, you might argue that God, being a perfect Engineer, wouldn’t build in chaotic response within climate.
However as a practising engineer, I think God has made a p*ss-poor job of designing anything.
Incidentally, IIRC viscosity, which gives rise to turbulence, is the thing that actually makes flight possible.
Thank you, Mr. Smith, for writing to educate me about air turbulence. Yes, I realized I overstated that part of my comment after I clicked “Post Comment” and just left it. I was wrong. Glad you corrected me. I do, though, stand by my point that the high confidence Mr. Petschauer places in his ability to predict atmospheric phenomena with high accuracy being misplaced.
I think God did a wonderful job of designing your brain… .
What do you think? 😉
“…. confidence ….
beingis misplaced.” (I changed “about” to “that” and didn’t make the other change!!). Yes, just for you, Mr. Smith, just for you.My time as a croupier has wonderful memories of mathematicians losing all their money on roulette. The sad part was watching them continue to come back, day after day, week after week, month after month, year after year, tweaking their “models” trying to crack the system.
I am starting to see climatologists in the same light
So far, v. a v. the system called “earth,” “CO2 can effect” is unproven, unsupported, fizzle.
“coupled nonlinear chaotic system”
Think two females, one divorced, one never married, one very young, one middle aged.
And four cats.
Now predict the moods of each one of the women, their location in the house and the activity they are currently involved in and add in what the cats are up to and where they are.
There will be patterns of activity and location and long term repeating events but no predictability by any logical means can be determined.
Reply to jakee308 ==> I hope you’re not an academic at some fancy college — professors get fired for making jokes that can “seem” misogynist to those with fertile and grasping imaginations. You might also get sanctioned by Cat Lovers of America.
[The mods wish to ensure that no cats, nor women, randomly populating any two-story houses used in this example, were harmed in the making of this example of catastrophic (er, chaotic) behavior. .mod]
Making a joke about women isn’t misogynistic (or at least shouldn’t be considered so) but I understand your point.
Also, I wasn’t going for “catastrophic behavior”, I was going for “Non-Linear Chaotic System” and gave a overly simplistic example from real life.
Sorry if the gender of my example obfuscated my intent.
It’s certainly possible that many such examples of human systems of interaction appear from the outside to be chaotic but seem quite rational and work quite well to those within that system.
Are you implying that cats are moody, or that women are catty?
“jakee308
March 15, 2015 at 4:05 pm
“coupled nonlinear chaotic system””
Living in a flat with three women? That was nonliner and chaotic quite regularly.
The first two graphs and another one further along do not represent linear systems or they are mis-plotted.
Look at the times 2 graph. for 2=0 it looks like the line intercepts the vertical axis at about the value of 1.
I am sure you did not mean to say 2×0 =1.
Reply to Leonard Lane ==> Good eyes! It is, however, simply an oddity of the online plotting tool I use, plot.ly.
I will be careful to include an unnecessary “0” value in each graph to eliminate this odd artifact. I will, in effect, include a 2×0=0 so that the program is forced to graph the zero point correctly.
Hopefully, like this:
Well…image embedding doesn’t really work. Try looking here: https://plot.ly/~KipHansen/172
Reply to Richard Petschauer and Janice ==> Airplanes. No engineer that designed airplanes would let anyone fly a design, even test pilots, that had not thoroughly and repeatedly passed air tunnel tests. It is in the air tunnel where all the hopefully avoided turbulence caused by the nonlinearities of fluid flow dynamics itself jumps out and shakes the airframe to pieces. CFD (computational fluid dynamics) software does its best to keep all the values within the linear regime….but because the basic natural world dynamical system (fluid flow) itself is nonlinear, some of these points are unknowable in advance. Even once tested in the wind tunnel and the problems found there are removed, some experimental designs break up in the air.
If I knew and could prove the answer to this question: “How much warming will CO2 really cause? ” I would claim Al Gore’s Nobel Prize.
Mr. Hansen! Why, in your reply just above, did you lump me in with PETSCHAUER? I was trying to support you in my replies to him. Aaaack. Was my writing that bad??
btw: Thank you for all your thoughtful, thorough, and prompt responses on this thread — wish ALL post authors would emulate you!
#(:))
Reply to Janice ==> My reply was to you both–to the comment thread–because you both mentioned airplane design. That’s all.
I have appreciated your support here this evening — well aware of it. Thank you.
I hope Petschauer wasn’t likewise offended!
Well, lol, Mr. Hansen, Petschauer may have BEEN offended at being mentioned in the same sentence with me, however…
HE needed refuting/educating!
Thanks for your kind response to me.
#(:))
I think there is confusion in this thread about linear vs non-linear functions, smooth vs non-smooth functions, and the behaviors of iterated functions.
I would like to see the word ‘coupled’ defined in the context of the subject of this post, which I believe is either climate or climate models. I have yet to see a definition throughout my 5 years of research on the subject of climate science.
I have come across the definition in a book I am studying called ‘The Finite Element Method, Volume 1, The Basis, 5th edition, 708 pages, 26% read’. Which seemed to indicate that two separate materials with different mathematical equations for each that are part of the whole system under study make a ‘coupled’ system. Is that what ‘coupled’ means in our discussions here?
Reply to garymount ==> Good question, not part of this essay, which is an intro into linearity and nonlinearity.
Stay tuned for future episodes.
Ok, I have peeked ahead in my book and using this thing I found at the tail end of the book labeled ‘Subject Index’ I have been able to discover a definition of ‘coupled’. Here is what I found:
“Coupled problems – definition and classification
Frequently two or more physical systems interact with each other, with the independent solution of any one system being impossible without simultaneous solution of the others. Such systems are known as coupled and of course such coupling may be weak or strong depending on the degree of interaction.
“An obvious ‘coupled’ problem is that of dynamic fluid-structure interaction. Here neither the fluid nor the structural system can be solved independently of the other due to the unknown interface forces.
“A definition of coupled systems may be generalized to include a wide range of problems and their numerical discretization as: ^1
“Coupled systems and formulations are those applicable to those applicable to multiple domains and dependent variable which usually (but not always) describe different physical phenomena and in which
(a) neither domain can be solved while separated from the other;
(b) neither set of dependent variables can be explicitly eliminated at the differential equation level.
1. O.C. Zienkiewicz. Coupled problems and their numerical solution. In Numerical Methods in Coupled Systems (EDS E.W. Lewis, P. Bettie and E. Hinton(, pp.65-68, John Wiley and Sons, Chichester, 1984.
Reply to garymount ==> Nicely done. Thank you for doing the research and reporting back to the readers here. Very thorough.
A coupled dynamical system is a system where the change of one state depends on the other states, i.e.the system of differential equations for the system are not diagonal.
Gary, why so complicated? Here is some short information on coupled dynamical systems
http://www.maths.surrey.ac.uk/explore/vithyaspages/coupled.html
“Why so complicated?”
Because I get paid by the LOC (Lines of Code) that I write 😉
Reference:
“In the PBS documentary Triumph of the Nerds, Microsoft executive Steve Ballmer criticized the use of counting lines of code:
In IBM there’s a religion in software that says you have to count K-LOCs, and a K-LOC is a thousand line of code. How big a project is it? Oh, it’s sort of a 10K-LOC project. This is a 20K-LOCer. And this is 50K-LOCs. And IBM wanted to sort of make it the religion about how we got paid. How much money we made off OS/2, how much they did. How many K-LOCs did you do? And we kept trying to convince them – hey, if we have – a developer’s got a good idea and he can get something done in 4K-LOCs instead of 20K-LOCs, should we make less money? Because he’s made something smaller and faster, less K-LOC. K-LOCs, K-LOCs, that’s the methodology. Ugh! Anyway, that always makes my back just crinkle up at the thought of the whole thing.
“
==>Max…explain please…”I think there is confusion in this thread about linear vs non-linear functions, smooth vs non-smooth functions, and the behaviors of iterated functions.”
TKS
“From the analysis in this paper, since air passing over an airliner can be turbulent (brilliant), we can’t trust the engineers who design them” Wow! I don’t see any mention of aircraft aerodynamics. We better call Boeing…they need to know about those engineers. lol
“Planes might take off some days, but not others.” Yep…without a pilot those darn airplanes just don’t seem to take off!
Chaos is aperiodic, long-term behavior in a deterministic system that exhibits sensitive dependence on initial conditions
— Strogatz, Nonlinear Dynamics and Chaos
It seems like a good example of a chaotic process is the distribution of prime numbers.
Chaos is logically a property associated with a process that is incompletely or insufficiently characterized and unwieldy. A de facto condition that creates an insurmountable envelope for natural and enhanced human perception. This is presumably the motivation for invention of the scientific method that established a frame-based constraint in both time and space, and separate but intersecting scientific (i.e. deduction) and philosophical (i.e. inference) domains.
Reply to n.n ==> See reading list (to which this would be a good addition)…. not all agree with Strogatz’s defintion, it it would exclude common chaotic behaviors such as period doubling (which we get a hint of in the Population Dynamics example in the essay). Not only do chaotic dynamic systems exhibit periods, period doubling, breaks into chaos (per Strogatz’s defintion), but the areas of chaos break back into periodic behaviors and then return to chaos.
The common example of this will be presented in my next essay. (You can see it in this image.
Period doublings/bifurcations as a symptom of chaos are more common in finely descretized systems (faucet drip per second) than in coarser descretized systems (squirrels per year). Is an artifice of the time resolution, not the underlying system dynamics. Just math.
Reply to Rud ==> Did you read the Cushing et all (1998) paper? They claim to find period doubling and strange attractors in lab experiments with living flour beetle cultures — which belies the point “Is an artifice of the time resolution, not the underlying system dynamics.” (I think!) Take a look at it and let me know how it seems to you.
I misrepresented the character of the quote. Strogatz describes that definition as the greatest common denominator of the different perspectives capable of reaching a consensus.
My perspective is that chaotic systems are comprised of indefinite, semi-stable periods where statistical inference and forecasts become momentarily valid. They are analogous to the scientific domain where accuracy is inversely proportionate to the product of time and space offsets from an established reference. In fact, the variable scope of the scientific domain is established by the constraints imposed by chaotic processes.
The most common example of a chaotic system is a human being, which has a global source: “conception”, a global sink: “death”, and an evolutionary (i.e. chaotic) transition.
A chaotic process is a complex, piecewise continuous, nonlinear function comprised of piecewise linear or perhaps closely bounded segments, that cannot be represented or estimated with a known distribution function, other than over indefinite spans.
“…nonlinear chaotic system, and therefore that the long-term prediction of future climate states is not possible.”
This is quite incorrect. Turbulence is a chaotic system but it is quite predictable. If it wasn’t, aeroplanes would not be able to fly. Navier-Stokes allows us to predict in even greater detail the effects of chaotic fluid flows. The difficulty is that Navier-Stokes is so complex, it can only be solved for very simple systems. The magnitude of difficulty in solving true climate models using Navier-Stokes (such true models don’t exist) is so complex, that they will NEVER be solved, even with finite element methods on the largest computers imaginable.
Reply to Tony ==> I would suggest that turbulence is not predictable — one might be able to predict its occurrence above certain levels of some input but not the results of the turbulence — see a discussion above on airplane designs and why they use wind tunnels. There are many that claim the Navier-Stokes in reality is nonlinear and that we use only a linearized version of its reality.
==> Max….darn. Sorry forgot to add this quote…” Because things are the way they are, things will not stay the way the are”…Bertolt Brecht.
That’s a simple harmonic notion.
I’ve been on here a few weeks now and I can see contributors are wanting to know the outcome of studies in a truthful presentation.
Here is my cartoon contribution to Sunday Funny … and nonlinear dynamics.
http://www.maxphoton.com/straight-talk-on-art/
Was it intended that this discussion should become chaotic?
Reply to bones ==> No, but with nonlinear discussions, one can never be sure of the outcome.
+1
The quote attribution is wrong. It’s from the third assessment report. §14.2.2.2
“In climate research and modelling, we should recognise that we are dealing with a coupled non-linear chaotic system, and therefore that the long-term prediction of future climate states is not possible. The most we can expect to achieve is the prediction of the probability distribution of the system’s future possible states by the generation of ensembles of model solutions”
Reply to Seth ==> I believe you are right — it should be TAR. Thank you for the correction
It is in Chapter 14, titled “Advancing Our Understanding”, Executive Summary:
First I’ll take my “Damnital” and then FWIW mention that back in college in the late 60’s, a Prof told us ‘He that solves for turbulence, solves for weather’. Unstated of course was the fact that the unknowns and unknowables was a bridge too far. I suspect that is still largely the case. (I’m an engineer BTW, and worked with/on airfoils for years.)
6. In nonlinear systems, even infinitesimal changes in input can have unexpectedly large changes in the results – in numeric values, sign and behavior.
Almost everywhere in government i have worked people are taught the exact opposite. And that is one of the problems with government, especially when it comes to the natural sciences.
Very nice introduction!
Earnestly waiting for the next!
Hi Kip and thank you for your article,
Sorry I did not have time to read all your work and the comments.
I do have a question concerning your Take Home point 3:
“3. Nearly all real world dynamical systems are nonlinear, exceptions are vanishingly rare.”
Background:
In 2008 I demonstrated a close relationship between global average atmospheric CO2 and global average temperature:
“The rate of change with time (t) dCO2/dt varies ~contemporaneously with temperature T.”
The paper and spreadsheet are located at
http://icecap.us/index.php/go/joes-blog/carbon_dioxide_in_not_the_primary_cause_of_global_warming_the_future_can_no/
For detrended data, the relationship is (I think – I’ve been up for about 20 hours)
dCO2/dt (in ppm/year) ~= 4T (where T is the global average temperature anomaly in degrees C)
You can check this yourself by viewing Figure 2 in the spreadsheet of my icecap paper.
So my question is:
Is this one of those vanishingly rare exceptions to point 3 – is this a linear dynamical system in the real world?
I suggest it is a pretty big system, since natural CO2 flux dwarfs human CO2 emissions.
[Because of this relationship, CO2 lags temperature by about 9 months in the modern data record, which has serious implications to current global warming dogma.]
[Detrending the data raises some questions, but I suggest these can be set aside, since I am not claiming that temperature is the only driver of atmospheric CO2, etc.]
Comments welcomed.
Regards, Allan
Reply to Allen ==> First, refer to the comment above by Willis E and my response.
I will read your 2008 paper when I get a chance, but shooting from the hip I would say that it is highly unlikely that there exists a linear relationship between a single environmental change (one input of very many) and the resulting surface temperature of the Earth due to the combined effects of the climate system being both “chaotic” (in the Chaos Theory sense) and “complex” (in the Complexity Theory sense).
As an aside, I find the CO2 concentration graph interesting in its almost perfect long-term linearity. Weird is how I would put it.
Hi Kip,
To be clear, I am saying that Temperature (among other factors) drives CO2 much more than CO2 drives Temperature.
The annual rate of change dCO2/dt (detrended, in ppm/year) ~= 4T (Temperature anomaly, in degrees C).
Thus CO2 lags surface and tropospheric temperatures by about 9 months.
Natural CO2 flux dwarfs humanmade CO2 emissions. Some parties say that the observed increase in atmospheric CO2 concentrations is primarily natural – I suggest the jury is still out on this question, and fossil fuel combustion, clearing and burning of rainforests and other land use changes do contribute – how much is the question.
See also this January 2013 paper from Norwegian researchers:
The Phase Relation between Atmospheric Carbon Dioxide and Global Temperature
Global and Planetary Change
Volume 100, January 2013, Pages 51–69
by Ole Humluma, Kjell Stordahlc, Jan-Erik Solheimd
http://www.sciencedirect.com/science/article/pii/S0921818112001658
Highlights
– Changes in global atmospheric CO2 are lagging 11–12 months behind changes in global sea surface temperature.
– Changes in global atmospheric CO2 are lagging 9.5–10 months behind changes in global air surface temperature.
– Changes in global atmospheric CO2 are lagging about 9 months behind changes in global lower troposphere temperature.
– Changes in ocean temperatures explain a substantial part of the observed changes in atmospheric CO2 since January 1980.
– Changes in atmospheric CO2 are not tracking changes in human emissions.
See also Murry Salby’s address in Hamburg 2013:
Anyone here who thinks they can calculate exactly where a (real) pendulum bob will be in space at any specific point time following release to swing needs to study up on the fundamentals of chaos theory.
I do believe this is possible. I am not sure if it is still there, but in the Science Museum in London, there is a “pendulum” clock, and is quite accurate in fact. I don’t recall the specifics, I’ve not been there since the late 80’s/early 90’s.
Study the subject. You will find it is only possible to calculate an envelope outside of which where the pendulum bob CANNOT be at any particular moment in time. Within the envelope, the pendulum paints a random scatter of position versus time. The shape of that envelope is determined by “the point and time of release” of the pendulum. Has nothing to do with how accurate a pendulum clock may be over an extended period of time. The pendulum demonstration is BASIC to chaos theory!
I say, if it is still there, go see it at the London Science Museum.
Good grief man! The random jitter of pendulums within their chaotic envelopes is repeatedly demonstrated in lab experiments for “chaos 101”. It’s the usual starting point for understanding the random behavior of non-linear systems and the mathematics of chaos!
I have a problem with the definition of linearity you are using: “Linear system: A system in which alterations of an initial state will result in proportional alterations in any subsequent state.”
Is a radioactive decay a linear system? If you start with a twice the amount of stuff, you will have twice the amount of stuff after an hour, a year, a half-life, or seven half-lives.
Curious George
No. Not true.
Isotopes are either stable, or radioactive.
If it is a stable isotope, the atomic nuclei will not change until modified by an external energy or particle reaction.
If it is radioactive, the nuclei will decay.
If you have enough radioactive nuclei, you can use the immense number of individually un-predictable decay probablities to predict very reliably exactly how much of a sample will have decayed at any moment. (That DOES ASSUME you have enough radioactive nuclei, and at over 10^20 radioactive nuclei per gram of a sample, you can actually use the “theory of big numbers” to actually get reliable results.
That half-life may be milli-seconds. Might be seconds, minutes, or hours. Might be millions of years. But the predictable relationship is always maintained if you have “enough” radioactive nuclei. Now, by the time you get down to 12 or 16 individual nuclei?
No. You don’t have enough to use statistical predictions. But it takes a while to get from 10^23 isotopes down to 10 isotopes.
You are making my point exactly. It is always proportional, 2x.By Edward Lorenz’s definition it is a linear system.
It is a linear system. It is a linear system because it is the solution to a first order, linear, ordinary differential equation. In fact, it is one of the archetypal solutions to a first order, linear, ordinary differential equation. It also satisfies the rule that if A(t) satisfies the ODE and B(t) satisfies the ODE, a A(t) + b B(t) satisfy the ODE for any a and b. Because it is a linear system.
I’ll repeat this, since this is something that was not made at all clear at the beginning. A linear system in anybody’s terms is a dynamical system with a time evolution described by a linear ordinary differential equation. We just don’t like to keep saying a linear (second order homogeneous ordinary differential) system (of differential equations).
I think Kip linked this, but I’ll link it again since clearly nobody read it if he did:
http://en.wikipedia.org/wiki/Nonlinear_system
Note well that the definitions in physics and engineering and mathematics are all the same. I will therefore cite in detail the mathematical definition of nonlinear system in contrast to linear:
I gave explicit examples of this above. Seriously folks, if you want to learn you need to learn that wikipedia is your best friend in math, physics, and most of the sciences (as well as a lot of other non-political stuff). Only when the populace is highly polarized and doesn’t reference matters of simple fact does its content get sketchy. This article in fact has many of the examples discussed above, authoritatively. Linear decay is linear because it solves a linear ODE and its solutions therefore superpose. Harmonic oscillation is linear because it solves a linear ODE and its solutions superpose. Neither of those solutions is a straight line, and in neither case is the “forcing” (to the extent that such a thing can be defined in the case of decay) a linear function of the independent variable.
I don’t quite get the bit of outputs proportional to inputs — that makes no sense at all in a ninth order linear homogeneous ODE — what exactly is an “input” or “output”? There are just solutions. But linearity itself in systems of equations is easy enough to understand, hence courses in “linear algebra” and “linear ODEs” and “linear PDEs” and “linear dynamical systems” and so on, available at any university including one near you…;-)
rgb
rgb, your definition differs from Lorentz’s, and I prefer it. But Kip’s preference should matter most.
Is “chaos” a metaphysical term or an epistemogical term? If it’s metaphysical, the idea contradicts the determinism of the physical world and is nonsense. As an epistemological term, it’s merely another word used to indicate that we are not omniscient. As for “non-linearity,” what does this word mean that is so daunting? We can create non-linear equations that describe many natural phenomena.
The fact is that the climate is “chaotic” only because its processes are far too complicated for us to understand completely and predict.
Isn’t this what it all comes down to?
No, that’s not it. Not exactly. Chaos is in this context a mathematical term of extreme precision, and it is used to describe very simple systems whose output cannot be predicted, not because the equations don’t describe then exactly, nor because the equations are hard to write down, nor because we dont understand them completely, but because the equations themselves may be said to contain enough inherent feedback sufficiently large to create extreme instability, or even catastrophic behaviour.
The physics and mathematics of rolling dice are not complicated, and rolling dice is completely deterministic,.. There is nothing we dont understand about rolling a die. But we cant predict the outcome beyond saying that there is an overwhelming likelihood that it will end up with one of six possible faces on display. But which one is essentially impossible to predict.
Deterministic chaos is epistemological. It doesn’t just reflect a lack of omniscience. It reflects a particularly nasty kind of a lack of omniscience. Often in dynamical systems one can observe a kind of coherence where if one knows the initial conditions only approximately, one loses that knowledge gradually or not at all. The solution is “insensitive” to initial conditions, and solutions started out at nearby initial conditions remain close indefinitely into the future. Chaotic systems exhibit the opposite. No matter how close you start two solutions to the same system, the solutions diverge over time to end up as unknown relative to one another as it is possible to be given the e.g. energy constraints of the system. Knowing one of the solutions then tells you basically nothing about the other, within a very broad range of accessible possibilities.
CAGW is a joke because the hypothetical assumptions are a complete joke.
CAGW’s hypothetical efficacy depends ENTIRELY on a “positive runaway feedback loop” involving an exponential increase in water vapor in response to increased CO2 concentrations, which is NOT being observed in any way shape or form….
Nature HATES runaway feedback loops because once the sum of the feedbacks exceeds 1, the output eventually goes to infinite; aka the Gore Effect where, “..two miles under Earth’s surface, it’s several million degrees.”…..
Conversely, what actually seems to be occurring is that any increase in CO2 forcing is partially offset by an increase in cloud cover, which has a cooling effect, thereby reducing any net CO2 warming effect.
This explains why CAGW model-mean projections are already over 2 standard deviations off from reality, and why there hasn’t been a global warming trend for almost 19 years, despite 30% of all CO2 emissions since 1750 being emitted over just the last 19 years…
In just 5~7 years, the discrepancies between CAGW projections vs. reality could well be over 3 standard deviations, with almost a quarter of a century without a global warming trend, at which point, CAGW will have to be tossed in the trash bin.
Once non-linear reality vs. projections start to exceed 3 standard deviations for a statistically significant duration, the hypothesis can be considered a bust….
We’re getting agonizingly close to meeting those parameters for CAGW disconfirmation.
Even the Met Office have suggested that a return to warming may not be seen before 2030.
I have repeatedly been making the point that we can today already contemplate what that would say about cAGW and model prokections. If the Met Office are correct that there will not be a resumption in warming beforfe 2030 (“In just 5~7 years, the discrepancies between CAGW projections vs. reality could well be over 3 standard deviations, with almost a quarter of a century without a global warming trend”) it shows that cAGW and the models upon which it relies is failed conjecture.
“An automobile accelerator pedal is linear” This is not the best example, at least not these days, and particularly so with the advent of non-mechanical pedal-throttle linkages.
At low openings, the pedal is designed to travel further to open the throttle a fixed amount. This makes low-speed driving in lower gears smoother.
At high openings, the same pedal travel would open the throttle more. This is because at higher speed, principally due to much increased wind resistance, more power is required to accelerate the vehicle a given amount.
The type of car and the engine power characteristics will also have an impact on the pedal/throttle response curve.
One other problem is that the pedal-throtle behavior is in the simplest case just a static function at the input to the non-linear dynamical system called a car. The behavior for the system between pedal to vehicle speed is not a linear system for several reasons but maybe most easily seen by considering the the air resistance depends on the speed squared.
Yes, but also is engine power a simple linear function of fuel/air mixtrure?
Doesn’t the fact that peak power and peak torque not coincide establish that engine performance and efficiency are not simple linear functions of throttle response/deployment.
To rickard, yes probably but I don’t really know anything about the modeling of engines.
Reply to Robin Matyjasek and others ==> My use of the automobile accelerator was very pragmatic and given as “An automobile accelerator pedal is linear (in theory) – the more you push down, the faster the car goes. It has limits and the proportions change as you change gears.” As an example for average joe’s and homemakers, they can understand that “the more you push down, the faster the car goes”.
[ And of course, “It has limits and the proportions change as you change gears. ” ]
Really? You take a non linear system and talk about it as linear with what seems to be only steady state behavior? Ignoring the dynamics and the obvious non linearises in your dynamical systems in an essay about non linear dynamical systems? That really doesn’t make much sense…
Look chaps and chapesses: simmer down!
And review what Kip has said.
1/. Models are used to represent the real world. They are in fact all we have unless you are into transcendental meditation and Gnosis.
2/. There is a class of models – mathematical models – that are deterministic, and whose output displays extreme pseudorandom behaviour to the point where it is essentially unpredictable within enormous limits.
3/. If we are in the game of using models to predict the future – and boy that is what climate science has allegedly had billions poured into it to do – then we had better know if the model that most closely resembles the model we use to represent reality-the-data-set is mathematically chaotic or note.
4/. If we are using the rational materialists model of Reality, we are implicitly subdividing Reality into Objects and Actions connected by an Immutable Causality, and bounded by Natural law. As such all relationships are mathematically describable as time differential equations, and one moment in the aeon is presumed to be the starting conditions for the next moment in that aeon. This is inescapable if you start from rational materialism and want to do normal science.
5/. Ergo introducing metaphysical notions a la Korzybski is a straw man in the context of the discussions of science. In that context we have to assume rational materialism. That the world exists as objects connected in space time by cause and effect. That this is in itself only a working hypothesis – a model if you like – is not denied, but in the context of science that is where we begin.
I am sorry to beat the philosophical drum, but it is hypocritical to use the fact that all models are flawed to dismiss one model that is less flawed in favour of one that is more flawed. Chaos theory is a good usable description of real world phenomena that appear in the rational materialistic worldview, and its better than linear for most phenomena.
What it tells us is that of all the possible ways things can happen, some are so unstable that if, by chance, they did occur, it wouldn’t be for very long. One does not generally see serried ranks of pencils marching down the street balanced on their points, but rolling on their sides into the gutter is not unheard of.
And there we have it. There are classes of systems that represent partial solutions to the theory of All There Is, that are approximately linear, and we have made full and good use of them to define and construct a surprisingly stable and ‘unnatural’ world in which to bring up Greens and Climate Scientists, who wouldn’t after all exist without our efforts to make the world sufficiently ‘unnatural’ that their chances of survival were greater than zero. There are classes of systems that represent partial solutions to the theory of All There Is, that are approximately non-linear, but bounded, and we live within the sheer unpredictability of them relying on faith, or simple pragmatism, to get us through. Lightning may strike me down tomorrow. I cant say, but what can I do? And there are classes of systems that represent partial solutions to the theory of All There Is, that are approximately non-linear, and unbounded, that once they have happened, like Humpty Dumpty, result in worlds that can never be put back together again. We can never go back to the Big Bang and start over any more than anything in the Universe is accurately described by the term Renewable Energy: Nothing is renewable. We surf the wave of entropy from the big bang and once its gone, that’s the end of everything.
Please, when operating in the framework of one metaphysic do not call on the premiss of another to make your point., Its bad logic and smacks of sophistry.
I think you need to look up the difference between affect and effect.
Then you can examine the case for saying that climate is in fact the long term average of weather.
I agree, Leo. A lazy mind can’t spell.
First of all, What Kip is saying – and it echoes what have said here in the past, and it echoes what Robert Brown has said many times much better – is that the proposition that climate is a complex non-linear dynamic systems means but one thing above all others.
Namely that we may not need anything beyond climate itself, to account for climate change.
So CO2 is not needed to explain late 20th century climate change.
Obviously in a real world system CO2 must have some effect on the world. We know it has a small radiative impact. We know it affects ocean acidity very slightly and we know it affects plant growth mightily.
The question is whether or not it can cause runaway global warning or deep and otherwise unachievable climate change – here the evidence of the last billion years or so is almost certainly not. CO2 appears to lag temperature, not lead it. It is an effect of climate change, not a cause, and if it were a cause, then the climate of the past simply wouldn’t have been as stable as it was. In short the climate sensitivity is almost certainly less than unity with respect to analysis of the purely radiative firceing of CO2, that is CO2 probably only makes a fraction of a degree difference for every doubling, which in political and economic and social terms means it is totally and utterly irrelevant, as the climate is dominated by other far more powerful causes and effects.
The skeptical position is challenged on two points by the warmists –
(i) “If it isn’t CO2, what cause late 20th century warming?” Here the answer is ‘largely nothing: Its purely natural feedback in the climate system that gave rise to those fluctuations’
(ii) CO2 must have some effect, dont deny it (not that anyone ever has) so how much effect will it have?” And the answer doesn’t come from chaos theory,directly, but from history, and the short answer is ‘not enough to give a damn about frankly’
Does it follow from this statement (if true) “…we should recognise that we are dealing with a coupled nonlinear chaotic system, and therefore that the long-term prediction of future climate states is not possible.” that it is impossible for us to know what the climate today should truly and properly be like, and therefore we are unable to answer whether there is anything at all unusual about the climate as we experience it today?
Anyone, any views on that.
Reply to richard verney ==> Personally, I don’t think the second thought can be derived from the IPCC statement.
I don’t think there is a “what the climate today should truly and properly be like”. The real world does deal in “should be likes” — it is the way it is. Environmentalists in general make this mistake over and over. They assert that certain parts of the real world “should be like” some idealized version which is entirely subjective (but likely to never have really existed).
that it is impossible for us to know what the climate today should truly and properly be like, and therefore we are unable to answer whether there is anything at all unusual about the climate as we experience it today due to the lies and misinformation published to enable the rulers to tax and spend at the rate they please,,,
Kip, Excellent essay. One thing I find troubling is the terminology which seems to equate linearity to predictability and chaos to unpredictability. I don’t think you’ve gotten into trouble yet by using that terminology, but I think it might be hard not to at times. In actuality, many quite predictable phenomena like exponential growth, radioactive decay, gravitational attraction, etc can not be described by linear equations. In some cases such as exponentials they can be easily translated into a framework (working with logarithms of values) where linear tools work. In some cases, they can’t. Also, I’m not so sure about phenomena such as the time and location of the slippages on the San Andreas and associated faults. Are California earthquakes chaotic in the sense that chaos theory can tell us useful things about them. Or are they just not very predictable?
I’d also quibble a bit about your usage of linearization. It’s true that simplifying assumptions are often needed in order to arrive at a solution to a complex problem like whether a proposed bridge is going to remain standing after the first windstorm. And the simplifications may lead to a linear solution. But linearization can also mean simply solving a problem in a domain where things that are curves in one domain can be represented by arithmetically convenient straight lines.
And a super quibble. Many potentiometers such as those designed for volume control applications do not have not linear taper. Maybe you should slip the modifier “linear” in before the word potentiometer?
This is the basic difference between a prediction and probability.
There is a 100% probability that the San Andreas will have a major earthquake event. The nearness of such an event rises higher and higher the longer we anxiously wait for it to happen. The longer it is between these events=the stronger the quake, too.
But predicting the TIME of a quake is impossible. All we know is, it will happen.
Same with climate: history tells us crystal clear that a cycle of Ice Ages/Interglacials is happening and these are seeing greater and greater extremes when they happen and the probability that our present Interglacial will end is virtually 100%.
When this will happen cannot be predicted. We can only see rising probability it will happen. Since we still can’t understand what causes Ice Ages to END, we don’t know the level of contribution from the sun causing glacial melting but I would assume it is nearly 100% probable the sun suddenly is much more energetic and causes these mysterious and sudden melts.
Chaos comes from trying to predict exactly when natural forces will cause events to happen and this will remain so forever because there is no way of computing exactly when an event happens in complex systems with input of energy from various sources.
Reply to Don K ==> See Leo’s comment.. Engineers make very sure that all their systems fall well within the stable, predictable regimes of their dynamical systems. Once the system transitions to chaos, predictability is lost.
As for linearization, it is when the mathematical equations are set up to be linear by ignoring the nonlinear elements that leads to trouble. Pretending that a nonlinear dynamical system is linear works only as long as the actual forces remain within the tame linear regime for that system — once chaos is allowed to out, all bets are off.
(And yes, there are nonlinear pots — my pragmatic example is “As we turn the knob, the voltage increases or decreases in a direct and predictable proportion, ” — the word linear is in the image. )
Kip, my point was that while linear systems are predictable, not all predictable systems are linear. That distinction isn’t important when dealing with relatively simple situations. I’m not so sure that it can’t become an issue when dealing with real world problems which are often quite hazy.
Likewise chaotic systems inherently have limited or no predictability, but it’s not clear to me that all poorly predictable or unpredictable systems are chaotic. I’m inclined to think that weather/climate for example is indeed inherently unpredictable. OTOH, I’m far from convinced that reasonably accurate earthquake prediction is impossible even though we currently have not the slightest idea how to make such predictions in any very useful fashion.
This limitation can be overcome by writing code, for example a ‘large’ class in languages that support classes that the only limitation is how much memory a computer has.
Here is an article for example, (in which the author also uses “BigNum class in calculating pi to 10,000 digits of accuracy” :
http://www.drdobbs.com/a-class-for-representing-large-integers/184403247
This does increase the time to do calculations and consumes more of the resources used of the computing system, so may be a tradeoff between having more accurate calculations at the loss of having more parameters to make a climate model more accurate (making assumptions) as well as the loss higher resolution (grid size).
I am very curious if there are papers or studies on the limitations of climate models with regards to computer resources available today. My thinking is either a computer system powerful enough to do a reasonable job of modeling the climate is perhaps 20 to 30 years away, or computer systems are adequate today and a good computer model exists but doesn’t show future warming, so is …?
Or Chaos makes modeling the climate impossible. Nevertheless, there is clear evidence that the earth maintains a temperature range despite the level of carbon dioxide as has been paleo proxy witnessed.
I remain somewhat skeptical that chaos will forever make climate models useless but I will be keeping it in mind while I continue my studies and research, and wait for part II and III.
– – –
By the way, can’t one use linearity for highly accurate estimates if one uses a small enough ‘grid or element’ size? I have seen a demonstration of estimating Pi using linear triangles and a somewhat high resolution or precision:
Reply to garymount ==> It is possible to compute big numbers — and there are many schemes and programming work-arounds. In pragmatic terms, all computers end up rounding somewhere — the digital version of 1/3 is 0.333333… to some defined length. Your example of computing a single number to great length is one of the things that computers do well.
In Climate Science, consider that before the 1980s, ALL temperatures were rounded to the nearest whole degree. With electronic, I believe they round to the nearest 100th (? anyone?). Taking monthly averages, also rounded, as if they were actual data points compounds this. We’ll get to this in a later part of the series.
The resolution of the registers is not the limiting feature for temperature, it is the resolution/accuracy of the thermometer. With a typical analog e.g. mercury thermometer, you’ll be doing well to have a resolution of 0.1 C — fever thermometers sometimes have this resolution as a result of having a very thin tube for the mercury you view relative to the volume of the bulb and then using the lensing of the cylindrical class to make it visible, sort of, at the right angle. More common household thermometers are likely accurate to 1 degree F or around 1/2 C. My beermaking bimetallic thermometers are accurate to two to four degrees F, maybe a couple of degrees C, and probably distort nonlinearly as well. The digital thermometer outside of the house returns temperatures to the nearest degree F — but probably has another digit internally (my previous one did and displayed it). The chips used to measure temperature can probably produce at least a floating point number (roughly six digits in whatever scale) if not a double precision float which is so many digits of precision that we just don’t care any more. However, Anthony has carefully documented that most of the digital thermometers coming here from e.g China don’t have anything like that sort of accuracy. They can be as precise as you like but still be no more accurate than my beermaking thermometer. The only way to even detect this is to hand-test and calibrate each and every such device you plan to use and then hope that the calibration is not itself a function of temperature or environment or time as the semiconductors used to do the measurement anneal. Most digital instrumentation of this sort exhibits some sort of drift over long enough time — but so do regular analog thermometers for different reasons.
As I pointed out in one or another of my many replies above, this is what makes the “anomaly vs absolute” problem so problematic. The idea is that if your thermometer is miscalibrated, your knowledge of the absolute temperature may be incorrect and hence averages based on this are uncertain, but your miscalibrated thermometer will still measure almost the right degree size, so it it shows warming over a decade, that warming is real. The problems with this assumption are manifold. For one thing, yes thermometers may be miscalibrated, but there is little reason to think that all thermometers are miscalibrated systematically. On average, in fact, since all thermometers are tested/calibrated at least once, one rather expects miscalibration to be normally distributed around true calibration with little skew. What that means is that if you average the output of many thermometers, the more you use the more accurate your average as the output miscalibration (and roundoff, and reading errors etc) are all likely to be distributed symmetrically around zero and in any even the error there is likely to be bounded and stationary even if there is some source of systematic/biased error as well.
If this is not true, then your anomaly is no more likely to be accurate than the average. The miscalibration could be an incorrect degree size! You could be dead on a reference temperature, but exaggerate all warming above that temperature. With glass thermometers this isn’t even all that unlikely, as the degree scale used assumes that the fluid inside resides in a perfect cylinder that doesn’t change its diameter when the glass heats or cools! The thermometer could also be changed every decade, so that “anomalies” are just the result of changing calibration. The person reading the thermometer is definitely changing over the course of 165 years. The physical location of the thermometer may have changed. Nearby trees may have grown, been cut, grown again, and be cut, all without documentation. The physical environment of the thermometer may have changed. Many “official” thermometers and weather sites are located at airports. Airports change! In some ways they are terrible locations for thermometers used to monitor climate, however useful they are to pilots and control tower staff who don’t care what the regional average temperature is, but very much want to know the temperature right next to the asphalt runway.
The one single thing that really is constant over 165 years is that every person was trying to accurately read whatever instrument they were using, which had been expressly constructed for the purpose of making accurate measurements. Everybody believed in good faith that when they read off 83.5F on their thermometer, that was the temperature of the thermometer (to within a few tenths of a degree F) at the time they read it, and that the thermometer in question was in reasonable equilibrium with its immediate surroundings.
Again, if we wanted to compute the change in height of eleven year old children from 1850 to today, we would not do this using anomalies. We would take a collection of 1850 data and do our best to estimate the mean height of eleven year old children in 1850, quite possibly concluding that we don’t know it then very accurately at all because the data simply isn’t there or is completely absent from important parts of the world representing a substantial fraction of the world’s population of eleven year olds (our sample is not iid drawn from a hat, it is therefore likely to be biased). We would then find the mean height of eleven year old children in 2015 far more systematically, using random sampling and taking care to sample in a proportional way from the many genetic pools that very likely have differential mean height as coherent groups (personally I prefer purely random sampling but a good statistician can do as well by polling a smaller but carefully selected subpopulation, still using random sampling but not using e.g Monte Carlo selection of individuals to be included and letting the Monte Carlo process correct for and converge to racial biases). We would then take the difference, adding the standard errors and MAYBE renormalizing the result (better not).
We would absolutely not restrict ourselves to sampling only in one particular town, or using one particular yardstick, or not use all of the data we have in the present because it all wasn’t present in the past. We would just plain properly acknowledge our computed lack of statistical certainty in the final result.
Here’s the rub. Suppose I have just two samples from two locations. The temperature at 3 pm in My Back Yard today is 22 C. Yesterday it was 20 C. The temperature at 3 pm in Your Back Yard today is 23 C. Yesterday it was 20C. If we compute the “mean temperature in back yards” from these samples, we get 20 C yesterday, 22.5 C today, with an average change of 2.5 C. If I instead recorded only the anomaly relative to yesterday used as a “reference temperature”, I get ((20 -20) + (20 – 20))/2 = 0 C for the anomaly yesterday, and ((22 – 20) + (23-20)/2 = 2.5 C for the anomaly today, and conclude that the average change is — wait for it — 2.5 C.
Under what circumstances will the anomaly give a more accurate result for the change than the differences in the means? A tiny bit of algebra suggests under no circumstances will this occur! Under what circumstances will the accuracy of the mean of the anomalies be better than the accuracy of the difference in the means average temperatures? Only when the thermometers are, on average, systematically miscalibrated so that the degree size is reliable but the absolute degree reading is not and further is not a random variation with zero mean, it has to be a systematic error that survives the averaging process instead of shrinking as we add more data and reduce the error.
And that’s where I part company with the folks who massage the temperature data. They seem to believe that the average surface temperature is not very accurately known today for the very good reason that even today we only sample the surface enormously sparsely at some highly and often systematically biased locations, with instrumentation that may or may not be well-calibrated and as accurate as it is precise. It is hard for me to measure the average temperature in my own yard as different sides of the house would have completely different answers, and those answers would be different from the house across the street which has trees and doesn’t sit on a southwest facing slope above the pavement. Fine. We know the temperature in 1850 enormously less accurately than we know it today. All this means is that we cannot know the change in temperature very accurately at all. We can get a number, but the number may well be smaller than the uncertainty no matter how you obtain it from the same data, because one cannot algebraically transform lead into gold. The information content of the data does not change.
rgb
My reference to for example ‘BigInteger’, or code to contain numbers for a large number of decimal places is to compensate for loss of precision as large numbers of calculations take place and rounding has to occur. For example it the 2 quadrillion calculations per second super computer is used and runs a climate model for a few months, that is a lot of calculations that takes place. As an example, perhaps after every 100 calculations you lose a decimal precision, you will want to start your calculations, your solving of equations, with very large precision numbers so you have some precision left over by the time you finish computing.
But like I said, moving outside of the ‘native’ size of numbers can for example double, or quadruple the time it takes to do all your calculations because of all the extra book-keeping code required to run. You might even push the computer system doing the calculations beyond its resources and thereby grinding the calculation to a comparative halt as memory now has to be swapped to slower virtual memory that exists in the form of hard-drives instead of RAM.
Leo wrote,
“No, that’s not it. Not exactly. Chaos is in this context a mathematical term of extreme precision, and it is used to describe very simple systems whose output cannot be predicted, not because the equations don’t describe then exactly, nor because the equations are hard to write down, nor because we dont understand them completely, but because the equations themselves may be said to contain enough inherent feedback sufficiently large to create extreme instability, or even catastrophic behaviour.
Now that we are done with mental chaos, time to talk about cats inside of boxes! 🙂
Leo wrote,
“No, that’s not it. Not exactly. Chaos is in this context a mathematical term of extreme precision, and it is used to describe very simple systems whose output cannot be predicted, not because the equations don’t describe then exactly, nor because the equations are hard to write down, nor because we dont understand them completely, but because the equations themselves may be said to ontain enough inherent feedback sufficiently large to create extreme instability, or even catastrophic behavior.”
Respectfully, I believe this is a contradiction. If the equations describe them “exactly,” there could be no such bazaar, “unstable” behavior, etc. that it would be a problem. Either the equations describe the phenomena or they don’t, in which cases they are right or wrong. But not both.
Leo are correct. What he says is more or less the mathematical meaning of chaos. A chaotic system is a system that amomg other things are so senitiv to initial values (and rounding errors) that you in some sense cant predict the system state in the future. A chaotic system could be (or maybe always are) quite well behaved about were in the state space the state can be in so it is not completely random were the system state end up.
One thing that might be confusing is that a non-linear dynamic system is given by either a differential equation or a difference equation and those can in general not be solved exactly so it is necessary to solve the equations numerically. So it is not that we have a function of time with strange behavior.
It is that we have a function of time (or rather, a family of functions of time) with strange behavior. Where the strange behavior is precisely that a bundle of the functions that come together arbitrarily close to one another at some point in their trajectory spend almost all of the rest of their time distributed over the full allowable range of those functions. The phase space volume occupied by the solutions starts off in a very small volume that then diverges exponentially with time to fill the accessible volume.
This has nothing to do with numerical errors. It is a property of the functions themselves. The actual solutions to the differential equations, started from nearby initial conditions, diverge rapidly. It is neither stochastic nor “error”. Hence the phrase “deterministic chaos”, hence the entire concept of the Lyapunov exponent:
http://en.wikipedia.org/wiki/Lyapunov_exponent
The climate very likely possesses an entire spectrum of Lyapunov exponents as I’m guessing it runs in a densely multicritical regime as evidenced by the nucleation and growth of self-organized phenomena like hurricanes and thunderstorms which in turn make year to year differences in climate rapidly spin out at different rates for different parts of different phenomena to fill the “bundle” of possible futures from any trivially perturbed initial state. This is largely what one sees in the climate models directly if one looks at the enormous span of results from a single model with perturbed initial conditions.
That doesn’t even mean that the actual trajectory will be in this diverging envelope. That would likely be the case only if we were actually solving the equations of motion for the system.
The problem in climate science is that we aren’t doing that. We are solving the equations that describe a different system, an “earth-like” system in many ways, at a completely different resolution than the actual dynamics. We routinely replace entire chunks of the internal dynamics with heuristic approximations that completely erase the distribution of actual dynamics and make huge chunks of “North Carolina” into homogeneous climate entities hoping that the neglected dynamical errors aren’t being amplified by chaos itself until the trajectories cease to have any meaning at all, have the wrong large scale quasiparticle structure altogether.
rgb
Reply to Butke ==> If chaos and its attendant phenomena was easy to explain, there would be no need for an entire library section of books on the topic.
Read just the Wiki article on Chaos Theory and see if that doesn’t clear up your concerns.
(I don’t recommend the Wiki article as the best or most complete, but only as the most quickly and easily accessible).
Kip Hansen, 3/15/15 @ 3:14 pm:
Reply to Jeff Glassman ==> It has been some time since I heard someone claim that their own sense of logic trumped the Real World.
I made no such claims, which are truly nonsensical deductions. I have no proprietary logic, and no contest exists in these discussions between logic and the real world. The problem is where the definitions apply, and whether you might have some proprietary definitions.
There are so many real world examples of these chaotic behaviors in natural systems that I find your continuing assertions to the contrary difficult to understand.
Prove the existence just one. To do so, you must first define your terms, specifically linearity/nonlinearity and chaos, and then apply them to the real world without relying on any model of the real world. By apply, I mean use ordinary logic as is found embedded in human language. I am quite open to any proposed definitions you might have which are model-free.
Did you read the linked study Nonlinear Population Dynamics: Models, Experiments and Data by Cushing et. al. (1998)? … I can only suggest reading any of the four books listed in the Introduction to Chaos Theory Reading List.
Reading any one of them should manage to bring you around…I hope!
Of course not, and this is no way to participate in a dialog. You seem to have a pattern of throwing out these same roadblocks. To John West @ 5:22 pm; to all @ 12:14 pm. Do not expect your readers to search through a library of books in the hope of finding something that supports your thesis. If you found anything of value in your bibliography, your duty is to quote it thoroughly, providing a precise reference to the volume and page number. From that point, we, your readers, can verify that you’ve applied the information correctly or show you your error.
Kip Hansen, 3/15/2015 @ 3:06 pm:
Mr. Glassman seems to be railing against mathematical models in general and incorrectly believes that the chaos is a product of the math — which it is not.
Not at all. My point is that chaos, like linearity/nonlinearity, is only defined on what you call the math.
You continue in a most promising fashion:
The chaotic behaviors are natural phenomena, only recently being discovered to also exist in the very mathematics of the systems described.
The very mathematics of the systems described are merely man’s attempt to model the systems. Those mathematics are not inherent in real world systems, and the adjective very doesn’t make it so. The chaos you describe exists only in the mathematics. If you think it exists is the real world too, then support your position with reasoning. Don’t just claim it to be so. The same challenge applies: define chaos so that it is model-free, then apply facts from the real world to show it fits your definition.
Kip Hansen, 3/15/2015 @ 2:48 pm.
“A dynamical system is a concept in mathematics where a fixed rule describes how a point in a geometrical space depends on time.
In plain English a dynamical system is a real world process, … .
This is a contradiction. If you think the real world contains mathematics, please tell us about its discovery.
Reply to Jeff Glassman ==> It is not my intention to duplicate the function of the whole library of literature on Chaos Theory — the Wiki article supplies a very complete reading list of references at the bottom, under the heading Scientific Literature..
I can’t help you any more than this — giving an introductory essay on the subject and pointing you to the literature. The learning, the understanding, part is up to you.
I am curious when you became the authority on chaos theory? You write an essay and when people find errors in it or want to discuss its content you either ignore the comments or say that people should read more about chaos theory. The last advice is of course a very good one and much better than reading your essay or your comments if you want to learn something.
I just find it strange how someone seems to believe that they are correct and everyone else are wrong when it seems that the only thing they have done is to read some popular science book about a subject.
Kip Hansen, 3/16/2015 @ 7:16 am
Reply to Jeff Glassman ==> It is not my intention to duplicate the function of the whole library of literature on Chaos Theory — the Wiki article supplies a very complete reading list of references at the bottom, under the heading Scientific Literature. [¶] I can’t help you any more than this — giving an introductory essay on the subject and pointing you to the literature. The learning, the understanding, part is up to you.
Supplying a library of literature, or even a bibliography, is strictly your idea on defense. This is at least your fourth reference to this library, where what is required is your definition of chaos, the one on which you rely for your claim that the real world exhibits chaos. Since you have abandoned the topic (I can’t help you … , apparently you are unable to supply the definition. You claim only to be a scientist enthusiast, but you are writing a scientific paper without following elementary standards for science writing (standards often ignored in today’s professional journals, but standards nonetheless).
Considering that your article above is only Part 1: Linearity, you wouldn’t have been expected to have yet defined chaos. Nonetheless, you did rely on the term incorrectly, and ambiguously, in your very first sentence (already criticized on other grounds, 3/15 @ 10:37 am). The ambiguity is whether the therefore is yours or IPCCs. Either way, the problem is that you ignored the plain scientific error:
The IPCC has long recognized that the climate system is 1) nonlinear and therefore, 2) chaotic.
All chaotic systems are nonlinear, but all nonlinear systems are not chaotic. If IPCC said it, you should have criticized it; otherwise, you should not have inserted therefore.
Here’s an example that should be included in a study on climate, but which IPCC ignores. The absorption of CO2 in water is linear in pCO2, but outgassing is nonlinear, being inversely proportional to pCO2. The physics is the same; the model depends on the direction. What is linear or nonlinear can be a simple matter of the modeler’s choice. And being nonlinear does not make the process chaotic.
Unless one’s objective is to produce pretty butterfly patterns or fascinating Mandelbrots, in other words, if one is trying to do science, chaos is the failure of the model.
The objective here is not to convert Kip Hansen into a science writer, but to inform and remind the public that IPCC cannot rely on the falsehood that the climate is in chaos as an excuse for the failure of its models, or anything else for that matter.
Jeff Glassman wrote:
“Supplying a library of literature, or even a bibliography, is strictly your idea on defense”
That’s the problem with Kip and I believe that it is a quite common problem. He has read some books and thinks he knows the subject. When people point out errors or possibly errors in his thinking he believes that they are wrong and he just point them to the literature that he believes agrees with his view. The problem is that the literature don’t agree with his view.
It is of course impossibly to have a constructive discussion with someone that thinks like this. Should we read thousands of pages so that we can claim that it is not written in any of the books that for example all non linear systems are chaotic? If we read for example the wiki page and try to argue that it doesn’t agree with Kip’s understanding we cant do any more than try to argue for that with the result of more links to the same literature (if he don’t just ignore you).
The whole idea of “chaos” bothers me, because, looking at its dictionary definition, it is really just indeterminacy.
“1 obsolete : chasm, abyss
2 a often capitalized : a state of things in which chance is supreme; especially : the confused unorganized state of primordial matter before the creation of distinct forms — compare cosmos
b : the inherent unpredictability in the behavior of a complex natural system (as the atmosphere, boiling water, or the beating heart)”
Merriam-Webster
Nothing happens by chance. Every physical action obeys the deterministic laws of nature. If it’s too complicated for us to understand, we regard it as chance only because we don’t understand it. “Chance” is epistemological, not metaphysical, not a feature of anything real. But, I’ll break down and read the Wikipedia article, at least.
Reply to Burke ==> Thank you. Yes, we are talking about scientific”chaos” as in “Chaos Theory” (which, btw, is not really a theory, but an area of study that crosses lines of many scientific disciplines).
As you read, you’ll find that to be chaotic in this sense, a function or process MUST be entirely deterministic, however, the future outcomes will be unpredictable.
Phil Cartier, 3/15/2015 @ 6:30 pm:
I think you and Mr. Glassman are making different arguments, his philosophical and yours physical. In the real world the initial conditions occurred so long ago there is really no way to mentally get from there to the present.
Consider the problem that brings us here: Earth’s climate, which IPCC asserts is chaotic (to excuse the chaotic behavior of its models and to keep the regulations and money flowing). Climate began no earlier than the accretion of Earth (a model). It began no earlier than the accumulation of water that formed the oceans (another model, … ). It began no earlier than the formation of the contents, and the development of the ocean to store thermal energy and CO2 and the currents that distribute both to the air. For today’s concepts, the climate began so sooner than the accumulation of the last of the various gases in the atmosphere. This all seems (a) applicable and (b) physical, not philosophical.
Some point in that time line might be considered an initial condition for climate but for the fact that it is a sequence of processes. If indeed we could stipulate to an initial condition, where is the evidence that the climate then proceeded along an unpredictable trajectory, a condition of chaos?
The problem of chaos in climate is the choice of radiative forcing for its model. George Simpson, Met Office director, predicted to Guy Callendar in 1938 (the Callendar Effect, aka the Greenhouse Effect) that it would be unsuccessful, and IPCC has managed to validate Simpson’s analysis. A promising alternative would be a lumped parameter heat transfer (a colloquial misnomer) model. Bearing in mind that all measurements (hence all facts) have an error, and all predictions consequently inherit uncertainty, the climate can always be modeled, can always be modeled linearly, and can always be modeled non-chaotically. One cannot just model an arbitrary parameter to an arbitrary accuracy.
For example and for starters, the Global Average Surface Temperature varies periodically between 5ºC and 17ºC, with a period of about 100,000 years, and it is currently a degree or two below the maximum averaged over the past 5 periods. Much more can be said, leading to the fact that GAST follows the Sun by a simple transfer function, and humans are not involved. Not much chaos in that for either the real climate or its model.
To validate their worse than worthless, GIGO models, the modelers (not scientists) should start with the initial state of the climate 2.588 Ma, when the continents first assumed their present confguration, ie with the Americas connected by the Isthmus of Panama, or about 1.2 Ma, when eccentricity replaced obliquity as the major Milankovitch cycle (although of course the other cycles still have an effect).
The Atlantic has widened by about 40 miles on average since the end of the Pliocene, ie not enough to have a major effect on oceanic circulation or other climatic phenomena.
At that time atmospheric CO2 was probably about the same as now, thus the onset of Northern Hemisphere glaciation wasn’t caused by CO2, however concentration of the gas naturally fell as general climate and the oceans cooled.
Adding one CO2 molecule per 10,000 dry air molecules over the past ~300 years, since the depths of the LIA, has had negligible climatic effect. Adding two more during perhaps the next 100 years, for a doubling of “pre-industrial” Holocene “normality”, will likewise produce little effect, but whatever that might be, would be beneficial.
The climate is chaotic in that a given forcing will not always give the same climatic result unless it is evaluated in the entire spectrum of items exerting forcing upon the climate and the Initial ,State Of The Climate (such as land ocean arrangements, how far the climate is from the glacial -inter- glacial threshold). In addition noise will always be present to an extent due to random terrestrial events or for that matter extra events. Sometimes however these random events could send the climate in a particular trend if significant enough.
My point of view is the climate is random and chaotic but if evaluated comprehensively one can forecast a general trend in the climate..
Along those lines I wrote a paper how the climate may change which I will send following this post.
Here is what I have concluded. My explanation as to how the climate may change conforms to the historical climatic data record which has led me to this type of an explanation. It does not try to make the historical climatic record conform to my explanation. It is in two parts.
PART ONE
HOW THE CLIMATE MAY CHANGE
Below are my thoughts about how the climatic system may work. It starts with interesting observations made by Don Easterbrook. I then reply and ask some intriguing questions at the end which I hope might generate some feedback responses. I then conclude with my own thoughts to the questions I pose.
From Don Easterbrook – Aside from the statistical analyses, there are very serious problems with the Milankovitch theory. For example, (1) as John Mercer pointed out decades ago, the synchronicity of glaciations in both hemispheres is ‘’a fly in the Malankovitch soup,’ (2) glaciations typically end very abruptly, not slowly, (3) the Dansgaard-Oeschger events are so abrupt that they could not possibility be caused by Milankovitch changes (this is why the YD is so significant), and (4) since the magnitude of the Younger Dryas changes were from full non-glacial to full glacial temperatures for 1000+ years and back to full non-glacial temperatures (20+ degrees in a century), it is clear that something other than Milankovitch cycles can cause full Pleistocene glaciations. Until we more clearly understand abrupt climate changes that are simultaneous in both hemispheres we will not understand the cause of glaciations and climate changes.
. My explanation:
I agree that the data does give rise to the questions/thoughts Don Easterbrook, presents in the above. That data in turn leads me to believe along with the questions I pose at the end of this article, that a climatic variable force which changes often which is superimposed upon the climate trend has to be at play in the changing climatic scheme of things. The most likely candidate for that climatic variable force that comes to mind is solar variability (because I can think of no other force that can change or reverse in a different trend often enough, and quick enough to account for the historical climatic record) and the primary and secondary effects associated with this solar variability which I feel are a significant player in glacial/inter-glacial cycles, counter climatic trends when taken into consideration with these factors which are , land/ocean arrangements , mean land elevation ,mean magnetic field strength of the earth(magnetic excursions), the mean state of the climate (average global temperature gradient equator to pole), the initial state of the earth’s climate(how close to interglacial-glacial threshold condition it is/ average global temperature) the state of random terrestrial(violent volcanic eruption, or a random atmospheric circulation/oceanic pattern that feeds upon itself possibly) /extra terrestrial events (super-nova in vicinity of earth or a random impact) along with Milankovitch Cycles.
What I think happens is land /ocean arrangements, mean land elevation, mean magnetic field strength of the earth, the mean state of the climate, the initial state of the climate, and Milankovitch Cycles, keep the climate of the earth moving in a general trend toward either cooling or warming on a very loose cyclic or semi cyclic beat but get consistently interrupted by solar variability and the associated primary and secondary effects associated with this solar variability, and on occasion from random terrestrial/extra terrestrial events, which brings about at times counter trends in the climate of the earth within the overall trend. While at other times when the factors I have mentioned setting the gradual background for the climate trend for either cooling or warming, those being land/ocean arrangements, mean land elevation, mean state of the climate, initial state of the climate, Milankovitch Cycles , then drive the climate of the earth gradually into a cooler/warmer trend(unless interrupted by a random terrestrial or extra terrestrial event in which case it would drive the climate to a different state much more rapidly even if the climate initially was far from the glacial /inter-glacial threshold, or whatever general trend it may have been in ) UNTIL it is near that inter- glacial/glacial threshold or climate intersection at which time allows any solar variability and the associated secondary effects no matter how SLIGHT at that point to be enough to not only promote a counter trend to the climate, but cascade the climate into an abrupt climatic change. The back ground for the abrupt climatic change being in the making all along until the threshold glacial/inter-glacial intersection for the climate is reached ,which then gives rise to the abrupt climatic changes that occur and possibly feed upon themselves while the climate is around that glacial/inter-glacial threshold resulting in dramatic semi cyclic constant swings in the climate from glacial to inter-glacial while factors allow such an occurrence to take place.
The climatic back ground factors (those factors being previously mentioned) driving the climate gradually toward or away from the climate intersection or threshold of glacial versus interglacial, however when the climate is at the intersection the climate gets wild and abrupt, while once away from that intersection the climate is more stable. Although random terrestrial events and extra terrestrial events could be involved some times to account for some of the dramatic swings in the climatic history of the earth( perhaps to the tune of 10% ) at any time , while solar variability and the associated secondary effects are superimposed upon the otherwise gradual climatic trend, resulting in counter climatic trends, no matter where the initial state of the climate is although the further from the glacial/inter-glacial threshold the climate is the less dramatic the overall climatic change should be, all other items being equal.
The climate is chaotic, random, and non linear, but in addition it is never in the same mean state or initial state which gives rise to given forcing to the climatic system always resulting in a different climatic out-come although the semi cyclic nature of the climate can still be derived to a degree amongst all the noise and counter trends within the main trend.
QUESTIONS:
Why is it when ever the climate changes the climate does not stray indefinitely from it’s mean in either a positive or negative direction? Why or rather what ALWAYS brings the climate back toward it’s mean value ? Why does the climate never go in the same direction once it heads in that direction?
Along those lines ,why is it that when the ice sheets expand the higher albedo /lower temperature more ice expansion positive feedback cycle does not keep going on once it is set into motion? What causes it not only to stop but reverse?
Vice Versa why is it when the Paleocene – Eocene Thermal Maximum once set into motion, that being an increase in CO2/higher temperature positive feedback cycle did not feed upon itself? Again it did not only stop but reversed?
My conclusion is the climate system is always in a general gradual trend toward a warmer or cooler climate in a semi cyclic fashion which at times brings the climate system toward thresholds which make it subject to dramatic change with the slightest change of force superimposed upon the general trend and applied to it. While at other times the climate is subject to randomness being brought about from terrestrial /extra terrestrial events which can set up a rapid counter trend within the general slow moving climatic trend.
.
Despite this ,if enough time goes by (much time) the same factors that drive the climate toward a general gradual warming trend or cooling trend will prevail bringing the climate away from glacial/inter-glacial threshold conditions it had once brought the climate toward ending abrupt climatic change periods eventually, or reversing over time dramatic climate changes from randomness.
NOTE 1- Thermohaline Circulation Changes are more likely in my opinion when the climate is near the glacial/ inter-glacial threshold probably due to greater sources of fresh water input into the North Atlantic.
There is no mystery to D-O events like the Dryases. They occur with varying amplitudes continuously during both glacial and interglacial periods, based primarily on cycles in solar activity which overlie the effects on orbital and rotational mechanical Milankovitch cycle on insolation.
The changes these cycles produce are about an order of magnitude greater during glacial (D-O and Heinrich events) than interglacial periods (Bond Cycles). But perhaps most pronounced are those during deglaciations, such as the Dryas events, amplified by the effect of pulses of cold fresh water from melting ice sheets on NH ocean circulation.
It took about 12,000 years for the northern continental ice sheets to melt, from the Last Glacial Maximum, c. 18,000 years ago, to the time when the Laurentide ice sheet totally disappeared, during the Holocene Optimum. The 8.2 Ka cold snap was the last Dryas-like event, which requires ice sheets. But the cycles which cause them operate all the time.
Catherine ,we are on the same page essentially.
To a large extent.
That Milankovitch Cycles rule at the scale of tens and hundreds of thousands of years is IMO well established, at some highly statistically significant level. But the causes of multidecadal to centennial to millennial scale fluctuations, perhaps less so.
“6. In nonlinear systems, even infinitesimal changes in input can have unexpectedly large changes in the results – in numeric values, sign and behavior.”
That could lead to notions of runaway irreversible global warming and serious weather weirding.
Reply to Ulric Lyons ==> And, indeed, that is one of the common concerns about climate — whether it is justified or not is another matter.
My position is that Edward Lorenz has convinced most parties that natural variability of atmospheric teleconnections and oceanic modes are internal, merely by offering a clever model of it, but never addressing whether it is internal, let alone providing proof. I have never believed a word of it. And would suggest that until it is recognised exactly how the Sun drives it all, none will be wiser about weather climate, past or future.
“It is wrong to think that the task of physics is to find out how nature is. Physics concerns what we can say about Nature.”
– Bohr
After reading all of these comments, it struck me that no one mentioned that the answer is 42, and that the computer that we all live in was designed to figure out the question that was originally asked…
I actually agree with almost all of this, only I lack your degree of certainty in my belief. Direct CO_2 linked radiative warming should be order of 1 C. I don’t know what the feedbacks will be, however, and very much doubt that anybody does. This is where the nonlinear parts become crucial. Is increased GHE from increased water vapor more important than increased cloud albedo from increased water vapor? What about alterations in the patterns of heat transport as even 1 C of gradual warming occur? Patterns don’t change “continuously”, they often shift discretely. What if the named multidecal oscillations spawned a brand new oscillation, or the period of one of the existing ones doubled or halved? These are probably not globally stable entities — they are chaotic, the result of self-organized critical behavior of the whole system. I absolutely defy somebody to take the Earth in model form, fill its oceans with model water, light its surface with model light, run it forward for ten thousand years and discover exactly the pattern of ocean currents that have names today. Is that pattern truly stable? I doubt it. And only a small shift in some of the major components of the thermohaline circulation would completely alter the Earth’s climate, and not by just a degree C either, with constant CO_2. It is quite possible that this is the cause of the Younger Dryas or Little Ice Age, for example, although we so VERY lack the data needed to find out.
So sure, I try to build little models in my mind and make heuristic arguments too, but I’m wise enough, I hope, to acknowledge to myself if not to others that I can’t solve the coupled Navier-Stokes equations for the Earth 100 years into the future in my head, either, any more than we can compute those solutions believably using the best computers in the world.
Short of that, we are all guessing what is important, linearizing, using heuristics, all of which is (I’m sorry) a cosmic waste of time at least given the low probability that any particular heuristic statement will turn out to be right (and our enormous difficulty in proving it if it does turn out to be right). It’s basically a grown up version of the old “Is so.” “Is not.” “Is so.” “Is NOT!” “IS SO!”… (iterate until one comes to blows) that decorated childhood pre-ask-whoever on the universal cell phone era. Only there is no way to ask 2100 what its temperature is, besides waiting.
rgb
I really don’t think that this has been a good discussion. The only thing you have done have been to ignore every critic of your essay and tried to teach some people your incorrect view about dynamical systems.
Re Chaos & Climate – Part 1, 3/15/2015
For a lengthy philosophical discussion about whether chaos is just a mathematical phenomena of models, or if it also exists in the real world they represent, see the 49-page paper by Robert Bishop, Stanford Encyclopedia of Philosophy, 2008, available on-line. http://plato.stanford.edu/entries/chaos/
Bishop’s bottom line appears to be this: From a philosophical point of view, chaos in the real world is severely challenged, and an open question. It is mathematically open for lack of either an example or an existence theorem. But from a scientific standpoint, it is not factual. And lacking facts, the conjecture lacks any existence.
Science is a mapping on facts to facts, where a fact is an observation reduced by measurements and compared to a standard. Scientific knowledge is contained in models of the real world. In order of increasing quality, they may be graded as conjectures, hypotheses, theories, and laws. But if one is unable to distinguish between something of the real world and its model, he is doomed at the outset to be scientifically illiterate.
Reply to “Real World vs. Models” idea ==> The mistake that Mr. Glassman is making is that he has refused to read anything that would expose him to the vast informational treasure trove that has been developed on the subject of Chaos Theory and the experimental findings of these concepts in the world we actually live in — and yet wants to be “debated” in a elementary-school introductory class on the never-ending battle between pure philosophy and dirty-hands science.
Those things I leave to others — here it is simply a distraction to those who would learn.
Re: Kip Hansen, 3/17/15 @ 7:57 am said:
The mistake that Mr. Glassman is making is that he has refused to read anything that would expose him to the vast informational treasure trove that has been developed on the subject of Chaos Theory and the experimental findings of these concepts in the world we actually live in — and yet wants to be “debated” in a elementary-school introductory class on the never-ending battle between pure philosophy and dirty-hands science. [¶] Those things I leave to others — here it is simply a distraction to those who would learn.
The mistake I actually made was trying to get Mr. Hansen to write about science in the style of science. I asked him several times for his definition of chaos to no avail. Instead he disgorged a reading list like a hair ball. I thought I might help him and the readers by discovering in those writings what might have led him to believe that any of the many definitions of chaos might apply beyond models to the real world, leading to his erroneous view that chaos exists in the real world.
Asking me to search through nine textbooks is quite absurd. I did make an attempt to review the six papers on his list. Here’s the disposition of them:
1. Sharkovskii (1964) is too old and a dead end. ResearchGate lists it, but provides no links to the full paper.
2. Li & Yorke, (1975) is available on-line, and is often cited in the literature. This paper is based on this: The way phenomena or processes evolve or change in time is often described by differential equations or difference equations. Plus
These models are highly simplified, yet even this apparently simple equation (1.2) may have surprisingly complicated dynamic behavior. See Figure I . We approach these equations with the viewpoint that irregularities and chaotic oscillations of complicated phenomena may sometimes be understood in terms of the simple model, even if that model is not sufficiently sophisticated to allow accurate numerical predictions.
Not only are Li & Yorke studying a phenomenon of models, they don’t even require the models to have any fidelity to the real world, as that is measured by the power to predict.
Li & Yorke’s main theorem begin thus:
>>Theorem 1. Let J be an interval and let F:J—>J be continuous. Assume there is a point a, a member of J, for which the points b = F(a), c = F^2(a) and d = F^3(a), satisfy d ≤ a < b b > c).
>>Then T1: for every k = 1, 2, … there is aperiodic point in J having period k.
>>Furthermore, T2: there is an uncountable set S a subset of J (containing no periodic points), which satisfies the following conditions: … .
The rest may well be unwritable as a comment on this blog.
Kip Hansen, a science enthusiast, would have us believe not only that he read and understood this paper, but that it supports his conclusion that chaos exists in the real world.
3. Crutchfield, et al (1986) from Scientific American is available on line. The discovery of chaos has created a new paradigm in scientific modeling. Crutchfield (1986) p. 1/18. Much of the paper is an interesting discussion of attractors in dynamical systems, both of the nonchaotic and of the chaotic variety. However, Crutchfield et al. neither define chaos nor attractor, but imply that a chaotic attractor is found in chaos but without commiting to that fact as a necessity.
The larger framework that chaos emerges from is the so-called theory of dynamical systems. A dynamical system consists of two parts: the notions of a state (the essential information about a system) and a dynamic (a rule that describes how the state evolves with time). The evolution can be visualized in a state space, an abstract construct whose coordinates are the components of the state. Id., p. 6/18.
Thus chaos is visualized in an abstraction, not reality. Moreover, Chaos … mixes the state space. Id., p. 10/18. And however, When observations are made on a physical system, it is impossible to specify the state of the system exactly owing to the inevitable errors in measurement. Id., p. 10/18.
Although the analysis of Gollub and Swinney [on fluid flow between rotating cylinders] bolstered the notion that chaotic attractors might underlie some random motion in fluid flow, their work was by no means conclusive. One would like to explicitly demonstrate the existence in experimental data of a simple chaotic attractor. Id., p. 14/18.
One would like a demonstration of the existence of anything, simple or complex, essential to chaos.
4. Kolyada (2004) is science for sale at $39.95. The first pages can be viewed on line, and the first paragraph of the introduction is this:
The notion of chaos in relation to a dynamical system defined by a continuous map was first used by Li and Yorke [1]. At present there are so many definitions associated with this term that the word chaos often causes an ironic smile of mathematicians. There are many approaches to the definition of the chaoticity of a map; some of them are useful only in special spaces. Despite the fact that one can say “So many authors, so many definitions,” the basic idea of all approaches is the unpredictability of the behavior of all or many trajectories or of at least one trajectory according to which the location or a point of the trajectory is determined with certain error (this phenomenon is usually described in terms of instability or sensitive dependence on initial conditions). Since we are going to consider topological dynamics, we do not speak about notions that require the smoothness of a map, and we almost do not use such measure-theoretic notions as ergodicity. The present paper gives a brief survey of the theory of chaos and is written on the basis of the preprint [2] and paper [3]; of course, it does not cover all aspects of this theory. Kolyada (2004), p. 1242.
So many authors, so many defintions, yet all definitions apply only to models.
5. Strelioff, et al. (2006). $25. Not paid.
6. Hubler, et al. (2007) is available on-line. It applies to social organizations:
Chaos means that strategies go wildly astray. It is often associated with missed deadlines, understaffing, runaway costs, and similar situations generally considered negative. Under these circumstances “Chaos” describes a situation where the goals of a strategy are unachievable and therefore the outcomes become random, unpredictable and often undesirable. Hubler (2007) p 1/10.
And then,
The state space of a chaotic agent can be divided into two regions, the convergent region and the rest, the divergent region. Id., p 3/10.
State space, vector spaces, metric spaces, and so on, are where models live, not the real world.
Conclusion: Kim Hansen’s claim that chaos exists in the real world is contradicted by his own reading list, which is nothing but the very distraction he fears.
Good heavens!
For some years I have studied an Australian weather site, Melbourne Regional 86071 as a daily record of temperatures that should be among the highest quality from the BOM.
In looking at the period from ca. 1856 to 1972 (after which observations changed from deg F to deg C) there is at least one unexpected pattern in the results that were later converted to deg C retaining one place after the decimal.
There are 2 main reasons I can imagine why this is so. There might be more. One is that observers missed days and filled them in. The other is that the numbers have an element of chaos that reminds me of the water drop work of Otto Rossler and others. See at 29 mins this video
Kip, thank you for this topic. My personal hope is that in later chapters there will emerge a facility for readers here to use software they do not have yet, to determine if chaos theory is involved or not – such as the generation of butterfly diagrams from simple input data.
Reply to Geoff ==> It is a small violation of my personal policy about linking to commercial sites, but here is a LINK to a used copy of a used chaos book that comes with a CD of programs for the PC (make sure the CD is includes with the used book).
Kip,
Thank you for the reference.
Anticipating your coming episodes.
Geoff.
I would rather say that if you want to understand chaos you should start reading some books about differential equations, dynamical system, linear dynamical systems, fourier analysis, non-linear dynamical systems, control theory and similar (and of course linear algebra and calculus if you don’t understand that) before starting on the chaos book.
That might avoid getting an understanding similar to Kips one when everything seems to be a complete mess and my guess is that it is due to a bad understanding of the basics.
Reply to Raymond ==> Well, at least you stick to your convictions. But you have yet to actually offer anything other than unqualified “No, it isn’t”s, rather than share some examples of how it is that things actually are the way you see them, and not the way that the authors of the literature just above see them (none of these ideas are mine, of course. I just pass on what I have learned from them.).
Chaos Theory is not some cock-eyed idea thought up by some 1960s scientists on recreational drugs — not some weird idea thought up by one guy with an eccentric mind — but a solid and growing field of study that cuts across scientific disciplines to help explain the world around us as we find it. It has moved from an interesting idea to a well-grounded, well-accepted object of a growing body not only of study but of experimental confirmations.
You can choose to accept, doubt or reject it, of course.
I’d love to see an essay from you that refutes the subject from first principles or experimental results — that would be of great value. Looking forward to it.
Patience, Raymond. There are two kinds of understanding at play here. Yes, to understand chaos it helps a lot to have taken courses in differential equations ordinary and partial, to have written a chaotic simulation and watched it parametrically trace out a Feigenbaum tree, to have played with iterated maps and fractals, to have studied physics (hell, to have a degree in physics) and so on. That’s my approach to it and I suspect yours. But most people — even a lot of people who have taken intro physics and some calculus, a lot of smart people — wouldn’t know a wave equation or harmonic oscillator or heat equation or decay equation (I’m speaking of the DEs here, not “waves” or “oscillators” or “heat flow” as concepts) if they walked up and bit them in the ass.
A motivated lay person can, by reading introductions like Gleick, learn a lot about chaos without having actually done all of this, just as they can learn a lot about mathematics and Hilbert’s grand scheme by reading e.g. Morris Klein without necessarily having worked with axiomatic reasoning systems themselves. A truly motivated person can go a notch further and try to educate themselves about the math. When they do this, they will of course make mistakes — part of the learning process. The thing is, it is a lot more productive to gently nudge them back towards correctness, and not just tell them that they need to study math for half a lifetime before they can play or talk about any of it.
Alternatively, you can do what I’ve done above and present actual corrective examples of e.g. linear vs nonlinear equations. Or, write an article on chaos yourself and submit it. I’m certain Anthony would be thrilled to publish it. I’d do it myself except for the fact that my time is something like triple committed right now to the point where I shouldn’t even be typing this reply.
rgb
Reply to Dr. Brown ==> Thank you for the intervention.
As you know from my previous writing (and some of the discord between the two of us over trends and predictions) understandings at vastly different levels results in “speaking different languages”.
Shoot, my university study was human biology and religions — with a minor in anything to do with maths and science. But my professional life ranges across the spectrum — missionary work, humanitarian aid, cryptography, hamster ranching, private policing and security work, employee vetting, business management troubleshooting and industrial espionage (black and white).
My effort here is to introduce the subject and explain of why the IPCC gives the famous Chaos quote and what it might mean, aimed at the educated layperson — Average Joe (or Josephine).
I always welcome your more depth comments, carrying on where I leave off.
If I [thought] you had the time, I’d ask you to collaborate on the final essay in the series: “What does this (chaos) mean for Climate Science?”
…thought you had the time….
Kip Hansen, why can’t you answer my questions instead of talking about the literature? I don’t doubt that chaotic dynamic systems exist but not all non linear systems are chaotic and I have already given some examples.
A car is a non-linear system but not chaotic. Do you disagree?
dot(x)=-x-x^3 is a non linear and non-chaotic system if you want another example.
” But you have yet to actually offer anything other than unqualified “No, it isn’t”s, rather than share some examples of how it is that things actually are the way you see them, and not the way that the authors of the literature just above see them (none of these ideas are mine, of course. I just pass on what I have learned from them.). ”
How should I respond to this when you so far have ignored all my comments about your essay? I have already given examples and arguments for my view. I am not arguing against the authors of the literature. I am arguing against your understanding of the literature and what you wrote in your essay.
Or maybe I should just do like you, reference to the literature? That a lot of the things your write goes against what I have read and I just pass on? That you are the person that need to read every book about dynamical system and prove that my view are wrong?
To me it just seems like a waste of time for both of us to reference the literature instead of trying to discuss the actual points that we made.
I am not even the only one in this thread that say that your first sentence is incorrect.
” Or, write an article on chaos yourself and submit it. I’m certain Anthony would be thrilled to publish it.”
LOL, do you really believe that? Anthony publish this series about chaotic system for only one reason. That Kip is going to arrive at the “right” conclusion. It is not that the essay is interesting or right or wrong or something like that.
“I’d love to see an essay from you that refutes the subject from first principles or experimental results — that would be of great value. Looking forward to it.”
I missed this one. I find it frustrating when people can’t discuss what other people write and instead make huge strawmen that they argue against.
I have never argued that chaos theory are not correct. I have argued against what you wrote in your essay.
Reply to Raymond ==> If you don’t like my suggestion, take Dr. Brown’s:
“Or, write an article on chaos yourself and submit it. I’m certain Anthony would be thrilled to publish it. — rgb”
(A car, btw, is a physical, complicated machine made of up innumerable mechanical systems – it itself is not a “a non-linear system” — or a nonlinear dynamical system — when it wakes up in the morning. The driving of a car, when you add in a human being with all its complexities, however, becomes pretty wild….)
Take Dr. Brown’s advice and have a bit pf patience. I am trying to introduce Average Joes and Josephines to a very everyday understanding of linearity and nonlinearity (in the Chaos Theory sense) — not teaching an advanced maths class.
“(A car, btw, is a physical, complicated machine made of up innumerable mechanical systems – it itself is not a “a non-linear system” — or a nonlinear dynamical system — when it wakes up in the morning. The driving of a car, when you add in a human being with all its complexities, however, becomes pretty wild….)”
So you run away once again or do you really don’t know what a dynamical system is? Why don’t you discuss your essay with other people? It is possibly that you might learn something…
It would have been so easy and constructive if you actually made some comments about the critical views of your essay instead of just ignoring those and play teacher for the other readers.
“I am trying to introduce Average Joes and Josephines to a very everyday understanding of linearity and nonlinearity (in the Chaos Theory sense) — not teaching an advanced maths class.”
I just feel pity for poor average Joes and Josephines that some self thought person tries to teach them a subject that he doesn’t seem to understand himself.
Reply to Raymond ==> Imagine you are sitting in an elementary school, 5th Grade class where the teacher is trying to get across a few basic ideas about chemistry.
Today’s class will be:
“Kids, here is a tiny bit of the metal sodium — we drop it in water and and it reacts quickly, starting a fire on the water. Over here are two liquids: I pour them in this botlle, quickly sealing it — see this resulting yellowy-green gas? That’s chlorine gas — which is highly poisonous. But when sodium and chlorine combine, making NaCl, sodium chloride, it is table salt and is essential for life.”
Yet you barge in, ranting about sub-atomic participles and quantum physics, shouting,”you’re teaching the children incorrectly….”
Hardly helpful.
If you’d like to be helpful, let’s write the final essay of the series — So what do these chaotic behaviors of nonlinear dynamical systems have to do with climate?” — together. You send me your rough draft and I’ll turn it around, toned down to the introductory level… Just an outline would do if you’d prefer.
You can send it to me at my first name at the domain i4 decimal net.
Kip, do you really believe that is what I have tried to do in this thread? I have tried to point out some very basic errors in your essay.
All nonlinear systems are not chaotic is the most important one. Do you still believe that that is the case?
Raymond
Its a somewhat semantic point. Nonlinear pattern formation occurs at the Hopf bifurcation region at the threshold of chaos, just short of it. As you well know. But many in the field refer to the whole class of nonlinearity / emergent pattern / chaos systems and dynamics as “chaos” or “chaotic” just as a useful descriptive shorthand, since a fully correct descriptive title would be too long.
Thus for example James Gleick’s excellent book “Chaos” is not just about turbulence.
Reply to Raymond ==> Oh, for heaven’s sake! If that’s all you’re on about, here is what I actually said — cutting-and-pasting the Take Home Messages:
Note that nowhere in this do I say “all nonlinear systems are chaotic” …
So, with that handled, what’s your next “most important one”?
phlogiston, I don’t understand what you mean. For me is a non-linear system just a system that is described with a set of non-linear differential or difference equations. A chaotic system is a subset of non-linear systems with some special properties.
Reply to philog’ ==> Thank you, I think I need a translator!
Read your first sentence and you can see that you actually wrote that.
“The IPCC has long recognized that the climate system is 1) nonlinear and therefore, 2) chaotic.”
What you write in your take home message also suggest the same thing. You use non-linear when you really should be using chaotic system to get something true. The important property is not the non-linearity but the properties that define a chaotic system.
Reply to Raymond ==> Well — I tried.
Why don’t you just write an errata or a rebuttal and I’ll publicly apologize for anything that others will agree is an egregious error on my part — there may be some (and not just a semantic nitpick — I’ll even gladly agree to acknowledge any examples of bad semantics, if it will cheer you up).
Have at it, Slim!
You can send your errata or rebuttal to Anthony on the Submit a Story page.
The invitation to help write the series is still open — I gave my email above.
Raymond, Kip
There is a real issue of language here. “Chaos” and “nonlinear” are just two descriptors of a class of phenomena. Other equally important ones are “far-from-equilibrium”, “dissipative”, dissipative structures”, “nonequilibrium structures”, “emergent pattern”, “friction”, “open system”, “complexity”, “self-organisation” and so on.
Something is there, one senses, but it eludes being pinned down with a single term. “Nonlinear” as Raymond rightly says, just means a relationship between A and B other than a straight line. This wide category certainly includes a great deal outside of chaos.
I found this PhD thesis online by Matthias Bertram to be very helpful – have a read of the introduction, pages 1-5:
https://drive.google.com/open?id=0B_RXGJAF_XL5S1lHZEU4VndBcDg&authuser=0
There is a historical issue here. Gleick in his book “Chaos” explains how the physical sciences have developed in a way that exhibit a strong selection effect towards linearity. The systems that lend themselves fruitfully to sets of equations that go somewhere in a linear like manner have attracted all the research effort. Although “chaotic” (lets call them that) systems have been discovered for more than half a century, chaos-related phenomena have been caged and sidelined in a kind of cage of curiosities or oddities, for folks to marvel at their strangeness but to be kept well away from the mainstream of physics.
Thus half a century after the illucidation of chaotic systems by Turing, Lorenz, Mandelbrot, Feigenbaum, Ruelle etc., the science remains to this day in an unnaturally prolonged infancy, still lacking an agreed nomenclature or terminology as other branches of physics have, leaving people to flail around linguistically on the subject.
Climate and the CAGW debacle could be the decisive moment when an understanding of “nonlinear chaotic” systems is accepted at the heart of our understanding of natural systems, not sidelined as a cage of oddities.
Reply to philog’ ==> Yes, I am well aware of the language problem … too many words with different meanings even in close related fields. I have on my boat, where I live and write, only six of the best Chaos books (and these few over the objections of my wife — boats are small). As you must know, they each start out with two or three chapters trying to overcome the language problem — some more successfully than others.
Thanks for the link to the von Mathias Bertram paper — I love the chemical chaotic manifestations — though I have to say that not a word of the introduction of it would have been understood here for 99% of readers.
I hoped that by directing readers interested enough to something as simple as the Wiki Chaos Theory page, some of this could be avoided. I am beginning to think that Raymond has been set off by a single word in the first sentence — “therefore”. Maybe you could re-write that first sentence for me….
I am committed now to finish the series….to which I knew they would be a few hard-line objectors, but I didn’t think the objections would come from the educated.
Raymond says:
LOL, do you really believe that? Anthony publish(ed) this series about chaotic system(s) for only one reason. That Kip is going to arrive at the “right” conclusion.
Do you really believe that??
Anthony welcomes articles from all sides of the debate. He even provides a link to send in a proposed article.
You have already written more than enough for an article. So why not stop the complaining, and produce your own? You might find out that what you believe, others might not agree with.
Give it a try. What have you got to lose?
I personally think that you do Anthony a severe disservice. In my numerous interactions with him I have never seen any sign that he selects articles on the basis of whether they lead to some “right” conclusion. Indeed, one of the few articles I’ve actually written deliberately for WUWT as opposed to having promoted from a comment was pooh-poohing an absurd theory of gravitational heating of the atmosphere. I routinely write (sometimes extensively) bopping people upside the head when they make absurd claims about the greenhouse effect (such as that it violates the second law or nonsense like that). Lief Svaalgard — in an often contentious way — polices the “solar-climate” connection and has a loud voice and tremendous presence in list discussions on that subject. Anthony might or might not “like” for their to be gravitational heating or a solar-climate link, but he does not hesitate to give opposing views a forum. One of my favorite articles on WUWT is one written by Ira Glickstein (snitching figures from Grant Petty’s book) on how the greenhouse effect works and the extremely sound evidence behind it. Anthony certainly didn’t “censor” this.
The only two groups of participants I’ve ever seen him directly school or ban from the list are the dragon slayers (thank heaven!), who are largely batshit crazy and ignorant to boot, with the possible exception of Tim Ball, who is not and who still posts here, and a very few warmists who are pure trolls. Warmists may or may not get a warm reception from other list participants, but Anthony provides them with an open forum for all civil discourse regardless, and bops either side if they depart too strongly from the path of civil discourse.
He also publishes articles on things other than “the climate”. I would think that he would welcome a well-written article on the basics of deterministic chaos from somebody that has actually studied it, even if it didn’t address the climate at all. But suit yourself.
rgb
Reply to Dr. Brown ==> Yes, yes, yes….I’d love it if someone with true professional-level, professor-level understanding would write this series.
I think it is very very important — not because it denigrates climate science or “proves” the IPCC wrong (it does neither, btw) — because having a better understanding of ‘the way things really work” allows us to think more clearly, less biased, more informed, about a topic The IPCC Chaos quote is misused and abused by those who have political agendas, the intentionally ignorant, or the well-meaning but confused general public.
Would you consider just writing a few paragraphs for the third and final installment: “What the IPCC Chaos quote really means for Climate Science? How should it change our understanding?”
If you’ve lost my address, it is my first name at the domain i4 decimal net. (obscured from email address seeking web searching robots)
Chaos reigns supreme but it always has a strange attractor tending to harmony and beauty, the climate on our earth has multiple strange attractors, some times working in opposition and some times adding.
These attractors have almost no bearing if any at all on the trace gases in our atmosphere, the cycles noted in the warm and cold periods of our planet are what was once called the harmony of the spheres, our gas giants in their various configurations control both the solar cycles and hence our varying climate.
When our wonderful climate scientists come to terms with the cycles and put two and two together the penny may drop.
Reply to Wayne Job ==> Judith Curry and her team have done some work along these lines, with their Stadium Wave theory.
Hi all. I’m a Comp Sci grad who is now getting to “machine learning” (ML) this is a fascinating field where we regularly deal with non-linearity. (Linearity being f(x) = y = mx+b) In machine learning can solve for m, and b pragmatically. This is our trivial example. ML generalizes this to f(x) = m[1]x[1] + m[2]x[2] …m[n]x[x] where [] denotes a subscript. ML will pragmatically find all the m[] such that it makes a prediction of minimal error. Sometimes we move terms into polynomial space (x^2). ML is most often used when we have a lot of variables (100) which we can’t possibly solve by hand. but we apply techniques and get reasonable answers.
Multivariate regression is dependent on the human to tell it what factors into the relationships and it works within that limited framework because it is a single layer. A neural network works much the same way, but we can stack the neurons, feeding the outputs into another layer. This layer picks up associations in the data which are not obvious. These layer after the first are the “insight” (also “magic”). However they aren’t entirely magical, and a ML expert can spend months analyzing model performance and tweaking it. Models generally suffer from under-fitting (constant or straight line through a quadratic) or over fitting where the function curve nails the model training points, but makes errors with points not in the model training set.
It seems to me that a neural network would be ideally suited to the task of complex climate models. Has there been any work done that used neural nets to model climate?
(And the best thing about them is they pragmatically find their constants of best fit based on the training set. So you don’t plop in radiative forcings, it finds them itself.)
Reply to Jason ==> Well out of my field, I’m afraid. I was a web programmer for the IBM Olympic Team, and we did some pretty cool stuff, but not neural networks.
Good question though for the readers here —
Anyone aware of an effort to apply Neural Networks to the Climate Problem?
Here’s one:
http://wattsupwiththat.com/2013/01/20/analysis-shows-tidal-forcing-is-as-a-major-factor-in-enso-forcing/
And another:
http://wattsupwiththat.com/2011/06/13/the-chaos-theoretic-argument-that-undermines-climate-change-modelling/
just enter “neural network” in the WUWT search box..
I heartily welcome this series on chaos and climate by Kip Hansen – much needed.
The level of response shows a groundswell of realisation of how central chaos/nonliearity is to climate.
And the illuminating contributions from rgb are particularly striking. Prof Brown must surely win the award for the most substantial posting on a single thread – that means original writing, not including endless links and cut and pasted quoted text. Respect!
For relevancy to climate the debate must zoom in on how the nonlinear paradigm really affects the important climate questions. And soundly refute those who argue that chaos is just about small scale noise-like variation and in the long term with CO2 and other “forcings” we can stay in comfortable and familiar “linear-world”.
Here is a quick summary of just SOME of the ways chaos affects the important climate issues:
1. The work of Ilya Prigogine on nonlinear thermodynamics could invalidate entirely the dogma that CO2 warms the planet at all, or that increasing CO2 causes warming. Emergent complex structures could by exporting entropy negate CO2 warming totally.
2. THE NULL HYPOTHESIS OF ANY OBSERVED CLIMATE VARIATION IS THAT IT IS INTERNAL CHAOTIC VARIATION WITH ZERO IMPLICATIONS AS TO OUTSIDE FORCING.
Sorry for the shouting but this is the most egregious (love that word – learned it here at WUWT) egregious error of the CAGW narrative. This aspect of the CAGW narrative is offensively stupid. It goes: O look – the climate is warming for a few decades. And CO2 is going up too. So it’s increasing anthro-CO2 causing dangerous warming etc…
No. Understanding climate as a chaotic/nonlinear system means that the baseline expectation and null hypothesis must be constant change. Moreover, this change follows the log-log power law of chaotic-fractal systems, basically lots of frequent small changes, few big changes, very few very big changes etc.
Ed Lorenz showed clearly that in a simple simulation with fixed inputs i.e. no forcing change, the system was constantly changing such that it could not ever be characterised by a mean.
3. Mixture of positive and negative feedback is behind the behavious or important oceanographic systems. ENSO for instance is a nonlinear oscillator driven by the Bjerknes positive feedback, causing the switchin beween states. Also the AMOC (gulf stream system) is subject to a salinity-downwelling positive feedback that makes the AMOC, over longer millenial timescales, also unstably stitch between states (on-off, fast-slow) which dramatically affect climate especially in the NH.
4. Clouds have a chaos-related Lyapunov stability that makes cloud arrays more persistent that would be expected without consideration of chaotic dynamics.
Plus others I’m sure but gotta go..
Reply to phlog’ ==> Thanks for the support. Feel free to sketch an outline of the third essay in this series — so far I have invited the brilliant Dr. Brown (rgbatduke) and the combative Raymond to help with it. Topics and examples welcome.
You can sent it to my first name at the domain i4 decimal net.
Sure, I’ll try to do so. A few oceanic examples perhaps.
Not only is the system resisting definition, but add to it our tools of measure and survey are grossly inadequate. We can’t begin to quantify whether or not a problem exist across the board, because of course changes in climate affect regions to varying negative or positive degress and often both negative and positive are in play. So the question remains, is C02 forcing a problem…its a damn nebulous question at best. Who is affected and for how long? Winnipeg could do with a ten degree C warning in my opinion, others may suffer because of it, but haven’t I suffered enough?
Reply to owenvsthegenius ==> See my piece Baked Alaska… — somewhere in there I mention that Fairbanks, Alaska has benefited from a 50% increase in “growing days” over the last few decades. Obviously a huge economic boost to this, the leading agricultural area of the state. Fairbanks has, however, had a slightly negative overall temperature average over the last thirty years.
Well it’s about 300 miles due south of Fairbanks, near to Anchorage, but the World Record Heaviest cabbage weighed 62.71 kg (138.25 lb) and was presented at the Alaska State Fair by Scott A. Robb (USA) in Palmer, Alaska, USA, on 31 August 2012. Scott A. Robb has previously held a number of Guinness World Records for heaviest vegetables, including the ‘Heaviest turninp’, among others. See other records.
This is nothing new, by the way and not due to “climate change”. Alaska has a long track record of World Record Vegetable growing.
Maybe it’s the near 24 hours summer daylight that makes them grow so big ?
http://www.guinnessworldrecords.com/world-records/heaviest-cabbage
http://www.guinnessworldrecords.com/world-records/heaviest-carrot
http://www.guinnessworldrecords.com/world-records/heaviest-kohlrabi
http://www.guinnessworldrecords.com/world-records/heaviest-kale
http://www.guinnessworldrecords.com/world-records/heaviest-broccoli
http://www.guinnessworldrecords.com/world-records/heaviest-turnip
Hey it’s not all about vegetables, and Alaska must be a very lucky place !
“The record for the largest collection of four-leaf clovers belongs to Edward Martin Sr. from Cooper Landing, Alaska, USA, with 111,060 four-leaf clovers, as of May 2007, which he has been collecting since 1999.”
http://lubbockonline.com/stories/062807/lif_062807026.shtml
Like you I’ve been playing around with chaos for decades and remember when people talked about catastrophe theory which was then replaced by chaos. I suspect that the human assumption of linearity may be innate even though most everyone can learn to deal with very non-linear phenomena with their motor system – walking and staying upright are the simplest examples. The difference between non-linearlties in the motor system and those in ones cognition is because multiple brain areas deal with making the act of walking seem so effortless as all the messy details are buried away from consciousnes.
When I took a circuit theory course in university, everything seemed so simple to analyze circuits with Laplace transforms, but when I dug deeper into the theory, there were whole realms which were off limits as they didn’t behave. Similarly, in medicine, I find that physicians tend to assume linear relationships and instead of given a creatinine value for a patient, we’re supposed to use an estimated GFR. This is just a glorified reciprocal of creatinine and I have no trouble handling reciprocals in my head but it appears that the majority of physicians can’t.
In human physiology controlled chaos is the norm and one of the most worrisome sights I encounter is a patient who’s had an MI and whose telemetry readout heart rate graph shows a totally flat line for heart rate. This tells me that his heart isn’t working well as normal hearts have significant variability and only diseased hearts are totally regular (or paced hearts).
I first started looking at non-linearities in medicine in 1989 when I read Gleick’s book Chaos. I naively assumed that physicians would jump on board as this was so applicable to human physiology yet even now only a handful of physicians that I know understand the concept of strange attractors, or know how one analyzes chaotic systems. A classic example of a non-linear system is the number of admissions to hospitals as a function of time. This is an important problem in that one wants to have enough physicians available to see all patients admitted but not have too many working. As our hospitalist service is trying to find a way to deal better with fluctuation patient numbers, I’ve started looking into the literature to see what’s been done and, sadly, most of what I find is based on models that assume linearity. Fortunately unconscious processes in peoples brains have a far better feel for chaotic phenomena and this is probably why hospitals do better than one would expect from atrocious models which are used to predict patient volumes.
How to get the majority of humans to think in a non-linear fashion is one of the great problems we face. Here in BC every time there’s a year with many fewer that expected salmon, blame is immediately cast on “overfishing”, “ocean pollution”, “global warming” and the one thing that all of the explanations have in common is that they blame humans for the problem. Given how long the Voltera-Lotka equations have been around, one would expect that people would have learned by not that such variability is natural
and that the only smoothly running systems around are human created (at least on the small scale).