Guest Post by Bob Tisdale
After many months of borderline El Niño conditions in the tropical Pacific, yesterday NOAA finally declared an El Niño was occurring. See Anthony Watts’s post NOAA Claims: ‘Elusive El Niño arrives’ – the question is, ‘where’? at WattsUpWithThat. It includes a number of items like the announcement by NOAA, NOAA’s El Niño decision flowchart, and a couple Twitter exchanges.
Emily Becker’s post March 2015 ENSO discussion: El Niño is here at the NOAA ENSO blog expands on many of the discussions. It includes the following (click on the links for illustrations and further discussion):
What tipped us over the line?
What’s different this month? For starters, it’s the second month in a row with a negative value for the Equatorial Southern Oscillation Index (EQSOI, -0.5 for February), one indicator of a weakened Walker Circulation. Also, the pattern of below-average rainfall in the central Pacific, which was very inconsistent with El Niño, recently transitioned to near-average rainfall (as indicated by outgoing longwave radiation). The increased rainfall we were seeing in the western equatorial Pacific continued.
Late January and February saw a couple of westerly wind bursts over the central tropical Pacific, and the forecast for the first two weeks of March suggests these winds will continue. When the winds in this region turn more westerly, they can encourage movement of warmer surface waters eastward and either trigger or strengthen downwelling Kelvin waves, leading to warmer SST anomalies in the central and eastern parts of the tropical Pacific.
Also, over the last month, we saw an increase in sub-surface heat content and the growth of a moderate downwelling Kelvin wave. This suggests that there is likely to be a continuing source of warmer-than-average ocean temperatures for the next couple of months, potentially encouraging the continuation of the weak atmospheric coupling.
On the other hand—showing that we are still very close to the borderline—the Tahiti – Darwin SOI, another indicator of ENSO (though farther off the equator compared to the EQSOI), was +0.2 for February. Also, the “near average” rainfall in the central Pacific combined with above-average rainfall in the western Pacific is not a strong indication of El Niño conditions. As we’ve discussed before, a strong signal would be above-average rainfall in the central and eastern Pacific, and below-average rainfall over Indonesia.
Going forward, we will need to continue to monitor whether pressure and rainfall across the equatorial Pacific remain consistent with El Niño conditions.
But what I haven’t found is NOAA noting that they were a month away from highlighting the 3-month “seasons” since September-October-November 2014 as a “warm event”, an El Niño, on their Oceanic NINO Index (ONI). My Figure 1 is a highlighted and edited screen cap of the NOAA ONI webpage dated March 5, 2015.

Figure 1
Basically, the sea surface temperatures of the NINO3.4 region have to stay at or near the +0.5 deg C threshold of an El Niño for only a few more weeks in order for there to have been El Niño conditions for 5 consecutive over-lapping seasons, which would then be highlighted in red as an El Niño on the NOAA ONI webpage.
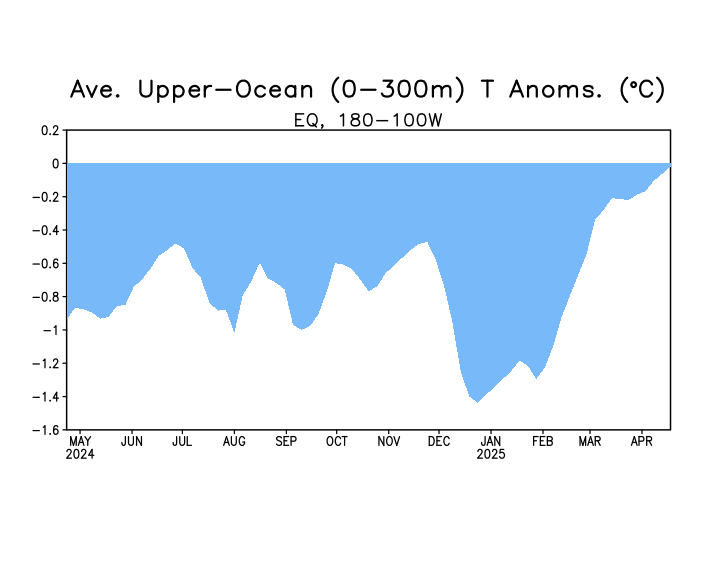
And based on the strength of the most recent downwelling (warm) Kelvin wave, that’s very likely to occur. See Animation 1, which is a cross section of the subsurface temperature anomalies of the equatorial Pacific from the NOAA Pacific Temperature Depth Anomaly Animation webpage.

Animation 1
In other words, NOAA was eventually going to have to declare an El Niño has been occurring since last boreal autumn because their Oceanic NINO Index is a month away from showing one. In some respects, the announcement is more hindcast than forecast.
We’ll discuss in a post next week a number of other indicators and compare the data this year to last year. Sorry, I don’t have the time to do it today.
The other posts in this 2014/15 El Niño series can be found here.
Monthly Niño-3.4 index
http://oi57.tinypic.com/2ry3msg.jpg
http://oi58.tinypic.com/2lka9ab.jpg
http://www.cpc.ncep.noaa.gov/products/analysis_monitoring/ensostuff/detrend.nino34.ascii.txt
But is it strong enough to be called an El Nino?
Maybe I am quibbling but saying this is like 1997 is like saying a Tiger is like a Tabby Cat.
It’s right but…
They just didn’t want to be the last people to announce it. The guys who pay the bills may have started asking awkward questions along the lines of ‘what do we give you all this money for if you’re the last ones to know what’s going on?’
It has been borderline for a long, long time and never arriving at the gate and taking off and the level of colder water is way too much in the Pacific off of South America to create a classic el Nino. It is still basically an el Nada.
Right so the global warming is still in the pipe line, I am one week out of summer and have my pot belly heater stocked up and getting the odd shower of rain every day, that is the opposite of an el nino for me.
I am meant to be warm and no rain.
Sounds like you are in Australia?
They just announce the Hottest Month EVAH in Australia was last month. 🙂
Hmmm, I thought Australia was supposed to be several degrees hotter than normal, getting record highs from time to time for carefully selected statistics is just what you’d expect for random fluctuations around a flat-lining trend. Just wait for the very hot year of 1908 to be added to the record, that should put a stop to the statistical cherry-picking.
(Another wasted effort by a banned sockpuppet. Comment DELETED. -mod)
The world is cooler.
Using the Pacific Ocean to show that we are ‘warming’ is false. The Pacific Ocean is the LAST place to cool down when we have global cooling. Ice growth in both Antarctica and the Arctic plus super, record breaking cold in the vast majority of North America means we are in a colder cycle, not a warming cycle.
(Another wasted effort by a banned sockpuppet. Comment DELETED. -mod)
” …super, record breaking cold …” Checking the digital front page of the NY Times in LA, there’s been no mention of this event over the last couple of weeks.
Depends which temperature series you take as base…
(Another wasted effort by a banned sockpuppet. Comment DELETED. -mod)
Seems that they did bet on the National Climatic Data Center data, which are heavily corrected… I wouldn’t bet on these data, or any other climate data anyway over such a short period. If you bet on climate, one should bet on periods of 30 years…
But even then: we don’t know what drives climate in all details, which is why there is hardly any warming since 2000 (and mainly by a would-be El Niño – 100% natural) with ever increasing CO2 levels and nobody seems to understand why…
(Another wasted effort by a banned sockpuppet. Comment DELETED. -mod)
Ferdinand,
Exactly. Using NCDC is a fool’s bet.
Let’s see them base their wager on RSS. Then we’ll see who chickens out.
Cool bet. But two things keep it running: three years to go (average up to and including 2017), and that historically the drop has been twice as fast as the rise. (Which takes some explaining.) So even two years of dropping would be equal to four years of rise – actually, at the current rise-rate, more like six years of “rise”. The math could still work for Lindzen.
I thought 2015 would be the first year of a drop, based on what the “coolists” have written. In Western Canada, the winter/Jan-Feb 2015 has been warm. The NE US/Eastern Canada has been cold and snowy. Europe has had deep cold sweep down. We used to call this “unsettled weather”, now it is called “extreme weather”. Billions of dollars in a name. Still, the game’s a-foot.
If the skeptics are wrong and the warmists are right, a significant warming event should be coming soon. Then the “truth” will be clear, i.e. the world is still warming. The question (why?) will not be necessarily be answered, though: sufficiency, not necessity lets the CAGW story continue in a warming world.
For those skeptics who say the world IS cooling, by using 1997 as a datapoint, I say, be fair. In all data analysis you have to discount extreme outliers. The physical world is too messy for all data to be equally important.
Sun spot activity has been at a peak for the last year. But it is now beginning the long decline and this is what causes ‘el Nino’ events ultimately.
We are in for a long, long La Nina event.
(Another wasted effort by a banned sockpuppet. Comment DELETED. -mod)
icouldnthelpit says:
Yes, it is a cool bet.
No, it’s a fool’s bet.
If you wish to step up to the plate and place a Long Bets wager on RSS data [the most accurate there is], then say the word.
We will now see who the chicken is.
“the most accurate there is”
Not very accurate for 1900-1950
[Note: Email not legitimate. Please fix. ~ mod.]
“the most accurate there is”
http://link.springer.com/article/10.1007%2Fs00382-013-1958-7
[Note: Email not legitimate. Please fix. ~ mod.]
“Can…” “represented…” etc.
Weasel words. Nothing decisive at all.
There has been a concerted effort to denigrate RSS, for the simple reason that it does not fit the MMGW Narrative.
Satellite data is the most accurate there is, WRT global T. The government spends hundreds of $millions on satellite data every year; it is not reasonable to presume that it is no good, no matter what some grant trolling pal-reviewed paper wants folks to believe.
The only people who don’t like satellite data are the purveyors of the MMGW scare. Too bad. It’s good data. It just doesn’t tell you what you want to hear.
The $8.95 thermometer outside my house works better than any satellite, especially when it is cloudy or raining outside. Satellites can’t see through clouds. Oh, and satellites don’t measure surface temperatures either.
rodmol says:
The $8.95 thermometer outside my house works better than any satellite…
So we can discount that assertion, based on the fact that it’s complete nonsense.
Satellites take a snapshot of the globe. They do not limit their data to land-only, as some databases do. They take into account the entire globe [less a few inconsequential areas], including places where it is raining, and cloudy. Satellites look at the whole picture — something no other temperature record does as well.
Further: the exact temperature is immateriel. What matters is the temperature trend. And the global temperature trend is clearly flat. Any arguments over tenths and hundredths of a degree presumes that global T can be measured to those tolerances. It can’t, not with current technology. But no matter; the trend is what counts. The trend is all that matters.
The government spends hundreds of millions of dollars on satellites used to track global temperature trends. If we accept the specious argument that satellites are no good, then we are accepting a nonsense argument; very similar to other MMGW arguments. None of them hold water.
The consternation exhibited by the MMGW crowd is a direct result of the fact that despite decades of predictions of runaway global warming [or even steady global warming], they have all been proven to be flat wrong. Those predictions have been deconstructed; they have been debunked by the only Authority that matters: Planet Earth herself.
That is the reason why the alarmist crowd constantly tries to argue against reality, by falsely claiming that global warming is chugging along as usual. It’s not. Global warming has stopped, at least for quite a few years now. Thus, the MMGW conjecture fails.
Honest scientists look at the facts, and change their minds if and when necessary. Skeptics are the only honest kind of scientists. Readers can draw their own conclusions.
Has NCDC adjusted the data since the start of the bet? If so, do they use adjusted or unadjusted data to settle the bet?
(Another wasted effort by a banned sockpuppet. Comment DELETED. -mod)
Either way, with three years to go it seems a little early for a fist pump.
‘icouldnthelpit’ says:
Both sides agreed to take the NCDC values.
I am not one of those ‘sides’. However, I made you an offer. A challenge.
So far, I’ve seen no response.
Given today’s blog post from Dr. Spencer, I’m not sure the Russians made a smart bet.
http://www.drroyspencer.com/2015/03/even-though-warming-has-stopped-it-keeps-getting-worse/
http://www.drroyspencer.com/wp-content/uploads/Corn-belt-JJA-temperature-precip-1895-2013-diff-in-datasets.png
The Groodian? I tried clicking the link and my computer popped up a window saying “Seriously?” Weird huh?
First of all, Lindzen’s bet was that it would cool within 20 years. If you need help doing the math that is by the end of 2025 if the bet was in 2005. Second, the rusky’s bet doesn’t appear to be complete until 2018, and if you need help with the math on that it is still 3 years away.
Congratulations though icouldnthelpit, you have achieved horses arse-expert level.
Since Lindzen is, like virtually every informed person capable of the analysis, a lukewarmer he would have been betting AGAINST himself. I would never take such a bet and I can’t think of anyone who would. Especially with a Democrat administration looming.
How is this climate bet going?
http://www.theclimatebet.com/
Phil,
I notice that “icouldnthelpit” has not responded.
I wonder why …not.
Db, if that is all it takes to make icouldnthelpit go a way, please head every post with it.
Can someone educate me on El Nino? I thought the term originated with South American fishermen and that the phenomenon particularly related to temperatures off the coast of Ecuador and due East. How is the warming of waters from the South Pacific islands to Central America considered an El Nino?
Hi, I recommend Bob Tisdale’s “Who Turned on The Heat” either the PDFs or best the book available on Kindle or direct from Bob
Yes, but El Niño was first noticed and named off the coast of Peru.
Thanks, Bob.
The current MEI slight El Niño conditions have been in a down slope since their beginning.
http://www.oarval.org/ts3Mar2015Opt.gif
And the current Tropical Pacific SST map doesn’t show an ongoing El Niño.
http://www.cpc.ncep.noaa.gov/products/analysis_monitoring/enso_disc_mar2015/figure1.gif
From ENSO Diagnostic Discussion – 5 March 2015, at http://www.cpc.ncep.noaa.gov/products/analysis_monitoring/enso_disc_mar2015/ensodisc.html
they can declare whatever they want, but there’s been no “El Nino” here in my part of SoCal…
as above, it’s been “El Nada”…
if anything, it’s been more if a La Nina, albeit, with a little, but less than normal, rainfall here in The Valley.
So despite the denial that 2014 record warmth was due to an El NINO and an extra warm North Pacific and but due to climate change ,the truth finally comes out. .
And there is a new barrage of headlines saying to watch out, this El Ni$ntilde;o could bake us alive.
I will never get the hang of the ñ thing.
For example, check out these tools rooting for El Niño to “Help” set new record highs.
http://www.vox.com/2015/3/6/8161511/el-nino-weak-2015
I wish it would heat us up.
Last night= minus 17ºF. Today=high of 17ºF. Ridiculously cold for well into March. The March Hare is still hibernating.
This time, it’s an El Nono.
More charts:
1. Troup’s SOI
2. Indices Comparison Timeline (2650 x 2250 pixels, 350KB)
SOI seems to be backing off. Would you say what’s happening is a Modoki Bob?
http://www.climate4you.com/images/NOAA%20CPC%20OceanicNinoIndexMonthly1979%20With37monthRunningAverage.gif
As things are going, claiming for an El nino, now at the years start, you better be right, because otherwise by the end of the year you be in a need of some kind of weird acrobatics on explaining how the El Nino at the year’s start ended up to be a La Nina at the years end.
Just saying it, just in case it goes that way.
cheers
A colleague just emailed me this link to yet another El Nino prediction, no El Nino until November of this year. A quick review of the press release showed figures with sine waves, and a near-bottom line that models don’t work. Other commenters suggest that the phenomenon just announced to be an El Nino does not have all the characteristics of a normal El Nino. Perhaps a Post-Normal El Nino.
http://www.reportingclimatescience.com/news-stories/article/no-el-nino-until-november-2015-predict-physicists.html
[begin excerpts]
No El Nino Until November 2015 Predict Physicists
10.01.2015
10.01.2015 02:58 Age: 57 days
Potentially significant research that provides a physical explanation for El Nino cycles by linking them to the sun also has major implications for our understanding of the importance of the role of the sun in the climate system more widely and for the implied reliability of climate models
[…]
by Leon Clifford
There will be no El Nino Pacific Ocean warming event until November 2015 predict two US physicists who have developed a theory for how the sun drives warming and cooling cycles in the world’s oceans.
Orbital eccentricity and the sun combine to make the ultimate “pacemaker” driving ocean warming and cooling cycles, the researchers say in two papers published in the journal Physics Letters A. And, crucially, their research provides a physical rationale for the observed pattern of El Nino events that are documented to appear between every two and seven years.
[…]
Phase locking
Douglass explained that the Earth may become what he called “phase locked” with either a two year or a three year cycle and that there are also times when the Earth is not phase locked at all. In physics, phase-locking is the name given to the process where an output signal from a system – such as, the frequency of El Nino events – is somehow driven by the behaviour of various input signals going into the system – in this case various cycles related to the sun.
[…]
Implications
This discovery has significant implications for climate science more generally. “You can’t get phase locking like this unless there is some non-linearity in the system somewhere,” stated Douglass. The appearance of such non-linear and chaotic processes at work in driving the climate system explains the abrupt changes between periods of phase locking. It also means that attempts to model climate phenomena such as El Nino events with conventional climate models that take past data and incrementally project it into the future are flawed.
More controversially, Douglass – who is seen as being somewhat sceptical on the subject of climate change – believes that this has implications for other computer models used in climate science: “The models won’t work,” he stated bluntly
I’m going to give you all a theory about current weather, past weather, and future weather. Read it from start to finish.
I’m going to go is this order to explain. cause and effect, data, theory,current explanation, conclusion.
The true founder of this explanation can be given credit and his name was Carl Landscheidt. Carl theorized through data collected from the sun that the sun has a calendar like we do on earth. Unlike ours its length is 100’s and maybe even 1,000’s of earth years long. The calendar is made up of sunspot maxima’s and minamas.
The earths climate has been effected by the sun since the start of earth itself. The two known largest factors of climate is the Pacific Ocean and the sun. Why? Because the Pacific ocean release methane/ CO2 at numbers humans or plants couldn’t generate even if we wanted to. This is one of two very clear reasons that global warming is not man made. Global warming is real but, not man made. The second reason is the past periods of Earth that were much warmer than it is now even though not one once of fossil fuel existed at those times. Why was it warmer and why did ice ages happen after warming periods? Carl’s data shows an answer to our weather on Earth.
What Carl’s data shows is that maximas preceeded warming periods on Earth and that maximas helped spawn cold periods. The way it works takes us back to the Pacific Ocean where the maxima causes methane/CO2 to release into the atmosphere for years at enormous levels. The maxima is usually over when the heating begins on Earth due to the methane/CO2 released in the prior years. The Earth progressively heats itself for 40-70 years(green house effect). During this period you can picture the Pacific oceans equator like a bath of hot water over flowing and warming the cooler areas north and south of the equator. Ice ages occur by Polar disruption moving south over land. They way the Polar jet stream gets that effected is by an anomalous high pressure over the Pacific that pulls the Jet south for prolonged periods of time. That warm water that over flows from the equator cause the anomalous high pressure which in return causes the disruption of the polar jet stream. Mimas eventually coincide with these cooling periods. The stronger the minima the stronger the cooling period is.
Looking at our current situation. The last Maxima ended in the 70’s. Earth & its Oceans have been progressively heating since then. From the data we can see is that the Pacific bathtub has over flowed. There is a record strong +PDO phase that is not coinciding with any real El nino. This warm water along the West Coast has cause an anomalous high pressure(ridiculously resilient ridge) for the last 3 years. This is directly responsible for the west coast drought and the interior cold prolonged winters. As it sits a large Kelvin wave and a huge westerly wind burst are taking place right now. This is going to enhance the warm water pool even more. The air has become clear above the high pressure. I believe that this pool is self sustaining and is growing stronger or its holding its ground. Secondarily the next mima per Carls data has already begun and we are about 7-10 years in. A strange thing is that Carl’s followers predicted this event over 7 years ago and all we see now is records that are over 115 years old being shattered left and right. I believe this is exactly whats going on now and that man made global warming needs to be put to rest. Global warming is real and causes climate change but, its not man made nor do we have a profound effect on the pattern.
Since the heating started in the 70’s and has been steadily increasing to now, I believe this has been a huge misconception of a much larger scale pattern change unfolding. This is why man made global warming advocates can only get research to back their data for 60 years back and not any further. This theory explains or connects the dots if you will to a lot of unknowns about our climate and its existence from before human life.