From the University of Arizona:
Sea level spiked for 2 years along northeastern North America

Sea levels from New York to Newfoundland jumped up about four inches in 2009 and 2010 because ocean circulation changed, a University of Arizona-led team reports in an upcoming issue of Nature Communications.
The team was the first to document that the extreme increase in sea level lasted two years, not just a few months.
“The thing that stands out is the time extent of this event as well as the spatial extent of the event,” said first author Paul Goddard, a UA doctoral candidate in geosciences.
Independent of any hurricanes or winter storms, the event caused flooding along the northeast coast of North America. Some of the sea level rise and the resulting flooding extended as far south as Cape Hatteras.
The paper is also the first to show that the unusual spike in sea level was a result of changes in ocean circulation.
Co-author Jianjun Yin, UA assistant professor of geosciences, said, “We are the first to establish the extreme sea level rise event and its connection with ocean circulation.”
Goddard detected the two-year-long spike in sea level by reviewing monthly tide-gauge records, some of which went back to the early 1900s, for the entire Eastern Seaboard. No other two-year period from those records showed such a marked increase.
The team linked the spike to a change in the ocean’s Atlantic Meridional Overturning Circulation and also a change in part of the climate system known as the North Atlantic Oscillation.
The researchers then used computer climate models to project the probability of future spikes in sea level.
The team found that, at the current rate that atmospheric carbon dioxide is increasing, such extreme events are likely to occur more frequently, Goddard said.
Goddard’s and Yin’s research paper, “An Extreme Event of Sea Level Rise along the Northeast Coast of North America in 2009-2010,” is scheduled for online publication in Nature Communications on Feb. 24. Stephen Griffies and Shaoqing Zhang of the National Oceanographic and Atmospheric Administration’s Geophysical Fluid Dynamics Laboratory in Princeton, New Jersey, are also co-authors. NOAA funded the research.
Yin’s previous work on climate models suggests that weakening of the Atlantic Meridional Overturning Circulation could cause sea levels to rise faster along the northeast coast of North America.
Yin wondered whether such sea level rise had actually been observed, so he asked Goddard to compile the tide-gauge records for the east coast of North America. The 40 gauges, spanning the coast from Key West, Florida, north to Newfoundland, have been recording sea levels as far back as the 1920s.
Goddard’s work revealed a surprise – that during 2009 and 2010, sea level between New York and Newfoundland rose an average of four inches (100 mm). Sea level from Cape Hatteras to New York also had a notable spike, though not as dramatic.
“The sea level rise of 2009-2010 sticks out like a sore thumb for the Northeast,” Goddard said.
His research also confirmed that, as others have reported, sea level has been gradually rising since the 1920s and that there is some year-to-year variation.
About the time Goddard finished analyzing the tide-gauge records, another group of researchers reported that the Atlantic Meridional Overturning Circulation, or AMOC, had a 30 percent decline in strength in 2009-2010. Those researchers reported the decline started just two months before the tide gauges started recording the spike in sea level.
“To me, it was like putting together a puzzle,” Goddard said.
The more he and his colleagues examined the timing of the AMOC downturn and the subsequent increase in sea level, the more it fit together, he said.
The AMOC brings warm water from the tropics and the southern Atlantic Ocean to the North Atlantic and the polar regions. The water then cools and sinks, eventually flowing south in the deep ocean. Yin’s climate model predicted that when the AMOC weakened, sea level in northeastern North America would rise.
In addition to the weakening AMOC, during 2009-2010 the region’s atmosphere was in a very negative phase of the climate mode called the North Atlantic Oscillation. The NAO flip-flops between negative and positive phases.
“The negative North Atlantic Oscillation changes the wind patterns along the northeast coast, so during the negative NAO the winds push water onto the northeast coast,” Goddard said.
Although the NAO has resumed flipping between positive and negative states, observations show that the AMOC, while somewhat stronger, has still not recovered its previous strength.
Even now, sea level is still higher than before 2009, Yin said. He’s not surprised, because most of the climate models predict a weakening of the AMOC over the 21st century.
Yin said that at the current rate of increase in greenhouse gases, most climate models predict a weakening of the AMOC over the 21st century. Therefore, such extreme sea level rise events and coastal flooding are quite likely to occur along the densely populated northeast coast of North America more often.
###
“The researchers then used computer climate models to project the probability of future spikes in sea level.
The team found that, at the current rate that atmospheric carbon dioxide is increasing, such extreme events are likely to occur more frequently, Goddard said.”
The bogeyman carbon dioxide makes a totally unwarranted appearance to scure further grant funding.
Spot on Admad
Here in California, the Earth’s land mass rotates from West to East, as in California moves in the direction of New York, like a donkey chasing a carrot on a stick held by Sancho Panza.
The water on earth, on the other hand would rather stay still if it could, and that means that water from over in Africa tends to end up sloshing up against New York.
That would tend to make sea levels relative to land, be higher at New York than MSL, and lower than MSL along the West African coast.
So no need to invoke CO2 unless you think it effects the angular momentum of the earth to have more and denser CO2 in the atmosphere.
g
Ummmm….! George!
And this happens when? Every time the BIG HAND reaches down and gives the globe a sudden twist.
You forgot the smiley face.
Well Bernie, I guess you don’t believe that tidal drag tends to slow down the rate of rotation of the earth; the land that is.
So the tidal bulge would try to stop the water from having the same rotation rate as the rocks, and since water does not have zero viscosity, then the land has to physically pull the water to the east with it, hence the sloshing I alluded to.
If water had zero viscosity, then I guess it would always be gravitationally level.
Here’s your smiley face … ☺
George –
I see. And this tidal drag viscosity thingy just started in 2008! Four inches in a couple of years.
If you are explaining statics, that’s one thing. But not dynamics.
I understood you to be suggesting that an extra 4 inches of water (recently – like in 2008) slammed up against the east coast because the water had inertia. You said “water on earth, on the other hand would rather stay still if it could”. What ARE you talking about then?
I have no idea how to make a smiley face so here is an attempt 🙂
Bernie,
You are correct of course we are not talking about a static case nor even an equilibrium dynamic case.
My picturesque description of course explains only a mechanism by which the water level can be higher than MSL on the west of the ocean and lower than MSL on the east.
Now of course the whole ocean is not static with currents flowing here and there which all perturbs the levels everywhere but those currents meander so in 2008 the currents were in different places. The whole point is you can’t tell where sea level actually is at any point in time because of tides and currents and whatever else
That’s all.
When I was in school we had to calculate the change in the length of the day if the whole Royal Navy lined up on the equator and headed West at 20 knots.
Readers are invited to add commas freely according to the dictates of their own personal grammar books !
George – Thanks for the clarification – Interesting.
Here in Ithaca, NY, we are not too worried about sea level. Temperature – well it’s cold. The newspapers are already saying (with two days to go) that February 2015 will be the coldest MONTH ever (since 1883)!
Should have read “The researchers then used unvalidated computer climate models to project the probability of future spikes in sea level.”
Or more likely, that’s actually correct, and everything that doesn’t fit your worldview ISN’T actually part of a grand conspiracy.
“Yin said that at the current rate of increase in greenhouse gases, most climate models predict a weakening of the AMOC over the 21st century. Therefore, such extreme sea level rise events and coastal flooding are quite likely to occur along the densely populated northeast coast of North America more often.”
Sir Harry, that is assuming “most climate models” make a correct prediction on a “weakening of the AMOC over the 21st century”. So far the models are crappy failures. What’s your world view?
I’ve missed you Jimbo. My worldview is no secret – I believe that AGW is a present danger to the ongoing health and growth of the human enterprise, however with timing and degree of damage uncertain.Climate responds to forcings, in our time the key forcing is us. The idea that our heating of the globe would affect something like AMOC is entirely reasonable. And repeating the old canard that “models are crappy failures” doesn’t make it true – here is one of a number of peer-reviewed papers which look at models and find them surprisingly accurate – http://www.nature.com/nclimate/journal/v4/n9/full/nclimate2310.html.
Flashman, check this out. Observations said AMOC speeded up despite the models slowing it down! PS this was all in the hottest decade evaaaaah.
The paper you cite says there was no slowing between 2002-2009. The post and paper say the slowing began in 2009. I don’t see any inconsistency there.
Sir Harry Flashman at 9:21 am
The idea that our heating of the globe would affect something like AMOC is entirely reasonable.
First off, your paper post is all about trying to find a way that the models are so wrong that they are looking at anything to find something to ‘stick to the wall’.
Just in case you were not aware of what it means, the Sv in Jimbo’s post is Sverdrup – which is a unit of transport applied to currents in oceanography and the water cycle. It measures the movement of one million cubic meters (106 m3) of water per second or 1+E6 m3s−1.
The Gulf Stream begins upstream of Cape Hatteras (North Carolina), where the Florida Current ceases to follow the continental shelf and heads out into the Atlantic. The transport varies from 30 Sv in the Florida Current to a maximum of 150 Sv at 55°W in the Gulf Stream.
Extracting 1GW of power (8.8TWh/y) from the Florida Current in the region where it flows at 2m/s would require turbines with an accumulated cross section area of about 1.6M m2 (1500 twin turbine Evopod units each rated at 1500kW) or about 10% of the total flow cross section and would take out 3.3% of the energy from the stream.
You really think CO2 is powerful.
Yes, I absolutely think that. What are you suggesting IS the cause, in that case?
Flash man:
The other point of view is that atmospheric CO2 is entirely beneficial for all life. We now are seeing the greening of places like the Sahel, increased agricultural yields, and a general increase in photosynthesis everywhere.
Pray tell us, what’s wrong with that?
Back in ’09 that was an optimistic hypothesis, but it doesn’t seem to be playing out that way. I truly wish it were.
“The Sahel, which stretches from Mauritania in the west to Eritrea in the east, has undergone three major droughts in less than a decade and has seen huge swathes of land turn to desert.
The UN is backing a regional plan to build a “Great Green Wall” of trees and vegetation which aims to stop the advance of the sands and lessen the effects of desertification.
Many countries in the region are already experiencing a delay in their rainy seasons, and the UN representative said the initiative aimed to strengthen the resilience of countries and communities in the face of climate change.
…
Experts estimate that Africa has lost around 650,000 square kilometres of productive land in the last 50 years, an area greater than the size of France.
http://phys.org/news/2014-08-urgent-action-tackle-sahel-lack.html#jCp
Do you have peer reviewed evidence to back up this claim of “present danger” with “timing and degree of damage uncertain”? Is this merely potential danger that remains to occur?
Future speculations won’t cut it. NB in January 2010 NASA said that the “Last Decade was Warmest on Record” and we all know that 2014 was the ‘hottest year evaaaaa’. Gavin Schmidt of NASA told us.
Here are a few results coming out of the present danger.
The paper I cite also says: “Altimeter data, however, suggest an increase of 2.6 Sv since 1993, ” during the warmest decade. There was an increase in Sverdrup unit which is a unit of measure of volume transport.
PS AMOC has speeded up and slowed down many times during the Holocene and it’s just nature my friend. No need to engage co2. Without glacial meltdown all we have is speculation about the future.
Your belief has nothing to do with what is actually observed. Here is the insurance industry. Surely they can see the dramatic losses caused by the trace rise of the trace gas co2. Sorry, some of the largest RE-insurers can’t see it. What about the great alarmists at Munich RE? Can they see it? When they actually report the observations then sorry again, they can’t see it either.
Extreme weather? Show me the worsening trends.
Yeah, no. That Munich Re article you linked talks about a single year; climate change is not quite that neat as to give a consistent, precise increase in yearly disaster costs. But the trend is unequivocal. Here’s a more compelling quote from Munich Re’s Head of Geo-risks Research:
“This is why we now believe it (NOTE i.e. the growing number of weather related disasters) to be anthropogenic global warming,” Höppe says. “But actually, to be honest, it doesn’t make any difference to our assumptions, or pricing, whether it’s anthropogenic or natural.”
Context for that statement?
“The number of meteorological events (storms, hurricanes), hydrological events (floods) and climatological events (extreme temperatures, drought, forest fires) has infrequently dipped under 600 per year since 1996, and has climbed above 800 five times since 2006. During most of the 1980s and 1990s, the frequency ranged from 200 to 600 events per year. Meanwhile, the number of non-weather disasters—earthquakes, tsunamis, volcanic eruptions—has not spiked since 1980; in fact, the trend has inclined slightly downward since 2000. ”
http://www.theglobeandmail.com/report-on-business/rob-magazine/an-industry-that-has-woken-up-to-climate-change-no-deniers-at-global-resinsurance-giant/article15635331/?page=all
Flash man:
How you cling to your alarmism. Atmospheric CO2 is entirely beneficial for all life forms, the more the better. CO2 does not cause drought, even the IPCC reports acknowledge that (AGW models have water vapor increasing with increasing CO2).
Your attribution of drought to CO2 is nothing but alarmism, with no scientific basis.
Yin said
“This is a very extreme event,” Jianjun Yin of the University of Arizona told The Washington Post in a phone interview. “The sea level has since dropped after that spike, but it is still much higher than it was when the spike began in 2009. … Global warming definitely contributed to this event.”
But global warming wasn’t the sole culprit.
Worded like that, to disprove the postulate requires proving no contribution at all. It will be forgotten that bugger all of it could be put down to global warming and it will be claimed in the MSM that it was caused by global warming.
Sir Harry Flashman, on your weather events please see better observations (radar, satellites, mobile phones, more structures and people in harms way etc.). On your Sahelian droughts the peer review says it’s greening. On Africa’s terrible future see this. That linked reference says:
There is much more I have for you Sir Harry, but I can bring the horse to the river, but I can’t make it drink.
The greening of the Sahel was based on peer reviewed OBSERVATIONS and not a “hypothesis” as you say. Anything since ’09 is not the climate but the weather and not the climate. The article you point to is taking talking points from governments in the Sahel wanting aid as well as the UN. No study is referenced – it’s just the news. NOW HERE IS THE SCIENCE.
Flashman, you put Ehrlich to shame.
You should write a book called ‘Gullible’s Travels ‘. Munich Re, as I pointed out, is an alarmist outpost. They have been at the extreme weather claims since the 1970s. They are in business, a company that aims to make money from the gullible. They want people like YOU to take out INSURANCE on something that you don’t need. You pay if you want to, I will keep my money in my pocket.
PS MUNICH RE is not the only re-insurers I referenced. Also Munich Re’s losses was from the cold! Give it up Flashman, you are gaining converts for sceptics.
That’s exactly where I stopped reading. I’ve had my fair share of vomit inducing reads for today.
What has CO2 levels got to do with a completely natural Oceanic process?
I suppose they have to ba able to link it to global warming to get their funding.
Apart from that it is a very interesting finding.
I have the same question, but one can also ask how to prove that CO2 has no effect on the originally natural process? CO2 may well have an effect, but how to prove it this way or that way?
It appears Yin can prove that current rate of increase has something to do with AMOC weakening, though somehow I wanted to yell ‘show me’.
“ocean circulation changed”
Oh-oh… It is worse than we thought!
Stantz: Fire and brimstone coming down from the sky! Rivers and seas boiling!
Spengler: Forty years of darkness! Earthquakes, volcanoes!
Winston: The dead rising from the grave!
Venkman: Human sacrifice! Dogs and cats, living together! Mass hysteria!
For years, while the alarmists said climate change was due to man made emissions , others said it was due to changes in ocean circulation. Now that the effects of changes to ocean circulation are shown to be real, they want to claim that that too is caused by us. On the day that glaciers roll across Chicago, they’ll still be blaming it on CO₂.
If water was piling up off the Newfoundland Coast, was it “missing” somewhere else?
Exactly..
This!
And, since it’s so very different from before that means we have an apples to apples comparison of all those pieces of “the puzzle”.
You got it rong.
It’s the Bay of Fundy ; NOT the Day of Funding !!
what amazes me is that still the general public is being misinformed to the point of the waters on earth being perfectly even distributed all over the globe. As if gravity doesn’t exist. As if when water moves higher one place it doesn’t get lower another one. As if (stellar/sun) tidal forces don’t displace water in cycles. Rising/lowering sea levels in the range the ‘scientists’ are debating mean completely nothing. But yay 8 centimeters temporal difference on trillions of tons water at one relatively small place on earth and they’re all over the place with BS ‘studies’. Makes me really happy not be a scientist, soon it will have the same value as ‘waste management functionary’ the way they throw out these nonsensical papers.
Local sea levels rise and fall around the world at the same time – Local mean sea level (LMSL). Long-term global observations (Eustatic) regarding accelerations is what matters most.
My point was that if you start to measure short term you make yourself unbelievable.
Seems back to front to me. Greater current leads to higher water levels, not the way they report it. Plus what has co2 got to do with ocean currents, they are driven by gravity and augmented by wind.
So the records show sea level increasing since at least 1920, decades before the claimed affects of man-made CO2 were present.
So why is the current sea level increase cause by man-made CO2 while the earlier sea level rise isn’t?
Actually we know for a fact that the sea level has risen 420 feet in 11000 years for an average of about 7mm per year. The current rates of 3.4mm last century and 1.7mm this century pale in comparison.
This is consistent with the meridional course of the jet stream over North America. If the circulation is constant, may cause this effect.
http://earth.nullschool.net/#2015/02/28/0600Z/wind/isobaric/500hPa/orthographic=-121.14,43.30,688
What is the physical explanation for a decreasing AMOC causing increased local sea level? Are not local changes tied more to wind patterns?
And it seems that a weakening AMOC is not good news as it is likely a precursor to a new ice age.
You’re right, it is not science.
Here on the Great Lakes we have seen plus-minus levels of 8 inches just based on strong pressure gradients. Last fall we had a low pressure of 28.87 give way to a barometer reading of 30.42 over about 10 hours. I lost 20 feet of beach, then gained it back all in the same day. It was fun to watch and cleaned up a lot of aquatic debris in the process. Maybe if some of the people in New York we’re not so disassociated from natural processes they would realize that, in nature, “s… happens.”
This is the real conclusion of the recent paper by Mmarotzke and Forster: The pause is not a new problem, models have always been that bad ! Another new paper linked in that thread says we’ll have to wait maybe another 10 years before the models can be proven wrong.
Well if they are not even falsifiable for another decade, come back in ten and crap on about they “predict”.
http://climateaudit.org/2015/02/05/marotzke-and-forsters-circular-attribution-of-cmip5-intermodel-warming-differences/#comment-752804
So the kneejerk CAGW comment by Yin is irrelevant until someone provides a model that does work. But this is now boilerplate text that gets automatically inserted into any paper, irrespective of the subject or the findings.
Also See: My two essays on similar topics:
From the Scientific Urban Legend Department: ‘AGW Sea Level Rise Made Sandy More Destructive’
and
What to do about The Flood Next Time
Let me just point out that as a part of my personal climate related research, I look at tide gages around there from time to time…and while the change is there, its not really very noticeable. It would never have occurred to me that it was ‘unusual’. Now THIS ONE has an unusual event.
http://tidesandcurrents.noaa.gov/sltrends/sltrends_global_station.htm?stnid=970-121
But this one is more like the other gages in that region
http://tidesandcurrents.noaa.gov/sltrends/sltrends_station.shtml?stnid=8418150
Anyone prepared for the sea level rise spikes that happened repeatedly over the last century would have been adequately prepared for this. It does look a little like yet another case of throwing in AGW hot topics for funding or future funding.
how about the west coast? no sea level rise to talk about in 100 years!!
http://tidesandcurrents.noaa.gov/sltrends/sltrends_global_station.htm?stnid=822-116
http://tidesandcurrents.noaa.gov/sltrends/sltrends_global_station.htm?stnid=822-071
And how about Quebec, which is on the east coast and part of Canada when it comes time to pick up the check?
http://tidesandcurrents.noaa.gov/sltrends/sltrends_global_station.htm?stnid=970-071
mean sea level data from 1910 to 2011 which is equivalent to a change of -0.06 feet in 100 years.
A Closer Look At The Cape Hatteras To Cape Cod Cold Spot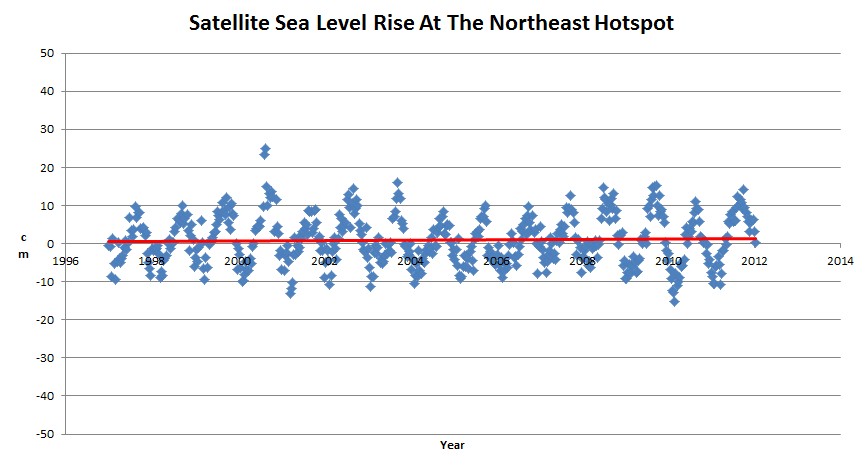
“It turns out that the hot spot is actually a cold spot, with sea level rising at 1.7 mm/year over the last 15 years – just over half the global average.”
https://stevengoddard.wordpress.com/2012/07/03/a-closer-look-at-the-cape-hatteras-to-cape-cod-cold-spot/
The Global average is 1.7mm per year, at least this century. Last century it was 3.4mm per year, though some folks wonder about this since three “independent” studies came up with the exact same value. So 1.7 mm rise over the last 15 years is average.
But anyhow, for the last 11,000 years the average has been 7mm per year, though there were times when the sea level rose a meters in the order of a week.
I’m wondering two things. How can you extract a trend of 1,7 mm/y from data which varies +/- 15 cm/y? I suppose the area of the blue squeres represents error, right? I also find it quite difficult to believe you actually could measure the sealevel accuratelly enough from satellites. Taking into account you should be able to know the distance between the satellite and the sea surface extremely accurately. The surface which has waves of several meters high. You should be able to position the satellite with extreme accuracy and measure its distance to reference points also with extreme accuracy. The gravity field is not the same everywhere and this affects the sealevel as well. Then you have tides and currents. How can they do that with claimed accuracy?
It certainly was not reported as a change in circulation. I saw a whole bunch of hysterical headlines about the 12.7 cm or whatever it was.
The MSM never reports the entire facts. Only the hooks. They have done their job. Give those people prone to hysterics another reason to be hysterical.
AO index confirms the change of oscillation in 2009, during a exceptional solar minimum.
http://www.cpc.ncep.noaa.gov/products/precip/CWlink/daily_ao_index/season.JFM.ao.gif
The standardized seasonal mean AO index during cold season (blue line) is constructed by averaging the monthly AO index for January, February and March for each year. The black line denotes the standardized five-year running mean of the index. Both curves are standardized using 1950-2000 base period statistics.
I just looked a t a small sample of tidal gauges on the coast of NE USA and there is also an unusual spike around the early 70s. When I use the term spike, I mean just noticeable like the 2009 one.
The change can also be seen in the chart NAO (2009-2010).
http://www.cpc.ncep.noaa.gov/data/teledoc/nao.timeseries.gif
The standardized 3-month running mean value of the NAO index. The departures are standardized using the 1981-2010 base period statistics.
What was more notable was the negative figures for both summmers.
http://i.imgur.com/JNx3Nc6.png
[Do not use “[img]” brackets around links on this site. .mod]
Another possibility is that the Laurentide Ice Sheet uplift has ended, in which case oscillations may be expected before an equilibrium is established. This can be seen on the graph above, contributed by ‘Latitude’
http://tidesandcurrents.noaa.gov/sltrends/sltrends_station.shtml?stnid=8443970 sea level has been falling in boston last five years, station is on solid ground, other stations are on sand actually glacial morans.
50 Year trend also varies. http://tidesandcurrents.noaa.gov/sltrends/50yr.htm;jsessionid=337C3EB7AC8F14D08A278EEF57FC8203?stnid=8443970
As recall, I think NYC Battery has also fallen last 5 years.
So there was a four inch spike in two years for Northeast Sea Level? And it appears the region was able to take most of that sea level rise in stride without catastrophic damage, massive dislocation of population, radical change to its ocean fronts, or other macro economic factors. It appears that the populations affected were able to deal with what, on a large scale, is a relatively large change over a short period of time. Doesn’t that argue that 8 inches or so over a century (vs 4 inches over two years) won’t be all that hard to manage?
I think Sandy caused quite a lot of damage.
I think your statement is quite specious.
It caused damage to structures that were, for all intents and purposes, built on flood plains. The floods in Hoboken were less than a foot above the long-term level of the Hudson River. The damage along the Jersey Shore was in dune areas that should have never been approved for any construction. The flooding in Manhattan was basements and tunnels that are from 4 to 60 feet below sea level. Any rational person, confronted with those issues, in the abstract, would say “that’s stupid to allow it.” Same can be said for Katrina, it wasn’t the power of the storm, it was the fact that water tends to flow downhill. The only rational proposals to deal with any possible future scenario is to move to higher ground. As I said in an earlier comment, if people from large cities were not so disassociated from natural phenomenon in their daily lives maybe they could deal with some of these issues in a rational fashion. As an aside I live in an area where tourism is rampant, (its an epidemic disease). In both winter and summer there are 2-3 fatal accidents a week, both auto and other, such as drownings, and in 80% of those cases the victim is someone that lives in a large city. It just gets to the point that many people have lost any ability to think rationally about their natural surroundings.
What does a hurricane have to do with this discussion? Extreme sea water surges are nothing new at that location over the past 200 years, but there is no big long-term sea level trend upward.
Damage from Sandy was due to climate change. If the climate had still been that of 20,000 years ago, the storm surge would have come nowhere near New York city!
I would like to note that most buildings are designed to last 50-100 years. Although many last longer then that with extensive maintenance. We should therefore consider that most of the buildings in these low lying areas will be replaced by the time sea level rises enough to effect them
I think Sandy caused quite a lot of damage.
===============
more likely the damage was caused by politicians not bothering to upgrade/maintain infrastructure. instead spending money on monuments to themselves, celebrating their god given ability to close the barn door after the horse has escaped.
In a less illumined time whenever someone did something bad, they could say, “It was the Devil made me do it”.
Now in more enlightened times, when any bad natural event that happens on the earth, “It was the CO2 that made it do it.”
We know that water sloshes back and forth in the Pacific, depending on Trade wind strength or westerly wind bursts. Why not the same principle in the Atlantic? These two years saw some of the most negative NAO figures ever for both summer and winter! Water being pushed back, against the normal direction of flow.
I’ll wager we’ll see something similar in a few years (maybe sooner) when the next solar minimum comes around.
100%.
The BBC’s reporter earns her Brownie Points by not only reporting the salient facts, but also inserting the ubiquitous “Climate models suggest extreme sea level rises will become more common this century.” within her story.
http://www.bbc.co.uk/news/science-environment-31604953
I’m not familiar with the geography of the NE American coast but a 4 inch sea-level rise causing flooding suggests an extremely flat and low-elevation coastline, maybe akin to the Netherlands without the dykes. Is this feasible?
the people on the NE coast are extremely short.
Over a two year period, rates of sea level rise at most tide gauges, regularly oscillate between ± 50 mm/yr.
I have no idea what these Arizona “Researchers” are talking about.
The big rise in sea level from 2008-10 was mainly the result of a similar fall from 2005-07.
https://notalotofpeopleknowthat.wordpress.com/2015/02/25/bbc-ignore-the-facts/
Since 2010 at New York, Boston and Portland, sea levels have actually declined significantly, despite sinking land.
I note there was a big jump in about 1870 or so. I think everyone would agree that occurred pre-IPCC.
They like to throw around the term “extreme events”. But this extreme event took place for two years and apparently no body noticed.
it was extremely unnoticeable. models project more of these extremely unnoticeable events will be found in the future, leading to an overall increase in extreme events due to CO2.
That’s because the data were an outlier and needed to be adjusted out. This study obviously used the raw data which is just wrong.
Sea-level rise (or fall) is a complex process and even direct observations are subject to significant error-inducing assumptions. It will be interesting to read the actual study and its caveats and specific conclusions. But the basic finding (winds/currents changed due to ocean circulation trends) is not new.
See, for example, “Glacial ghosts set sea-level trap for East Coast” from 2012 (http://www.eenews.net/stories/1059972339) which links to “Hotspot of accelerated sea-level rise on the Atlantic coast of North America” (http://www.nature.com/nclimate/journal/v2/n12/full/nclimate1597.html).
Wouldn’t we then have an offset and/or inverse example of lower tides somewhere else?
that problem was solved by adding a 3mm rebound correction for areas that never had glaciers.
My impression is that the logic for having a Glacial Isostatic Adjustment for say Dakar is that the weight of the glaciers displaced magma deep in the Earth from under North America and Eurasia. The magma had to go somewhere so it flowed slowly to more equatorial latitudes. When the glaciers melted, the magma flowed — ever so slowly — back toward the poles lifting the high latitude portions of the Earth. The magma is still — ever so slowly — sloshing about.
Could be.
Even if it’s actually true, I have some doubts that current estimates of radial distance change and rate of change of a few locations can be extrapolated to the whole earth with any great accuracy. But what do I know?
Did Dakar rise as the displaced magma ‘over-inflated’ chambers beneath it, or did it subside due to the added weight?
Have you ever, as a kid, mixed puzzle pieces up? You can. There are standard puzzle shapes and sizes that when mixed, can create Picasso like pictures. Looks great and is very creative. Doesn’t mean the pieces were ever meant to be together in a consistent picture.
El Niño events cause coherent changes of up to 20-30cm (8-12 inches) in sea level from the eastern Pacific Ocean to the eastern Indian Ocean.
http://www.cmar.csiro.au/sealevel/sl_drives_seas_dec.html
It amazes me that so many claims of sea level rise have the implicit assumption that continental land masses are rigid. Michelson measured the tidal effect of the gravitation of the sun and moon on the earth itself and found that the land rises and falls nearly half as much as the sea. Anything that is a thousand times longer and/or wider than it’s thickness will be flexible.
I’m suspicious. The tides starting in Boston and going north past Maine and up into the Bay of Fundy, the red dots, are large to very large. Boston tides average 9.5 feet and can be over 12 feet during a spring tide. Tides along the coast of Maine run up to 15 feet and in the Bay of Fundy 30 feet and up to 50 feet in places. You can actually see sea level change from minute to minute during midtide ebb and flood in the Bay of Fundy. That’s quite a job of signal detection to extract a 4 inch shift in sea level in the presence of these tides.
This study was originally published in 2013. Why is it being dredged up again for this Nature Communications piece, just in time for the IPCC meeting?
Nature Communications = Macmillan Publishers Limited = Georg von Holtzbrinck GmbH & Co. KG
So we have a local phenomenon that we are supposed to extrapolate to massive sea rises taking place worldwide? The data doesn’t support it and the effect was temporary, anyway. This says nothing to climate change or the CAGW argument.
I’d like to ask the knowledgebale people here if the depth of the water at the shore would casue higher tides. The reason I ask is that I grew up on a canal on Long Island, NY. When I was a young child and teen I remember the canals being dredged periodically to keep the canals a certain depth. I guess as the land erodes it deposits the soil near the coastline and makes the water shallower.
I can’t remember the last time I saw a dredging project going on. I don’t know if there were any type of environmental concerns over dredging which may have put a stop to it, or drastically reduced it, but I’m curious to know if that would change tide readings.
Sheesh, sometimes spell check doesn’t work. *Knowledgeable
http://www.hugopickfordwardle.com/thenewpeople/wp-content/uploads/2013/07/nolege.jpg
Note that the gauges for the southeast US coast show no “spike” according to the term used in this study. In fact, NOAA mean sea level trends for that coast show no increase in sea level for the past 15-20 years for that coast and a flat trend also for Gulf coast gauge data and also for west coast gauge data, except where there is local subsidence, as at Grande Isle, LA.
See. NOAA mean seal level trends for the individual guages, of which there are several score individual charts.
Note please that this gauge data, not satellite altimetry. I regard the gauge data as more reliable. According to this data, sea level trends have been flat for 15-20 years.
All that will happen is that the ACC liars will bleat about the ocean currents being “anthropogenic climate change” events..
They win, no matter what happens.
If you care to look at the tide gauges, then you see a drop the years after. What is that consistent with?
That the sea level is higher now than before is no wonder. The sea level has been steadily rising with same speed long before CO2 became the cause.
I learned something new from this post and a similar prior post on sea levels in the Pacific. In my mind, I guess I subconsciously thought of the atmosphere as a uniform ball, providing equal pressure to every point on earth’s surface. Even though I read about, and saw on the news stories about low pressure fronts moving in and bringing storm fronts, hurricanes, etc. I never put 2 and 2 together in my mind and figured out that it’s not just the moon affecting sea level via tidal pull. Changes in air pressure thanks to weather fronts also cause the sea to rise disproportionately in low pressure areas and fall in high pressure areas.
Interesting. The timing pf that sea level spike clearly corresponds to the El Nino peak of 2010. If true, it makes us wonder whether it may have happened in coordination with other El Nino peaks as well. The 1997/98 super El Nino would be a candidate. It is not clear why the influence of an El Nino could have been confined to the northern latitudes only unless we are dealing with the effect of westerlies. And that is hard to see because their effect should be the reverse of observations. Too bad the cutoff dates for this study are too short to check this out.
Is the NAO getting ready for a complete and pervasive state change?
Slowing of the AMOC is a big deal. Generally this means cooling – eventually – less poleward heat transport in the North Atlantic. The unstable switching on and off of AMOC (due to the salinity positive feedback alluded to in the article) is the main cause of sudden climate fluctuations in the NH such as the Younger Dryas, in contrast to the much slower and smoother temperature oscillations in the SH where there is no equivalent to the AMOC. During glaciation the AMOC turns off completely.
As a result of the 1964 earthquake, some areas near Kodiak, Alaska (~200miles SW of Anchorage) were permanently raised by 30 feet (9.1 m). Southeast of Anchorage, areas around the head of Turnagain dropped as much as 8 feet (2.4 m) – Wikipedia. Did atmospheric carbon dioxide trigger this event and the subsequent and instantaneous changes in sea level at two different places but in opposite directions, as in one up and one down? It’s a pity that geologists can’t be dragged into this argument, given that they have no experience in matters of climate.
Holy Moly, that’s a lot of research for one climate topic from one country.
https://usclivar.org/sites/default/files/webform/meetings/2014/summit-presentations/danabasoglu_usamoc_clivar_summit_july2014.pdf
U.S. AMOC Program
• Assessment of AMOC state, variability, and change;
• Assessment of AMOC variability mechanisms and predictability;
• Assessment of the role of AMOC in global climate and ecosystems
65 funded projects (~125 scientists) supported by 4 agencies
This has me curious. How is this statement:
coherent with this previous one?
Did I miss the part about CO2 controlling the frequency of these cycles?
They felt that there was no need to insert that data as everyone knows that co2 is the instigator. {mildly sarc} as in their eyes they likely hold no doubt.
They were good until “climate models”…
Slightly OT – Antarctic sea ice looks like its just turned the corner (passed minimum), slightly higher than last year continuing an upward trend:
http://nsidc.org/data/seaice_index/images/daily_images/S_stddev_timeseries.png
another unmistakable warming signature of CO2
(/sarc)
I realize the Macondo well blew out in 2010 and the oil spill was thought by some to change the current patterns in the Gulf and Atlantic, but this whole study doesn’t make a lot of sense with the attempt to tie it to carbon dioxide since about then, the ice caps started to rebuild, not melt. It does seem to make a wonderful case for subsidence, though. OMG!!! global warming causes coastal subsidence!! It’s worse than we thought!!
Once described by Dr. Jane Lubchenco, a former NOAA administrator, as providing “instantaneous” sea-level changes, the NASA GISS satellite data are subject to the same tidal variations as the terrestrial measurements. In the time is takes to scan one area of the ocean, the surrounding waters have already moved from place to place. Due to instrumentation drift, the data require constant correction using surface tidal stations as reference. See Impact of Altimeter Data Processing on Sea Level Studies.
She has also described the IPCC as having the “gold standard” in climate change data.
From IPCC WGIAR5 Chapter 13: Sea Levels
Figure 13.6 – 2005 to 2012.3 – 20 mm sea level rise. 20/7.3 = 2.74 mm (0.108”)/year * (2100-2012.5)/25.4 = 9.46”. (Rate extrapolated to 2100.)
Figure 13.7 – 1910 to 2100 – observed and modeled rise – plus 180 mm = 7.08”, .98”/yr.
Figure 13.7 – 1960 to 2010 – observed and modeled rise – plus 100 mm = 3.94”, 0.079”/yr (7.11” by 2100)
Figure 13.7 – 1990 to 2010 – observed and modeled rise – plus 50 mm = 1.97”, 0.098”/yr (8.82” by 2100)
Figure 13.7 – 1994 to 2010 – observed rise – plus 55 mm = 2.17”, .136”/yr (12.24” by 2100)
Figure 13.9 – predicted rise by year 2100 for each of the RCP scenarios, Slangen and van de Wal: RCP 2.6: 110 mm or 4.3”, RCP 4.5: 145 mm or 5.7”, RCP 6.0: 170 mm or 6.7”, RCP 8.5: 214 mm or 8.43”.
Table 13.5 – RCP2.6: 600 mm, RCP 4.5: 440 mm, RCP6.0: 550 mm, RCP8.5: 740 mm.
Table 13.8 – medium scenario, median of range: year 2100: 425 mm (16.7”), year 2200: 675 mm (26.6”), year 2300: 890 mm (35.0”), year 2400: 1055 mm (41.5”), year 2500: 1250 mm (49.2”)
The projected worst case cause for the current sea level hysteria transpires over 485 years.