Guest Post by Bob Tisdale
Pierre Gosselin of NoTrickZone reports on a paper that confirms the slowdown in global surface warming has not been occurring at the poles. See Pierre’s post German Experts: New Paper By Gleisner Shows 2013 Cowtan And Way Arctic Data Hole Paper Was A Lemon.
You’ll recall that Cowtan and Way (2013) Coverage bias in the HadCRUT4 temperature series and its impact on recent temperature trends were able to squeeze a few more drops of global warming trend from the data during the hiatus period by taking HADCRUT4 data and using a statistical method to infill the missing data at the poles, especially in the Arctic where polar amplification is more prevalent.
But a new paper, Geisner et al. (2015) Recent global warming hiatus dominated by low-latitude temperature trends in surface and troposphere data, undermines those Cowtan and Way efforts. The abstract reads (my boldface):
Over the last 15 years, global mean surface temperatures exhibit only weak trends. Recent studies have attempted to attribute this so called temperature hiatus to several causes, amongst them incomplete sampling of the rapidly warming Arctic region. We here examine zonal mean temperature trends in satellite-based tropospheric data sets (based on data from (Advanced) Microwave Sounding Unit and Global Navigation Satellite System Radio Occultation instruments) and in global surface temperatures (HadCRUT4). Omission of successively larger polar regions from the global mean temperature calculations, in both tropospheric and surface data sets, shows that data gaps at high latitudes cannot explain the observed differences between the hiatus and the prehiatus period. Instead, the dominating causes of the global temperature hiatus are found at low latitudes. The combined use of several independent data sets, representing completely different measurement techniques and sampling characteristics, strengthens the conclusions.
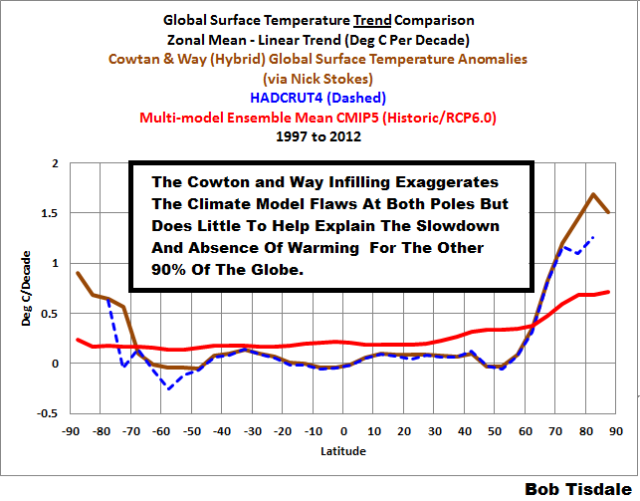
There’s nothing surprising about that. We reported the same thing a year ago in the post Cowtan and Way (2013) Adjustments Exaggerate Climate Model Failings at the Poles and Do Little to Explain the Hiatus. The following graph is Figure 2 from that post.
The WattsUpWithThat cross post is here, for those who want to run through the comments.
I ended that post with:
Those who promote the Cowtan and Way (2013) revisions to the HADCRUT4 data don’t understand where the hiatus is taking place and they don’t understand the model failings at simulating polar amplification—or—they are intentionally being misleading.
This desperate struggle to find droplets of data to support a debunked hypothesis is patently absurd – and very costly farce.
The warmist never learn to understand Theories of Science, thus they missed that a debunked hypothesis is debunked and can’t be “wakened up” again. It only takes one single colored dot on a white paper, no matter what color the paper can’t be said to be all white = without color.
But since they never understood the difference between a political “consensus”, an Axiom and a scientific Paradigm, what could one expect?
If I’m right about the poles being important in stopping the warming going into the interglacial and that further warming is more or less impossible so long as we have polar ice, then this is good news.
A new theory of ice-age cycle
I think I have found the problem as to why global warming has not currently stopped at “the poles”.
Obviously “the poles are not part of this earthly globe, and global warming has only stopped for this earth.
There see how easy that is, you simply exclude parts of the earth that don’t obey.
After all Michael Mann excluded the entire southern hemisphere when he first published his hockey stick graph.
For that earth shattering revelation the graph was labeled “Northern Hemisphere.”
So “global” only applies to certain part of the globe; got that ??
Well done Bob. Ahead of the curve as usuall.
Is the “Not” in the title correct?
Yes, Lance, it’s correct. And it’s confirmed by the graph.
As I understand it, the “hiatus” refers to the recent multi-year period of stable temps revealed in several temperature records. Then the Cowtan and Way paper purported to show temps were still rising in polar regions. This latest paper by Gleisner states the Cowtan and Way paper exaggerated polar amplification, that we actually don’t have the data to say polar regions are warming to the extent the Cowtan and Way paper said they were.
If polar regions are not warming at their previous rate, wouldn’t we say the “hiatus” IS effecting the poles after all, despite the claims of the Cowtan and Way paper?
SR
Bob, if the hiatus is NOT occurring at the poles, that means they are continuing to warm, confirming Cowtan and Way. I think your title is wrong.
This confused me as well. So let me see if I have it straight now. The poles were warming faster than the rest of the globe. However their relative warming has slowed down recently. And that is why Cowtan and Way rank 2014 as only second warmest. Is that correct?
That’s what I thought, too, and stumbled over the “not” in “Pierre Gosselin of NoTrickZone reports on a paper that confirms the slowdown in global surface warming has not been occurring at the poles.”
I guess it means… No, I’m not sure. Could you clarify, Bob? Thanks.
Yes, the headline totally confused me too. Hope they correct this error.
Please fix this – it really is very confusing.
As I understand it, the message is:
1) Cowtan and Way’s contention is that the Earth is still heating, just not in the observable lower latitudes – the distribution of the heat has simply moved poleward
2) This paper says the polar regions do not make any difference – the headline “Hiatus is not Occurring at the Poles” means the “hiatus” or plateau is not an artifact of shifting distribution of heat into unobservable regions
I recommend Ian Schumacher’s excellent comment below. Another commenter on another page at another time mentioned a fine analogy. In the contest between science and religion, we have the God of the Gaps, wherein God only continues to exist within the gaps of our knowledge.
Bitter clingers to the AGW religion have now invented the AGW of the Gaps. The difference, of course, is that religious believers readily admit the role of faith in their belief system, while the AGW flock are in denial that their increasingly desperate fairy tales are ultimately grounded in faith.
Another point: The ‘South Pole’, or Antarctica, rather, has no warming to have a break from. So speaking of a hiatus or no hiatus at the southern pole is meaningless and thus only confusing.
Sure, you can argue that over the specific time segment 1997 to 2012 you can draw a rising trend line across the (continental, not oceanic) Antarctic temperature data, but that is mostly because the 90s were the coldest decade in the region over the last 35 years, so temps jumped up a bit in 2000 and have basically stayed there ever since. The Antarctic temperature anomalies have swung up and down from the late 70s, both interannually (huge swings!) and interdecadally, but the overall trend is for all intents and purposes zero:
So please leave Antarctica out of the ‘hiatus’ discussion.
Where is the missing heat then?
Not at the poles now so we can’t blame the satellites for only picking up the high places and missing the surface (at the poles where they can’t orbit).
Deep oceans (when not getting there before) would imply negligible anthropogenic component of the warming.
The back of my sofa is too full of fluff…
It’s almost as though the effect of additional CO2 is now irrelevant.
… meaning, the poles cannot be used to justify away the “hiatus” on the planet as a whole.
(A wasted posting effort by a banned sockpuppet. Comment DELETED. -mod)
Latitudes are the reason global warming has stopped??
Interesting planet you’re on. What color is the sky there? Here, it’s a nice cerulian blue. You ought to come and visit us some time.
(A wasted posting effort by a banned sockpuppet. Comment DELETED. -mod)
@icouldnthelpit
For certain, for certain.
The absolutely ultimate explanation for it all is that low latitudes are responsible. This is not a hypothesis, such as when the poles were blamed for the “hiatus”. In stark contrast, the statement regarding the role of low latitudes is infallibly true. Not hypothesis, but word-of-god.
Meanwhile, we are forced to discard the poles as the excuse with which to dismiss the “hiatus” on the planet as a whole.
icouldnthelpit,
See, that’s not at all what you wrote @2:57.
The poles are at high latitudes, not low. The equator is at a low latitude.
dbstealey
February 17, 2015 at 3:15 am
Latitudes are the reason global warming has stopped?? …
The implication is pretty interesting despite the terminiological issue. The equatorial zone where this is supposed to be taking place is the portion of the planet that receives the highest energy from the sun per square meter. That makes me wonder about increased equatorial cloudiness. WIllis may weight in on this.
(A wasted posting effort by a banned sockpuppet. Comment DELETED. -mod)
Duster,
I agree. Willis has a unique way of looking at the problem and seeing an answer.
Clouds are the ‘X’ that is consistently disregarded in models. No wonder they always get it wrong.
Also, Dr. Lindzen has written that for more than the past billion years, temperatures at the equator [the lowest latitude] have remained within ±1ºC. Something to think about as a contrast to fluctuations at the Poles.
Global changes in T have the most effect at night, in colder temperatures, and at the higher latitudes. So it’s not surprising that there are bigger changes at the Poles. But clouds at the equator regulate temperatures so effectively that they always remain within 1ºC.
They are so full of BS.
Furthermore at NTZ (15. February 2015) the Arctic appears again. Mann blames the NE US snow on warm water off the coast of Cape Cod. (In the last few years they blamed the snow on a lack of Arctic sea ice.) Joe Bastardi tells us that warm water is 2,000km away and is 5°C above ‘normal’ and not 11.5C. They offer up any damned reason but the cold. Ditto for Antarctic sea ice extent.
And here is Arctic sea ice cover.
http://ocean.dmi.dk/arctic/plots/icecover/icecover_current_new.png
http://www.climatedepot.com/2011/10/28/No-Trend-In-Antarctic-Temperatures-Since-1979/
And this is why Geisner is full of BS. No trend in Antarctic Temperatures since 1979. Geisner ,isn’t Antarctica one of the poles?
Oh no no no, of course it’s the melting of floating ice rather than continental ice that matters when it comes to sea level rise, everyone knows that, sheesh. 😉 therefore the massive Antarctic is meaninglessness in this equation..are you catching on now?
Wouldn’t we have less [sea] ice if floating ice was melting? Didn’t I just see that sea ice extent was at record high levels? Are these people nuts or just not paying any attention to the real world?
Wondering Aloud
Sea ice around Antarctica IS increasing, and has been increasing at ever-increasing rates since 1992. If current trends continue, it could block sea traffic around Cape Horn in 10 – 14 years. This is unlikely, but it does project current trends just a short time into the future.
Arctic sea ice had been decreasing, but has been near-steady since 2006-2007. Oscillating (going up and down) but not decreasing.
And here is the temperature trend. No trend. This is why they are obsessed with the peninsula.
The IPCC says most models simulated a downward trend in Antarctic sea ice extent. The trend has been up since 1979.
Are we reading the same papers? It would seem that the Geisner paper supports the major claim of the Cowtan and Way paper, that we are missing warming not reported at the poles.
Of course now that we have records _without_ an El Niño, it would seem the pause might start fading into the past.
Your attempt to spin it didn’t work, Pippen Kool.
They said the missing heat was hiding in the oceans, but the Argo buoys couldn’t find it there, so logically the only place it can be hiding is somewhere there are no thermometers. And that (ta-daa) is the two tiny circles at both poles that the satellites can’t reach. (Whaddaya mean the Amunfsen-Scott South Pole station can’t find it there either?)
What is there to spin? Just read the papers. They are based on the same premise. Sheesh.
Wow. Maybe you don’t understand what the words mean.
Geisner: “the dominating causes of the global temperature hiatus are found at low latitudes.”
What it means: latitudes near the equator haven’t warmed much….lately.
C&W: (My words) If we sampled the entire area at the poles, we would measure more warming
What it means: latitudes near the poles have warmed….lately.
I mean, if someone is pushing a train and the other pulling, how are they not doing the same thing?
Pippen Kool,
Unspinning is spinning. 🙂
I must admit I can’t see how the paper refutes Cowtan & Way. It does suggest that the difference between the post-hiatus trend and pre-hiatus trend cannot be explained by missing data but C&W pretty much acknowledge the same thing since their recent trend is lower.
Anyway it’s late and I’m off to bed. I’ll need to have another look at it tomorrow.
John Finn February 16, 2015 at 5:44 pm
I must admit I can’t see how the paper refutes Cowtan & Way
Strange, you and Pippen Kool both. Even if I wanted to, I just can’t come up with a way to read that into it. This sentence in particular seems pretty clear:
Instead, the dominating causes of the global temperature hiatus are found at low latitudes. The combined use of several independent data sets, representing completely different measurement techniques and sampling characteristics, strengthens the conclusions.
How is that not refuting C&W? They find the dominant causes to be from different latitudes, and verify same using different data sets and measuring techniques. One thing I learned a long time ago is that if you can solve the same problem several different ways and get the same answer, you’re probably on the right track. That said, if this doesn’t refute C&W, then you or Pippen Kool or someone are going to have to help me out and quote the exact words that you think say this. Maybe I am dense, but I just cannot find them.
No they don’t.. C&W acknowledge there has been little warming in the lower latitudes but suggest the high latitudes haven’t been properly represented. The Post-2000 Cowtan & Way reconstructed trend shows warming but not at the pre-2000 levels.
The Geisner study finds “the dominating causes of the hiatus are found at low latitudes” .. and … “Omission of successively larger polar regions from the global mean temperature calculations, in both tropospheric and surface data sets, shows that data gaps at high latitudes cannot explain the observed differences between the hiatus and the prehiatus period”
Cowtan & Way haven’t said they can “explain the observed differences between the hiatus and the prehiatus period”. They’ve just suggested there is some warming that is not being measured. Pippen Kool’s follow up post says much the same.
The 2 studies seem to be entirely consistent.
It seems a few other readers now I agree with me,
Well, davidmhoffer, I for one agree with Pippen and Finn. This paper in no way refutes what C&W claimed. I’m sure most of us agree that C&W were more than a little “out there” with their claim. As a ststistician, I would never have used that technique myself (unless I had an axe to gring and other statisticians weren’t watching). But C&W were stretching for a reason to say the hiatus wasn’t happening by saying claiming there teally was no hiatus at the poles, while this paper says the haitus is dominant at the poles. That’s not a contradiction in any way, shape, or form.
Oops, I meant to finish by saying that this paper claimed the hiatus was dominant at low latitudes. Sorry.
“that we are missing warming not reported at the poles”…….
and that it doesn’t make any difference.
shows that data gaps at high latitudes cannot explain the observed differences between the hiatus and the prehiatus period.
yes they do.
no they don’t.
Hang around for a bit Mosh or don’t come here at all.
Mosher, tor comments make the issue more confusing than having no comment. Stop being so cryptic. My initial reading led me to the same conclusion that several readers have made. Then I reversed myself. Now I am more confused than ever. The papers are convoluted. The headlines are convoluted. The explanation of the headline and papers are convoluted and the rebuttals are convoluted.
Then you come in here and just add more confusion. Thanks for nothing.
Really Mosher. Where is the warming in the SH oceans and polar regions? The polar data is already distorted by homogenization. https://chiefio.wordpress.com/2014/07/22/gistemp-who-needs-antarctic-data-or-temps-near-ice/
Bob T has posted about this before also.
The last two years Arctic circle summer T has been near record low.
Indeed, the claim that record SH sea ice is due to extreme polar CO2 amplification is ludicrous.
Yes they don’t.
Or if you prefer no they don’t.
Or alternatively yes and no comments are a waste of time.
which of the dozens of published explanations do you prefer??
“Of course now that we have records _without_ an El Niño, it would seem the pause might start fading into the past.”
There is no trend in global temperatures anywhere close to what was projected. No matter how you spin it, that indicates a model failure.
We are still within the 2 sigma limits of the model median, not bad for governmrnt work. So failure not.
A) it blew past 2-sigma awhile ago
B) That’s lousy even for gubmint work
Out and now back in. But it was out and in back in ’98 too only on the high side. About what you would expect. The models take the long view.
I can’t deal with religious faith on that scale.
Pippen,
Now, I’m not saying these standard deviation calculations you’re referring to are meaningful in any way, but where is it said that the 1998 warm year was above 2std?
Which means in additional to the low latitudes causing the temperature hiatus in your opinion you now have to add Antarctica . How do you explain that?
The problem with trying to get accurate temperature information near the poles is satellite coverage is poor so surface measurements predominate.
For the North pole there is no good way to do long term surface measures anywhere near the pole. I could imagine an Argo-like, air dropped network of stations although I can’t really see anyone making a serious multi-decade effort to do so.
For the South pole the measurements have historically been made close to warm human habitats.
So your stuck with some pretty unreliable, noisy data. Treat any conclusions generated from that data appropriately.
Not a problem a bit of data ‘adjustments ‘ and a bit of smearing of temperature measurements form anywhere , even hundreds of miles away , and yo have your ‘proof’ Remember this is climate ‘science’ accuracy is no where near has important has ‘faith ‘ in your results.
Totally agree. I see this trend everywhere in climate science. Don’t get the answer from existing easily measured data? Then move to areas with no historical data and with much larger measurement uncertainty. You can even use models to give you the missing data and then show how this data matches to that predicted by models.
The predicted global warming upper troposphere hot spot not there? Then move away from direct temperature measurements by satellites and weather balloons to wind proxy data with measurement uncertainty from floor to ceiling. Problem solved. That and generally forget about the whole hotspot thing (try doing a search on google for global warming hotspot and see if you can find a non-sceptic site that even mentions it).
Ice extent not cooperating? Move to the much harder to measure ice volume with measurement uncertainty from floor to ceiling and absolutely no historical data. Problem solved.
Warming slowed down in areas with good temperature measurement coverage? Stop focusing in those areas and instead focus on the temperatures at the poles where there is almost no data (historical or current) what-so-ever. Problem solved.
I’ll just leave this list of characteristics of pathological science here for no particular reason 😉
[http://en.wikipedia.org/wiki/Pathological_science]
– The maximum effect that is observed is produced by a causative agent of barely detectable intensity, and the magnitude of the effect is substantially independent of the intensity of the cause.
– The effect is of a magnitude that remains close to the limit of detectability, or many measurements are necessary because of the very low statistical significance of the results.
– There are claims of great accuracy.
– Fantastic theories contrary to experience are suggested.
– Criticisms are met by ad hoc excuses.
– The ratio of supporters to critics rises and then falls gradually to oblivion.
+1e20
Richard Feynman would likely approve of your analyses. RIP Richard.
You forgot to mention the oceans.
Move away from SST and the top 700m (or so) where there are measurements to the deep oceans where there are no (or extremely few measurements), and claim that the ‘missing’ heat found its way to a place where there is no data; problem solved.
+100
Ian Schumacher, you sir are getting too close to the bone. Well done! This is indeed one of the best observations of Climastrology I have ever read. It rings so true.
richard verney,
Agreed. I only thought of the oceans later after I hit post. The search for heat in the oceans matches this pattern perfectly. The desired answer always lies in the places where we have little to no data.
It’s a simple test of faith, and a fine measure of it, too. Oh, to imagine, and then to believe.
===============
“Treat any conclusions generated from that data appropriately”
###
The trash can is the appropriate place.
Did you ever see that article about weather observations on the DEW Line? Charged with taking observations every 3 hours, the soldiers would fabricate the night-time readings because of the fear of polar bear attack.
Didn’t a paper last year find evidence of significant geothermal activities in the West Antarctica Peninsula? Of course it had the obligatory genuflect to AGW at the end but it is interesting that loss of ice and geothermal activities just happen to occur at the same place.
Comment meant for Mosher below.
here is a skeptical paper that took a similar approach at the south pole.
Cowtan and Way have just followed a path laid down by mcIntyre, and O’donnell
That is using all the information you have ( satellite and ground station ) to reconstruct the temperature
at the surface
http://wattsupwiththat.com/2010/12/01/skeptic-paper-accepted-on-antarctica-rebuts-steig-et-al/
A detailed analysis is presented of a recently published Antarctic temperature reconstruction that combines satellite and ground information using a regularized expectation-maximization algorithm. Though the general reconstruction concept has merit, it is susceptible to spurious results for both temperature trends and patterns. The deficiencies include: (a) improper calibration of satellite data; (b) improper determination of spatial structure during infilling; and (c) suboptimal determination of regularization parameters, particularly with respect to satellite principal component retention. We propose two methods to resolve these issues. One utilizes temporal relationships between the satellite and ground data; the other combines ground data with only the spatial component of the satellite data. Both improved methods yield similar results that disagree with the previous method in several aspects. Rather than finding warming concentrated in West Antarctica, we find warming over the period of 1957-2006 to be concentrated in the Peninsula (≈0.35oC decade-1). We also show average trends for the continent, East Antarctica, and West Antarctica that are half or less than that found using the unimproved method. Notably, though we find warming in West Antarctica to be smaller in magnitude, we find that statistically significant warming extends at least as far as Marie Byrd Land. We also find differences in the seasonal patterns of temperature change, with winter and fall showing the largest differences and spring and summer showing negligible differences outside of the Peninsula.
##################
So using everything you know about the north pole gives you a better picture.
And you can verify Cowtan and Way byy looking at additional sources.
1. Reanalysis
2. Arctic Bouys
3. AIRs surface measurements.
And you can rationalize Cowtan and Way by looking at additional rationalizations.
FIFY. ohnestly, Steven, would you put up with this kind of casuistry if someone were trying to use it to prove the opposite of your desires?
Wait’ll the lag hits the poles. Lead the way to cowtown.
================
Pursuing option 1 Reanalysis – ERA-interim reanalysis vs. Cowtan and Way Krig over 1997-2012, I get ERA hotter in the NH and C&W hotter in the SH. IIRC, ERA had a flatter trend post 2000.
“The problem with trying to get accurate temperature information near the poles is satellite coverage is poor so surface measurements predominate.”
Nowhere else on earth is the satellite coverage better than above the poles, since many satellites have polar orbits in order to get global coverage.
“For the South pole the measurements have historically been made close to warm human habitats.”
Are you suggesting that there is an UHI effect at the south pole?
Here’s something on UHI in the Peninsula.
https://notalotofpeopleknowthat.wordpress.com/2013/11/08/antarctic-temperature-trends/
This link is much better in showing the recent temp. trends in Antarctica.
Has anyone read the paper?
Tomcourt is right about the temps taken near urban sites such as McMurdo. Noisy data-might as well used Huntsville Alabama .
You all are knotted in your knickers. There are no good NP measurements since just moving seasonal pack ice. Polar sats are only approx, so miss it too. BUT get close.
SP has had Amundsen Scott since 1957. Which BEST turns from no trend to warming using a flawed regional expectations assumption. Posted many times this past month. Or see last footnote to essay When Data Isnt.
Neither pole is representative of either polar region. There is better and older and fiddled data for the Arctic, since a smallish ocean surrounded by largish continents with outposts. Antarctic is a largish uninhabitable continent surrounded by larger hostile oceans.
Geisner did an interesting simple thing. 1. Most planetary surface isn’t polar. 2. Take poles out since uncertain, the other 90% still shows the pause. That suffices for model falsification.
Rud, that was well explained. Thanks.
It has always struck me as odd that the measurements show Antarctica is static to dropping in temperature for 60 years, yet people talk about polar amplification. Amplification of what? If I take a zero trend and amplify it by say, a factor of 3, I still get a zero trend, just a bigger, fatter zero.
I have a feeling that the O in CO2 is actually a 0.
Infilling missing data? What’s new? What about the oceans? etc? That’s all fine?
so the poles are still heating ? based on what, one thermometer at each pole ?
Amundsen-Scott South Pole Station, Antarctica
(NZSP) 90-00S 00-00E 2835M
Conditions at
2015.02.16 2350 UTC
Wind from the ESE (110 degrees) at 9 MPH (8 KT)
Visibility greater than 7 mile(s)
Sky conditions mostly clear
Temperature -49 F (-45 C)
Windchill -76 F (-60 C)
Pressure (altimeter) 28.66 in. Hg (970 hPa)
ob NZSP 162350Z 11008KT 9999 FEW010 FEW100 M45/ A2866 RMK CLN AIR 10004KT ALL WNDS GRID SDG/HDG
24 Hour Summary
Time
EST (UTC) Temperature
F (C) Dew Point
F (C) Pressure
Inches (hPa) Wind
MPH Weather
Latest 7 PM (0) Feb 16 -49 (-45) 28.66 (970) ESE 9
6 PM (23) No Data
5 PM (22) No Data
4 PM (21) No Data
3 PM (20) No Data
2 PM (19) No Data
1 PM (18) Feb 16 -49 (-45) 28.66 (970) SE 6
Noon (17) No Data
11 AM (16) No Data
10 AM (15) No Data
9 AM (14) No Data
8 AM (13) No Data
7 AM (12) Feb 16 -50 (-46) 28.69 (971) ESE 15
6 AM (11) Feb 16 -50 (-46) 28.7 (971) SE 9 ice crystals
5 AM (10) Feb 16 -50 (-46) 28.7 (971) ESE 8 ice crystals
4 AM (9) Feb 16 -50 (-46) 28.7 (971) E 8
3 AM (8) Feb 16 -50 (-46) 28.71 (972) E 8
2 AM (7) Feb 16 -50 (-46) 28.7 (971) E 10
1 AM (6) Feb 16 -50 (-46) 28.71 (972) E 10 ice crystals
Midnight (5) Feb 16 -52 (-47) 28.7 (971) E 10 ice crystals
11 PM (4) No Data
10 PM (3) No Data
9 PM (2) Feb 15 -50 (-46) 28.7 (971) E 9
Oldest 8 PM (1) Feb 15 -50 (-46) 28.71 (972) E 8 ice crystals
Notice, at an observation post run by the US government, there are no observations for 12 hours of the day.
No doubt a little “infilling” will occur to rectify the problem of the hiatus.
Note also that this summer.
… and a balmy minus 46º C at that. Getting that 9,200 ft elevation summer tan no doubt at A-S sta today.
A little something from my odd notes:
February 25, 2009
The Associated Press released a story today about Antarctic glaciers continuing to speedily march to the sea. The article states: “Antarctic glaciers are melting faster than previously thought, which could lead to an unprecedented rise in sea levels, scientists said Wednesday.”
The article also stated that Antarctica’s average annual temperature has increased by about 1 degree Fahrenheit since 1957 and that the temperature remains at -50° BELOW ZERO.
WOW. That’s new. Ice melts at -50° BELOW ZERO?
Sounds like they’re really consistent with those temp readings, lol 😉
Mosh et al all think that ice melts at -46, didn’t you know.?
One day with lost data does not mean South Pole data are generally bad.
Univ of Wisconsin has South Pole meterological data since 1957.
http://en.wikipedia.org/wiki/Antarctic_Meteorological_Research_Center
I for one always liked the open honesty of the Cowtan and Way paper. At least they came right out and said they were making up data, filling in data where there was none with what they thought it should be. If more people who make up data had the same honesty science would be much better for it.
We would only be better off for it if people read the actual papers and were able to understand them. Press releases never cover the “honest” parts.
And yet, we continue to use the words “pause” and “hiatus”… both are misleading and incorrect, since they PRESUME that warming will eventually continue.
Still more likely it’s a PEAK.
That really depends on whether we are at an inflection plateau like the 40s or are at the local maximum heading for another little ice age. The slight decline into the 70s wasn’t really that significant when you look at the long march out of the little ice age, and a 20 year plateau wouldn’t be much either. The question is: “Are we still recovering from the last ‘little ice age’ or are we preparing for the next?”
Right now no one in climate science can answer that question, and almost no one is asking it. Without knowing the state of natural variability, NONE of these other questions about how much man may be contributing can even begin to be answered.
Peak Lies
Corner Stone of Climate Change.
Truth chips away at this corner stone and when the corner stone fails it all falls down.
Interesting fact at the hottest time of the Arctic year the surface temperature cannot rise much.
Aug 5th, 2010 @ 12:53 pm › Roy W. Spencer, Ph. D.
“Surface Air Temperatures above the Melting Ice in the Arctic Summer – Most of the area above 80N is (currently) still covered in permanent sea ice. In the Arctic Summer when the surface ice is melting, the air temperature close to the surface is limited by this ice melt temperature to just above zero degrees C”.
2011-10-08
The protagonists.
Kevin Cowtan, from York, UK. I’ve got a PhD in computational physics, and am a long standing post-doc with fellowship-in-the-pipeline working on computational methods development in X-ray crystallography.
maintain
2010-08-15 Robert Way
I am a Masters student at Memorial University of Newfoundland in Eastern Canada. at the University of Ottawa in Geography with a minor in Geomatics and Spatial Analysis.
My primary interests lie in paleoclimatology, remote sensing of techniques for glaciers and ice sheets, and ocean-atmospheric dynamics.
There is the dilemma.
They have an approach to an area previously ignored or poorly done. They put up a method which inherently should work “to give a better estimate than otherwise”.
My reasons for being “dead set on disliking Cowtan & Way” are
-They both belonged to the Skeptical Science crowd before they put out their papers.
-The papers were done at a time of needing to find a reason to remove the pause and the conclusion they drew fitted these aims perfectly.
-Mr Cowtan wrote a piece for Skeptical Science arguing that he could get more value from linking areas far apart than areas close together. [faulty scientific reasoning].
They also excluded 3 ? Soviet island data areas because they were too cold [biased use of data science].
These bases dropped their warming rate 40% if included.
Their results always go up on preexisting data. Lack of some negative results indicates a biased warming algorithm or an imperfect data set.
Luckily, though set in stone, an algorithm based on finding increased Arctic warming with small increments in Arctic temperatures has a fatal flaw. When the temps do decrease by any significant amount C and W will go through the floor.
It is happening now and will only get a lot worse if there is one more increase in sea ice left in the Arctic in this current rise of 6 out of the last 7 years.
Of course there will be a review of their algorithm to readjust it.
+1
So we see it time and again that the SKS types cannot do science without fudging, doctoring, fabricating data. And for the AGW crowd, nothing matters but the conclusions.
And that is why we see it time and again.
As I have noted before they use the same philosophical approach as Mcintyre and ODonnell.
Use ground stations and satellite data to get a better estimate. Odonnel and Mcintyre did their work on the south Pole.
The real test of Cowtan and Way is how well they verify against other data NOT USED in their reconstruction
1. Bouys
2. Reanalysis
3. AIRS
Bottom line, they do better than Hadcru.
Real question… are they too low.
There is nothing wrong with the philosophy, but possibly with the integrity.
Too low, Steven? Why would you ask that?
Berkeley Earth–of which you are part, if memory serves–provides two global land+ocean products. One extrapolates land surface air temperature data out over sea ice and is comparable to Cowtan and Way, while the other extrapolates sea surface temperature data out over sea ice. The dataset that uses land surface temperature data of course has a higher warming rate than the dataset that uses sea surface temperature data. That Berkeley Earth exercise suggests that the correct answer lies somewhere between the two, not warmer than the land surface/sea ice answer.
Both methods fail to consider that sea ice has a different albedo than the ocean surface and a different albedo than land surface air temperature station locations when snow melts and exposes land surfaces.
Mosh, isn’t it funny you are here discussing science with a bunch of anti science nut jobs -your terminology for wuwt readers?
cowtan recently argued that most arctic stations needed to be adjusted downwards. That doesn’t fit with the synthesized cowtan and way higher temps. They already fail your test, by their own words.
We sent Gleisner et al (2015) a discussion of their paper in January for their comment.
Here is our discussion which was just posted:
http://www.skepticalscience.com/gleisner_response.html
Bob Tisdale,
“Too low, Steven? Why would you ask that?”
Well because satellite datasets are expected to show less Arctic warming because Arctic amplification is supposed to be intensified in the near-surface layer rather than in the troposphere as a result of ice feedbacks. This is a fairly fundamental point – in the discussion I linked to above you can learn a little bit more about it such as from Simmons and Poli (2014).
Shub,
“cowtan recently argued that most arctic stations needed to be adjusted downwards. That doesn’t fit with the synthesized cowtan and way higher temps. They already fail your test, by their own words.”
Actually one of the things we noted was that some Arctic stations had been systematically adjusted downwards (wrongly) due to the rapid regional warming in the Arctic which contrasted with the boreal cooling over eurasia.
That discussion is located here:
http://www-users.york.ac.uk/~kdc3/papers/coverage2013/update.140404.pdf
Robert Way,
Thanks for commenting here.
May I ask if you would consider it proper procedure to graft your Arctic temperature reconstructions for this century onto GRIP ice core data ending in AD 2000, as commenter Brandon Gates has done?
Thanks.
Real answer … more like too high.
No adjustments for urban warming in CRUTEM and despite PHA and night-light brightness adjustments, still large urban biases in GISS and NOAA global temps.
urban heat Japan
and in China
and North Africa
and South America
BEST is more ‘democratic’, urban warming is regionally expected.
“Robert Way,
Thanks for commenting here.
May I ask if you would consider it proper procedure to graft your Arctic temperature reconstructions for this century onto GRIP ice core data ending in AD 2000, as commenter Brandon Gates has done?
Thanks.”
In my view the Kobashi et al approach seems most appropriate:
see this study and the more recent ones
http://www.leif.org/EOS/2011GL049444.pdf
Robert Way,
Thanks!
I´ve visited Leif´s valuable site a lot but never saw that paper.
Much appreciated.
“In the Arctic Summer when the surface ice is melting, the air temperature close to the surface is limited by this ice melt temperature to just above zero degrees C”.”
We get 60F temps here in Michigan when there is still lots of snow on the ground. That’s 15C over the ice temperature.
What does Michigan have to do with 80 degrees N latitude? Read it carefully.
Read his logic. It has to do with snow on the surface.
Could there be a few trees, lakes, houses, road surfaces parking lots etc in your area holding latent heat compared to the arctic by chance?
Actually trafamadore is (partly) correct. When the weather is bright and sunny it can get quite warm in summer even in the Arctic. I’ve been sunbathing on the deck of a ship making its way through the pack at 80 degrees north. However weather is rarely bright and sunny in the Arctic in summer. Normally it is cloudy and/or foggy, and then temperatures are indeed close to zero.-
tty
About 20 – 25% of the high Arctic days are sunny, and about 75 – 80% of the summer days are cloudy – either fully overcast or partially covered. Problem is, if the sun is shining through the “partial” clouds, then it is shining very brightly (you see a very very sharp spike in measured solar radiation!) for a few moments or a half-hour, then the sun goes back behind a cloud and the sunlight goes down by 50% to 60%.
On overcast days, it just does not ever get distinctly bright, and the only sunlight down on the surface is diffuse radiation. 70% of the top-of-atmosphere energy reflects off of the top of clouds, half to 2/3 of the remainder gets absorbed by the clouds while going through the atmosphere, and only 10 – 15% gets down to the ice or water or melt pond surface.
The difference between direct sunlight albedo’s and diffuse sunlight albedo’s from sea ice and from open water is staggering. The difference in heat energy absorbed and heat energy reflected is even more important.
In both Arctic and Antarctic, clouds are more common over the open water (the sea around the sea ice) in both summer and winter conditions; and clouds are less common (more bright sunny days) over the sea ice. Gets confusing, doesn’t it?
Polyana (open water in the middle of sea ice) are NOT melt ponds (shallow standing water sitting on top of sea ice), and are usually smaller (10 meters to 100 meters across and anywhere from 100 meters to 1000 – 5000 meters long) than open water areas “visible” by the satellite sensors. Since the poly’s are smaller than the “open ocean” around the sea ice, few observers report “clouds” over the poly’s; but ALL report water vapor and low-hanging “fog” and “mists” over the open water in poly’s. (It’s not much of a difference in water temperature between melt ponds and open water leads, but the old explorers – obviously needing to avoid open water so they could keep going north (or south) with their dog sleds, but whop could go through melt ponds only a 1/2 meter deep – would look ahead for those fog banks as clues. )
Tty, the ice has albedo. You don’t.
That is the difference and that is why Roy Spencer is correct, assuming 80° N latitude to be ice.
Regarding Michigan, what is the albedo, all ground, buildings, trees, etc., taken into account? Warm fronts, also. Different climate, different factors.
So, look at all yearly plots since 1959 from the DMI for daily temperatures at 870 north latitude.
http://ocean.dmi.dk/arctic/meant80n.uk.php
The mid-summer air temperature remains rock-steady at 1.5 degrees C every year. Dr Spencer is proved right: Arctic summer air temperatures are locked at today’s temperature of 1.5 degrees and will not change.
Actually, I think you find that 2013 and 2014 have had pretty much the shortest periods above 0C in the whole record.
Its getting COLD up there in summer !!
RA
Thanks for your comments. I have been following the DMI Arctic temperatures by day and noticed going all the way back to 1959, the annual temperature graph showed almost no variability in summer but sometimes huge variations on the shoulders of the graph. It didn’t make sense to me. Now it does.
If you look at the arctic temps from the sea ice page, you can see that the trend is declining over the past 10 years. The linear up trend given is not very good at ‘hiding the decline’.
ftp://ftp.ssmi.com/msu/graphics/tlt/plots/rss_ts_channel_tlt_northern%20polar_land_and_sea_v03_3.png
I’ve pointed this out a few times. Of course we also know what is happening in Antarctica.
Where can I get the /data/ that are plotted in this reference. I can make my own plots, and do a lot more too.
Looks like a straight line there is no trend unless you want one. RSS tries the same trick
“the slowdown in global surface warming has not been occurring at the poles” …….
Where warming is defined as temperature anomaly. How would it look if it was plotted as specific enthalpy change?
Now, what do you want to go and bring thermodynamics into this…don’t you know climate scientist don’t care about HEAT they only care about HEAT (/sarc)
The warmists’ study data was 1997 to 2012. The cooling of both poles started 2012.
http://arctic.atmos.uiuc.edu/cryosphere/iphone/images/iphone.anomaly.global.png
http://arctic.atmos.uiuc.edu/cryosphere/IMAGES/seaice.anomaly.antarctic.png
There was in the past roughly an 11 year delay in high latitude cooling, from the initial start of the very weak solar magnetic cycle.
http://www.ospo.noaa.gov/data/sst/anomaly/2015/anomnight.2.16.2015.gif
The tropics and mid-latitudes are the heat accumulators and storage buffers. Ocean circulation moves the heat to the poles. The poles warm as they ventilate an excess heat to space.
It is ludicrous to expect such a large, complex multi feedback system to ever be at equilibrium given solar cycles and nonlinear feedbacks. The heat at the midlatitudes and tropics from a decade or more ago is now being ventilated and has been for 5 years or so, at the Arctic Ocean. The Southern Ocean, being more directly connected. to the Pacific, Atlantic, and Indian Oceans, finish its heat dump 4 years ago, and is leading the Arctic in global climate response to a coming cool phase
And maybe not so much the poles as the Arctic and Antarctic fronts. Those are intersubarctic convergence zones. While we don’ t see the monster tropical CuNim, the troposphere is shallower there, and the weather is active year round. In any case the convergence must be shooting heat up into space.
Agree. The GC models fail at convective heat transfer, and fail badly, in the tropics.
Thanks, Bob.
Given the history of this climate wars, I’d say intentionally being misleading is the correct answer.
I am not understanding. The article makes it sound as though Cowatn and Way have a set of data that show the poles have “”warmed” over the past 15 or so years. Is this a “yes, but”?
OK, I have a stupid question.
Based on the physics, why would we expect the poles to warm, even if the earth was warming?
The arctic regions radiate more energy than the absorb from insolation. If it were not for energy being input via water and air currents from warmer regions, they would be even colder. In other words, based on what they get in terms of insolation, they are very warm already. So, for them to get any warmer, they must either:
a) get additional surface energy flux from the GHE, or;
b) get more energy from air and water currents originating in lower latitudes
The problem with a) is that there isn’t much GHE there in the first place. Water vapour, which would in the tropics account for 80% of the GHE is nearly absent. It is just too cold for water vapour to do anything but precipitate out as the air currents approach the arctic regions. Ozone levels are very low for half the year due to a lack of ionization from the sun’s UV rays, and methane hardly counts and absorbs mostly at higher temps than what occur in the arctic regions. That leaves CO2 all by itself, with at low temps, much of the radiated spectrum being outside the absorption spectrum of CO2, see the long tail to the right:
http://commons.wikimedia.org/wiki/File:Atmospheric_Transmission.png
So, I’d expect there to be very little GHE in the first place in those regions, even with a large increase in CO2. The atmospheric window without water vapour is a rather large, wide open window.
So, let’s look at b). If the amount of energy coming from lower latitudes was so large that it increased arctic regions temps enough to make a substantive difference in water vaopour holding capacity, we might have something to talk about. But with temps barey above freezing for just a few days of the year each year, that’s orders of magnitude more energy transfer than the current system exhibits. There’s just no reason for the system to change by more than a few percent at most based on the GHE causing warmer water and air currents to originate from low lats.
So…. with nearly no GHE to speak of in the first place, any additional heating originating from warmer air currents and water currents from lower lats would also be expected to radiate straight out to space with very little warming of the arctic region surfaces.
Thinking out loud here… er, uhm, out keyboard…er whatever, just sayin’.
davidmhoffer
Classically, there are two reasons to expect greater Greenhouse gas warming at the poles. I can credibly believe one, though it too seems to work better in the theory than in the measurements.
If CO2 is mixed uniformly around the world’s atmosphere, then it will have a 400 ppm mixture right? But, the very cold poles will be (by their nature) very cold and so have very little water vapor gas present. Thus, IF CO2 is a greenhouse gas, and IF CO2 is “trapping” and re-radiating heat from the surface, then the CHANGE in heat loss should be much greater where there is a greater CHANGE (increase of course) in GHG, right?
Thus, in a equatorial latitude where there is a LOT of water vapor, the addition of a little bit of CO2 won’t change the total GHG concentration very much, right? (For example, 76 + 1 = 77 77/76 = 1.013)
But, where there is only a little water vapor, the addition of the same amount of CO2 will make a greater difference in the total GHG’s present, and so there “should be” a greater CHANGE (increase in GHG’s present compared to what was there before. (1 + 10 = 11 11/10 = 1.10)
But it doesn’t seem to work that way in practice.
the second effect (Arctic amplification, or Sereze’s Arctic Death Spiral of less sea ice increasing absorption of solar energy which heats the water which causes less sea ice which causes more absorption …) has been debunked by no less than the NSIDC and NOAA itself. But we are calculating that effect – proving it cannot happen in today’s world here at WUWT.
Well yeah, agreed. But I think it is more complicated than that. In the tropics, water vapour is high at sea level. If you sample at higher elevations, temperature drops and so does water vapour, until at some point it is inconsequential. Below that level, adding a few ppm of CO2 doesn’t mean much. What’s an extra 30 ppm of CO2 mixed in with 40,000 ppm of water vapour? Diddly squat. But above that level where water vapour is significant, adding 300 ppm of CO2 is significant.
But here’s the thing. In the tropics, the height of the troposphere is on the order of 16 km. At the poles, it is more like 8 km. A big part of the GHE is predicated on the height of the atmospheric air column, and at the poles it has a lot less to work with. So the percentage change might be larger, but it might be of a much smaller number.
I think the problem may be with the Planck’s Law distribution of energy at the lower temperature. If the peak is significantly off from the CO2 absorption peak, than more energy makes it straight through to space. That wavelength peak moves a great deal with radiating temperature. (I know assuming a black body in this case is probably not true, but does make a good limiting case assumption.)
All this CO2 greenhouse assumptions work pretty well from about 10C to a little over 30C, but outside of that range the radiating peak is away from the CO2 absorption line. (there is still SOME energy there, but an ever decreasing portion as the temp moves away from that range).
What about deserts? Little in the way of water vapour so CO2 would disproportionally influence desserts if CO2 leads to warming/drives temperatures.
How have day and night temperatures over desserts trended these past 50 years (or so)?
Except for that pesky temperature relation for absorption and emission spectra for IR absorbing gasses. It is worse in Antarctica because of the additional pesky pressure relationship. Absorption and emission bands are far narrower in these regions.
Complex, isn’t it? 8<)
Makes life fun.
Now, just to add some more "fun" …
The earth is an oblate spheroid, not a real sphere. So any equation of air mass that doesn't take that odd "curve" at both poles (and both ends are different by a little bit) into account is technically in error, right?
But what about the greater density of air at both poles (due to the colder temperature, the closer sea level to the earth's center, and the lower depth of atmosphere measured. Except that the south pole is much higher (physically, at nearly 9,000 feet AGL) than at the north pole (at sea level + 1 meter!), but the air is cleaner and drier at the south pole. the southern sea ice is also at sea level though. But then again, the atmosphere is "thinner" (less high towards space at the poles) so the air mass is less for the same apparent temperature and solar elevation angle, right?
But then again, the atmosphere at the poles is measured right at 1000 bar, plus or minus a little bit, so does the air pressure change matter more than the geometric change and the atmospheric thickness change?
Agree in concept. The poles are our radiators to space. When they are warm, it means the feedback machine is releasing copious amounts of heat, from a decade ago absorbed in the equatorial oceans, into space. That is it. Less ice in the Arctic these past few years means the feed back machine is working and releasing heat to 3 Kelvin space.
Yeah, I’ve made that point myself many times. The warmest ice can get is the freezing point. So once the ice is gone, temps can go up, w/m2 radiated rises with the 4th power of T, and presto, less ice = major negative feedback which cools the planet.
The warmists do not want the general public to understand that less Arctic Ocean ice means a climate response that results in loss of all that heat that would otherwise lead to global warming.
Thus, feedbacks cancel CO2 AGW. IPCC-defined Climate Change = Fail.
“The poles are our radiators to space.”
Well, sort of. Much more energy is radiated to space from the tropics and subtropics than from the poles. It’s just that the poles radiate much more to space than they get in from the Sun. And that is simply because they receive most of their energy not directly from above (like the tropics do), but rather advected to them from lower latitudes, ultimately the tropics.
It’s a fine-tuned machinery, our global climate. The Sun (and the Earth’s rotation) drives the atmospheric and oceanic circulation (evaporation and winds). The circulation (convection/advection) distributes the Sun’s energy across the globe. And finally, the IR-active gases (and the clouds) in our atmosphere rid the Earth system of it; back to space it goes. Warming the Earth? No. Cooling the Earth.
At risk of playing the fool, ‘polar amplification’ should happen. I discussed this with Lindzen himself in person. There are at least two mechanisms. First is Hadley cell transport in the atmosphere. Second and more important is ocean circulation. Or, in simpler non-mechanistic terms, heat always flows from hot to cold.
Well in any disagreement between me and Lindzen, I’d vote for Lindzen.
Did he discuss GHE at all? Or did he think that the effect would come primarily from air/ocean current transport?
If the latter, my assumption would be that his assumption was that warming was taking place and logically energy would be circulated to the poles. Given that w/m2 varies with T^4, the tropics could cool by a smaller amount (in degrees) and the arctic regions would warm by a larger amount, and energy balance would still be maintained. So, “amplification” if one is looking only at temps. But….
It hasn’t been warming, so there’s nothing extra to transport?
That said, I think the lack of GHE in the arctic regions per my reasoning above would mute the amplification effect by radiating a large percentage of the transported energy to space.
DavidMHoffer
Now, what happens if Tropical (+30 to -30 latitude) ocean water changes temperature?
Condition       Land    Land    Water	Water	Water	Change	Water	Change in
                Area	Temp K	Area	T Deg C	Deg K	Temp	Deg K	Heat (10^9)
20% land	51.0	305.0	204.0	30.0	303.0	0.01	303.01	-0.23
20% land	51.0	305.0	204.0	30.0	303.0	0.05	303.05	-1.14
20% land	51.0	305.0	204.0	30.0	303.0	0.10	303.10	-2.27
20% land	51.0	305.0	204.0	30.0	303.0	0.20	303.20	-4.54
Now, what if Arctic Ocean Temperature changed by the same amounts?
No Ice	        0.0	248.0	14.0	-2.0	271.0	0.01	271.01	-0.01
No Ice	        0.0	248.0	14.0	-2.0	271.0	0.05	271.05	-0.06
No Ice	        0.0	248.0	14.0	-2.0	271.0	0.10	271.10	-0.11
No Ice	        0.0	248.0	14.0	-2.0	271.0	0.20	271.20	-0.22
Now, keep water temperature the same, change the sea ice area in the Arctic.
Condition       Land    Land    Water	Water	Water	Change	Water	Change in
                Area	Temp K	Area	T Deg C	Deg K	Temp	Deg K	Heat (10^9)
20% Land	51.0	308.0	204.0	30.0	303.0	0.00	303.00	2178.45
20% Land	51.0	308.0	204.0	30.0	303.0	0.10	303.10	2180.72
Tropical land assumed = 35 deg C, tropical water = 30 deg C
So, increasing ALL of tropical ocean water temperature by 0.1 deg C increases heat loss by 2.27 x 10^9
100% Ice	14.0	248.0	0.0	-2.0	271.0	0.01	271.01	52.96
80% Ice	        11.2	248.0	2.8	-2.0	271.0	0.01	271.01	57.47
60% Ice	         8.4	248.0	5.6	-2.0	271.0	0.01	271.01	61.98
40% Ice	         5.6	248.0	8.4	-2.0	271.0	0.01	271.01	66.50
20% Ice	         2.8	248.0	11.2	-2.0	271.0	0.01	271.01	71.01
0% Ice	         0.0	248.0	14.0	-2.0	271.0	0.01	271.01	75.50
But, decreasing Arctic Sea Ice Area in fall, winter, and spring increases heat losses to space by almost 20 x 10^9 units.
Less sea ice = More heat lost from the Arctic Ocean by LW radiation!
(emissivity of sea ice and open ocean is essentially the same, sea ice temperature assumed = air temperature = -25 deg C.)
Thus, relative heat lost (into space) in the last set of calc’s is:
(Area of sea ice) x (Temp sea ice)^4 + (Area of Open Arctic Ocean) x (Temp Ocean Surface)^4 = nominal heat radiated from the Arctic. One can play with the S-B constant and emissivities of both surfaces if one wishes, the relative result will not change.
davidmhoffer
The image you showed is weird. It looks like the blue part of that graph has been superimposed on the red part. They in actuality have totally different x axis values. The blue part of the graph shows probably 1000 times the intensity relative to the red. The blue (infrared) should be practically ‘flatlining’ on the red component of the graph, right at the bottom where you couldn’t resolve it by looking.
Yes, the blue and red sections are not to the same scale. One for the sun and one for the earth.
This is the paper that noted in the past there was delay in high latitude cooling of 10 to 12 years when there was an increase in the length of the solar cycle and provides an estimate of cooling for the location in question.
North pole
http://arxiv.org/abs/1112.3256
William: Latitude and longitude of Svalbard (Longyearbyen)
78.2167° N, 15.6333° E Svalbard Longyearbyen, Coordinates
South Pole:
There are cycles of warming in the paleo record (both poles, same periodicity, 1400 years plus or minus 500 years) The warming cycles were not caused by CO2 changes and were all followed by cooling phases.
http://wattsupwiththat.com/2012/09/05/is-the-current-global-warming-a-natural-cycle/
There are only two measurements worth taking in the Arctic Ocean
1. temperatue of the top 10 meters of open water.
2. Ice coverage extent.
-The latter is done reasonably well in the polar satellite era. The former, hardly if any. Eveything else is short term noise fluctuations (atmospheric pressure patterns, winds, air temps), as they are downstream effects of #1 and #2. CO2 GHG effects, if they persist beyond negative feedbacks, operate only in lower latitudes, as downwelling IR does not warm surface sea water during the daylight months. Increased downwelling conceptually can melt more sea ice, but once the fall-winter dark returns, rapid heat loss balances the system toward zero sum gain-loss.
If we look at http://www.climate4you.com/images/70-90N%20MonthlyAnomaly%20Since1920.gif
We see that Arctic temperatures were much higher than now in the period around 1930-1945
AndyG55,
Correct.
And Arctic ice has started regrowing rapidly:
The Arctic Ocean ice coverage is a feedback response system. The AGW believers want to believe that less AO sea ice means catastrophic GW is the coming apocalypse. It really means the climate system is releasing heat to the cold arctic skies in the dark days of winter. Copious amounts of Trenberth’s “missing” heat are lost on open Arctic Ocean nights. Man’s CO2 is just whisper in a robust feedback system.
joelobryan
Well, it is about time that the NSIDC got around to agreeing with you and I on this matter.
Read the following carefully – The NSIDC reports that the Royal Society of London concurs with your observation, and with what I have been showing for a while: Losing Arctic sea ice from today’s levels means increased heat loss from the Arctic Ocean 9 of the 12 months of the year, and increased heat gain from solar radiation only in May, June, and July.
http://nsidc.org/arcticseaicenews/2015/01/
RACook,
The Arctic Ocean system, in the shortterm, is best idealized as a pendulum. It has the same period , irregardless of the excursions, to the limits.
joeobryan, Dr Norman Page, Jimbo, icouldnothelpit
True. But like any oscillating system, the “forcings” do not change when the position of the pendulum changes. Gravity remains the same at top of right swing, middle, and top of left swing. Dymanic Friction (both air resisnce and bearing friction), however, is zero at left and right sides, and only increases across the bottom; but static friction of the bearing exists only at the top of the left and right positions.
Too too – far too many people – think that we should look at the “highs” or the “lows” for forcings: As if the Medival Warming Period was “caused” by something that happened at its maximum temperature point (1150-1250) and that the Little Ice Age “happened” because “something caused it to cool” in 1650!
Rather, the Little Ice Age “forcing” occurred BECAUSE a cooling force dominated in 1250, that finally STOPPED temperatures from increasing in 1250, and began them cooling down towards a low point in 1650, 450 years later. That WARMING FORCING between 1250 and 1650 caused TODAY’S WARMING, and is still happening. BECAUSE today’s warming is a high point that began 450 years ago, and its fundamental “cause” has not changed.
The same “something” as a positive forcing happened between 1250 and 1650 as happened between 1650 and 2000, and it will continue.
But, the EFFECT of that near-constant group of “positive forcings” and the one (or more!) “negative forcings” is a global average temperature that ALWAYS overshoots and ALWAYS undershoots the mythical “equilibrium” temperature.
The EFFECT today is an overshoot, and that overshoot may be peaking, or may continue for a little while longer. But the negative forcing have not stopped – in fact, if today’s weather is actually at a Modern Period Maximum, then we ARE seeing the largest negative forcings right now! (Of course, we are seeing the positive forcings as well.)
On your clock pendulum. The heat and humidity of the air inside the case are ever-changing, but they are “static” forces that do not change if you look at only one swing of the pendulum. Look at the problem over a full season, or between two pendulums at two different locations, and all of a sudden, the pendulum is longer (sometimes) than it was a few days before! The air friction got less! But, the “energy lost” on each swing depends on the momentary resistance of the pawl as it “clicks” off and on each swing to retard the clock mechanism – so that changes gradually over time as the bearings wear, the pawl tip wears away, and the dirt or corrosion builds up on the two surfaces. So what is “constant” and what is a good example?
Yet the pendulum goes back and forth, doesn’t it?
Again just a straight line (no trend). RSS actually are experts at superimposing a warming trend though.LOL
Furthermore, if you go to http://ocean.dmi.dk/arctic/meant80n.uk.php
And look at 1997 and 2012 (to match the graph in the article)
Any warming appears to be limited to the coldest part of the year.
How is this a problem ???
Well, first of all, there is bloody well very little AREA at either pole: between 71 north and the pole, there is only 14 Mkm^2 of Arctic Ocean (plus a tiny tip of Greenland.) What lies between 60 north and 71 north latitudes is the now-darkening tundra, taiga, Siberian wasteland and swamps, and ice-covered mountains. All getting darker and absorbing more heat as CO2 allows the low-laying plants and bushes to grow faster, earlier in the season, and with longer leaves and limbs.
Down south, there is nothing but ocean between 56 south and the pole: 14.0 Mkm^2 of Antarctic high dry plateau + 1.5 Mkm^2 of shelf ice + 2.5 to 16.0 Mkm^2 of sea ice + the rest of storm-tossed ocean. Call it 43.6 Mkm^2 of area between 56 south (Cape Horn) and the pole.
But there is 510 Mkm^2 of earth area. 90% of the world doesn’t matter because the remaining 0% is getting warmer? IF it is getting warmer at all?
Heck, there is 44.5 Mkm^2 between +5 degrees and -5 degrees latitude along! And that area actually gets radiated by the sun.
Well, second, the story makes no sense against what few measurements are actually made at both ends.
ftp://ftp.ssmi.com/msu/graphics/tlt/plots/rss_ts_channel_tlt_southern%20polar_land_and_sea_v03_3.png
The Antarctic doesn’t seem to be “warming” measurably when you measure it.
ftp://ftp.ssmi.com/msu/graphics/tlt/plots/rss_ts_channel_tlt_northern%20polar_land_and_sea_v03_3.png
And the Arctic is going up a little bit, but that can be explained by albedo darkening on the land surfaces, as would be expected as CO2 increases.
Oh wait. The DMI has forecast daily temperatures at 80 north since 1959. What did THEY report?
Winter temperatures have gotten higher (odd that – there is NO SUNLIGHT to react with refelcted CO2 gasses in the winter at 80 north. But during the summer? When there IS sunlight up north over the Arctic ice cap?
http://ocean.dmi.dk/arctic/meant80n.uk.php
0.0 change from the baseline average since 1959. ZERO CHANGE during the summer months at 80 north. And that deviation from an average who std deviation really is so close to zero you can see it plotted! (In fact, the DMI summer average temperature has been going down slightly as sea ice area area decreases. This is to be expected, the less Arctic sea ice that occurs from today’s sea ice extents, the greater the heat loss from the Arctic Ocean 9 months of the year. )
“But there is 510 Mkm^2 of earth area. 90% of the world doesn’t matter because the remaining 0% is getting warmer? IF it is getting warmer at all?”
What happened to the 10% and proof reading?
Bummer.
But, you see, if the Antarctic is getting cooler, and the Arctic getting warmer (14.0 Mkm^2 / 510 Mkm^2) , then 2.7% is getting warmer. Except that 2.7% is only getting warmer when the sun don’t shine on it and nobody is present to take measurements on it.
So, how much area is actually getting warmer due to CO2 and radiation? Apparently, 0.0%. 8<)
Do I understand correctly that temperatures in the United States which has the best monitoring system and most sampled locations has been cooling for a decade or more, and the poles which have the poorest and least number or monitored locations are showing temperature increases?
Yes. And the poles are ripe targets for “infilling” algore-rithms. AGW is largely man-made. (read that how you wish).
Killer words:
“using a statistical method to infill the missing data at the poles, especially in the Arctic”
They faked “data” and report the “Faked Data” as observations, and then use their Fake Data to corroborate their cherished hypothesis.
FAIL.
Boffin these days are all the rage.
Seeming as no one has yet any reliable way to properly measure temperatures over the entire polar regions any papers that come out arguing warming or cooling based on the minuscule temperature measuring ability we have need to be used in the bathroom as toilet paper.
A much more common sense approach to temperatures in the polar regions is sea ice. If it’s growing compared to the previous year there’s a good chance that the region has cooled, if it’s receeded from the previous year there’s a good chance it got warmer.
Science 101. Anyone can do it and thus no one qualifies for money to state the bleedin obvious!
wickedwenchfan
But that is NOT what happens.
When Arctic sea ice is lost in September, the next spring sea ice maximum is much HIGHER! Much larger than the previous year.
Your “Science 101” is dead wrong. And dead right at the same time.
Logical, at first glance – at first glance at a college student “101” level in a dry and warm lecture hall reading from a simplified textbook calibrated to a shallow water pond in the middle of a campus in the northern hemisphere at 40 degrees north latitude, but not when you look at the system as a professional needs to.
See, in the real sea ice up north (the Antarctic is different, use the right equations and the right logic to solve the right problem!) low amounts of sea ice in September do NOT mean “more heat is absorbed”. Rather, less sea ice means “More heat is lost from the newly exposed open ocean through increased convection to the air, reduced condution losses between ocean water and air, increased long wave radiation losses to the atmosphere and to space, and increased evaporation losses from the open ocean surface. Is more heat absorbed into open ocean compared to sea ice? A little more is absorbed in August; about the same in September, much less in October, none in November, December, January, or February; about the same in March; and a little more in April.
Net? Heat loss = heat gain when re-freezing begins August 12-14 each year.
So.
Less Arctic sea ice in September = More heat lost from the Arctic Ocean = More sea ice area the next year in March, April, May, June. “Science 101”? No. “Measurements, Real World 606.” Deal with it.
Oh. That Antarctic sea ice that has been constantly increasing since 1992?
Yeah. It DOES reflect more energy than is absorbed every day of the year, 365 days a year. More Antarctic sea ice in February (when solar radiation is still near its annual peak) = more heat reflected from the planet = a cooler planet.
Odd as it may seem I check Antarctic Weather every few days and as far as I can see there’s barely been a few hours when anywhere on the Continent has been above freezing…and we’re well past mid summer.
Anybody claiming Antarctic lost any ice mass this year would have to be barking.
I think any the loss of any ice must be due to the holes they keep drilling in the darn stuff. Maybe someone could get some funding to do a study on the impact their studies have had.
Add the word significant and I am with you on the ice loss. There is always some sublimation occurring on wind swept ice.
This post is dedicated to the good people of New England, buried under record depths of snow,,,
“Children just aren’t going to know what snow is.”
– Dr David Viner, Climatic Research Unit (CRU), University of East Anglia
http://www.independent.co.uk/environment/snowfalls-are-now-just-a-thing-of-the-past-724017.html
Boston already has set a new record for monthly snowfall this February, and it’s only the middle of the month!
OK you warmist imbeciles, repeat after me, v-e-r-y s-l-o-w-ly: “I blame global warming.”
MORE SNOW, INTENSE COLD COMPOUND THE MISERY
http://www.bostonglobe.com/metro/2015/02/15/snow/2IO1E0ibEJ1PK1sC1wPAyO/story.html
By Jennifer Smith and Jeremy C. FoxGlobe Correspondents February 15, 2015
Boston braced Sunday night for a life-threatening deep freeze after a blizzard bombarded parts of the region with nearly 2 feet of snow and gale-force winds.
The sixth winter storm in three weeks made February Boston’s snowiest month on record, with 58.5 inches, besting by more than 15 inches the previous record set in January 2005.
Temperatures were forecast to plunge below zero overnight Sunday, with wind chills as low as 20 to 30 degrees below zero, and to remain well below normal all week, according to the National Weather Service. Forecasters warned that another storm could hit the area beginning Tuesday evening.
My son came up with a tongue in cheek solution for the ice in Boston: Load the snow they can’t get rid of up in box cars and take it to the Sierra’s and dump it. Boston get rid of its piles of snow and California gets its missing snow pack. Win-win.
Actually we’ve had 96 inches since January 25th with another 6 inches due tonight. The one word weather report in the paper a few days ago got it right, Fargo.
As cold is actually the absence of heat, it appears we have more and more missing heat to account for in whatever heating is found at the poles. And, if the poles heat faster than the lower latitudes, the temperature differential will decrease, and so will the potential energy for storms, logically.
DURHAM, N.C. (AP) — A powerful winter storm dumped snow from Nashville to Nantucket, and arctic-like temperatures gripped much of the U.S. and hundreds of thousands of people lost power in the South.
http://news.yahoo.com/biting-cold-air-follows-latest-england-snowstorm-073636342.html
Once again you warmist imbeciles, repeat after me, v-e-r-y s-l-o-w-ly: “I blame global warming.”
*****************
Winter is eastern and central North America continues very cold, as Joe D’Aleo and his colleagues at WeatherBell correctly predicted last summer.
This is the second year in a row that the US National Weather Service and Environment Canada both incorrectly predicted a mild winter in their long-range forecasts, and WeatherBell correctly predicted a cold winter.
I remain concerned about Excess Winter Mortality rates, especially in regions that do not adequately adapt to winter through proper home insulation and central heating, and drive up energy costs through costly and ineffective green energy schemes.
I expect that global warming hysteria will be muted in much of North America after two very cold winters in the populous Eastern and Central regions.
Best regards, Allan
Arguing about ice extent and temperature trends in the Arctic and Antarctic is easy to do when the data are difficult to measure in such remote places, and so few people have the opportunity to visit them. The Arctic ice extent seemed pretty robust from 36,000 feet when I flew over Greenland, Baffin Bay and Baffin Island last April 15, and I was not surprised to learn that the Ice extent in Baffin Bay was at a 30-year high when I checked the Canadian maritime ice service after arriving home. This year, ice is regrowing vigorously in Casco Bay on the Maine sea coast, and soon the days will return when people will be able to drive their cars across the ice between the islands there as they have done in the past.
All of the hair splitting that is occurring now is happening because the models are obviously WRONG; their predictions have FAILED. It’s becoming more and more apparent with each passing winter now. Just ask about anyone in the Northeast (and especially Boston) what they think. The gravy train is about to come to a screeching halt for proponents of AGW, and they are desperate.
If the poles are warming, and global temps are paused, that means the rest of the planet is getting colder.
Thanks, Paul. Irrefutable logic.
Could one speculate a bit further? How nice it would be to conduct a planet sized experiment on the forcing effect of CO2 alone , in conditions where no other potential GHG species can influence the result and where the albedo and solar input over the course of a year are accurately known.
Does not the Antarctic provide exactly that . The H2O concentration is very low , and since the Antarctic plateau is at altitude , the volume ratio would fall anyway with altitude whist that of CO2 does not .
I have no idea what effect weather patterns from the ocean boundary would have , but if they do not disrupt this experiment then the warming of the Antarctic latitudes is entirely due to the CO2 radiative forcing thus giving an estimate of big the effect could be,
At other latitudes where water vapour is present and abundant , perhaps a negative feedback system involving H2O is affecting the lower or nonexistent temperature rise, even without the (probably dominant) role of the ocean circulations.
I have wondered if part of what causes either of the poles to warm is when the cold polar air gets redistributed away from the pole, causing a cold flow as it travels away from the pole. The movement would bring warmer air into the poles, while cooling regions away from the pole. Could this be part of the explanation for southern sea ice growth? The Antarctic cold is pushed outward leading to a slight warming on the continent, and a major cooling at the edges of the sea ice from the deep cold emanating from the interior.
No…. if the poles are warming, but it is not accounted for, then the planet is warming more than we thought.
http://icecap.us/index.php/go/joes-blog/reports_snow_increasingly_rare_becomes_we_knew_snows_would_be_heavier_in_wa/
February 2 08:42 AM
The theme had been snows were diminishing due to global warming.
Flashback 2000: ‘Snowfalls are now just a thing of the past’: According to Dr. David Viner, a senior research scientist at the climatic research unit (CRU) of the University of East Anglia, within a few years winter snowfall will become ‘a very rare and exciting event. Children just aren’t going to know what snow is.’
The IPCC and US government reports through 2007 had projected snows would become much less common as the climate warms especially in the cities.
Environmentalist from Princeton Michael Oppenheimer and RFK Jr, in the year before the Snomageddon winter both bemoaned their children would never get to enjoy sledding like they did as young in the 1960s.
Theories and hypothesis come and go, but to ascertain their validity we need credible data. Habit of changing the past data records be it temperatures, sunspot records, or whatever else to suit currently favoured agenda is not only regrettable but it is the anti-science.
If the pseudo-science is wrong interpretation of the available data to suit one’s beliefs, then the anti-science is altering the available data to suit one’s beliefs.
If anti-science is practiced by keepers of global treasury of data, it is an attack not only on the progress of science but also an attack on the progress of humanity.
If the poles were warmer the ice would melt and we would be able to go there and get good measurements.
what climate change, and reasons for an increase in temp.
http://www.wmo.int/pages/themes/climate/statistical_depictions_of_climate.php
“These changes can also occur to weather stations that are still in rural locations and are often harder to detect. For instance, the growth of trees around a farmstead that maintains a weather station alters the local wind flow and temperature patterns, and so reduces extreme wind speeds and the incidence of frosts (where they occur). The trend in the observations reflects the changes in the microclimate of the farmstead while the general climate may not have changed”
they said it,” may not have changed”
http://www.drroyspencer.com/2015/02/what-to-call-a-nyt-reporter-of-climate-science/
even here he is translated !!!
apparently this 250km high cloud whatsit on Mars doesn’t fit in with the models.
The explanation is very simple: The face on Mars sneezed! (ok I’ll stop laughing and add /sarc)
If it’s warming so fast in the Arctic, how do they explain that the ice extent is right on average and the ice thickness has been increasing. We are not getting these huge masses of frigid air because it’s warmer up there. They are counting on the ignorance of the public. They are the kind of people you should never turn tour back on.
Environment Canada issued an extreme cold warning with wind chill at -55 Centigrade a couple of weeks ago
in Resolute and Repulse Bay ect… Nanuvut..
http://iceagenow.info/2015/01/blizzard-winter-storm-snowfall-extreme-cold-warnings-eastern-canada-nunavut/
And for today in Baker Lake
http://weather.gc.ca/warnings/report_e.html?nu2
Where is the warming? Is it supposed to mean warmer than -70 C?
Another case of attempting to swat mosquitoes with a sledgehammer or a better metaphor might be “picking at fly shit” to explain away data which does not help to conclude the warmist point of view. Global is global.
Jim G1
When trying to keep food clean (by cleaning utensils and a serving tray before eating), or to clean up food after it has been deposited with fly shiite, there ARE times when “picking at fly shiite” is a worthwhile endeavor…..
Now, there are fast ways to “pick at it”, and efficient ways, and slow ways … But sometimes, yes, you do have to “pick at fly shiite” …. in all of its gory details. Besides, swinging at mosquitos with sledgehammers is even harder. 8<)
Is there something not understood about the term “global”? There is, and has been, a multi-decade pause in global temperature increase, even considering all of the adjustments to past data favoring temperature increase and all of the siting problems, etc. CO2 has continued to rise, ie, no significant relationship between the two. Even were the poles warming slightly, the prognostications of those seeking to potray catastrophe are dead wrong. The real catastrophe will be if it gets a great deal colder and the social and economic damage wrought by the politics of warming. Again, I say “flyshit” to this newest excuse, right or wrong, regarding the facts of the global pause.
The AMO is now negative. If it stays this way Arctic Sea Ice will continue to expand.
The Arctic may stay on the warm side going into the future but this will be due to a weak polar vortex likely going forward ,which will be due to ozone distribution changes in a vertical and horizontal sense due to prolonged minimum solar activity .
Meanwhile Antarctica, has record sea ice or near record sea ice ,while oceanic temperatures are below average and the temperature trend for the Continent of Antarctica has been down, making all the assertions in this article essentially BS.
wow, its all freakily bad-
http://www.wmo.int/pages/prog/wcp/ccl/guide/documents/english/WMO_100_en-chap2.pdf
“The representativeness and homogeneity of climatological records are closely related to the location of the observing site. A station sited on or near a steep slope, ridge, cliff, hollow, building, wall or other obstruction is likely to provide data that are more representative of the site alone and not of a wider area. A station that is or will be affected by the growth of vegetation, including even limited tree growth near the sensor, growth of tall crops or woodland nearby, erection of buildings on adjacent land, or increases (or decreases) in road or air traffic (including those due to changes in the use of runways or taxiways) will provide neither broadly representative nor homogeneous data”
what happens when these stations are also estimating up to 1200 kilometers away.
well i never-
“The nature of urban environments makes it impossible to conform to the standard guidance for site selection and exposure of instrumentation required
for establishing a homogeneous record that can be
used to describe the larger-scale climate”
Yes. Thermometers located in the path of air conditioner exhaust measure the temperature of the exhaust.
Thats why the US climate reference network was created. All stations are well located far away from urban areas.
It is also impossible to “correct” the bad data from urban areas. There is no scientific control. All data from urban temperature stations must be rejected from any global calculations. If you do want to know the temperature next to an airport runway, then that’s fine for that specific purpose. Just don’t use that data as an estimate for the climate in that region.
There are a very few surface temperature stations with good long term siting. Good rural data show zero warming.
New Paper Confirms the Hiatus Is Not Occurring at the Poles, Undermining the Efforts of Cowtan and WayBetter title(?):
“New Paper Shows that Cowtan-Way Arctic Reconstruction Does Not Mitigate Global Warming Pause”
where ‘mitigate’ has the usual meaning (according to Webster): “to make (something) less severe, harmful, or painful.” The “pause” has certainly pained the warmists, and harmed their reckless planning.
All of this confusion begs the question what does the “global” in global warming refer to. There is no real answer but creative answers are born depending on who the audience is and what grant is on line.
The quibbling over what the “real” temperature trend of a particular area is to influence the elusive “global temperature” construct. If latitudes x cools, then got to find some place else that compensates with extra warming whether it be latitude y or one of the poles. Or visa-versa.
It’s a game, mostly childish, mostly a waste of resources. Stop trying to warm or cool a region through manipulating unreliable data. There has got to be more meaningful avenues for climate research. Stop the madness,
Agreed.
It is very curious that this so-called “scientific” controversy has split the protagonists into two groups according to their political and economic beliefs. The warmists tend to be socialists who favor re-distribution of the world’s wealth and privilege. The skeptics tend to be conservatives who favor national fiscal responsibility and strong national security.
Why is that so? I think it tells us 1) that this controversey is more about politics than science, and that 2) the scientific uncertainty of the CAGW hypothesis is much, much larger than its certainty.
Please leave the Poles out of this !
I am part Polish and do not want Poland blamed for any of this. We may not have invented the internet like “Climate Pope” Al Gore did, but one of our scientists did invent the Czochralski Process, without which you’d be reading this comment in a newspaper.
Also stop using the propaganda word “hiatus” — not only is this rarely used word hard to understand for a typical person — until today I thought it had something to do with an injury to the abdominal muscles — but it also implies global warming will soon resume, and people know what the future climate will be (so much warming investment bankers in lower Manhattan will be taking gondolas to their Wall Street offices, blah, blah, blah).
Since no one knows whether or not warming will continue, and no one can predict the future climate, we skeptics should NOT play the warmists game by using the “hiatus” word they have very carefully chosen for its propaganda value.
If there has been no global warming trend since roughly 1998 to 2002, then we must assume we are in a global cooling trend.
.
The average temperature is either rising or falling — it does not remain constant since Earth is not in thermodynamic equilibrium.
We could be in a new cooling trend since 1998, or we are still in a warming trend and measurement errors, and/or poor statistical analysis, such as looking at too short a period, etc. is making it temporarily appear that the average temperature is not changing.
The skeptics typical focus on tiny average temperature anomalies, individual years, and very short periods of Earth’s history, are less useful than reading tea leaves in a cup (at least you get to drink some tea first, so reading tea leaves is not a complete waste of time).
My climate blog, which includes climate articles, recipes, advice for single women, and a centerfold with a big hiatus, is located here:
http://www.elOnionBloggle.blogspot.com
Richard said:
“Please leave the Poles out of this!”
Cannot do it Richard – the Poles are everywhere – even in this debate on Canadian politics:
Rect. said:
“Chinese-Canadians whine about the Pole Tax.”
Correction Rect.:
Actually, Chinese-Canadians complain about the Poll Tax – it’s Polish-Canadians who complain about the Pole Tax.
🙂
Yeah. It’s a Canadian Poll tax alright.
But the only ones that have to pay it live north of 66.5 degree north latitude……
surely this cannot be good-
WMO-
“The aim of the homogenization procedures is to detect the inhomogeneities and to correct the series. In practice there are absolute and relative methods applied for this purpose. However the application of absolute methods is very problematic and hazardous since the separation of climate change signal and the inhomogeneity signal is essentially impossible.”
Still on the first ship sailing off into the unknown debating on where the edge of the ocean is.
One of the main arguments against anthropogenic global warming is that despite the increase in CO2 levels there has been no warming over the past 18 years. If, however, the polar regions have continued to warm then surely that tends to disprove the arguments of the sceptics?
Here is a link where you can see what is happening with Arctic temps. The data goes back to 1958, so you can see year by year the temp changes in the Arctic…http://ocean.dmi.dk/arctic/meant80n.uk.php
Both polar regions combines account for less than 8% of the earth’s surface area. And only the arctic has warmed.
So.. “If, however, the polar regions have continued to warm then surely that tends to disprove the arguments of the sceptics?”
…not so much.
Well the problem is Antarctica is cooling.
Um…
Given that the USA East Coast is having record cold and massive snow as very very cold Arctic air flows down over them… just how can that Arctic air be warmer than in prior years? The Arctic is NOT presently “warm”, it is darned cold. Freezing happened fairly fast this year, and the usual winter Arctic Blast is colder than for a very long time.
It’s just crazy talk to assert that a warmer Arctic is involved. In anything.
A colder Arctic and the faster flow rate of heavy frozen air out of it is causing Boston to turn into a snow bound icicle and most of the North East to be setting records for cold and snow; but that has nothing to do with warming, of any kind and in any place.
It’s the CO2. Turning into dry ice. Very cold. Unprecedented. What else could it be?
/s
The only measurement we should watch is unadjusted Valentia. Dropped the pick near the lighthouse once when I was a yachts person. Golly, it’s rural out there!
Recovery mechanisms of Arctic summer sea ice, Reason for Highest Antarctic Sea Ice in recorded history all months of the year, and reversal of Global warming
Mechanism 1)
Recovery mechanisms of Arctic summer sea ice
Mechanism 2)
Summer temperatures in Arctic polar region does remains below 0C, due to a significant increase in Arctic cloud cover in the summer months. See 2010, 2013, and 2014. Note those specific years are the only years in the data base were this phenomena is seen which explains why multi year ice is increasing. Note Mechanism 2 is likely related to, caused by mechanism 3.
http://ocean.dmi.dk/arctic/meant80n.uk.php
Recovery mechanisms of Arctic summer sea ice, Arctic winter ice, and Antarctic Sea Ice All months of the year, and Reversal of ‘Global’ warming
Mechanism 3)
Solar magnetic cycle affects
The latitudinal regions of the planet that warmed in the last 150 years are the same regions of the planet that warmed in the past during a D-O cycle. It is known that solar magnetic changes correlate with the past warming and cooling cycles.
Greenland ice temperature, last 11,000 years determined from ice core analysis, Richard Alley’s paper.
http://www.climate4you.com/images/GISP2%20TemperatureSince10700%20BP%20with%20CO2%20from%20EPICA%20DomeC.gif
http://www.climate4you.com
http://www.solen.info/solar/images/comparison_recent_cycles.png
I consider myself a skeptic, but my take away from the post is the concession that the poles are rapidly warming. Not withstanding prior contradictory reports of no or little warming. Interesting passage from contest to concession and more noteworthy than “it wasn’t the warmist claims of missing data.”.
But the reality is the SOUTH POLE is not warming.
http://icecap.us/images/uploads/antarctica_white_paper_final.pdf
The data shows clearly that Antarctica is NOT warming. That is the reality.
I understand that a recent paper was published which said that tha arctic has had regular warming events over many years so cannot be indicative of anthropic warming
http://wattsupwiththat.com/2009/03/01/nsidcs-walt-meier-responds-on-the-sensor-issue/#more-5949
I expect there was much less ice in the Arctic in the early 1940’s than today.
We know that 1934 was the warmest year in the lower 48 states of the USA.
We also know that 2008 was no warmer globally than 1940. See
http://www.iberica2000.org/Es/Articulo.asp?Id=3774
We also know the story of the good ship St. Roch:
In 1940-1942 the St. Roch became first vessel to complete a voyage through the Northwest Passage in a west to east direction.
In 1944, she became first vessel to make a return trip through the Northwest Passage, through the more northerly route considered the true north west passage, and also the first to navigate the passage in a single season.
Why compare to 1979-1980? After WW2 there was ~30 years of moderate global cooling that ended in ~1977. Lots of sea ice then.
Try comparing today to 1940-45.
Then please recognize that humanmade CO2 emissions have increased ~800% since ~1940. And it is no warmer today than in 1940.
Please tell me again how CO2 is driving catastrophic global warming.
Also, since CO2 lags temperature at all measured scales, please tell me how the future drives the past.
Regards, Allan
*****************************************
St. Roch
From Wikipedia, the free encyclopedia
Career
Launched: 1928 at Burrard Dry Dock Shipyards
Fate: Designated a Canadian National Historic Site at the Vancouver Maritime Museum in 1962
General characteristics
Displacement:
Total Length: 37.8 m
Length, waterline:
Beam:
Draft:
Mainmast,height from deck:
Foremast,height from deck:
Propulsion: Sails & a 150-HP diesel engine[1]
Sail area:
Mainsail area:
Crew:
The St. Roch is a Royal Canadian Mounted Police schooner, the first ship to completely circumnavigate North America, and the second sailing vessel to complete a voyage through the Northwest Passage. (It was the first ship to complete the Northwest Passage in the direction west to east, going the same route that Amundsen on the sailing vessel Gjøa went east to west, 38 years earlier.)
The ship often was captained by Henry Larsen.[1] The ship can now be found at the Vancouver Maritime Museum in Vancouver, British Columbia, Canada and is open to the public for scheduled visits.
History
1928 – constructed in North Vancouver, British Columbia, Canada at Burrard Dry Dock Shipyards
1929-1939 – supplied and patrolled Canada’s Arctic
1940-1942 – became first vessel to complete a voyage through the Northwest Passage in a west to east direction
1944 – became first vessel to make a return trip through the Northwest Passage, through the more northerly route considered the true north west passage, and also the first to navigate the passage in a single season
1944-1948 – patrolled Arctic
1950 – became first vessel to circumnavigate North America, from Halifax, Nova Scotia to Vancouver, British Columbia, via the Panama Canal
1954 – returned to Vancouver for preservation
1962 – designated a Canadian National Historic Site at the Vancouver Maritime Museum
Allan, I agree. I live near the hub of North America and we have had some warm and cooler decades over the past century, but the record is clear, the most recent 25 years, (That we are told are so unGodly hot), the average temp over the past 25 years is exactly the same as the first 25 years of the previous century. But, we have a small urban heat island impact here – that is the key.
I’m astounded that so much emphasis is put on what happened in the past decade or two. It is Geology 101 that a human lifespan is a blink of a blink of a blink of an eye, in geologic time. Has the arctic and the rest of the oceans warmed in the past half of my life, (I’m 56) and if they have, it is man made causation? Really? 310 million cubic miles …MILLION CUBIC MILES…of ocean water warmed (or did it)…because I drive a Yugo and have a few electric light bulbs on at this late hour. Only the ignorant would buy that baloney.
The headline on this posting conveys the opposite of what the data conveys.