Guest Post by Bob Tisdale
The UKMO issued their most recent 5-year global temperature forecast about a week ago. See their Decadal forecast press release for 2015. It has been getting a little press recently. The forecast description wasn’t as clear as it could have been, but the UKMO openly displayed the failure of the forecast from 2009 sea surface temperatures.
SUMMARY
The summary includes three bullet points. The first reads:
Averaged over the five-year period 2015-2019, forecast patterns suggest enhanced warming over land, and at high northern latitudes. There is some indication of continued cool conditions in the Southern Ocean, and of a developing cooling in the North Atlantic sub-polar gyre. The latter is potentially important for climate impacts over Europe, America and Africa.
This suggests that the UKMO’s models are capable of regional forecasting, yet at the end of the forecast they openly discuss factors that prevent this.
The second bullet point is:
Averaged over the five-year period 2015-2019, global average temperature is expected to remain high and is likely to be between 0.18°C and 0.46°C above the long-term (1981-2010) average of 14.3°C. This compares with an anomaly of +0.26°C observed in 2010 and 2014, currently the warmest years on record.
In other words, over the next five years, their models forecast that global surfaces may be a little warmer or a little cooler than 2014, as much as 0.2 deg C warmer or as much as 0.08 deg C cooler. [Sarc on.] That narrows it down. [Sarc off.]
Also, that second bullet point is basically the same as the 5-year forecast from 2014. See the WaybackMachine archive here:
Averaged over the five-year period 2014-2018, global average temperature is expected to remain high and is likely to be between 0.17°C and 0.43°C above the long-term (1981-2010) average. This compares with an anomaly of +0.26°C observed in 2010, the warmest year on record.
The final bullet point from the 2015 forecast reads:
Although the forecast generally indicates that global temperatures will remain high, it is not yet possible to predict exactly when the slowdown in surface warming will end.
The phrase “global temperatures will remain high” is curious. It leads one to believe that global surface temperatures might somehow return to “normal”.
Also, remarkably, the UKMO acknowledged in that bullet point (1) that the “slowdown in surface warming” continues and (2) that they still have no idea when the “slowdown” will end.
I suspect in response to that “slowdown in surface warming” statement we might see some flawed arguments that global warming continues, along with some graphs that show long-term (1900 to 2014) and short-term (1998-2014) trends are comparable. See my Figure 1. Similar graphs have appeared around the blogosphere.
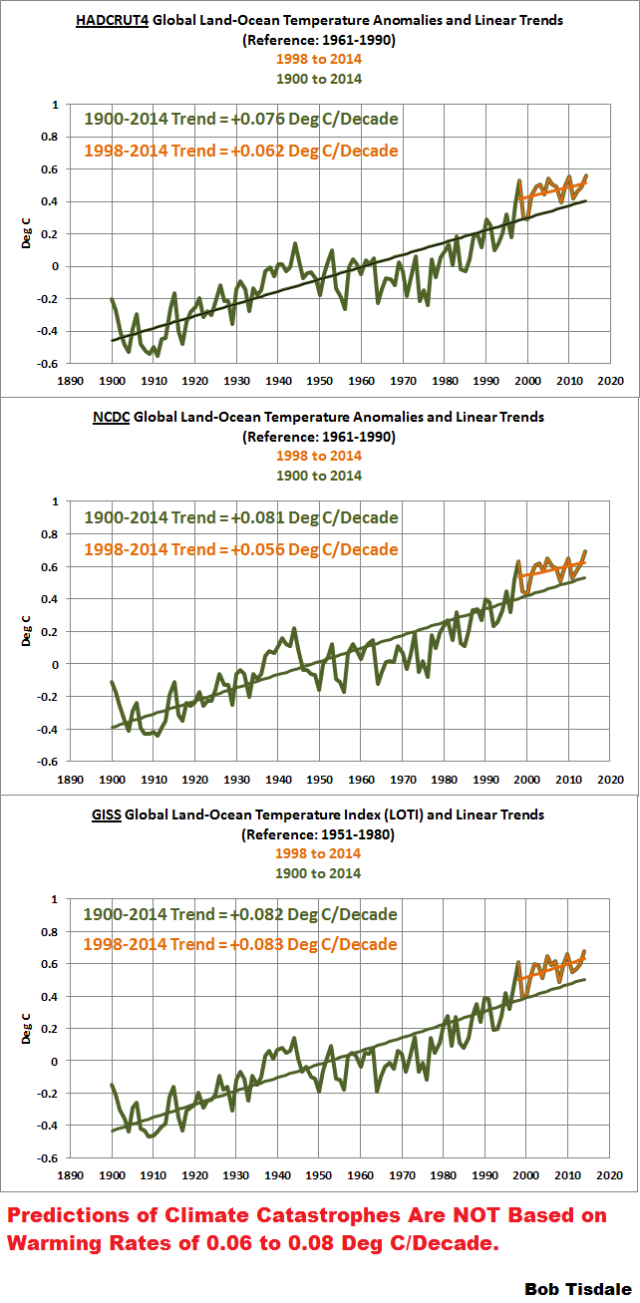
My Figure 1
Why is that a flawed argument?
Predictions of gloom and doom are not based on warming rates of 0.06 to 0.08 deg C/decade. The climate models used by the IPCC for their recent 5th Assessment Report simulate much higher warming rates for the short-term. That is, the recent CMIP5 model estimates of short-term (1998-2014) warming and the projections of future global warming initially align with the warming rate from 1975 to present, not from 1900 to present. See the two graphs in my Figure 2.
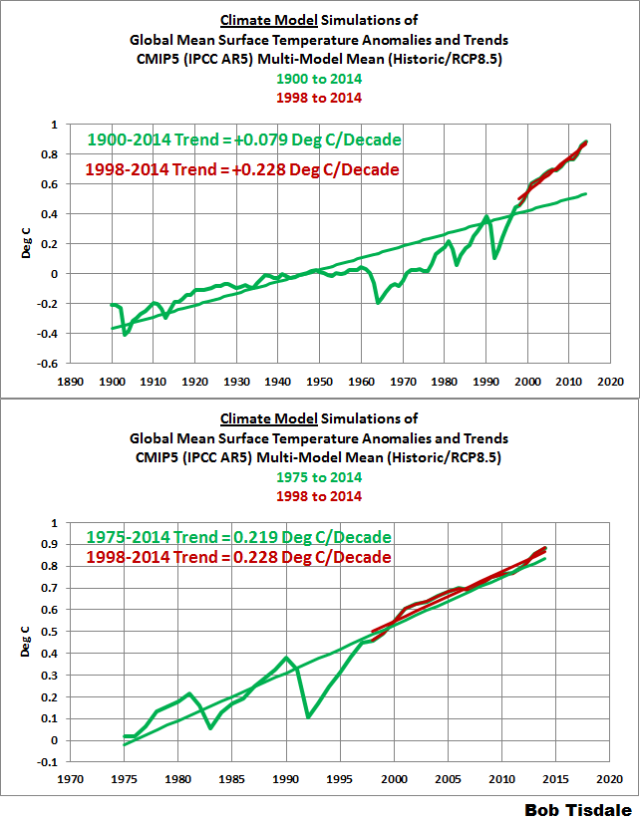
My Figure 2
THE FORECAST FROM 2009 GLOBAL SEA SURFACE TEMPERATURES WAS A CATASTROPHIC FAILURE
Under the heading of Verification, the second paragraph of the 2015 UKMO 5-year forecast reads and includes the following illustration:
The maps in Figure 4 compare observed (A) and forecast (B) surface temperatures (°C) for November 2009 to October 2014 relative to the 1981-2010 long-term average. Forecasts were made starting from November 2009 using the latest system based on HadGEM3. Stippling shows regions where the observed temperatures do not lie within the 5-95% range of the forecast.
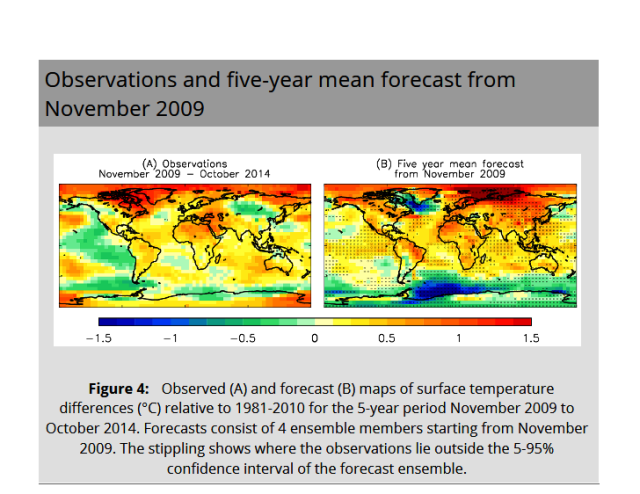
Their Figure 4
Just in case you’re having difficulty seeing the differences and the stippling, see Animation 1. I’ve darkened the illustrations to bring out the stippling, which covers most of the globe. That means for much of Earth’s surface the observed global surface temperatures were outside the range of the multiple climate model runs used in the forecast. In other words, the 2009-based forecast was an abysmal failure.
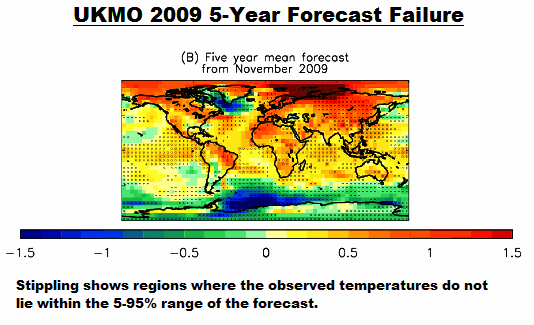
Animation 1
The closing paragraph begins:
The decadal forecast system predicted enhanced warming over high northern latitudes, and cooling in the Southern Ocean and North Atlantic sub-polar gyre. These are in broad agreement with the observations, although there are differences in the precise magnitude and location of anomalies.
“Broad agreement” is an odd phrase to use when stippling indicates the observed temperatures in much of the Southern Ocean and in the high latitudes of the North Atlantic did “not lie within the 5-95% range of the forecast”.
UKMO goes on to explain why the models failed in other regions:
However, the forecast did not predict the cooling in the eastern tropical Pacific associated with the negative phase of the Pacific Decadal Oscillation (PDO), and the cooling over parts of China associated with a negative Arctic Oscillation (AO). This is consistent with the fact that decadal prediction systems are not yet capable of predicting the PDO or the AO for the coming five years.
And the fact that the decadal prediction systems are still not able to predict the Arctic Oscillation and the Pacific Decadal Oscillation (an aftereffect primarily of El Niño and La Niña events) highlights a couple of cold realities: 5-year forecasts from the past that are more successful are based solely on luck, not skill, and all future regional forecasts are basically valueless until the UKMO is capable of forecasting natural variability such as El Niño and La Niña events, the Pacific Decadal Oscillation, the Arctic Oscillation, the North Atlantic Oscillation, etc.
Hello Vicky Pope! Earth calling Vicky Pope… we will never forget this:
On a positive note, she did mention the climate “N” word; natural variation.
The rest of it was a prognosis for the planet based on a feeble almost dim-witted diagnosis. Climate scientists could gain considerable credibility if instead of predicting the future they did a much better job of explaining the past.
The disarray in the ‘climate science’ is rather amusing. Latest excuse for the hiccup in the models ‘excellence’ is the volcanoes, but the data shows otherwise:
http://www.vukcevic.talktalk.net/CRUTEM4.gif
I particularly liked “it’s very difficult to disentangle natural variations from climate change”.
Global or even hemispherical forecasts are next to impossible, the globe is made of regions which often run out of synchronism, thus I concentrate on the CET
http://www.vukcevic.talktalk.net/CET-WS-Fcst.gif
Close enough for government work.
“… it is not yet possible to predict exactly when the slowdown in surface warming will end.”
Nor is it possible to predict that when the slowdown in surface warming ends, what the rate of the new trend will be and whether it is more warming or new cooling.
Although we can say, with 100 percent confidence, that when the slowdown ends the new trend will be either cooling or warming.
Nov 2009
“4 degrees of global warming: regional patterns and timing”
http://podcasts.ox.ac.uk/4-degrees-global-warming-regional-patterns-and-timing
Please help me understand why I am seeing an increase in temperature at the rate of .06 +/- in the data sets (figure 1) for the period 1998 to 2014 yet Lord Monckton reports on the pause every month showing temperatures being essentially flat over this period with the same data. What am I missing?
jbutzi: If I remember correctly, the margin of error of temperature measurements is about 0.1 degrees. Thus, statistically, 0.06 is zero. Strictly speaking, as a scientist myself, I’m a bit put off by people saying 0.02 degrees warmer or 0.06 degrees warmer when the instruments we use are not that accurate, even under the best of environments.
Even if the instruments were that accurate they aren’t measuring the proper thing, they measure local temperature not global average temperature abnormalities.
jbutzi: Christopher Monckton presents lower troposphere temperature data, not surface temperature. Similar datasets, but not the same.
Bob, Your figure 2 is confusing as (I assume) it is missing the real data from
2000 onward. Can you add the tan lines from figure 1 to figure 2? Or else I
am missing something.
Surface includes blacktop and tarmac
Bill_W, there are no data in my Figure 2. Those are climate model outputs.
If you look at Paraguay, you will have most of the explanation. No warming at all suddenly becomes rapid warming after, what do they call it, homogenization?
https://notalotofpeopleknowthat.wordpress.com/2015/01/26/all-of-paraguays-temperature-record-has-been-tampered-with/#more-12774
Me, I call it scientific fraud. There is just no other word strong enough.
NOAA’s future climate forecasts run about 100% wrong for the last 5 years. I look at their site each month and nearly always they predict the NE north American continent will be unusually warm. This has been their steadfast prediction for years and it hasn’t happened.
This month, they did admit that finally, temperatures are below normal but then, in the next month of March, it will be above normal which I seriously cannot believe.
This entire coming week will see severe cold, snow every day here in Upstate NY.
> This entire coming week will see severe cold, snow every day here in Upstate NY
Hey we must be climate experts. Nasty weather in upstate NY in February.
Seriously, do these people have windows in thier offices?
Run a line through it. Match a curve to it. Overlay a cyclic on it. Weight it. Fudge it. Nothing projects the increases they propose.
…Charge it, point it, zoom it, press it,
Snap it, work it, quick, erase it,
Write it, cut it, paste it, save it,
Load it, check it, quick, rewrite it
Plug it, play it, burn it, rip it,
Drag and drop it, zip, unzip it,
Lock it, fill it, curl it, find it,
View it, code it, jam, unlock it
Surf it, scroll it, pose it, click it
Cross it, crack it, twitch, update it…
Daft Punk – Technologic
Eustace –
Not my music, really.
But for explorers, do try –
Auto
This is getting hilarious…
Although UKMO hasn’t a clue when the “HIATUS” will end, they are mysteriously confident that global temps will rise over the next 5 years….
Why?
30% of all manmade CO2 emissions since 1750 have been over the last 18.5 years, with no RSS global warming trend to show for it..
Since 1850, there has been a 100% correlation between PDO warm/cool cycles and global warming/cooling trends. There is absolutely no reason to postulate rising CO2 levels will suddenly end this strong correlation during the current PDO cool cycle, which started in 2005:
http://www.woodfortrees.org/plot/hadcrut4gl/from:1850/to:1880/plot/hadcrut4gl/from:1850/to:1880/trend/plot/hadcrut4gl/from:1880/to:1921/plot/hadcrut4gl/from:1880/to:1921/trend/plot/hadcrut4gl/from:1921/to:1943/plot/hadcrut4gl/from:1921/to:1943/trend/plot/hadcrut4gl/from:1943/to:1977/plot/hadcrut4gl/from:1943/to:1977/trend/plot/hadcrut4gl/from:1977/to:2005/plot/hadcrut4gl/from:1977/to:2005/trend/plot/hadcrut4gl/from:2005/plot/hadcrut4gl/from:2005/trend
The current AMO warm cycle is also winding down, which perhaps explains why Arctic Ice Extents are recovering. I can’t wait to see what happens when the next AMO cool cycle starts around 2020.
The current weak solar cycle peaked in 2014, so starts its slide down from this year to the next solar cycle starting around 2022. This may also have a cooling effect..
This CAGW hypothesis is falling apart like a cheap suit.
http://notrickszone.com/2015/02/02/german-analysis-current-warm-period-is-no-anthropogenic-product-major-natural-cycles-show-no-signs-of-warming/#sthash.99sK59zk.dpbs Is an interesting analysis, especially the forecast part.
Peter– Thank you for the link.
There certainly seems to be intriguing evidence of 1,000, 230 and 60-year sinusoidal climate cycles, related to solar and ocean cycles.
I find it interesting that both the Little Ice Age recovery and the strongest 63-yr sting (1933~1996) of solar cycles in 11,400 years are basically ignored by the CAGW apologists as possible causes of 20th century warming.
SAMURAI,
My reading is that you’ve rather eloquently explained The Pause. On the basis of past frequency and amplitude of ocean/atmospheric cycles, another two decades of hiatus would not surprise me.
If the same natural cyclic pattern continues, then this cooling trend which started around 2006/07 should end around 2036. The question is will this period be similar to 1946 to 1976, or will this be the one that starts a deeper decline to cooler temps? Will the upcoming solar minimum tip the scales towards a deeper cooling?
There is already around a 2 SD discrepancy between the CMIP5 model projection mean vs. reality (RSS/UAH mean).
A La Niña seems to be forming, which will likely cause a fairly quick drop in global temps over the next two years, causing near 3 SDs of discrepancy. Sunspots will also be falling rapidly for the next 5 years, which will likely add to the cooling, and the PDO cool cycle will be approaching its coolest phase around 2020. The AMO warm cycle peaked in 2007 and will enter its 30-yr cool cycle around 2020:
http://www.bom.gov.au/climate/enso/sub_surf_mon.gif
CAGW doesn’t have a chance. All these cooling factors are all culminating at a point of singularity around 2020. There is also a small possibility of an 80-yr Grand Solar Minimum (GSM) starting from 2022, although the probability of a GSM is falling because the Umbral Magnetic Field (UMF) shows some signs of having bottomed out at 2,000 gauss and its postulated a sustained UMF of 1,500 gauss is required for a GSM to occur.
By 2021, there there will have been 25 years of flat/minuscule/falling global temp trends, and well over 3 SDs of CAGW discrepancy. At that point, scientists (probably outside the climatology field) will have no choice but to start blowing the whistle on CAGW’s utter failure.
Yes, good sword Samourai!
See multi-variable correlation of surface temperature as function of AMO, solar spots, global sea level (GSL), and CO2 concentration:
http://climate.mr-int.ch/images/graphs/regression_ta.png
The calculated green curve fits well with observed data (grey)
The yellow curve is calculated while maintaining CO2 at GSL constant at their original value
The net temperature increase (red) is calculated by the difference between the green and the yellow curve.
More details under: http://climate.mr-int.ch/index.php/en/modelling-uk/correlations-uk/cimate-indicators-uk
It is not possible to make a 5 year forecast without consideration of where we are with regard to the natural millennial solar activity cycle seen in the temperature and other data -see Figs 5-9 at
http://climatesense-norpag.blogspot.com/2014/07/climate-forecasting-methods-and-cooling.html
It is clear that the earth is just approaching, just at or just past the millennial peak. (Fig 9)
If we look at the neutron count record which, together with the 10Be data ,is the best proxy for solar activity it is clear that solar activity peaked in about 1991. There is a 12 year delay between the driver peak and the global RSS temperature peak which probably occurred in mid 2003 since when the earth has been in a cooling trend see
http://www.woodfortrees.org/graph/rss/from:1980.1/plot/rss/from:1980.1/to:2003.6/trend/plot/rss/from:2003.6/trend
The sharp drop in solar activity seen at 2005-6 in Fig 13 should result in a noticeable cooling and a steepening of the cooling trend in 2017 -2018.
I expect that within the next 5 years the MET office will have to acknowledge that their forecasting models and methods are useless.
The neutron count record is seen in Fig 14
There is a good chance that the next 2 years will be sufficient to force many to rethink their beliefs.
The vast majority will come up with ad hoc explanations of why the cooling and increasing ice and snow is actually due to warming because of increasing CO2 and why their forecasts will come right at some unspecified time in the future and we must therefore as a matter of urgency reduce anthropogenic CO2 . Their reputations ,grants and jobs depend on it.
It’s time we stopped using highly fudged charts from HADCRUT and GISS.
What long-term surface temperature dataset do you suggest, Olaf?
Why not use the raw, unadjusted data?
Richard M, I’m happy to present raw, unadjusted (ICOADS sea surface temperature) data…at least as raw and unadjusted as it comes. I often do. It’s available from the KNMI Climate Explorer. BUt the ICOADS data have a higher long-term trend. On the other hand, the raw, unadjusted GHCN land surface air temperature data are not available in easy-to-use form.
The neutron count record is seen in Fig 14
So many examples of putting lipstick on a pig! Another related one is a Washington Post article, “No, Climate Models aren’t Exaggerating Global Warming”,
http://www.washingtonpost.com/news/energy-environment/wp/2015/02/04/no-climate-models-didnt-overestimate-global-warming/
and my reply-
“The models the IPCC choose to feature in their first Assessment (1990) and every assessment since have greatly overestimated global warming. The early models, the 1988 Hansen and 1990 IPCC have been falsified at the 95% level using standard statistical procedure. The IPCC Assessment can be faulted for at least two reasons. They choose to feature models that projected great and accelerating global warming when many climate scientists had, in their peer reviewed articles, model projections of modest warming. MIT’s Richard Lindzen’s is just one example. Second, the IPCC scientists claimed that natural variability, the same variability the authors above claim confounds the projections, could be considered noise and ignored because the AGW signal was so much stronger than the noise. Wrong again. The study referred to above is one more example of the bunker mentality and over-reach that creates disrespect for climate science and enables the wrong-headed belief that global warming is a hoax. The key to understanding the less than skillful model projections and changing estimates of global warming by climate scientists who, with few exceptions are no longer promoting catastrophic AGW, is climate sensitivity which I address in the classes I teach and here- https://sites.google.com/site/climatesensitivity/
I am going to purchase a peice of plywood, write numbers between 1 and 20 on it, put on green socks, and then throw 3 darts at it.
I will add up the numbers that the darts hit, divide by 3, and I predict that the resulting number will be the average temperature of the planet over the next 5 years.
Where can I apply for a grant for money to buy the plywood, darts and green socks?
Well, I think my prediction has as good a chance of being right as the UKMO’s.
Green socks. Bwahaha. Everybody knows the socks have to be orange.
It is also well known that one should use 100% cotton socks, or the result will be skewed by the man made fibers.
Piece, not peice.
Please, Mod,, change.
Pretty please?
Wrong, Seadog. You have to adjust the data. Instead of dividing by 3, you must only divide by 2.
Another way to look at this is that the median of the UKMO’s 5-yr forecast increased by 0.015 C from 2014-18 to 2015-2019. All else constant (assuming 2015-18 forecasts remain the same), that means 2019 is forecast to be 0.075 C above 2014, which gives a warming rate of 0.15 C per decade.
Do they get paid money for that?
When they can accurately predict 2 weeks in advance, I will take interest in what they have to say about weather 3 weeks in advance! Don’t think my Grandkids will live long enough to be able to trust in predictions 5 years in advance
Has anyone else noticed the PIOMASS arctic volume anomaly keeps going up and up? Why is this not making news?
The claim that global temperatures will remain high is based on the average temperature of 1981-2010. I wonder how the earth feels about it’s optimum temperature being identified as between 1981-2010.
I know I feel the mid-sixties through the mid-seventies should be used to determine the baseline for global climate simply due to sex, drugs, and rock and roll. As ridiculous as that sounds, it is just as valid as claiming .02 degrees of warming when the margin of error is significantly greater.
“over the next five years, their models forecast that global surfaces may be a little warmer or a little cooler than 2014, as much as 0.2 deg C warmer or as much as 0.08 deg C cooler.” We’ll really notice the massive change. Should I stock up on T-shirts or thermals? Problems problems.
In other words, over the next five years, their models forecast that global surfaces may be a little warmer or a little cooler than 2014,
to be fair to the MET although its dishonest and scientifically worthless approach , the ‘heads you lose tails I win ‘ approach is one normal for climate ‘science’
LOL
In other words, over the next five years, their models forecast that global surfaces may be a little warmer or a little cooler than 2014, as much as 0.2 deg C warmer or as much as 0.08 deg C cooler. [Sarc on.] That narrows it down. [Sarc off.]
That’s a pretty tight prediction.
Let’s see
Over the next five years the sun will reach its minimum.
That’s a least 0.1c lower.
Any one want to bet that the Temps five years from now will be . 1c cooler. I’ll give 2:1 odds.
Won’t any cooling by the Sun be offset by the CO2 climate thermostat control knob?
You’ve found the knob?
Wait, wait, I thought that the sun had nothing to do with it. Is this a “Mosher Anomaly”.
Temperature of what ?
Yes. I’ll take it IF I CONTROL ALL THE DATA.
Can we keep it simple?
Pick the single land station you want to use.
Snapshot the measured temperature right now and we’ll look at the measured temperature in 2020. No adjustments or any fancy calculations or trend lines. Single measurement for a given time of day Feb 5 2015. Single measurement same time of day Feb 5 2020.
That is definitely worth a punt at 100USD at 2:1.
Do they give percentage probabilities on this forecast?
There is a 97% chance they will have to continue to adjust data to get the results they want.
The problem the UKMO has is that the warming of the oceans is nothing to do with ‘back radiation’, a failure to recognise that it is a Radiant Emittance, not a real energy flux.
Instead it’s roughly constant SW thermalisation plus the decrease in flow rate of cold water which started its journey from Antarctica 800 years ago, the time when the Mediaeval Warm Period ended and Antarctic Ice started to increase.
So., to predict that part of present day SSTs down to increased well-mixed GHG, which works by decreasing net surface IR so it warms to increase evaporative heat loss, one must have data about ice and snow formation from the year 1200!
Climate Alchemists really must learn that the basics of their ‘science’ are very badly wrong in terms of the heat transfer part of modelling, and they must also think about all coupled factors, including the thermohaline circulation.
Cartoon on the vagaries of signal processing:
http://www.maxphoton.com/digitization/
The prediction will be wrong as I expect a lower trend in global temperatures starting this year.
Steve Mosher is offering 2:1 against on it being 0.1 deg cooler. If he’s serious you have a chance to make back your judgement with hard cash.
No they won’t. HadCRU 4 + n will see to that.
UAH trend is higher than HadCRU.
Below is my completed version of how I think the climate changes. I had sent something similar but it was in haste and did not do it justice. My fault. I hope if anything this at least will accomplish thought on this subject. I pose some questions which I feel need to be answered in order to predict the climate going forward. Don Easterbrook also makes many valid points in regards to this.
This approach I have done is comprehensive which I think is missing to a great degree when explanations come out as to why/how the climate may changes. The one dominating item hence the climate change scenario does not cut it, which so many papers allude to.
This is what I have come up with.
Here is what I have concluded. My explanation as to how the climate may change conforms to the historical climatic data record which has led me to this type of an explanation. It does not try to make the historical climatic record conform to my explanation. It is in two parts.
PART ONE
HOW THE CLIMATE MAY CHANGE
Below are my thoughts about how the climatic system may work. It starts with interesting observations made by Don Easterbrook. I then reply and ask some intriguing questions at the end which I hope might generate some feedback responses. I then conclude with my own thoughts to the questions I pose.
From Don Easterbrook – Aside from the statistical analyses, there are very serious problems with the Milankovitch theory. For example, (1) as John Mercer pointed out decades ago, the synchronicity of glaciations in both hemispheres is ‘’a fly in the Malankovitch soup,’ (2) glaciations typically end very abruptly, not slowly, (3) the Dansgaard-Oeschger events are so abrupt that they could not possibility be caused by Milankovitch changes (this is why the YD is so significant), and (4) since the magnitude of the Younger Dryas changes were from full non-glacial to full glacial temperatures for 1000+ years and back to full non-glacial temperatures (20+ degrees in a century), it is clear that something other than Milankovitch cycles can cause full Pleistocene glaciations. Until we more clearly understand abrupt climate changes that are simultaneous in both hemispheres we will not understand the cause of glaciations and climate changes.
My explanation:
I agree that the data does give rise to the questions/thoughts Don Easterbrook, presents in the above. That data in turn leads me to believe along with the questions I pose at the end of this article, that a climatic variable force which changes often which is superimposed upon the climate trend has to be at play in the changing climatic scheme of things. The most likely candidate for that climatic variable force that comes to mind is solar variability (because I can think of no other force that can change or reverse in a different trend often enough, and quick enough to account for the historical climatic record) and the primary and secondary effects associated with this solar variability which I feel are a significant player in glacial/inter-glacial cycles, counter climatic trends when taken into consideration with these factors which are , land/ocean arrangements , mean land elevation ,mean magnetic field strength of the earth(magnetic excursions), the mean state of the climate (average global temperature), the initial state of the earth’s climate(how close to interglacial-glacial threshold condition it is) the state of random terrestrial(violent volcanic eruption, or a random atmospheric circulation/oceanic pattern that feeds upon itself possibly) /extra terrestrial events (super-nova in vicinity of earth or a random impact) along with Milankovitch Cycles.
What I think happens is land /ocean arrangements, mean land elevation, mean magnetic field strength of the earth, the mean state of the climate, the initial state of the climate, and Milankovitch Cycles, keep the climate of the earth moving in a general trend toward either cooling or warming on a very loose cyclic or semi cyclic beat but get consistently interrupted by solar variability and the associated primary and secondary effects associated with this solar variability, and on occasion from random terrestrial/extra terrestrial events, which brings about at times counter trends in the climate of the earth within the overall trend. While at other times when the factors I have mentioned setting the gradual background for the climate trend for either cooling or warming, those being land/ocean arrangements, mean land elevation, mean state of the climate, initial state of the climate, Milankovitch Cycles , then drive the climate of the earth gradually into a cooler/warmer trend(unless interrupted by a random terrestrial or extra terrestrial event in which case it would drive the climate to a different state much more rapidly even if the climate initially was far from the glacial /inter-glacial threshold, or whatever general trend it may have been in ) UNTIL it is near that inter- glacial/glacial threshold or climate intersection at which time allows any solar variability and the associated secondary effects no matter how SLIGHT at that point to be enough to not only promote a counter trend to the climate, but cascade the climate into an abrupt climatic change. The back ground for the abrupt climatic change being in the making all along until the threshold glacial/inter-glacial intersection for the climate is reached ,which then gives rise to the abrupt climatic changes that occur and possibly feed upon themselves while the climate is around that glacial/inter-glacial threshold resulting in dramatic semi cyclic constant swings in the climate from glacial to inter-glacial while factors allow such an occurrence to take place.
The climatic back ground factors (those factors being previously mentioned) driving the climate gradually toward or away from the climate intersection or threshold of glacial versus interglacial, however when the climate is at the intersection the climate gets wild and abrupt, while once away from that intersection the climate is more stable. Although random terrestrial events and extra terrestrial events could be involved some times to account for some of the dramatic swings in the climatic history of the earth( perhaps to the tune of 10% ) at any time , while solar variability and the associated secondary effects are superimposed upon the otherwise gradual climatic trend, resulting in counter climatic trends, no matter where the initial state of the climate is although the further from the glacial/inter-glacial threshold the climate is the less dramatic the overall climatic change should be, all other items being equal.
The climate is chaotic, random, and non linear, but in addition it is never in the same mean state or initial state which gives rise to given forcing to the climatic system always resulting in a different climatic out-come although the semi cyclic nature of the climate can still be derived to a degree amongst all the noise and counter trends within the main trend.
QUESTIONS:
Why is it when ever the climate changes the climate does not stray indefinitely from it’s mean in either a positive or negative direction? Why or rather what ALWAYS brings the climate back toward it’s mean value ? Why does the climate never go in the same direction once it heads in that direction?
Along those lines ,why is it that when the ice sheets expand the higher albedo /lower temperature more ice expansion positive feedback cycle does not keep going on once it is set into motion? What causes it not only to stop but reverse?
Vice Versa why is it when the Paleocene – Eocene Thermal Maximum once set into motion, that being an increase in CO2/higher temperature positive feedback cycle did not feed upon itself? Again it did not only stop but reversed?
My conclusion is the climate system is always in a general gradual trend toward a warmer or cooler climate in a semi cyclic fashion which at times brings the climate system toward thresholds which make it subject to dramatic change with the slightest change of force superimposed upon the general trend and applied to it. While at other times the climate is subject to randomness being brought about from terrestrial /extra terrestrial events which can set up a rapid counter trend within the general slow moving climatic trend.
Despite this ,if enough time goes by (much time) the same factors that drive the climate toward a general gradual warming trend or cooling trend will prevail bringing the climate away from glacial/inter-glacial threshold conditions it had once brought the climate toward ending abrupt climatic change periods eventually, or reversing over time dramatic climate changes from randomness.
NOTE 1- Thermohaline Circulation Changes are more likely in my opinion when the climate is near the glacial/inter-glacial threshold probably due to greater sources of fresh water input into the North Atlantic.
PART TWO
HOW THE CLIMATE MAY CHANGE
Below I list my low average solar parameters criteria which I think will result in secondary effects being exerted upon the climatic system.
My biggest hurdle I think is not if these low average solar parameters would exert an influence upon the climate but rather will they be reached and if reached for how long a period of time?
I think each of the items I list , both primary and secondary effects due to solar variability if reached are more then enough to bring the global temperatures down by at least .5c in the coming years.
Even a .15 % decrease from just solar irradiance alone is going to bring the average global temperature down by .2c or so all other things being equal. That is 40% of the .5c drop I think can be attained. Never mind the contribution from everything else that is mentioned.
What I am going to do is look into research on sun like stars to try to get some sort of a gage as to how much possible variation might be inherent with the total solar irradiance of the sun. That said we know EUV light varies by much greater amounts, and within the spectrum of total solar irradiance some of it is in anti phase which mask total variability within the spectrum. It makes the total irradiance variation seem less then it is.
I also think the .1% variation that is so acceptable for TSI is on flimsy ground in that measurements for this item are not consistent and the history of measuring this item with instrumentation is just to short to draw these conclusions not to mention I know some sun like stars (which I am going to look into more) have much greater variability of .1%.
I think Milankovich Cycles, the Initial State of the Climate or Mean State of the Climate , State of Earth’s Magnetic Field set the background for long run climate change and how effective given solar variability will be when it changes when combined with those items. Nevertheless I think solar variability within itself will always be able to exert some kind of an influence on the climate regardless if , and that is my hurdle IF the solar variability is great enough in magnitude and duration of time. Sometimes solar variability acting in concert with factors setting the long term climatic trend while at other times acting in opposition.
THE CRITERIA
Solar Flux avg. sub 90
Solar Wind avg. sub 350 km/sec
AP index avg. sub 5.0
Cosmic ray counts north of 6500 counts per minute
Total Solar Irradiance off .15% or more
EUV light average 0-105 nm sub 100 units (or off 100% or more) and longer UV light emissions around 300 nm off by several percent.
IMF around 4.0 nt or lower.
The above solar parameter averages following several years of sub solar activity in general which commenced in year 2005.
IF , these average solar parameters are the rule going forward for the remainder of this decade expect global average temperatures to fall by -.5C, with the largest global temperature declines occurring over the high latitudes of N.H. land areas.
The decline in temperatures should begin to take place within six months after the ending of the maximum of solar cycle 24.
Secondary Effects With Prolonged Minimum Solar Activity. A Brief Overview.
A Greater Meridional Atmospheric Circulation- due to less UV Light lower Ozone in Lower Stratosphere.
Increase In Low Clouds- due to an increase in Galactic Cosmic Rays.
Greater Snow-Ice Cover- associated with a Meridional Atmospheric Circulation/an Increase In Clouds.
Greater Snow-Ice Cover probably resulting over time to a more zonal atmospheric circulation. This circulation increasing the aridity over the ice sheets eventually. In addition to adding more Dust to the atmosphere over time.
Increase in Volcanic Activity – Since 1600 AD, data shows 85 % approximately of all major Volcanic eruptions have been associated with Prolonged Solar Minimum Conditions. Data from the Space and Science Center headed by Dr. Casey.
Volcanic Activity -acting as a cooling agent for the climate and enhancing aerosols possibly aiding in greater cloud formation.
Decrease In Ocean Heat Content/Sea Surface Temperature -due to a decline in Visible Light and Near UV light.
This in turn should diminish the Greenhouse Gas Effect over time, while promoting a slow drying out of the atmosphere over time. This may be part of the reason why aridity is very common with glacial periods.
Well, as for me, I am not believing any of that unless you have a model 🙂
Thanks Salvatore, You mentioned extraterrestrial events and gave them a nod. Can such events be as cyclical as for instance the annual meteor showers we have but on a slower (much slower) “cosmic” scale?. The event in Russia was completely unpredicted and if it had been at a slightly different angle would have had a huge impact. I am not an expert but our knowledge of asteroids, comets or Kuiper Belt objects are as limited as sensors in our oceans and some of THAT data is extrapolated into all kinds of predictions and models right or wrong. I personally believe our sun has an huge impact on our climate that impact is very little understood by most people, the effect of electrical and magnetic influences on our earth’s climate our tectonic plates, etc are just now starting to get attention.
Someone needs to track and compile the predictions of UKMO and others since rational error evaluation seems to be lacking in climate science as a rule. The habits of forgetting weather prediction error have been copied onto climate science. That is not acceptable when there is a global policy push based on its predictions.
You really have a problem with the year 1998, haven’t you?
1998 is commonly used as the start year of the slow-down in surface warming, Francois, even in scientific papers.
Isn’t their confidence interval 2.5% – 97.5%, not 5% – 95%?
this is the money quote. global warming will continue, except in places where people live.
Playing computer games – YAWN (but, of course, they get paid for it).
UKMO = Climatastrologist Agnotologists making the world more ignorant one forecast at a time.
Re: the graphs that show the 1900-2014 trends are similar to the 1998 to 2014 trend – does this not provide evidence that the most recent warming is not man made but part of a long term climb out of the Little Ice Age? After all the pre 1950 period is generally considered (even by the Warmists) to be not influenced by man, so if the long term trend (which includes 50 years of non AGW) equals the recent trend then the whole thing is most likely to be non AGW, isn’t it?
This current climatic interval we are in is similar to the climatic interval just before the Little Ice Age which started in a rather abrupt fashion around 1300ad.
The exact temperature deviation and extent of the Little Ice Age very unknown with all different values and extents given depending upon what source one looks at.
Nevertheless it was real and came on in an abrupt fashion.
My explanation for this in general is in the article I just posted. I think a repeat of this event is likely going forward.
Isn’t it time to look for more sophistication than linear regression over the most convenient period of time?
The worlds most powerful super computers are incapable of accurate
“Weather” forecast beyond 7-days.
How and why, would anyone presume
we can forecast aggregate “Climate”
5, 10, or 100-years into the future.
Indeed. I live on the northern Oregon coast. Recently there was a forecast for a very powerful storm with high winds, heavy rain, huge seas… the works. The warnings were dire, right up to the last moment. Now, forecasters have satellites looking right down on us, real-time; there are ships at sea giving a continuous stream of reports; there is an extensive offshore buoy network sending signals directly to the nerve center; there is the extensive Pika extinction derivative monitoring system 😉 …
What happened? It was mild with gentle winds and a delicate spritzing.
So much for 100 year forecasts.
I am south of you in No California. It has been a steady/moderate rain for around 12 hours. In the last hour it has tapered off to a light rain. I noticed yesterday that the Weather Channel had a fed flag warming for this area. That looks like over-hype now. This is nothing but a typical coastal/mountain rainfall.
“The decadal forecast system predicted enhanced warming over high northern latitudes, and cooling in the Southern Ocean and North Atlantic sub-polar gyre. These are in broad agreement with the observations, although there are differences in the precise magnitude and location of anomalies.”
It seems that standards of “agreement/disagreement” are not specified in advance. Are there quantitative measures of agreement, such as overall (or regional) integrated mean square error? (“integrated” across time and space) Is there any way to determine whether the next forecast “improved upon” the last forecast?
I think that if people viewed the chart of absolute temperatures , rather than just the changes the global warming debate would swing. The chart which is sometimes reproduced in blogs here show that the change in the last century is actually hard to see, whereas of .01 one year to .02 in year 2 represents a 100 percent increase in the rate of change. I think that by representing global temperature changes only as the rate of change rather than in the context of the total temperature pictorially people think it is warming quickly. Even a change of 1 degree is inperceptible to humans so why even talk about these smaller changes as being relevant .
When I have discussions on global warming I remember even as a child 55 years ago the weather was hot in February and January and most years since. I guarantee if the AGW movement hadn’t been created there would be no realisation that temperatures had changed. In fact by a process of brainwashing and manipulation AGW movement has indoctrinated people that it has warmed. I have no doubts ( especially those in the Northern Hemisphere) that if the AGW movement had been a AGC movement they could have manipulated and brainwashed people into believing that it had actually got cooler and was going to do so in the future.
So much time and money has been wasted on this bullshit and the sooner we can stop it the better everyone will be!
It’s UKMO speak. They are all endowed with it. You just need to be able to BS before training starts. After a short period you to will be able to BS like Betts, Pope a,d Slingo.
BFL
February 5, 2015 at 9:27 am
Well, as for me, I am not believing any of that unless you have a model 🙂
That is one of the points which is there is NO model that can predict climate change because of what I have presented.
I a trying to convey this through what I have presented and the questions I have posed.
BFL was being facetious.
Thanks, Bob. Good detection.
The longer the pause, the greater their problem.
I continually see the following in this forum: “if they can’t forecast weather accurately more than 7 days out, why do they think they can forecast the climate for the next 30 years?”
The answer from warmists is that it can be difficult to forecast short term phenomena, but long term trends are different. The analogy that I read (here) was that we can’t predict exactly how a bucketful of water would flow down a hill (that is, exactly what path it would take), but we can predict with reasonable confidence that it WILL flow down the hill.
From Dr. Norman Page,
The sharp drop in solar activity seen at 2005-6 in Fig 13 should result in a noticeable cooling and a steepening of the cooling trend in 2017 -2018.
I expect that within the next 5 years the MET office will have to acknowledge that their forecasting models and methods are useless.
My reply it is can be even sooner.
One point I had tried to make in my paper I just posted, and I am still trying to make when it comes to why/how the climate may change is the following:
The problem with so many in climate science is that they try to prove their points with specific items they want to try to convince us may or may not change the climate in ISOLATION ,rather then in the context of the entire picture.
Again a given force and magnitude changes of that force have to be taken into account against the entire spectrum of items that are exerting an influence on the climate at that given time ,along with the state of the climate at that given time in order to get a sense of what impact that specific force may or may not exert on the climate.
This is why it is so hard to prove and show a simple cause and effect relationship between the climate and items exerting a force upon the climate even though it does exist..
Their global temperatures are falsified. Starting with 1980 (or maybe earlier) they have given their temperature curves an upward boost amounting to 0.1 degree Celsius in an 18 year interval. As a result, the eighties and the nineties that preceded the super El Nino of 1998 are all shown as a warming region when in fact there is no warming there. Comparison with satellite temperatures [1] shows that global mean temperature in this region did not change from 1979 to 1997, an 18 year stretch. This is a no-warming period equivalent in length of the current “hiatus” of warming. The current hiatus in their graph is also afflicted by the same phony warming as the eighties and nineties.The total amount of no-warming time, obtained by adding the 18 years of the current hiatus plus the 18 years of no-warming in the eighties and nineties is 36 years. That is three quarters of the time that the IPCC was even existed. It follows that lack of warming is the normal way global temperature should be expected to exist.It leaves only 15 years since 1988 to accomplish all the alleged global warming that has happened since. The CMIP5 graphs shown are also prettu worthless. They show two major temperature drops built into their code and intended to signify the volcanic coolings from Pinatubo and El Chichon. It does not exist [2]. All volcanic cooling shown by IPCC exists in their imagination only. What is in their data-sets is a misidentification of La Nina valleys that have been hijacked to stand in for non-existent cooling. When an eruption coincided with an El Nino peak it was possible to do that as in the case of Pinatubo. But when the eruption coincided with a La Nina valley it was followed by an El Nino peak and the poor volcano was cheated out of a cooling of its own. Like the case of El Chichon, for example. Those “volcanologists” who invented volcanic cooling to this day are scratching their heads about it. All they had to do to learn the facts was to read my book [2]. This is true of “climate” scientists in general who are incompetent to do a literature search for a scientific paper.
[1] Arno Arrak, “What Warming? Satellite view of global temperature change (CreateSpace 2010), figure 15, page 32
[2] Ibid., pp. 17-21
Warmest snow evrrr:
http://m.bbc.com/news/world-europe-31159889
The average temperature of Earth is a nearly worthless statistic in the absence of real visible evidence that climate change has caused negative effects on people, animals and/or plants.
.
No such evidence exists (scary predictions are not evidence).
Therefore, the collection and analysis of the average temperature of Earth is a waste of taxpayer’s money.
Forecasts of the future average temperature of Earth are a waste of time even if the people making the forecasts work for free.
Temperature anomalies are meaningless random variations that do not predict the future climate.
100 years of temperature data are not enough to determine a long-term trend, and do not tell us when the current warming or cooling trend will end.
People who predict the average temperature for the next five years should be ignored for five years — and then after five years we can look at the predictions vs. actuals, and see if they were accurate … but since the average temperature of Earth seems to be in an uptrend since about 1850, it would not require much talent to predict that uptrend will continue for the next five years — extrapolating an existing trend is a meaningless “analysis” when there is no scientific explanation of exactly what is causing the trend.
If there are any local climate changes that seem unusual, those could be valuable to study, although every climate change trend in the past 4.5 billion years was natural, and could not be changed by humans, so studying the local climate doesn’t mean there’s anything we could do about it.
I understand there is a big dispute over whether the climate change from the late 1970s to late 1990s was natural, or the first climate trend in 4.5 billion years caused solely by manmade CO2.
Since the average temperature seems to have stopped rising in 1998, the claim that rising CO2 causes rising average temperature is losing credibility.
Predictions of the future climate, or future anything else, NEVER had credibility to me — I have no idea why so many other people take predictions of the future seriously.
We don’t need a weatherman to know which way the wind blows, and we don’t need to know the average temperature of Earth to tell us if where we live has been usually hot or cold.
My blog, at the link below, has a report of why the average temperature of Earth is not an important statistic, and other articles on related subjects, such as how to discipline liberals by swatting them with a rolled up New York Times: :
http://www.elOnionBloggle.Blogspot.com
This winter will be long, as the solar cycle.
Current polar vortex at the height of 27 km.
http://earth.nullschool.net/#current/wind/isobaric/10hPa/orthographic=-97.92,82.45,395
Bob Tisdale see the low temperature Humboldt Current.
http://weather.unisys.com/surface/sst_anom.gif
I see “warming stopped in 1997/1998” is definitively dead.
I see “warming stopped in 2001/2002” will die in one year.
What will be the next? I bet “warming stopped in 2009/2010”. Am I right?