Guest Post by Bob Tisdale
In Dana Nuccitelli’s recent post at SkepticalScience Matt Ridley wants to gamble the Earth’s future because he won’t learn from the past, he has finally admitted something we’ve been discussing for more than 6 years. (His article was also cross posted at The Guardian here. Yes, that’s the zombie post that has gained so much attention.)
Dana admitted that during a decade-long (or multidecadal) period(s) when El Niño events dominate (when El Niños are stronger, last longer and happen more frequently), the El Niños enhance global warming, and during periods when La Niña events dominate (when there are weaker, shorter and fewer El Niño events), the absence of El Niño events suppresses the warming of global surfaces.
I am not commenting on the rest of Dana’s post. I’ll leave that for you. I’m only commenting on a very small portion of it.
I was somewhat amazed by Dana’s admission that stronger and longer El Niño events can enhance global warming.
DANA’S ADMISSION
Dana quotes Matt Ridley in his post and then responds to what Matt wrote with (my boldface):
This is incorrect – average global surface temperatures have warmed between 0.6 and 0.7°C over the past 40 years (lower atmospheric temperatures have also likely warmed more than 0.5°C, though the record hasn’t yet existed for 40 years). During that time, that temperature rise has temporarily both slowed down (during the 2000s, when there was a preponderance of La Niña events) and sped up (during the 1990s, when there was a preponderance of El Niño events). Climate models accurately predicted the long-term global warming trend.
El Niños didn’t only dominate during the 1990s. For some reason known only to Dana, he overlooked the fact that the 1976/77 El Niño started the period when El Niño events dominated the late 20th Century. Thus, using Dana’s logic, El Niño events enhanced the observed global warming from the mid-1970s to the turn of the century—the first 25 years of the past 40 years Dana chose for his discussion.
There is, of course, a major problem with Dana’s last sentence in that quote:
Climate models accurately predicted the long-term global warming trend.
Climate models don’t consider the ENSO-enhanced portion of the global warming from the mid-1970s to the turn of the century. See Figure 1, which compares observed global surface temperature anomalies for the past 40 years to the model simulations of global surface temperatures. We’re presenting the model mean because it best represents the forced component of the climate models. (See the post here for a further discussion about the use of the model mean.)

Figure 1
The climate modelers assumed that all of the global warming occurred because of manmade climate forcings. That is, the modelers did not consider the portion of the warming from 1975 to the turn of the century that was caused by the dominance of El Niños. But then, according to Dana’s representation, there was a slowdown in surface warming caused by the weakening of El Niños. The result of the slowdown: the models are rapidly diverging from reality. In short, the models did not account for the enhanced warming caused by El Niños and they failed to consider that a period without strong El Niños would suppress global warming.
Additionally, climate models simply extend (and accelerate) out into the future the El Niño-enhanced warming rate of the mid-1970s to the turn of the century. It’s pretty obvious to all but the logic-impaired that climate models have projected too much warming.
(For more evidence on how poorly climate models simulate surface temperatures, see the post Alarmists Bizarrely Claim “Just what AGW predicts” about the Record High Global Sea Surface Temperatures in 2014.)
Yet, skeptics are ridiculed when they write that global warming occurs during multidecadal periods when El Niño events dominate…because of the El Niño events. Example: I’ve included the following statement from the introduction to my book Who Turned on the Heat? in a number of posts in recent years. I’ve amended it with bracketed phrases for this post.
Start quote.
Climate models used by the Intergovernmental Panel on Climate Change (IPCC) cannot match the sea surface temperature records that show how often and how strongly ENSO events have occurred since 1900. Climate models can’t even simulate the ENSO events since the start of the recent warming period in the mid-1970s. However, the models need to be able to mimic the historical instrument-based ENSO records. In fact it’s critical that they do, and it’s easy to understand why. The strength of ENSO phases, along with how often they happen and how long they persist, determine how much [sunlight-created] heat is released by the tropical Pacific into the atmosphere and how much [sunlight-created] warm water is transported by ocean currents from the tropics toward the poles. During a multidecadal period when El Niño events dominate (a period when El Niño events are stronger, when they occur more often and when they last longer than La Niña events), more [sunlight-created] heat than normal is released from the tropical Pacific and more [sunlight-created] warm water than normal is transported by ocean currents toward the poles—with that warm water releasing heat to the atmosphere along the way. As a result, global sea surface and land surface temperatures warm during multidecadal periods when El Niño events dominate. They have to. There’s no way they cannot warm. Conversely, global temperatures cool during multidecadal periods when La Niña events are stronger, last longer and occur more often than El Niño events. That makes sense too because the tropical Pacific is releasing less heat and redistributing less warm water than normal then.
End of quote from Who Turned on the Heat?
The CO2-obsessed become incensed when I include that paragraph in a post.
NOTE: If you need a reference for the “sunlight-created” heat and warm water, see the quotes from the two Trenberth papers under the heading of Trenberth’s Conflict in the post The 2014/15 El Niño – Part 9 – Kevin Trenberth is Looking Forward to Another “Big Jump”. [End note.]
OOPS! DANA FORGOT THE AMO
Dana Nuccitelli also overlooked the contribution of the Atlantic Multidecadal Oscillation to global surface warming over the last 40 years. Figure 2 compares the modeled and data-based Atlantic Multidecadal Oscillation (AMO), using the Trenberth and Shea (2006) method to determine the Atlantic Multidecadal Oscillation, in which global sea surface temperatures (60S-60N) are subtracted from the sea surface temperatures of the North Atlantic (0-60N, 80W-0). Trenberth and Shea used sea surface temperature anomalies, but I’ve presented temperatures in absolute form. Obviously, the Atlantic Multidecadal Oscillation is not a forced component of the climate models, and as a result, the contribution of the Atlantic Multidecadal Oscillation to the warming over the past 40 years is not considered by climate models.

Figure 2
Some of you may recognize Figure 2. It was recently presented as Figure 25 in the post Alarmists Bizarrely Claim “Just what AGW predicts” about the Record High Global Sea Surface Temperatures in 2014.
For more information on the Atlantic Multidecadal Oscillation, refer to the NOAA Frequently Asked Questions About the Atlantic Multidecadal Oscillation (AMO) webpage and the posts:
- An Introduction To ENSO, AMO, and PDO — Part 2
- Multidecadal Variations and Sea Surface Temperature Reconstructions
That NOAA FAQ webpage confirms that the Atlantic Multidecadal Oscillation can contribute to global warming and suppress it.
CLIMATE MODELS ARE OUT OF PHASE WITH REALITY
So we have two natural modes of multidecadal variability that enhanced global surface warming from the mid-1970s to the turn of the century. (We won’t know for a decade or more if the Atlantic Multidecadal Oscillation has, in fact, peaked already.) Unfortunately the climate models do not consider the enhanced warming from ENSO or the AMO; that is, the models assume that all of the warming from the mid-1970s to the turn of the century was driven from manmade greenhouse gases. As a result, their projections of future global warming are way too high.
The standard argument now from the CO2 obsessed is that over multidecadal time periods the natural enhancements and suppressions of global warming will cancel out because ENSO and the AMO are oscillations. Unfortunately, as we’ve noted, the models align with the warming during a period when that warming was enhanced by two modes of natural variability, and the models fail to consider the multidecadal suppression of warming…for the next couple of decades and any future suppressions of warming.
In other words, the models are out of phase with reality. There’s nothing new about that statement. Skeptics have been pointing that out for years.
For example, Figure 3 illustrates a sine wave with a 60-year frequency. That will represent our data. It is arbitrarily scaled…in other words, it is not scaled to surface temperatures. The maximums occur at 1885, 1945 and 2005, while the minimums occurred at 1915 and 1975. That roughly aligns with the multidecadal variations in the surface temperature record from 1885 to present. Continuing the 60-year cycle into the future gives us another minimum at 2035, the next maximum at 2065 and yet another minimum at 2095. The red line shows a “model” that aligns with the trend from 1975-2005, and in a maroon dotted line, continues that “model” trend out into the future. As you can see, the model and projection bear no relationship with the underlying cyclical nature of the data.

Figure 3
That’s basically what the climate modelers have done. The models align with a naturally occurring upswing in surface temperatures and the modelers have failed to consider the future multidecadal variations in their projections caused by the natural enhancement and suppression of global warming.
KEVIN TRENBERTH’S “BIG JUMPS”
At this point in the post I would normally go into a discussion of ENSO acting as a chaotic, naturally occurring, sunlight-fueled, recharge-discharge oscillator. But it will be difficult enough for the CO2 obsessed to come to terms with Dana’s admission, so I’ll skip that part of the normal plotline. If you’re interested in learning how powerful El Niño events contribute to long-term warming trends, see the following Trenberth “big jump”-related posts:
- Open Letter to the Royal Meteorological Society Regarding Dr. Trenberth’s Article “Has Global Warming Stalled?”
- The 2014/15 El Niño – Part 9 – Kevin Trenberth is Looking Forward to Another “Big Jump”
CLOSING
Skeptics have been preaching for years that natural variability can contribute to the long-term global surface warming trend…and suppress it, in effect stopping it.
It was quite amazing to finally see one of the key members of the alarmist blog SkepticalScience (and global-warming reporter at The Guardian) finally admitting the same. Of course, Dana Nuccitelli forgot to advise his readers that “a preponderance of El Niño events” had “sped up” global surface warming from the mid-1970s through the 1990s, not just “during the 1990s”. He also forgot to mention that another mode of natural variability, the Atlantic Multidecadal Oscillation, had also contributed to the warming then.
Allow me to summarize this excellent post in a single cartoon: “Linear Thinking in a Cyclical World” at http://www.maxphoton.com/linear-thinking-cyclical-world/
Actually it’s both linear and cyclical — climatic variations imposed on a warming trend.
http://www1.ncdc.noaa.gov/pub/data/cmb/hazards/2011/12/enso-global-temp-anomalies.png
Or, short term cyclical variation imposed on long term cyclical variation.
How can any chaotic system be linear? Cough …sputter…
Barry, are you purposely contradicting Nuccitelli now?
Also, the vast majority of the people who visit here understand “climatic variations imposed on a warming trend” is incorrect. In reality, ENSO has caused a major portion of the surface warming during the satellite era of sea surface temperature data. In fact, in the post, I linked a detailed description of how that works. Here it is again:
https://bobtisdale.wordpress.com/2013/06/04/open-letter-to-the-royal-meteorological-society-regarding-dr-trenberths-article-has-global-warming-stalled/
Barry makes a fair point. The historical record seems to show both a cyclical process and a long term trend. As Bart, points out, the trend might be part of a much longer period cycle, but we don’t have any real evidence for (or against) that. But CO2 should produce at least some effect, so that should be at least part of the trend. As highflight56433 comments, one does not expect a chaotic system to be linear, but the trend is consistent (a very weak statement) with being linear, as expected if it is being driven by CO2 and other anthropogenic greenhouse gases. We can’t say for sure that it is anthropogenic and we can’t say for sure that it is not.
Roy Spencer and William Braswell have made an interesting attempt (Asia-Pac. J. Atmos. Sci., 50(2), 229-237, 2014 DOI:10.1007/s13143-014-0011-z) to model the increase in ocean heat content as being driven by ENSO. It seems that ENSO can not do the job without feedbacks that are sufficient to make CO2 the main driver of the increase. In other words, the driving force from CO2 is greater than from ENSO, so if feedback is so weak that CO2 has little effect, then ENSO also has little effect.
“Actually it’s both linear and cyclical — climatic variations imposed on a warming trend.”
That’s what Akasofu was dismissed by warmists for saying long ago.
“In other words, the driving force from CO2 is greater than from ENSO, so if feedback is so weak that CO2 has little effect, then ENSO also has little effect.”
Assuming the models are correct. Categorical statements should be eschewed. The science is not settled.
Well it’s all a matter of timescale. It is an interglacial, bit its a chilly part of it, comparatively speaking 😉
barry,
you could update your image with more recent data, oh wait, I CAN!
http://climatenexus.org/sites/default/files/anomalies-enso.jpg
Haha, as if the temperature anomalies are representative of anything when we don’t know how to measure temperature.
http://oi57.tinypic.com/2lw5a2s.jpg
source:
http://people.iarc.uaf.edu/~sakasofu/pdf/Natural_Components_of_Climate_Change.pdf
You are just confirming ferdberple what we have said for years – persistence is often a good forecast. It was possible to do a better job with a sheet of graph paper and a pencil than a supercomputer.
Less than one hour after claiming this:
“There is zero evidence that it did end. No one knows what caused the LIA, so how can anyone claim to know when it ended?”
.. ferdberple post a graph with “Recovery from Little Ice Age”
Seems like ferdberple learned something. Or changed his mind. There was an end to LIA after all. That coincides with increased use of fossil fuel.
And the downturn after 2000 this model predicts, is that supported in observational data?
ferdberple,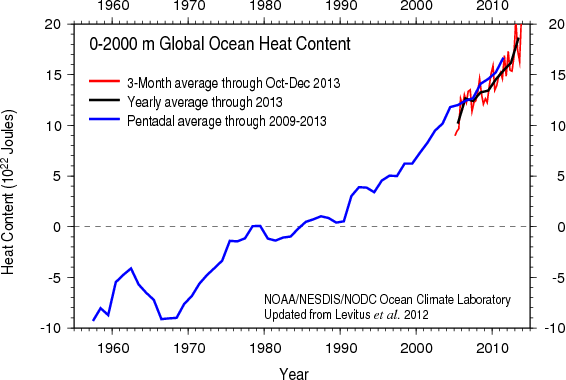
from your source:
(2) The sea level rise stopped after 2005 (20).
(3) Heat content of the oceans began to decrease after 2005 (21).
(4) The Central Pacific Ocean is cooling (22).
(5) The area of sea ice in the Arctic Ocean has begun to recover after the drastic
reduction in 2007 (23).
Sea level has continued to rise: http://www.cmar.csiro.au/sealevel/images/CSIRO_GMSL_figure.jpg
Heat content of the oceans has continued to increase:
The central pacific is now warmer than it has been in a long time (though still below El Nino): http://www.ospo.noaa.gov/data/sst/anomaly/2015/anomp.1.22.2015.gif
The area of sea ice (minimum) collapsed even further than 2007 in 2012 and has most recently returned to a level not seen since. . .lets see. . .ALL THE WAY BACK TO 2009!
http://www.arctic.noaa.gov/reportcard/images-essays/fig4.2-perovich.gif
it seems that your sourced document got it wrong, just a little bit!
Jai Mitchell:
You reveal yourself as infected with an alarmist’s habit of thought when use such terminology as “sea ice collapse”.
Ice melts. Hot air balloons collapse.
Concatenations of oceanic oscillations.
===================
This is why the RSA this week issued its call for “a new way to think, talk and act” in its “The Seven Dimensions of Climate Change” report. It can now use its allies in K-12 education globally to make Climate Change a ‘social fact’ and shared belief.
http://www.invisibleserfscollar.com/tethering-the-logical-rational-mind-via-k-12-education-to-emotionally-grounded-experience/ lays it out including the pertinent links to Columbia’s Earth Institute and its Center for Research into Environmental Decision Making.
I got more than the worm this time, Kim.
What does that have to do with this post?
Read ‘Childhood’s End’, by Arthur C. Clarke. It might not answer your question, but may well be worth your while.
============
I agree with Max about “Linear Thinking”. The temperature curve one should expect to see looks just like the GISS LOTI observed temperature in figure 1. It’s a logarithmic curve because as you add more and more CO2 it has less and less of an effect.
Mr Banana Nuttycelli is a bit of an easy target: I went troll trolling with this ditty –
It is just a mistake. Dana Nuccitelli is a Guardian environmental contributor and has worked for Tetra Tech oil and gas services company since June 2006.
Attack big oil and take big oil money. What’s not to like?
It’s even worse than that, Jimbo.
TetraTech is a big environmental remediation and construction firm. The oil industry is only a fraction of their business. See their website. They have just won a big contract from the US Army. All the details are on their website.
This company, with it’s engineering services, is very well positioned to win CO2 sequestration contracts from government. Dana Nuccitelli helps to advance that profit wet dream to a reality in his position with the Guardian.
One might ask, why a UK media org. when Nuccitelli lives in Pasadena Ca. at company HQ.?
Answer:CO2 and $ billions in oil company profits. How do these two meet? Because CO2 injection flooding is by far the most efficient way for secondary recovery from depleted reservoirs and the giant fields of the North Sea are nearing the end of their productive life (via primary recovery). BILLIONS are at stake. Big oil, Shell, BP, others lick their chops at the prospects of getting the public to pay for CO2 sequestration so that it can be _pipelined_ to the offshore production platforms and injected into the reservoirs.
Is the UK public dumb enough to countenance such a scheme?
You bet they are.
Sooo-ooo. Dana is a very good boy, by the lights of his employer and certain big oil outfits, and by the lights of the public dupes. You have heard the expression “follow the money”?
But don’t just take my word for it. Ask Charlie MacPherson whose email is posted at the TetraTech website and who has been appointed to deal with public inquiries.
“Attack big oil and take big oil money. What’s not to like?”
CO2AGW is not an attack on Big Oil+Gas. It is a means to enforce scarcity of Oil+Gas supply to enforce higher prices and higher profits. Also, you can kill the competitor coal which has more carbon per calory.
The Guardian loves Nutticelli because they both love censorship:
Follow the money.
Follow the money applies in spades to climate science.
Follow the money to the Davos conference where you will find a greater concentration of money represented there than CO2 represented in the atmosphere.
“The climate modelers assumed that all of the global warming occurred because of manmade climate forcings”………first they convince you that the LIA ended in 1850…and that 1850 was the perfect temperature
Is Latitude not happy with LIA ended in 1850?
If so, when did the LIA end Latitude?
There is zero evidence that it did end. No one knows what caused the LIA, so how can anyone claim to know when it ended? Claims that it ended in 1850 as simply that. Claims, not science.
Real scientists would in fact investigate to determine the cause of the Minoan Warming , the Roman Warming and the Medieval Warming, before assuming that the Modern Warming is somehow different.
Since Climate Science doesn’t know the cause of the first 3 warmings, any claims that the present warming has a different cause are unscientific. You cannot claim the previous events had a different cause when you don’t know the cause of the previous events.
ferdberple says there is zero evidence that it did end.
Just to go on and say something about the modern warming. There has been warming, but the LIA did not end. LIA has no connection with temperature?
And from where does ferdberple’s knowledge of Minoan, Roman and Medieval warming originate? How does he know when these periods started and ended? Something to do with temperature?
“Skeptics have been preaching for years that natural variability can contribute to the long-term global surface warming trend…and suppress it, in effect stopping it.”
Depends of course of what constitutes “long-term”. It is for example easy to have steps that lasts more than 10 years with random generated numbers with the same variability and longer term trend as the temperature series.
Perhaps Tisdale could define what “long-term” is?
Rooter, “long term” is five minutes for you, so quit trying to trap Tisdale. And show some bloody respect by using salutations once in a while. Your snide-o-meter is pinned most of the time.
Ding…+1
Tisdale cannot say what he means by “long term”. Interesting fact.
The Kurd is right. And regarding “long term”, Bob posted this ‘long term’ 200 year graph for your benefit: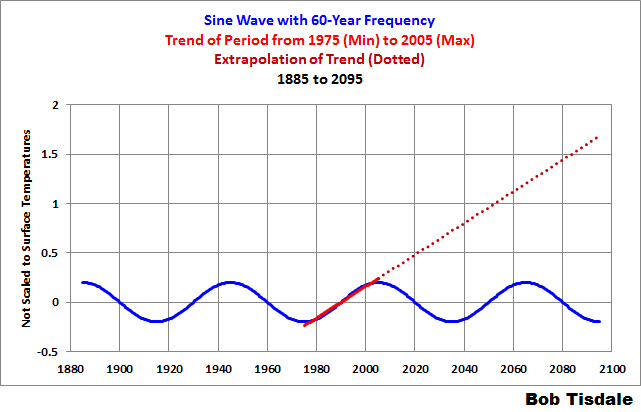
I was just thinking of what the influence might be towards the end of this century, and the looming disaster which awaits those alive in 2100. I peg the climate shift point in years that end with xxx5/6/7. So from 1976 to 2006 there was a warm trend. The cool should hold to 2036, then warm to 2066, and lastly the latter part of this century will also end with cool which should switch to warm around 2096. That means there will be 2 cooling trends and only 1 warm trend, up to the year 2096, approx.
Funny that. Tisdale’s staircase graphs does not span 200 years.
Apparently rooter has not learned to count past 99. Counting into the hundreds is a difficult step but with perseverance can be accomplished.
the graph shows 1880 to 2100. 2100-1880 = 220 years
take off your shoes next time. it helps when you run out of fingers to do the math.
Right rooter, you forgot about toes dinyu?
ferd berple:
Funny that. Tisdale’s staircase graphs do not span 220 years
Rooter only has ten toes.
http://www.principia-scientific.org/breaking-new-climate-data-rigging-scandal-rocks-us-government.html
roalddjlarsen,
That article was published on 19 Jan 2014. I haven’t hear any more about it. Maybe some one else knows the final disposition?
This is from a post by Steve Goddard, why the media is choosing to ignore it is puzzling since by media terms it is a “sensational” claim. I imagine it will get out there on blogs and who if MSM will ever pick it up.
What Steve found was more homogenization of previously homogenized data. In his post, there is an interesting animation that plots measurements from the raw data through each “correction” step. At each correction step the past becomes cooler and present becomes warmer.
Another issue is in how the corrections are made; the fidelity of the data is not improved but goes downhill in each iteration. Kind of like creating multiple audio mix-downs without going back to the master recording for each new version. In the end you end up with a muddy mess, which will get you fired from a recording studio and a bonus as a climate scientist.
Thank-you for this article. I am without scientific training but am interested in the current debate about what is causing the Earth to warm and try to read as much as I can on this subject. What I regard as my common sense causes me to reject the argument that man-made carbon dioxide in the atmosphere is the cause of global warming. My math places man’s CO2 contribution at about 13 PPM of the atmosphere. This ridiculously small contribution makes no sense as a cause of anything. It certainly doesn’t figure into the cycle of temperature change you address in this article.
Bravo.
“That NOAA FAQ webpage confirms that the Atlantic Multidecadal Oscillation can contribute to global warming and suppress it.”
Nice on Bob….
Here’s the line from NOAA……
In the 20th century, the climate swings of the AMO have alternately camouflaged and exaggerated the effects of global warming, and made attribution of global warming more difficult to ascertain.
Also, Norwegian polar bear biologists conclude that condition of polar bears in the Barents Sea varies with the AMO and its influence on spring ice conditions:
http://polarbearscience.com/2014/03/10/barents-sea-polar-bear-condition-varies-with-amo-and-spring-sea-ice-conditions/
Dr. Susan Crockford, zoologist
Tisdale says: “Conversely, global temperatures cool during multidecadal periods when La Niña events are stronger, last longer and occur more often than El Niño events.”
Nuccitelli says: “During that time, that temperature rise has temporarily both slowed down (during the 2000s, when there was a preponderance of La Niña events)”
Tisdale:” global sea surface and land surface temperatures warm during multidecadal periods when El Niño events dominate.”
Nuccitelli: “and sped up (during the 1990s, when there was a preponderance of El Niño events).”
“cools” and “warms” to “slow down” and”sped up” They saying the same thing? Don’t think so.
Pippen, give it up. This applies to your pals:
http://moonbattery.com/graphics/global-warming-polar-bear.jpg
Great graphics!
This is the kind of comments I feel pushes this site away from being awesome for me, someone makes an serious argument (although one based on semantics), and the response they get is a “funny” picture and someone else cheering them on.. Come on.. Youre all grown ups right?
Id rather such things were filtered away and serious replies would stick around, WUWT is the only blog where Ive given up on reading comments. But I dont expect Anthony to shoulder such an extreme task of filtering stuff away : (
On second thought, the graphics are superb!
@ ohflow….what serious argument?
ohflow
…uhhh…so how do you comment on a site you no longer read? Good trick.
Indeed! If he comments without reading, wouldn’t it be obvious his comment would be nonsensical?
Yes.
Or he reads and won’t admit it. Then it becomes a question of character.
2 El Nino’s plus an almost El Nino,
3 minor La Nina’s
I don’t think that word ‘preponderance’ means what you and the Nutticelli think it means.
Your doubletalk is sad pippy. Only alarmists will believe you.
Ohflowp; did you get sent here with that incredibly lame infantile pretend argument? Didn’t they warn you before sending you here pretending to be a regular reader here?
Try reading this site for a couple weeks instead, you might begin to understand.
dbstealey; an almost perfect picture at the perfect time.
The problem is that, whatever Dana may say at any time, he reserves the right to unsay it as it suits him.
There’s no point in treating him as though he is a man of his word.
Argue with Trenberth instead. He may disagree, but honestly.
I think that Mr. Nuccitelli sees his role more as a propagator of the faith rather than an objective scientist.
I, for one, am far from convinced of Trenberth’s “honesty”. See, for example:
Kevin Trenberth: false memory syndrome?
As for Dana, FWIW … In my view, he’s nothing but a dutiful little 3rd rate propagandist. As if the Guardian didn’t have enough of them (cf Suzanne Goldenberg, Damion Carrington and [now former] Leo Hickman) on board!
Bob sez: “Skeptics have been preaching for years that natural variability can contribute to the long term global surface warming trend…”
###
Not this skeptic, who says “show me AGW”
Bob Tisdale deserves congradulations for producing a post with only four charts. Remarkable. ; }
🙂
That is funny. His posts always take the longest to load.
Bob: In some respects, El Ninos and La Ninas do not warm or cool the earth: El Ninos slow down the upwelling of cold deepwater in the Eastern tropical Pacific and La Ninos speed up the process. That simply re-distributes existing heat within the ocean and atmosphere. The SURFACE and atmosphere are warmed by more frequent El Ninos and less frequent La Ninas, but that process can’t continue indefinitely. The only thing that can warm or cool the planet in the long run is the radiative imbalance at the TOA. (The heat capacity of the oceans is extremely large, of course, but only the top 50 m (mixed layer) is effected by seasonal changes. The effective size of the reservoir exchanging heat with the mixed layer on a decadal time scale may not be much bigger.)
If the effective global albedo changes with ENSO, that will change the radiative imbalance at the TOA by changing reflected SWR. If the total humidity in the atmosphere (particularly the upper troposphere) changes with ENSO, that will change the outgoing LWR flux at the TOA. Has anyone looked at what CERES and ERBE tell us about any correlation between ENSO and TOA fluxes.
I would make a point similar to Frank’s.
But it is the pause in upwelling that produces the really big El Nino and it is not “a redistribution of existing heat”, rather it is insolation that is the driver, specifically, whether the insolation warms the cool upwelling (La Nina) or whether the insolation is absorbed by waters which are already at an elevated temperature. The last condition is what obtains when upwelling is arrested, thus leading to El Nino.
Mpainter: If the surface and atmosphere get warmer during an El Nino and the TOA radiative balance (or imbalance) doesn’t change, conservation of energy demands that the ocean must get cooler. Thus I think it is fair to characterize this as a redistribution of heat (energy) already present within the ocean/surface/atmosphere climate system.
Frank,
It’s a question of where the heat comes from. I see insolation as the source of the heat in the eastern Pacific. I don’t see where your “redistributed” heat originates.
mpainter: It is my understanding (mostly from reading Bob’s posts) that the warm water in the Eastern Pacific during an El Nino has traveled east from the Western Pacific Warm Pool, where trade winds from east to west normally cause it to accumulate. When the normal trade winds fail to blow, this warm water flows (with the assistance from gravity) from west to east during an El Nino. Some warm water also moves below the surface as a Kelvin wave and rises in the Eastern Equatorial Pacific. So heat stored in the Western Pacific Warm Pool spreads across the Pacific and replaces the colder surface waters that are normally found there. Later that warmth reaches the atmosphere and is spread around the globe. So i belief redistribution plays a much greater role in El Ninos than insolation. (Hopefully Bob will be kind enough to correct me if I have misunderstood what he has written.)
Frank,
You have expressed a view that I do not embrace. Stop the upwelling and the SST will warm rather rapidly. But there is room for a counter current theory.
However, I would advise that you dispense with the notion that it is flowing “downhill”, my expression.
If one considers the upwelling as a process that suppresses SST under constant tropical insolation, then cessation of upwelling means SST will achieve tropical levels with consequent release of latent heat on a tropical scale, which condition does not obtain when upwelling occurs. No redistribution needed.
mpainter: You do need to remember that the ocean (unlike the atmosphere) is stably-stratified, with warmer less-dense water on the top and colder more-dense water below. Only the mixed layer (less than the top 100 m) is mixed by wind. In most locations, convection can’t carry heat from the sun any deeper into the ocean than 100 m. So the surface of the ocean is in equilibrium with the atmosphere above it, not the deeper ocean below. All heat transfer (radiation, sensible heat, latent heat of evaporation) come from the top 1 mm of the ocean and those fluxes in MOST places are far greater that vertical fluxes transferring heat below the mixed layer. Vertical diffusion of heat is far to slow. Currents running along the bottom of the ocean acquire a vertical component (against the density gradient) due to the irregular ocean floor.
Deepwater is mostly formed only in a few regions on the planet because the density of water is maximal at 4 degC and salinity can then make it sink. Upwelling occurs where it is easiest for that water to return to the surface, often where constant winds move some surface water far away. The Pacific trade winds do so in the Eastern Equatorial Pacific, which is why there is upwelling of the coast of South America
Albedo does increase with increasing temperature.
So, Bart, in a nutshell, how would you explain it? Increasing SST?
Bart I can show that a 1% increase in cumulous cloud coverage is roughly equal to a negative 3 watts, easily compensating for any CO2 doubling. Cumulous cloud feedback is definitely negative.
I was not explaining “it”. I was simply pointing out that Frank’s conditional “If the effective global albedo changes with ENSO…” can be resolved in the affirmative.
No, you did not explain it.
I was soliciting an explanation, you see.
Frank says: “Bob: In some respects, El Ninos and La Ninas do not warm or cool the earth…”
That’s an obviously flawed statement.
Frank says: “El Ninos slow down the upwelling of cold deepwater in the Eastern tropical Pacific and La Ninos speed up the process.”
You’ve expressed an incomplete understanding of ENSO. El Niños release warm water from beneath the surface of the western tropical Pacific (where it’s excluded from the surface temperature record) and place it on the surface (where it’s included in the surface temperature record). That obviously results in a surface warming of the tropical Pacific.
Frank says: “That simply re-distributes existing heat within the ocean and atmosphere.”
Once again, you’ve expressed an incomplete understanding of ENSO.
An El Niño causes the surface temperatures of the tropical Pacific to increase because warm water has replaced cool water along the equatorial undercurrent (Cromwell current) in the eastern tropical Pacific. The equatorial countercurrent (on the surface) also strengthens during an El Nino, carrying more warm water from the western to the eastern tropical Pacific, also increasing surface temperatures in the east. In response to the increased surface temperatures across the entire tropical Pacific, there are increases in evaporation and convection in the eastern tropical Pacific, which releases heat from the ocean. When the moisture condenses, that heat is released to the atmosphere.
All of the warm water that had been transported from west to east within the tropical Pacific during an El Niño, which has not been “consumed” by the El Niño, is redistributed within the Pacific and into the eastern Indian Ocean in the wake of an El Niño.
In response to the relocation of the primary area of convection in the tropical Pacific (from the West Pacific Warm Pool to the central and eastern tropical Pacific, atmospheric circulation changes globally. And according to Trenberth and Fasullo (2012):
“Meanwhile, maximum warming of the Indian and Atlantic Oceans occurs about 5 months after the El Niño owing to sunny skies and lighter winds (less evaporative cooling), while the convective action is in the Pacific.”
http://www.cgd.ucar.edu/staff/trenbert/trenberth.papers/ISSI_fulltext.pdf
Frank says: “The SURFACE and atmosphere are warmed by more frequent El Ninos and less frequent La Ninas, but that process can’t continue indefinitely.”
It hasn’t continued indefinitely. It slowed from the mid-1940s to the mid-1970s, and appears to have slowed once again since the turn of the century.
Frank says: “The only thing that can warm or cool the planet in the long run is the radiative imbalance at the TOA.”
The instrument record disagrees with you.
Frank says: “Has anyone looked at what CERES and ERBE tell us about any correlation between ENSO and TOA fluxes.”
Do you recall Trenberth’s travesty email? That was about CERES. The system was inadequate. His follow-up to Michael Mann reads:
“Where did the heat go? We know there is a build up of ocean heat prior to El Nino, and a discharge (and sfc T warming) during late stages of El Nino, but is the observing system sufficient to track it?…”
Also see Trenberth and Fasullo (2011) where they write:
“We can often recognize these changes once they have occurred, and they permit some level of climate forecast skill. But a major challenge is to be able to track the energy associated with such variations more thoroughly: Where did the heat for the 2009–2010 El Niño actually come from? Where did the heat suddenly disappear to during the La Niña?”
mpainter says: “I would make a point similar to Frank’s. But it is the pause in upwelling that produces the really big El Niño…”
Does upwelling stop during an El Niño? Do you have a source paper for that? During an El Niño, isn’t the eastern equatorial Pacific simply upwelling warmer-than-normal water from the equatorial undercurrent?
“Do you recall Trenberth’s travesty email? That was about CERES.”
Yes it was. CERES showed heat accumulation. The observational system on earth at that time did not track that. Now they do.
Where did the name El Nino originate? Isn’t it associated with the west coast of south american? Starting around christmas, thus el nino, the male child.
the theory I heard years ago was that the winds over the Andes, the winds that are responsible for the Atacama desert in Chile, these winds lose force and are the trigger for El Nino..
The warm surface water to the west of Chile is no longer driven to the west, the upwelling of northward flowing cold deep water slows along the coast, and the sardine population industry collapses due to lack of nutrients. Since a great deal of the economy all along the South American west coast was tied to these sardines, it was a big deal, and thus the name El Nino.
No source, Bob, it’s something that I heard thirty years ago and a view that I never seen contradicted. I have always held that view.
My point of view is that the SST temperature difference drives the Hadley cell circulation and this circulation will not falter so long as there is upwelling west of S. America.
But the upwelling is seasonal and diminishes during the antipodal summer:
The term El Nino derives from the fishermen of Peru. It refers to the Christ child because the fish catch started to wane around Christmas. This was when the fishermen (and fishing is big industry offshore Peru) would repair their equipment and spend time onshore. It is the upwelling that provides the abundant catch, you see.
So the term “El Nino” comes to us from the fishermen of Peru, and it referred to those periods of diminished catch, which we understand to be the consequence of the failure of upwelling.
Also, Bob,
I urge that you seek new sources of information concerning the origins if ENSO. There is no question that the upwelling offshore western S.America comes from the Humboldt current, a northward flowing cold water current that is part of the general ocean circulation. It has its counterpart offshore west Africa.
I have never heard of the equatorial undercurrent theory and such an idea astounds me.
Bob, start with Eckman Pump.
The Atacama is due to the persistent cold water offshore S. America. Low SST means low humidity levels, no convection, no precipitation. It has its counterpart in the Namibia desert of W. Africa, another coastal desert subject to the same conditions. This coastal desert phenomenon has been understood by climatologists for decades (real climatologists, not your junk science types)
Bob: Thank you for the reply.
I’ve understood from you posts that sea level in the Eastern Equatorial Pacific is usually lower than in the West because trade winds usually push water to the west. My intuition tells me that upwelling of deepwater occurs where the weight of water above is lowest. Therefore I assume less upwelling occurs off Peru during El Ninos because sea level is higher in the Eastern Equatorial Pacific then.
FWIW, the Wikipedia article on ocean upwelling – especially the final figure which discusses El Nino – provides some support for my intuition. http://en.wikipedia.org/wiki/Upwelling The Wikipedia article on El Nino also mentions reduced upwelling during El Nino several times. You can run a Google Scholar search for “reduced upwelling El Nino” and find many references about this subject.
I respectfully suggest that most of your reply discusses redistribution of warm water during and after El Ninos. Redistribution of heat (almost by definition) doesn’t heat or cool the whole planet: surface, atmosphere, and ocean (most of which requires many decades to centuries to effect surface temperature). Only radiative fluxes through the TOA cool or warm the planet as a whole, but redistribution can distort surface temperatures every few years (ENSO), possibly every few decades (PDO AMO) and possibly longer (LIA). These distortions can last a long time because of the large heat capacity of the ocean.
If I understood your earlier posts, you believe that heat from the Warm Pool in the Western Pacific returns to the Eastern Pacific during El Ninos and then spreads to other parts of the Pacific, producing a step-function increase in global and some local temperature records with each El Nino. However, each such event depletes the Warm Pool – unless it is being recharged by warm water moved west by the trade winds while being warmed by the tropical sun (through the TOA). Where I might disagree with you (again respectfully) is that your mechanism should produce oscillating surface temperature in the absence of a radiative imbalance and the step function arises from the radiative imbalance. (Every strong El Nino for the past several millennia obviously couldn’t have produced an 0.1 degC step function increase in mean global surface temperature.)
Frank:
“Has anyone looked at what CERES and ERBE tell us about any correlation between ENSO and TOA fluxes.”
Yes. Susskind et al 2012
http://onlinelibrary.wiley.com/doi/10.1029/2012JD017997/full
With this:
http://onlinelibrary.wiley.com/store/10.1029/2012JD017997/asset/image_n/jgrd18237-fig-0002.png?v=1&t=i5cea147&s=6d73e4b85ae79f4edc1c410b8669903d1529f275
During ninjos OLR is higher than during ninjas. The earth looses more heat to space during ninjos.
According to Tisdale that will make the Earth warmer. More ninjos and more heat loss warm the earth.
Don’t ask me how that is supposed to happen.
I guess, in your universe, there are no phase lags and every cause/effect relationship is instantaneous.
No phase lags in my universe says Bart.
Not in Bart’s universe either. At least he cannot explain those phase lags.
No process is instantaneous, Rooter. When you are dealing with the immensity of the Earth, the phase lags produce on the order of years of delay.
See here.
Bart still fails to deliver. He does not like observations. He has some unstated phase lag model that trumps observations.
Actually, no. That is an estimate of the step response from observations.
See Spencer, OSW decreases and can overwhelm the increase in OLW.
So, what causes the El Niños? Where is the heat coming from?
Hey Cube: aren’t you curious what causes the La Ninas and where does the cooling come from?
The heat comes from the sun. See my comment above.
Of course it comes from the sun. And more greenhouse gases will retain more of that heat in the atmosphere, surface and oceans.
Rooter, CO2 has no effect on SST.
Water vapor, the only GHG that counts, transports latent heat aloft from where it is radiated to space, hence it is an important cooling function.GHG cool the planet. The IR flux is only a transient aspect of the cooling process.
“And more greenhouse gases will retain more of that heat in the atmosphere, surface and oceans.”
That is the hypothesis. It has been falsified. At the very least, the relationship is not monotonic, and increasing CO2 in the atmosphere has failed to correlate with increasing surface temperatures over the past century in the present climate state of the Earth.
There are many such seeming paradoxes in science. Just because it seems rationally plausible does not mean it must be. More sophisticated analysis is obviously needed, but instead, the current climate establishment keeps trying to force the square peg into the round hole.
mpainter’s mantra is that CO2 has no effect on SST. All GHG’s do is to cool the planet.
mpainter has obviously not checked the temperature of the earth. How much energy the earth receives from the sun and what temperature that will produce.
Bart says:
“That is the hypothesis. It has been falsified. At the very least, the relationship is not monotonic, and increasing CO2 in the atmosphere has failed to correlate with increasing surface temperatures over the past century in the present climate state of the Earth.”
Really? Failed to correlate?
http://www.phy.duke.edu/~rgb/cCO2-to-T-volcano.jpg
Rooter, show how CO2 warms SST, please and thank you.
Temperature of the earth? Interglacial, thank GOD.
Well, rooter, are you going to explain to all these skeptics just how CO2 warms oceans? Your pals at SKS are watching, you know.
So c’mon, rooter, tell us how it works.
mpainter:
When did you decide to be a Dragon Slayer? You are actually saying that GHGs have no effect for the temperature on the earth. Then ou have to explain why the oceans are not all ice. Give us the energy budget for earth. Numbers.
Repeating mantras will not suffice.
rooter @ January 25, 2015 at 12:48 pm
Par for warmuninsts – demonstrating once again the robustness of least squares fitting, and then proclaiming that it actually means something other than simply that.
It is always possible to match low frequency curves with same sign curvature using this procedure. It is nothing remarkable or noteworthy.
If you want a truly remarkable match between CO2 and temperatures, this is one. It matches across the entire frequency spectrum. But, it says temperature is driving CO2, not that CO2 is driving temperature.
Bart, using the derivative masks the long term trend in CO2
Bart, your chart shows correlation, it does not show causation.
Bart
..
This shows you how taking the derivative masks the long term trend in CO2
.
http://www.woodfortrees.org/plot/esrl-co2/from:1949/mean:12/derivative/plot/esrl-co2/from:1959/mean:12/offset:-330
David – you’re an idiot.
Bart…
…
Please review the policy of this website.
“Respect is given to those with manners, those without manners that insult others or begin starting flame wars may find their posts deleted.”
…
as posteda at http://wattsupwiththat.com/about-wuwt/policy/
Name calling doesn’t help your case.
..
Please try to address the issue, and refrain from ad-hominem attacks.
And note that the derivative removes the long term trend.
The deconstruction of the “evidence” provided by Bart.
..
Part one….
…
For part one, we will disregard temperature all together.
…
The evidence proffered by Bart takes raw CO2 concentration data and processes it in two distinct steps.
The first step is to apply the 12 month running mean to the data. The result of this operation is to remove the annual variation in CO2 data.
..
http://www.woodfortrees.org/plot/esrl-co2/plot/esrl-co2/mean:12
..
It is easy to see that the high frequency component of the data has been filtered out. Why has this been done? No reason given
…
Secondly the derivative function is applied to the data
..
http://www.woodfortrees.org/plot/esrl-co2/offset:-330/plot/esrl-co2/mean:12/offset:-330/plot/esrl-co2/mean:12/derivative
Please note that I added a “-330” offset so that the the effect using the “derivative” has on the data can be seen. Obviously the long term trend of the CO2 data has been eliminated by applying the derivative function to the data. No reasoning for this operation has been given.
Part two…..
…
The resulting data graph of CO2 has had both the short term and the long term trends removed. What does this leave us with? Not much. This “data” is than plotted against satellite data. The plot is claimed to show causation, which careful examination shows it does not. There are places in the comparison where no definite conclusions can be made. Is there a correlation? Yes. Does Bart’s plot provide proof of causation? NO
…
Not even wrong. Did I mention you’re an [trimmed], David?
[Bart: Please do not insult idiots on this site. .mod]
Bart, thank you for showing all of us that you are unable to counter a very simple rebuttal to your precious theory.
Good luck publishing your next paper.
Come on rooter, I asked you for your explanation of how CO2 warms the ocean and you respond with name calling. Is that supposed to impress people?
“Not even wrong”
…
Did you skip class when they reviewed the implication of two negatives?
mpainter could not produce an energy budget that could give some hint as to why the Earth is not Iceball Earth.
mpainter mantra is that increased IR to the surface cannot have an effect on the temperature of the ocean skin. The reason for that is supposed to be that will only lead to increased evaporation.
The one factor mpainter has not thought of is how evaporation can increase when there is no increase in temperature. Suddenly evaporation had nothing do to with temperature. Increased IR just magically leads to increased evaporation. Evaporation and temperature are just disconnected.
If mpainter doesn’t like being a dragonslayer, why does he argument like a dragonslayer?
Rooter replies with doubling the name calling, false attributions, and specious argument and _still_ does not explain how CO2 warms the ocean.
Tisdale has explained that many times elsewhere. Read his books. In a nutshell, incoming solar warms the mixed layer of the tropical Pacific. Normaly prevailing westerly trades push that warmer water to the western Pacific piling to depths below the mixed layer. Weakening trade wind strength (even sometimes changing to easterlies) cause the nino by allowing the accumulated sunlight warmed water to slosh back east. Nina is just the opposite of stronger than normal westerlies piling up more, and therefore also strengthening the east equatorial Pacific upwelling of colder deeper water to keep approximate sea level equilibrium in the Pacific bathtub.
Places fingertips in earholes. Denier!…Denier!….Denier! , not listening….La,La,La
The terms “sloshing back”or “piling up” fail to appropriately characterize the natural processes involved in the ENSO phenomena.
It is all a natural consequence of cold upwelling west of S. America. See Eckman Effect or Eckman Pump. This is the same effect that determines the cold upwelling west of Africa, or off Baja, or other areas. It is the failure of this effect that leads to increased SST in the eastern Pacific and the slowing or reversal of the Hadley circulation.
To reiterate, equatorial waters of the eastern Pacific warm (via insolation) when cold upwelling in that area slows or stops, producing El Nino. Following El Nino, the cold upwelling resumes, the eastern equatorial Pacific cools and this produces the LA Nina.
The great volume of warm water in the western Pacific is a natural consequence of the latitude, and this condition is replicated off the coast of eastern S. America. Compare SST off west Africa where cold upwelling occurs with SST off eastern S. Am.
MPainter, you know that, I know that, and Bob certainly knows that. Apparently John the Cube did not. Teach to the apparent grade level.
Actually u have the westerlies and easterlies mixed up, otherwise correct.
Tom s…..?
I said nothing about westerlies or easterlies.
Rud you have described the process beautifully, but I think you reversed the names of the winds involved. Winds are named by the direction from which they come, not the direction in which they flow. The trade winds that pile up water in the Western Pacific are easterlies. 🙂
Tom and Ted, correction accepted. I should have double checked.
More of that “piling” baloney. Show me a pile of water, please and thank you.
There are lots of ‘piles’ of water; tides for instance. The process by which wind creates ‘piles’ of water in the Pacific is similar to what causes seiches in smaller basins.
So, yes, water can pile up, sometimes with dramatic results.
A “pile” of water?.
New use of the word.
I think you mean “accumulate”.
the trades are easterly. winds as name for the direction from which they originate, which is opposite to the direction they are flowing.
thus the trades which originate i the east and flow westerly are called easterly, and the temperate zone winds, the Westerlies, originate in the west and flow easterly.
You asked me to show you a pile of water. I obliged.
The word ‘pile’ always has a vertical dimension when used to denote something like a heap or mound. The word ‘accumulation’ does not require that the accumulated material has a vertical dimension. I used ‘pile’ advisedly. Both water and dirt can be piled. A pile of dirt may be stable if you don’t exceed its angle of repose and it doesn’t rain. A pile of water probably won’t be stable for very long. I would assert, though, that they are both piles for as long as they exist.
Here’s a literate use of ‘pile’ as applied to water:
No, I did not ask for another example of the word “pile” misused with respect to water. I asked to be shown a “pile” of water, which phenomenon is something that I am eager to behold, never having seen such. And I have seen wind tides, tidal bores, storm seiches in lakes, etc. and misusing the term “pile of water” to describe these and ignoring the correct terminology in doing so does not impress me as very scientific.
So, if you have a photo of water that is in a pile, I would be very impressed, indeed, assuming that you understand my meaning when I use that word.
John the Cube says, “Where is the heat coming from?”
In the article, I wrote:
NOTE: If you need a reference for the “sunlight-created” heat and warm water, see the quotes from the two Trenberth papers under the heading of Trenberth’s Conflict in the post The 2014/15 El Niño – Part 9 – Kevin Trenberth is Looking Forward to Another “Big Jump”. [End note.]
Further down, I added:
KEVIN TRENBERTH’S “BIG JUMPS”
At this point in the post I would normally go into a discussion of ENSO acting as a chaotic, naturally occurring, sunlight-fueled, recharge-discharge oscillator. But it will be difficult enough for the CO2 obsessed to come to terms with Dana’s admission, so I’ll skip that part of the normal plotline. If you’re interested in learning how powerful El Niño events contribute to long-term warming trends, see the following Trenberth “big jump”-related posts:
Please click on the links.
Bob, maybe [sunlight-created] is actually mudulation of internally generated heat: http://wattsupwiththat.com/2014/09/24/an-engineers-questions-regarding-holocene-climate-change/
You raise some good points Bob, but is Dana allowed to answer on this forum? I suspect not, and if so then this becomes something like the Guardian – a one sided discussion preaching to the converted.
Make no mistake, I have already prejudiced myself that Dana is [snip], but even so there is no merit in attacking someone who cannot defend. I would like to hear what he has to say ( I know this would not be reciprocated on the Guardian or Sceptical Science or RealClimate but…..
[Please keep your comments civil. The word you used is unacceptable (look it up). mod]
Which word mod? … and who are you if I may ask?
OK, I see the snip
Having looked it up, let me apologise. This is a relatively mild insult in the UK,, perhaps it has a different emphasis in the U.S.
I often get called that in the Pub (maybe I missed the real meaning).
MikeB,
Dana has commented here numerous times in the past. He has never been deleted, or even snipped, as far as I know.
If he wants to defend himself, or give his opinion, he is certainly welcome and encouraged.
I think the reason Dana stays away is because it is much more comfortable commenting at the Guardian, instead of having his feet held to the fire of scientific probity here.
At the Gruniard, he does not have to defend his positions. Which for the most part is not possible in the first place.
This site has relatively few bans. You want to talk science, you’ll have an audience. You want to talk smack, you’ll still mostly have an audience. You want to talk gross smack, you’ll get snipped some. You want to talk really gross smack incessantly, you’ll get a timeout… – could be a long one. Most of the intellectually challenged targeted here can’t stand the heat usually, and don’t stay to engage [But] they’re always welcome to stand up for what they think they believe.
MikeB, warmists have been invited to put up guest posts on WUWT. William Connelly has commented here quite a few times. Only those with access can dig out the comments made by user. Both Dana and Connelly have commented on NTZ.
Yes, I have seen them comment and I think I have seen them banned.
Hansen had a thread here two or three years ago.
She was an early communist. The reds made a putsch, got involved in thuggery and street combat and lost. The reds tried to make a martyr of her, but no one gave a hoot.
Now how the heck did that happen?
mpainter,
It was either the mischevious computer elves, or it was you that fckd up. I always blame the elves… I haven’t made a mistake in years.
Sorry I just got back from the pub, but let me answer regardless.
I am a great believer in free speech and I would like to think that this forum is a learning experience and, as I said before, you never learn anything from someone who agrees with you.
I don’t like to see opinions supressed, however much they go against the ‘consensus’ on this site or any other.
I accept that this does pose a problem when you have dragon slayers who bomb sites like Roy Spencer’s with total rubbish which mislead people and overwhelm and outnumber sensible contributions, and I don’t know the best way to deal with that.
I did try to post a superb defence of free speech by Christopher Hitchens, which I think I mis-posted
But here it is for anyone who has the time, very rewarding and uplifting for believers in free speech – and yes…he does shout FIRE in the auditorium.
And he espouses Rosa Luxemburg who lead a violent uprising in 1918 to putsch away a Social Democrat government to repeat the October revolution in Germany.
Well, thanks but no thanks.
Mike B. One of the things that impresses me about this site is the too and fro that often arises between differences of opinions. I’m not sure why you think Dana could not attempt to make a defence here. Debate, or lack thereof, is the big issue skeptics have with the warmist believers. I have repeatedly invited alarmists to make their comments inside the blog domain here, and not just on Facebook. They wont, because they know they will be shredded. It’s certainly not because they will be banned for saying something that proves them right. As long as the rules are respected.
If you don’t know what the other side is saying, how do you know you disagree with them? On this occasion however, Dana seems to be in agreement with with the skeptical view. We’re just not sure if he understands that just yet.
Eamon.
DirkH, Yes Luxemburg is a lefty heroine. This guy has still not worked through the logic of hiws own propositions.
MikeB, Dana Nuccitelli used to use the pseudonym Dana1981. The last time I recall Dana commenting here was on this thread, starting with this comment:
http://wattsupwiththat.com/2012/05/30/dana-nuticellis-skeptical-science-ohc-grapple-down-for-the-count/#comment-997393
As far as I know, Dana has not been banned here.
[Note: moderators have the list of who has been banned. Dana Nuccitelli is not on it, and he has never has been on it. ~ mod.]
Of course, Dana is welcome to comment here.
I think WUWT readers would love to engage in an mature, intelligent debate with him, but he’s not interested that. To him the science is settled, which anyone with any background in science knows that putting forth a global temperature anomaly for 1850 with a precision of tenths of degree accuracy is not only ridiculous, it’s completely absurd.
I think the University Colorado SLR scientist was the only one who managed to post here for more than a a day or two.
This site welcomes discussion and debate, and God bless it for that.
The other side, not so much.
In my mind this is a quick acid test to see who is right. People who are honest and have integrity do not summarily dismiss those who ask legitimate questions, and do not censor or delete comments. Those who are unconcerned about the truth, those with an agenda, like Dana and SKS do.
I’ll go you one better: anyone with any background in science knows that putting forth a global temperature anomaly is not only ridiculous, it’s completely absurd.
anyone with any (relevant) background in science knows that putting forth a global temperature anomaly is not only ridiculous, it’s completely absurd (and dishonest).
It is surely obvious to anyone who has been paying attention that Dana would be welcome to comment on WUWT.
Exactly! This way he can’t hide behind the Guardian and their draconian comment deleting policy.
Slightly Off-Topic, but linked to ‘getting the facts right in the first place’ – has anyone read the Green Party 2015 Election Manifesto? For those outside the UK, we have a general election coming up in May – and the ‘Greens’ manifesto is an excellent example of how to publish propaganda.
Under their chapter heading ‘Our Environment’, they start with this paragraph (page 33). . . .
“Miners used to take canaries down mines with them to check for poisonous gases. They were an advance warning of impending problems. That’s what climate change is today – a threat in itself to our survival as a species and a warning of more general ecological collapse.”
Page 34 says (quote):
“The concentration of carbon dioxide (CO2) in the atmosphere has risen from 270 parts per million (ppm) CO2 in the 19th century to about 435ppm . . . .”
Er, 435ppm . . . . come on!
Full Green Party Manifesto here . . . . warning: it’s quite entertaining!
http://www.greenparty.org.uk/assets/files/resources/Manifesto_web_file.pdf
Check out ‘Climate Change’, ‘Carbon Reduction’, ‘Transport’ (and Speed limits) and ‘LGBTI’ issues.
My mistake, sorry, the Manifesto is from 2010. Still entertaining though.
I made this comment on another post.
http://wattsupwiththat.com/2015/01/23/super-heated-air-from-climate-science-on-noaas-hottest-year/#comment-1842986
Has anyone made a trend showing how GISS LOTI values have been changed?
I don’t have the time or skills to attempt it myself.
The obvious changes to past values, to this layman, seem significant … at least on the …uh…surface.8-)
Google Steven Goddard
Gunga, essay When Data Isnt in ebook Blowing Smoke with a foreward from Judith Curry has what you seek. A sufficiently complete compendium at the time went to press. Much more than just some of Goddard’s stuff from his Real Science blog. Or just NASA GISS and NOAA NCDC. The provable changes to manufacture an increasingly strong warming bias are inferentionally explained by confirmation bias failing to correct at least two fundemental flaws in the homogenization algorithms. Those flaws are explained in the last footnote for the more technically inclined: Flawed regional expectations and flawed Menne stitching. That said, homogenization is necessary, but has to be done correctly. Why is also explained in the essay.
Rud Istvan January 24, 2015 at 1:59 pm “That said, homogenization is necessary, but has to be done correctly.”
Nonsense, if you have bad data, get good data, strive for it, invest in it. That is science, re-imagining the past is not.
Science should never be a rush to judgement based on flawed, incomplete or inaccurate data.
homogenization does not have to be done. it adds no information to the data. rather it smears and obscures the information.
the problem with the temperature record is the methodology. The methodology assumes that the temperature stations are fixed in place, and do not vary over time, but this is a false assumption. Thus, various corrections are necessary to adjust the data to make it appear the stations are fixed in place and invariant.
Added to the is the use of anomalies (long term averages) and daily averages, which removes the variability from the data and makes natural variability appear artificially low. This misleads the statistics into thinking natural variability is low.
A much better approach is to use sampling theory and absolute temperatures. In that way there is no need to adjust anything. You treat every temperature reading as a unique sample, without regard for the station. In that way it makes no difference if the station moves 1 mile or 1 meter. You are not measuring individual station, so why make so much of your methodology dependent on the behavior of the station?
Fred Berple:
” rather it smears and obscures the information”####
For me, this practice is the separator that sorts top drawers from bottom drawers.
They should expand it in spherical harmonics, and fit the data to a truncated series of harmonics. That way, a data point represents the data at that point, and doesn’t get smeared out over an entire grid cell.
Stephan and Rud, thank you both.
“They” changed the past to control the future?
They tried. Got caught. The memory thingy, just like Orson Wells’ 1984.
When Judith read When Data Isn’t ( I had asked her to critique, not guest post) her only feedback was, “Oh My!”.
Rud Istvan,
George Orwell?
Probably just a memory thingy… ☺
Yup. You are right, and I am wrong again. Confused the ‘Rosebud’ movie autor with the 1984 book author. Just happens when trying to kick back after two years writing a climate related book. TY for the correction. Hate when that happens, but like that it does. Much more efficient than peer review. Thanks again for the correction. I will try to do better.
Any time an alarmists ales a step towards the skeptical position , it’s a good thing. This was a small step but at least it was in the right direction 🙂
Jeff, I think this was a slip and a stumble. Nutticelo is too stupid to do it on purpose. Perhaps “ales” was the best word
All lies eventually lead to a contradiction which reveals the lie. The truth is without contradiction, which is what reveals it for the truth.
Bob, nice post. On your last chart, a better graphic woild be Akasofu’s, I believe from his 2009 paper. Same message in the context of a schematic illustrating recovery from the LIA. Paper basically said what you say in the post. Models run hot because tuned to a period of rising T at least partly caused by natural variation, of which ENSO is at least a part.
Yes, but not only in 2009:
See Climate, Free Full-Text, “On the Present Halting of Global Warming”, 3 May 2013. At http://www.mdpi.com/2225-1154/1/1/4
Also On the recovery from the Little Ice Age (Open Access, November 2010), at
http://www.scirp.org/journal/PaperInformation.aspx?PaperID=3217&JournalID=69
Also, Natural Components of Climate Change During the Last Few Hundred Years, at
http://people.iarc.uaf.edu/~sakasofu/pdf/Natural_Components_of_Climate_Change.pdf
(April 30, 2009. International Arctic Research Center, University of Alaska, Fairbanks)
You seem to be implying that this idiot’s opinion somehow matters and that his admission supports your cause. If you take at face value that he does not know what he is talking about (based on Dana’s past demonstration), then how does an affirmation from him suddenly carry weight? Why so we give him the credit of deserving a post?
Mark
Mark, Bob is calling attention to the SKS ‘kidz’ use of natural variation to explain the pause, and their refusal to see any natural variation component to the prior warming. Dana slipped up on the second part. Bob calling attention to it might get him expelled from the Kidz club. More likely, stay after school and write 100 times, Natural variation only cools and never warms. See repetition facilitates rote memory. Which is all he can rely on since logic fails. This will reinforce the Kidz tendency not to be logical.
The affirmation is important because of his (and others like him) audience. Truth is less important in the distribution of lay knowledge than the messaging process. The Guardian reaches a huge (lay) audience. It understands its power to drive an agenda, and its columnists are selected to drive the agenda and bring business to the model. And that lay audience votes, and empowers policy and politicians. Turning the manipulators publicly is always an own goal, regardless of the message.
Important is the magnetic activity of the sun. The specific activity definitely affects the circulation in middle and high latitudes. When activity is low there is a continuous exchange of air above the polar circle. Constant circulation can cause local climate change.
http://www.cpc.ncep.noaa.gov/products/precip/CWlink/blocking/real_time_nh/500gz_anomalies_nh.gif
“…natural variability can contribute to the long-term global surface warming trend…”
What is long term?
Climate is anything over 30 years. Stadium wave is 60 years, relevant for CMIP5 model tuning. IPCC has focused on 2100, so a century supposedly relevant for energy policy. MWP and LIA were a few centuries, relevant for human history. Interglacials run 10-15 millennia relevant for human transition from hunter-gatherer to agriculture. What is long term has no answer without revealing the hidden context behind the purpose of the question. Yours was?
Rud Istvan January 24, 2015 at 2:07 pm
Climate is anything over 30 years.
———————-
Says who?
The Earth is billions of years old.Thirty years is meaningless in the whole scope of things.
Yup, true. But the official NOAA/WMO distinction between weather and climate is a shift in some parameter (mean, median, mode, 1 or 2 sigma extremes [make up your own, since they do]) over a period of at least 30 years. Didn’t say was right. Only offered the ‘official’ definition. Peace.
This! Thanks Bob.
The models align with a naturally occurring upswing in surface temperatures and the modelers have failed to consider the future multidecadal variations in their projections
They even have failed to consider the past multidecadal variations since beginning of holocene.
Their view only reaches back until a convenient, self-determined point at the industrial revolution to show a warming trend, just like in your Figure 3.
That’s the main crux!
The models do not even see the cooling trend of ~ -0.3°C since holocene begun.
As Bob Tisdale’s graph shows ( dbstealey comment at 10:05) the climate models are built without regard to the natural 60 and even more important 1000 year periodicities so obvious in the temperature record. The modelers approach is simply a scientific disaster and lacks even average commonsense .It is exactly like taking the temperature trend from say Feb – July and projecting it ahead linearly for 20 years or so. They back tune their models for less than 100 years when the relevant time scale is millennial. The whole exercise is a joke.
The entire UNFCCC -IPCC circus is a total farce- based, as it is, on the CAGW scenarios of the IPCC models which do not have even heuristic value. The earth is entering a cooling trend which will possibly last for 600 years or so.
For estimates of the timing and extent of the coming cooling based on the natural 60 and 1000 year periodicities in the temperature data and using the 10Be and neutron monitor data as the most useful proxy for solar “activity” check the series of posts at
http://climatesense-norpag.blogspot.com
The post at
http://climatesense-norpag.blogspot.com/2014/07/climate-forecasting-methods-and-cooling.html
is a good place to start. One of the first things impressed upon me in tutorials as an undergraduate in Geology at Oxford was the importance of considering multiple working hypotheses when dealing with scientific problems. With regard to climate this would be a proper use of the precautionary principle .-
The worst scientific error of the alarmist climate establishment is their unshakeable faith in their meaningless model outputs and their refusal to estimate the possible impacts of a cooling rather than a warming world and then consider what strategies might best be used in adapting to the eventuality that cooling actually develops.
(Dr. Page)
The worst scientific error of the alarmist climate establishment is their unshakeable faith in their meaningless model outputs and their refusal to estimate the possible impacts of a cooling rather than a warming world and then consider what strategies might best be used in adapting to the eventuality that cooling actually develops.
Well put.
I think that it was worth noting what Dana Nuccitelli wrote, and I am glad that Bob Tisdale noted it and wrote this comment.
“The paper presents the results of the analysis of changes in sea surface temperature (SST) of the sea area extending to NW from the northern part of the Antarctic Peninsula in the years 1900-2012. Three periods of SST changes were noted: – period covering years 1900-1932 with relatively stable behaviour of the SST (zero trend, a small inter-annual variability, low average annual SST – ~ 0.3°C), – period covering years 1932-2000 with an increase in inter-annual variability of SST and a gradual three-phase increase in SST (trend 0.006 (± 0.001)°C•yr-1, the total increase in annual SST of 0.7 degrees (up to ~ 1°C). The highest average value of the SST was noted in 2000. – period covering years 2000-2012 – a period of rapid drop in SST (trend –0.048 (± 0.010)°C•yr-1, SST decrease of ~ 1 degree). The analysis of monthly trends shows that the changes in SST are the result of advection of water resources with different heat carried from the west by the Antarctic Circumpolar Current. Changes in SST in the analyzed sea area in the last period are not connected with changes in macro-scale atmospheric circulation (SAM Southern Annular Mode, Antarctic Oscillation). The described changes in the SST occurring in 2000-2012 may lead to changes in the trend of temperature changes at the stations on the west coast of the Antarctic Peninsula.”
http://yadda.icm.edu.pl/baztech/element/bwmeta1.element.baztech-765ea956-af53-45fa-874a-494c4c46b8e3
http://www.nature-education.org/cart/current-antarctic-circumpolar.jpg
BobTisdale
http://www.biomedcentral.com/1471-2148/10/203/figure/F1?highres=y
“I was somewhat amazed by Dana’s admission that stronger and longer El Niño events can enhance global warming.”
He didn’t say that. He made the simple and uncontroversial observation that temperature rise increased at a time when there was a predominance of El Nino, and slowed when there was a predominance of La Nina. Nothing said about cause. Of course El Nino’s are an indicator of warmth.
And why surprising? You said, two months ago
“The second thing to note about the article is that, while it goes unsaid, it’s blatantly obvious that Timmermann and Trenberth are noting that the annual, decadal, and multidecadal processes taking place in the Pacific can enhance global warming (cause global warming) or suppress it (stop it).”
Again, it’s not unstated, it just isn’t stated in your terms. ENSO, PDO, IPO etc aren’t said to enhance, suppress etc. They are just part of the sum of things that go into temperature trends. Timmermenn said
“Timmermann is very clear about what this means for global warming. “Over the last 15 years or so – the period of the global warming hiatus – the Pacific has been anomalously cold and there has been a very strong negative IPO,” explained Timmermann. “This has now stopped. The negative IPO has stopped. This is the same as saying the global warming hiatus has stopped.””
He prefers to describe in terms of IPO. As Wiki says
“Shifts in the IPO change the location and strength of ENSO activity.”
Nick, with respect to your second paragraph, if you will refer to 2014 WMO temp/Enso chart, earlier version posted by someone else upthread, you will also see that what you claim Dana said is reasonable is also simply not true.
Oh no, Nick, Dana was quite clear about what he meant: the warming during the nineties was due to natural causes.
You see, Nick, Dana is having some doubts about AGW.
Nick Stokes Says:
“He didn’t say that. He made the simple and uncontroversial observation that temperature rise increased at a time when there was a predominance of El Nino, and slowed when there was a predominance of La Nina. Nothing said about cause. Of course El Nino’s are an indicator of warmth.”
There will be Global Cooling as per this article http://www.cbsnews.com/news/climate-change-expected-to-bring-more-extreme-la-ninas/ because the incidence of La Nina will increase due to Global Warming !
No, what they say is:
“Three-quarters of those increased La Nina events would follow extreme El Nino events “thus projecting more frequent swings between opposite extremes from year to the next.””
So the models which can’t predict El Nino are predicting how often La Nina, and El Nino followed by La Nina, will happen? Odd.
The alarmists are denying so much contrary evidence they trip over sometimes and forget what they are supposed to believe.
Figure 3 (the modellers mistake) is a keeper. Neatly illustrates why I (a mere technician) knew this AGW stuff was bunk 15 years ago. My process modelling showed that conscious human activities such as construction occurs in cycles. So how the hell could climate processes not be the same?
Bob Tisdale wrote: “So we have two natural modes of multidecadal variability that enhanced global surface warming from the mid-1970s to the turn of the century.”
Two? I suppose that would be the case if ENSO and AMO were independent of each other, but it seems more likely that both are part of a more general cycle, i.e., the “stadium wave”.
Thanks, Bob.
I think the GCMs mainly see the Earth globally and discount too many local phenomena. Mainly it is to facilitate the calculations?
Whatever the reason, they do a poor job of modeling our climate, specially when natural causes are adding to the recovery from the Little Ice Age.
Andres, some of the GCM model pronlems and limitations are illustrated in essay Models all the way Down in ebook Blowing Smoke. Elevation is important for things like precipitation and advection. The main UK GCM is completely missing the Andes mountains. Seems incredible, but true. The devil is, as you rightly intuit, in the local details. Regards.
Great post Bob! You have completely destroyed the alarmist anthem that says that:
“….if its warming it must be caused by human CO2 emissions, if its cooling it must be caused by natural cycles…”
However, I have one point of difference. You said:
“At this point in the post I would normally go into a discussion of ENSO acting as a chaotic, naturally occurring, sunlight-fueled, recharge-discharge oscillator.”
The problem is that the ENSO is not chaotic – Strong El Nino events are in fact triggered by the lunar tides.
Please see:
http://astroclimateconnection.blogspot.com.au/2015/01/the-el-ninos-during-new-moon-epoch-5.html
http://astroclimateconnection.blogspot.com.au/2014/11/evidence-that-strong-el-nino-events-are_13.html
And watch this space for more definitive evidence supporting this assertion.
Chaotic processes have sources and sinks, even known sources such as a large mass in proximity. Chaotic process are incompletely or insufficiently characterized and unwieldy. Chaos implies that we cannot predict and our skill to forecast is constrained to an indefinite frame of time and space (i.e. an envelope). However, within this frame, we can apply statistical methods to forecast a behavior with accuracy inversely proportionate to the product of time and space offsets from an established frame of reference — the scientific domain.
n.n. said:
“..we can apply statistical methods to forecast a behavior with accuracy inversely proportionate to the product of time and space offsets from an established frame of reference.”
I think that you need to be much more specific about the size of the time and space offsets before you erroneously declare that the ENSO system is mostly chaotic.
When the 4th report came out they claimed natural had been overwhelmed by manmade forcing!
Of course by now everyone should realise that such claims should be taken with a grain of salt and a bottle of tequila while conferencing at the taxpayers expense in a tropical country!
Hmm – your sine wave graph doesn’t show any warming trend, some people claim there has been a slow warming trend since the LIA.
The present situation is interesting, by the sine wave theory we should have been into noticeable cooling by now. A slow rise trend would delay that a bit. But there may be other factors – if they have different periodicity they would counter-act or reinforce each other at different times.
Keith, see my Akasofu graphic comment to Bob upthread. Not some people claim. We have been warming since the LIA. Proof: no London Thames Ice Fairs for about 200 years now. But that gets into TonyB (Climate Reason) climate history turf. Go check his writings out rather than take my word for it.
Or read essays cAGw and Unsettling Science in ebook Blowing Smoke, which make the same points illustrated by TonyB and Akasofu stuff.
The graph is showing the warm/cool trends, and how they fit into the timeline. Also, note what is stated on the left margin of the graph.
My take on looking at that graph is the cooling will become apparent by the year 2020, perhaps several years earlier.
Keith Sketchley says: “Hmm – your sine wave graph doesn’t show any warming trend, some people claim there has been a slow warming trend since the LIA.”
Of course it doesn’t show a trend. It’s a sine wave. I presented a sine wave simply as an example.
Keith Sketchley says: “The present situation is interesting, by the sine wave theory we should have been into noticeable cooling by now.”
I haven’t present a “sine wave theory”. I’ve simply presented an example.
I dont even know why there is a even a post/comment about Nuttercelli here, Complete waste of time on a dingbat LOL
I’m baffled as to why anybody would be interested in what cranks such as Nuccitelli think. If they do get something right, that is most likely by chance anyway.
Bob Tisdale:
Figure 3 illustrates a sine wave with a 60-year frequency. That will represent our data. It is arbitrarily scaled…in other words, it is not scaled to surface temperatures …
====================================================
It was looking a bit like that temperature-wise until Messrs. Hansen et al. got to work:
http://hidethedecline.eu/media/Northern%20hemisphere%20temperatures/NHNatGeo76small.jpg
http://hidethedecline.eu/media/Northern%20hemisphere%20temperatures/NHNatGeo76small.jpg
Bob, you have done another cracker of a posting. The graph of the sine wave with a trend extrapolated from one of its upward segments is a keeper.
If you do in fact keep it, you’ll need to quietly get rid of the “Not Scaled to Surface Temperature” label on the y axis that gives away that it is unscientific bullshit. You needn’t be told this, but do not under any circumstances overlay the temperature record or model hindcasts for the time period 1880-1970 or it will reveal “Bob’s Trick”.
And what is “Bob’s Trick”?
Dr Spencer made a similar argument here: http://www.drroyspencer.com/2014/11/a-busted-el-nino-and-the-new-weather-norm/ including a simple model that allowed quantitative analysis of the magnitude effect of AMO and PDO cycles. One of his main conclusions, that CO2 isn’t a major factor in recent warming, is flawed because one can’t properly make statements about attribution to something that isn’t included in the model.
A proper and rigorous argument could be made using the parameters one believes are important and and the particular parameter one wishes to claim is not important and determining the model coefficients for a best fit to observations. This could be done, for instance, by extending the Foster & Rahmstorf model to include AMO and PDO cycles.
Do this and you would have something that would be taken seriously by those who are not inclined to your point of view. The problem is that a rigorous analysis probably doesn’t support the implication of the figure, that is, that AMO is a dominant factor in recent warming. The other problem is that a hypothesis of ocean cycles dominating recent warming is inconsistent with top of atmosphere energy balance and ocean heat content observations.
Monckton I agree that graph illustrates exactly what I have been saying for a long time on posts and comments on various threads.
“As Bob Tisdale’s graph shows ( dbstealey comment at 10:05) the climate models are built without regard to the natural 60 and even more important 1000 year periodicities so obvious in the temperature record. The modelers approach is simply a scientific disaster and lacks even average commonsense .It is exactly like taking the temperature trend from say Feb – July and projecting it ahead linearly for 20 years or so. They back tune their models for less than 100 years when the relevant time scale is millennial. The whole exercise is a joke.
The entire UNFCCC -IPCC circus is a total farce- based, as it is, on the CAGW scenarios of the IPCC models which do not have even heuristic value. The earth is entering a cooling trend which will possibly last for 600 years or so.
For estimates of the timing and extent of the coming cooling based on the natural 60 and 1000 year periodicities in the temperature data and using the 10Be and neutron monitor data as the most useful proxy for solar “activity” check the series of posts at
http://climatesense-norpag.blogspot.com
and esp at
http://climatesense-norpag.blogspot.com/2014/07/climate-forecasting-methods-and-cooling.html
Here’s an admission by Michael Mann that the MWP was as warm as now!
“It is exceptionally unlikely that we would be seeing a record year, during a record warming decade, during a multi-decadal period of warmth that appears to be unrivaled over at least the past millennium if it were not for the rising of planet-warming gases produced by fossil fuel burning.”
http://apnews.myway.com/article/20150116/us-sci–hottest_year-b64ea00652.html
Mann’s statement is a convoluted hedge that reflects his growing doubts of AGW. The castle walls are trembling under the blows of skeptical science.
@mpainter, let’s just call it science.
In an open system C02 cannot be shown to have any warming effect or what it ‘ought’ to do.
Dana can only go so far with any new acknowledgements for fear of contradicting the alarmists’ fable so long and often parroted by the David Appell type activists.
“Natural causes cannot explain the warming”.
Appell, “Models are only one leg of the AGW argument. There are physical measurements of an enhanced greenhouse effect. There is the nearly unprecedented rate of change in features such as sea level rise, sea ice melt, and glacial melt. And there is the fact that no other known cause could be causing this much warming, especially in the oceans.”
I’m sure he has already somewhere but I’d like to see Bob’s critique of the mind numbing claim by climate scientists that they have had enough science to rule out natural causes.
I’ve long believed that to be one of the most mendaciously invented assertions by the AGW Team.
And that it was destined to come back and bite them big time.
highflight56433
January 24, 2015 at 11:43 am
How can any chaotic system be linear? Cough …sputter…
Sputter..cough…it can’t. However that hasn’t stopped the scam yet.
Just some thoughts below. No statements.
We all know temperatures drive CO2 variances, so.
I make it 57 years, not 60.
http://woodfortrees.org/plot/esrl-co2/window/fourier/magnitude/from:12/to:57
And 669 years for the low frequency climb rate of CO2 as taken as a full wave sine.
335 half wave and 167.5 year quarter wave. Doesn’t fit anything paleo to me.
Derivatives on CO2 vs temperature does indeed prove Temperature drives CO2 variances. No question.
http://woodfortrees.org/plot/esrl-co2/isolate:60/mean:12/scale:0.2/plot/hadcrut3vgl/isolate:60/mean:12/from:1958
Thoughts welcome 🙂
Andyj,
Make the scale factor 0.26 in the second link. Easier to see the cause and effect.
AAH! Apologies. Ignore the “669” garbage.
Dana is now telling us that:
“the economies of rich countries continue to grow well in a warmer world”
http://www.theguardian.com/environment/climate-consensus-97-per-cent/2015/jan/26/climate-change-could-impact-poor-much-more-than-previously-thought
While overlooking that putting a price on “carbon pollution” would make poor nations even poorer.