Guest Post by Willis Eschenbach
Inspired by a random comment by Steve McIntyre over at his marvelous blog Climate Audit, I got to thinking about the ice ages. I’ve long heard that the ice ages are caused by the changes in summer insolation in the northern hemisphere. As the story goes, the Milankovitch cycles of variations in the earths orbit make it so that there is a variation in how strong the summer sun is in the northern hemisphere. When the summer sun is weaker, the ice sheets advance, and eventually the buildup of ice reflects enough solar energy to spiral us into the icebox. Then about every hundred thousand years, the sun gets stronger again, and melts away the ice, and within a few thousand years the great ice sheets melt away and we’re out of the icebox.
So of course, once I’ve had that thought, I was doomed, and so I had to take a look. I got the data, and here is the variation in average northern hemisphere insolation for the months of June, July, and August.
 Figure 1. Average insolation during the summer months (J-J-A) at 40° north latitude. DATA SOURCE: NOAA
Now, I found that surprising. I hadn’t realized the size of the swings. The cycles are about 21,000 years long and the swings are quite large, up to 100 W/m2 from trough to peak. So IF the temperature is following the forcing as the current hypothesis claims, a swing of 100 W/m2 is certainly large enough to cause a very large swing in temperatures. The current hypothesis is that at equilibrium we should see a swing of ~3°C for each additional 3.7W/m2 of forcing. However, we’re talking annual swings. Transient climate sensitivity is about 70% of equilibrium sensitivity, so I’ll use 50% to give some cushion. So according to the current thinking, a swing of an additional 100 W/m2 which is maintained for a thousand years should result in an increased annual temperature swing of about 40°C (73°F) … and we don’t see anything in the geological records even half that size.
I also didn’t realize that there is an underlying ~400,000 year cycle, which leads to the larger peaks at about 200,000 and 600,000 years before present (BP), and also leads to the very, very small peak at about 400,000 years BP.
But obviously we don’t see such a swing in geological temperatures. In fact, we don’t see anything even near that. So, scratching my head, I went and got the longest temperature record we have. This is the record from the ice cores at the EPICA dome in Antarctica. Figure 2 shows that record:
 Figure 2. Antarctic temperature variations estimated from deuterium data. DATA SOURCE: NOAA
Here, we can see the ~ 100,000 year cyclical nature of the emergence from the ice ages. The swing is generally on the order of about 12°C, and the usual estimate is that because the poles swing more than the tropics, the global swing is half the Antarctic swing, or about 6°C. We can also see that the current interglacial period, the “Holocene”, has lasted quite a while compared to the other interglacials.
Note also the very large and roughly symmetrical peak at about 400,000 years.
So … how does this relate to the Milankovitch cycles? Figure 3 shows the temperature overlaid over the Milankovitch cycles.
 Figure 3. Antarctic temperature variations estimated from deuterium data, overlaid on the Milankovitch insolation cycles.
I gotta say I’m just not seeing it. The biggest oddity is that around 400,000 years, the very small insolation peak is correlated with a very large temperature peak. In addition, in general there seems to be very little correlation between the swings in insolation and the swings in temperature. Finally, the most interesting thing is the total lack of any 21,000 year cycle in the temperature.
Now, some authorities say that the crucial factor is not the insolation at 40°N, but the insolation at 60°N. So I checked that … but the difference in the pattern is only trivial. It mainly just affects the size of the swings, which are somewhat smaller at 60°N, but the pattern of large and small swings is essentially unchanged.
Now as might be imagined, I’m not the first one to be puzzled by this. It’s widespread enough that there’s a Wikipedia page entitled “The 100,000-year problem”, which points out that:
The 100,000 year problem is a discrepancy between past temperatures and the amount of incoming solar radiation, or insolation. The latter rises and falls according to the strength of radiation given off by the sun, the distance from the earth to the sun, and the tilt of the Earth’s axis of rotation. However, the recent change between glacial and inter-glacial states that occurs on a circa 100,000 year (100 ka) timescale, does not correlate well with these factors.
Due to variations in the Earth’s orbit, the amount of insolation varies with periods of around 21,000, 40,000, 100,000, and 400,000 years. Variations in the amount of incident solar energy drive changes in the climate of the Earth, and are recognised as a key factor in the timing of initiation and termination of glaciations. Isotope analysis shows the dominant periodicity of the climate response to be around 100,000 years, but the orbital forcing at this period is small.
However, my perplexity seems to be for a different reason than the other folks discussing this, which is that the really large insolation swings occur on a 21,000 year cycle, and there’s no trace of that in the EPICA data. I’m not so much interested in the existence of the 100,000-year cycles in the temperatures, as I am by the lack of any temperature response to the ~100 W/m2 swing in the insolation. Yes, I know that overall for the globe as a whole the swing is small because the hemispheric changes oppose each other, but for each hemisphere the changes are very large. Why do we see no trace of those very large swings?
Anyhow, all comments welcome.
Best wishes to all. It’s one AM, there was a new moon earlier tonight, I’m going outside for some stargazing, and I wish the same level of joy and awe to all of you.
w.
As is my custom, I ask that if you disagree with someone, please QUOTE THE EXACT WORDS YOU DISAGREE WITH so that we can all understand the exact nature of your objection.
–Now, some authorities say that the crucial factor is not the insolation at 40°N, but the insolation at 60°N. So I checked that … but the difference in the pattern is only trivial. It mainly just affects the size of the swings, which are somewhat smaller at 60°N, but the pattern of large and small swings is essentially unchanged.–
I would think max insolation at 30°S would result in most warming.
I have also puzzled over the rather blase acceptance of Milankovitch cycles as the cause of ice ages when the data doesn’t seem to correlate particularly well.
Actually I think you’ll find it took a while for the theory to be accepted, so I wouldn’t say it was blasé at all!
Even back in the late 1800s, people were musing on the Earth’s orbit as a cause of ice ages: “The Cause of an Ice Age”, 1891, by Sir Robert Ball, Royal Astronomer of Ireland.
My belief is that the ice core records are the problem….with all the possible corruptions of migration of gases, contamination in processing and unknown climate factors, the ice core record is an unreliable source for much of anything, except perhaps snowcones
Because the resolution on ice core analysis is likely tens to 100’s of decades cross contamination, which does exist, is somewhat homogenized. Leading to an “error” determination with each measurement. These “errors” are most commonly shown as error bars which are, at least for true scientific data presentation, necessary for correct data evaluations. Just because the data has some issues with resolution does not automatically make the data set unreliable. I just means that care and caution is necessary when using those data sets for conclusions.
latecommer, the temperature record in ice cores is not from the gas bubbles, but from the D/H ratio and 18O/16O ratio in the water molecules of the ice itself: the heavy isotopes relative increase with increasing ocean temperatures, which make it possible to estimate the ocean temperatures at the time of deposit. The resolution depends of the snow deposit and its ice equivalent over time, from yearly for coastal ice cores (which catch areas are the nearby oceans) to decades for inland ice cores where deposit is only a few mm ice equivalent per year but the catch area is the whole SH oceans. The yearly ice layers get thinner with depth and ice flow.
Gas migration in the Antarctic ice cores is very small for the relative “warm” coastal cores and immeasurable for the much colder inland ice cores.
So what happened to the idea that atoms and molecules were pretty stable things, when left to themselves.
So if I’m a water molecule, I could be a HH16O, or a HH18O, or HD16O, or a HD18O, or a DD16O, or a DD18O, and maybe once in a while have a T in there; who knows.
So what is it about the Temperature of the ocean that changes a D to an H or verse vicea, or switches an 18O for a 16O atom ??
I suppose each of those species has its own unique boiling / evaporating / subliming Temperature ??
But what about their relative abundance in the ocean water itself, as a function of say water depth.
Would the DD18O molecules sink deeper than the HH16O molecules; or just how “well mixed are all the water species around the world ? Is the South Atlantic the same as the South Pacific or the South Indian Ocean as regards abundance of the various water species, because they slosh back and forth around the Horn, and around Africa twice a day, in all kinds of weather.
So I guess there is a computer teramodel of Antarctic Plateau snow versus southern ocean weather somewhere that says what ocean temperature goes along with what snow species ??
How do you do an experiment to connect Plateau snow with a specific measure ocean Temperature that supposedly sourced that snow ??
Latecommer, In addition to Ferdinands remark, the isotopes in the Antarctic ice cores are matched closely by the foraminifera isotopes in oceanic cores. ie the LR04 benthic stack http://www.lorraine-lisiecki.com/stack.html which is assumed (but not by me) to represent ice volume. Obiously the more ice with “light” isotopes on the continents, the more “heavier” the water that stays behind in de oceans (reservoir effect).
There is a world of discussions behind this.
George,
The idea behind the isotopes used as temperature “proxy” is that the evaporation speed is different: at a certain temperature the lighter molecules escape faster from the liquid than the heavier one’s in moister undersaturated air. That is measured in laboratories and in the field, not only for water but for isotopes from all kinds of molecules at evaporation, condensation, sublimation and freezing.
That makes that water vapor is “lighter” in composition than water itself. The difference gets smaller at higher temperatures. The same where vapor freezes directly into snow/ice crystals. I don’t remember which way that goes, but anyway there is an isotope shift too. Thus by measuring the ratio between the isotopes in the ice one can have an idea of the temperature at evaporation.
Similar things happen with CO2 when it escapes from the oceans and goes back into the oceans (pure a matter of physical differences, not biological as in plants).
It seems that the isotopic composition of seawater in general is rather uniform on “short” periods of hundreds of years, but changes with the formation of ice sheets, as ice sheets water is “lighter” and leave the oceans with more heavier isotopes. There are some tricks from which they estimate the volume growth and melt of the ice sheets, out of the 18O/16O ratio in N2O.
There was some discussion in the scientific world about the translation into “temperature” from the double isotope fractionation (evaporation/freezing), but that seems rather quiet these days…
http://onlinelibrary.wiley.com/enhanced/doi/10.1029/2002JD002677/
http://onlinelibrary.wiley.com/doi/10.1029/2009JD012054/pdf
http://onlinelibrary.wiley.com/doi/10.1029/90JD02232/abstract
“Like” I’m not fond of proxies of any kind.
There’s that old joke about the idiot scheduled for the guillotine; who has elected to meet his maker in the “eyes up” position, instead of the chicken “nose to the ground” pose.
When the blade fails to drop twice in a row; our hero says to the executioner:
Hang on a minute; I think I can see the glitch that is jamming the works up there !
So I think I see the glitch; not in Willis report, but in the concept itself.
Willis will correct me, if I’m wrong (often am) but I believe that the Milankovitch cyclic graph that willis posts (the red amplitude modulated carrier) in Fig. 1 is simply calculated from orbital dynamics parameters, relating to the polar precession, and the orbit eccentricity, and other fairly Newtonian (or Einsteinian) gravitational theory.
That’s why it is such a pretty graph compared to the blue ice core graph.
So since when did Newtonian Orbital dynamics know anything at all about CLOUDS !! ??
Mother Gaia, pays no attention to Newton or Einstein when she sets the Temperature on earth.
She looks up at the clouds, holds her finger (not the middle one) up to test the wind, collapses her Brolly to check for rain, and a whole bunch of other stuff going on everywhere that has nothing to do with why tops spin.
So more Milankovitchinsolation, more evaporation; more CLOUDS, less SURFACEINSOLATION; lessevaporationmoreprecipitation; less CLOUDS, and more surfaceinsolation.
So nyet on Milankovitchinsolation driving ice ages; but not to deny some effect on their occurrences.
Mother Gaia decides when to have ice ages.
G
The climate modellers have long recognized that the Milankovitch cycles can not produce ice ages without strong feedbacks. I think that is actually what first led to the idea of positive climate feedbacks, long before global warming became a concern.
Can someone also answer the question of how stable the wobble and tilt is. If a small piece of bubble gum stuck to the side of a child’s toy top, can make it wobble out of control. What would giga tonnes of ice do to a spinning globe? The vast ice sheets unevenly arranged around the globe during the glacial times has no effect on the size of the wobble?
Mike M,
strong positive feedbacks quickly lead to nonlinearities. Non linearities in dynamical systems lead to unpredictable, but certain bifurcations to new attractors. The system is not calculable, but given the money the modellers try anyway.
Ice ages happen when the frost giants get too powerful. If Thor does not slap them down in time, they can cause real trouble. Of course, if Loki decides to lead them, we will face Fimbulvinter, and then Ragnarök.
We really will be doomed.
I have to say that I have never been sold on the MCs. It doesn’t make sense. Also, I remember reading that the ice age cycle changed from 40.000 to 100.000 a million or two years ago. How coud that happen if the ice ages were down to MCs.
However, this is good work WE. Thanks.
Nor was I, as I have commented on previous posts. Willis shows well enough that claims concerning the M-cycle do not hold up under close inspection. It is just more of that cosmic arm-waving that some people love to do in regards to climate.
I got a better answer, using a composite signal given by all members astronomical, place an article of Solar Activity in which I explain the whole thing.
is in Italian but the graphics and all.
greetings Luigi
http://www.attivitasolare.com/la-fine-del-mondo-lavori-corso/
translated:
https://translate.google.com/translate?sl=auto&tl=en&js=y&prev=_t&hl=en&ie=UTF-8&u=http%3A%2F%2Fwww.attivitasolare.com%2Fla-fine-del-mondo-lavori-corso%2F&edit-text=
Nicely done! I am surprised that no one has commented on your paper. The simple mindedness of the AGW crowd and their inability/refusal to incorporate ALL known variations of FORCINGS is ridiculous. The acceptance of their limited climate models by the consensus is mind boggling. To them, purely from a political/ideological perspective, current temperature changes are all due to changes in carbon-dioxide levels. The reality of earth climate is incredibly complicated.
Someday governments may fund truly comprehensive research to create a “Unified Theory” of climate forcings that can explain the actual historical record and predict future conditions. That would be of benefit to mankind. The current funding of the climate science community is a complete waste.
Stimato Luigi:
Molto apprezza il vostro articolo. Molto interessante.
Saluti da Uruguay
Great work Luigi, excellently visible. I just got an idea from looking to your graphs. Periods of cooling earth were represented with increasing dust content. I have read that around 30% of dust collection in household is of extraterrestrial origin. What if dust is not result but reason? Simply space dust obscuring sun and decreasing insolation. This could be nicely tied to orbital mechanics where apsidal precession together with orbit inclination can put outer planets to more dense region of space. And send stream of dust towards center of solar system. This would also nicely explain 4000 years shift between insolation and its effect on Earth. 4000y should represent actual time for dust to reach Earth. Actually period of apsidal precession for Mars is 79606 years, which rings a bell with 41k glacial period and period for Jupiter is 197862 years which rings a bell with 100k year period. Jupiter and Mars are shepherding main asteroid belt what could cause regular dust mass sending towards inner solar system affecting Earth. Such dust can be trapped in Earth L1 obscuring solar flow to Earth mainly during perihelion.
Nir Shaviv has a paper on this very subject:
Is the Solar System’s Galactic Motion Imprinted in the Phanerozoic Climate?
A new δ18O Phanerozoic database, based on 24,000 low-Mg calcitic fossil shells, yields a prominent 32 Ma oscillation with a secondary 175 Ma frequency modulation. The periodicities and phases of these oscillations are consistent with parameters postulated for the vertical motion of the solar system across the galactic plane, modulated by the radial epicyclic motion. We propose therefore that the galactic motion left an imprint on the terrestrial climate record. Based on its vertical motion, the effective average galactic density encountered by the solar system is . This suggests the presence of a disk dark matter component.
current hypothesis is that we should see a swing of ~3°C for each additional 3.7W/m2.
I don;t think this is correct. A 1% swing gives 0.5C swing in temperature.
Leif, the IPCC says that for each additional 3.7 W/m2 of forcing the temperature should increase by 3°C. Whether you or I think it’s correct is immaterial, as it is the current “consensus”.
My best to you,
w.
Not sure I understand this, Doc. A 1% variation would be ~17 wpm^2, right?
3.7w/m2 is the global change globally at TOA. That is not the same as change of insolation on the surface.
??? Is a watt somehow different now? The entire CAGW religion is based on a calculated average net on a mythical flat earth forcing due to increased CO2 absorption and re-radiation for a 3.7 watts increase at the surface based on a assumed LW and short wave IR radiation balance.
in reply to evanjones
see
http://www-paoc.mit.edu/labweb/notes/Lecture_4.pdf or
http://jennifermarohasy.com/2009/03/radical-new-hypothesis-on-the-effect-of-greenhouse-gases/
and plug in a few numbers to get numerical values. A blocking of 3.7 watts will result in a surface increase of 3.7 watts.
3.7 Watts/meter squared on the Petri Dish; on the Earth’s surface, Gaia only knows.
===========
Willis wrote: “the IPCC says that for each additional 3.7 W/m2 of forcing the temperature should increase by 3°C”.
I think that should be 14.8 W/m2 to be in the same units as Figures 1 and 3. The 3.7 value is per square meter of the Earth’s total surface area. But it says in the readme file associated with the data http://www1.ncdc.noaa.gov/pub/data/paleo/climate_forcing/orbital_variations/berger_insolation/readme_insolation.txt
that the solar constant is 1360 W/m2, which is per square meter perpendicular to the beam. With the first units the area of the earth is pi*R^2, with the second it is 4*pi*R^2.
Just simply estimating from the table at http://climatewiki.org/wiki/Category:Essential_Physics#Stefan-Boltzmann_law of power versus temperature between our mean orbital gray body temperature of about 279K corresponding to about 343 W%m^2 adding about 100 W%m^2 gets us up to about 297K , a difference of about 18K , not 80 . Changes in our spectrum due to additional CO2 are going to be inconsequential compared to that .
Dr. Svalgaard, you once linked a paper that concluded that Earth may be in the midst of a natural super-interglacial because of low eccentricity. I can’t find it now. You still remember the title to that paper?
Willis writes “I gotta say I’m just not seeing it.”
Its the typical “we got nuthin else” explanation that science uses…and then over time the shaky theory (based on comparisons to the actual data as you’ve done) takes on life of its own and becomes embedded in the psyche.
Pretty much everyone thinks that milankovich cycles are responsible for ice ages and there’s little room for scepticism because well see point one…”we got nothin else”
Note that the big upward and downward swings have a lot of minor jig-jags that “appear to” coincide roughly with Precession.
“Its the typical “we got nuthin else” explanation that science uses”
Exactly, like the “global temperature” nonsense.
I recommend this series of posts at SoD:
http://scienceofdoom.com/roadmap/ghosts-of-climates-past/
Dang, I do like SoD. I’ll have to look at these tomorrow.
Many thanks,
w.
I like Science of Doom also. He summarises the effect of Milankovitch cycles as below :-
http://scienceofdoom.com/2014/01/07/ghosts-of-climates-past-pop-quiz-end-of-an-ice-age/
One interesting result is that the natural variabillity is substantial, appr. 12 oK at 90o, 6 oK appr. global and my assumption in the tropics no more than 1 oK. How do we know where we are now? Are we in longterm downtrend naturally?
Oh that was painful. First of all, Kelvins are a unit. There are no degree symbols used, just K. If you want to write a degree symbol as in °C or °F, on Windows use alt-248. OK?
Err! Stubid eer, What is alt-248.please?
Hold down the Alt key, type 248 (or Alt 0176) on the numeric keypad, and you get the degree symbol. Unfortunately many of us using laptops from time to time don’t have a numeric keypad. The generally accepted way is ampersand deg semicolon, or ° to get °
Maybe (146°F?)
Other than that. I share your doubts. Maybe Milankovitch cycles plus something else? What else? I have no idea.
Subjective observation: I live near 45N — well within the glaciated zone during the last ice age. But by March 21st when the midday sun is 45 degrees above the horizon, snow and ice melt pretty quickly. It’s only around December 21st when the maximum sun is down around 22 degrees that ice and snow hang around for long periods of time. So what sort of climate could allow ice to accumulate here and not melt in Summer? Cloudy, wet and quite cold, I imagine. But it’s hard to envision.
Thanks, Don, I fixed the C for F confusion. My motto is, “Perfect is good enough” …
w.
Willis
As Socrates would say: “Examine your assumptions”
On that scale of time, Antarctica has not remained fixed and has not been a separate continent for most of that time.
When the Drake Passage opened some 21 million years ago, the circumpolar current thermally isolated Antarctica until it froze over with the huge ice cap we see today.
Willis talks about the last 800 000 years, not 80 000 000 years.
John A – I think you’re missing the timescales involved by an order of magnitude.
Thanks, John. As Socrates would say: “Examine your timescales”. The graphs above go back 800,000 years. On that scale of time Antarctica has been a separate continent for the entire time.
Regards,
w.
What is the thermal time constant of the earth? What sort of order of magnitude is it?
The thing I notice is that higher temperatures seem to weakly correlate with the largest swings while the coldest temperatures seem to correlate with periods that have smaller swings.
Perhaps there’s a threshold of insolation that must be crossed to begin the process of ice sheet recession.
The periods of smaller swings also correspond to periods of lower eccentricity. Again, if there’s some threshold that must be crossed to push back the ice sheets, then orbits with the greatest eccentricity have perihelions most likely to provide an insolation great enough to cross some threshold.
There’s one more thing that’s bothered me a bit concerning insolation calculations involving eccentricity. Perhaps it doesn’t matter much, but most calculations assume a simple square relation between distance and insolation and treat the earth simply as a disk. This isn’t quite right, though.
The sun being so much larger than the earth and the earth being a sphere actually provides the earth with slightly more energy as the earth comes nearer the sun than would be expected by applying the square law.
This can be observed by imagining the earth very near the surface of the sun and observing that more than half the earth’s surface receives the sun’s rays.
Whether this makes much of a difference I can’t say. It probably doesn’t. Still I’d like to see things worked out in more detail.
Of course the inverse square law is for a point source. For a line source it is inverse linear and for a large area source it is no change with distance. To the extent that the sun is a little area source, the law is less than inverse square but more than inverse linear.
Well not so fast; a finite sized isotropic source produces an irradiance that differs by about half of one percent, from a point source at a distance that is ten times the diameter of the finite source, and beyond that the difference from 1 /r^2 is negligible.
For a Lambertian disk source, the same result occurs, but the irradiance on a plane surface falls as cos^4 of the off axis angle.
So the sun produces a 1/r^2 irradiance the same as a point source within a half percent beyond 8.64 million miles.
So at our distance the error in irradiance would be unmeasurable.
At present there is about 6.8% more incoming solar radiation at perihelion than aphelion.
When Earth’s orbit is most elliptical, the difference is 23%!
A couple of quick points, as I’m on the road. The total insolation averaged over a year changes virtually not at all. When summer is stronger, winter is weaker.
About a decade ago, Roe of UW got much better correlations by matching the rate of change in climatic indicators to summer insolation.
The glacial/interglacial cycle is not caused by insolation changes at 65N. There are at least a dozen different observations and logical pillars to support that assertion. (Typically one or two paradoxes would kill a theory, a dozen is sufficient to not only kill the incorrect theory but to solve the problem, there is only one mechanism that can explain all of the anomalies and paradoxes.) The following are a couple of the paradoxes: Insolation at 65N is currently the same as the coldest part of the last glacial period (paradox we are still in the interglacial phase), the Southern hemisphere also cools when the Northern Hemisphere cools which does not make sense if insolation was the forcing function as the Southern hemisphere summer insolation is maximum when the Northern hemisphere is summer insolation is minimum and vice versa, actual cooling and warming is abrupt (start and end of the interglacial periods is abrupt, the true forcing agent is capable of causing Younger Dryas type abrupt climate change both poles), and finally abrupt climate change events occur prior or after the maximum/minimum of insolation at 65N, and so on.
I will provide a couple of comments to provide a Coles notes summary of the mechanisms, as it appears the start of Dansgaard-Oeschger cooling is imminent. The Dansgaard-Oechger cycle is at 1500 years with beats of 400 years. The Dansgaard-Oeschger cycle occurs at high latitude regions at both poles. There has the recent firing of a senior Nature editor for attempting to publish unequivocal ice core evidence (from the Antarctic peninsula which is outside of the polar vortex and hence reflects south sea temperature rather than Antarctic ice sheet temperature.) that shows there has been 250 warming and cooling cycles in the last 250,000 year in the Southern hemisphere. The Antarctic peninsula ice core data is very important as it means the Northern and Southern hemisphere repeatedly warm and cool, exactly in fact as we have just observed. Note Antarctic sea ice is suddenly the highest in recorded history which supports the assertion the cooling has started.
http://wattsupwiththat.com/2012/09/05/is-the-current-global-warming-a-natural-cycle/
The correct primary forcing mechanism explains all of the observations such as the polar see-saw and the abrupt commencement and termination of interglacial cycle.
Comment: The polar see-saw is incorrectly named. The phenomena is the Antarctic ice sheet cools slightly when the Greenland ice sheet warms during a Dansgaard-Oeschger cycle and vice versa. It is only the two ice sheets that are affected, not the entire pole. High latitude southern regions warm when high latitude northern latitudes warm during the Dansgaard-Oeschger cycle which is exactly what we have just observed in the last 150 years.
See Svensmark’s paper for description and explanation of the polar see-saw.
http://arxiv.org/abs/physics/0612145v1
I also looked at the explanations for ice ages and Milankovitch cycles doesn’t make sense to me either. The main reason for their being accepted seems to be that something “known” has to be assigned as the reason because climate alarmists don’t want to admit that they don’t know. It is important to climate alarmists that the present climate be presented as being stable (before human interference), so solar and other influences have to be stable and carbon dioxide is the only thing which is changing.
Judging just from the graph and with no ambitions to resolve the problem, each of glacial->interglacial swings closely follows ascending edge of one of 21k swings. Most importantly, not starting when the swing is at the maximum but while it is still at low levels (i.e. the insolation is still low but Earth is already recovering). All of them except the one that starts 400k years ago where the recovery took two periods.
That suggests the Milanchovitch swing is just some kind of kickoff impulse or “primary pulling force” but the Earth is already prepared for the change and there is some kind of positive feedback potential collected over the past that’s needed for that.
Why? I doubt there’s lack of hypotheses, rather lack of ways to verify them. Just one of many – during ice ages, water vapor levels in atmosphere are very low and precipitation is small. Dust may keep collecting in upper levels of snow cover until it becomes dark enough that increased insolation pulls the Earth out of ice age in just one swing.
It might be worth taking a look at a paper by Gerard Roe that looks at the correlation between the rate of change of ice volume and high latitude insolation.
http://onlinelibrary.wiley.com/doi/10.1029/2006GL027817/abstract
You beat me to it. They are up front about the limitations and have no idea how the deglaciations occur but their conclusion is pretty straight forward:
” focusing on the rate of change of ice volume, as opposed to the ice volume itself. The available evidence supports the essence of the original idea of Köppen, Wegner, and Milankovitch as expressed in their classic papers [Milankovitch, 1941; Köppen and Wegener , 1924], and its consequence: 1) the strong expectation on physical grounds that summertime insolation is the key player in the mass balance of great Northern Hemisphere continental ice sheets of the ice ages; and 2) the rate of change of global ice
volume is in antiphase with variations in summertime insolation in the northern high latitudes that, in turn, are due to the changing orbit of the Earth”
Beat me to it as well! Willis, Dick Lindzen pointed me towards this paper some five years ago ;-). The reference is the paper Roe published in 2006 (he was a former student of Lindzen’s), highlighting a compelling relationship between the _rate_ of ice accumulation versus insulation changes at 60 N. Partly based on my writings, Lubos Motl then did a nice piece on the subject here: http://motls.blogspot.com/2010/07/in-defense-of-milankovitch-by-gerard.html
I believe the effect is a bit more complex, because the two hemispheres are connected. This means the Sourhern hemisphere experiences its own changes in exposure to sunlight. This gets even more complicated because Antarctica is covered with ice, it is surrounded by sea ice formed in winter, and the Southern Hemisphere has more ocean surface, which has changing albedo as clouds are formed.
I’m also starting to suspect there’s interaction between the elevation of the Labrador and Scandinavia regions and the amount of snow they get. Evidently as the ice forms it depresses the continents, which in turn lowers the elevation. This puts the glaciers at a disadvantage once the melting starts. But once the glaciers melt the continent rebounds, gains elevation, and this allows easier formation of the next glacier which kicks off the ice age.
This can get so complicated I can’t visualize the scientific community ever having it all pinned down.
Some years ago there was a chart in WUWT showing temperature changes over 4 million years. From memory this was from sea sediments but I may be wrong. This plot showed that at that time the dominant cycle was 41K and was correlated with the MC. This clear signal became fuzzy at the same time as the Isthmus of Panama closed preventing the warm Pacific waters flowing into the Atlantic. From about 1million years ago the cycle switched to the 100k periodicity we see now.
My take on this is that the 100K cycle is a resonant frequency characteristic of the earth’s climate system. This is analogous to a musical instrument where the vibration is triggered by an external force ( the bow of the blow ) but the sound is amplified by the resonance.
For this to happen there has to be an energy store and in the case of the global system this has to be the sea since it is the only one large enough to store sufficient energy to eventually melt the ice which forms during the ice age itself. It is easy to postulate mechanisms ( like albedo change ) for amplifying the cooling period but we know that many of the ice ages ended abruptly with huge swings in temperature occurring over decades rather than millennia. It is this chaotic period that needs explanation.
My view is heretical
I believe that the earth warms during the ice age!!
By this I mean that the radiation balance is positive during the period where the ice covers the North Atlantic. This is because the warm water that flows north during normal times and radiates strongly into space is trapped under the ice which radiates very weakly. At the same time the cloud cover in the tropics would have been low due to the proximity of the ice front reducing relative humidity. Thus there would have been a strong sun at the surface but the overall surface radiation back into space would have been low. A strongly positive radiation balance!
In this way the temperature of water under the ice would have increased and indeed there has been research showing warm water in the Baltic indeed increased under the ice during the last ice age.
http://onlinelibrary.wiley.com/doi/10.1029/2008GL036563/abstract;jsessionid=C78C1C0C4B107A2FC698A51F23CC90CB.f01t03
At the same time the warm water would have been melting the sea ice from below. this would have produced huge ice shelves too thin to survive. At some point these would have calved into the warm seas creating huge ice bergs. This sudden exposure to the warm sea would have led to sudden increases in temperature followed by increased radiation to space and sudden drops in temperature. Hence the oscillatory nature of the end of the ice age.
If this scenario is any thing like correct it has great implications for the narrative relating to the evolution of man. The reason is that what I have been describing at sea is not mirrored by what was happening on land. During the onset of the ice age the sea level would have dropped and the deserts would have grown sqeezing all species into a narrow area around the current Mediterranean. The competition would have been tough and innovation would have been crucial as would the development of the social skills to support cooperation. It should therefore be no surprise that the evolution of man began to accelerate just at the time these dramatic climate swings began to appear. Then the latter period of the ice age would have seen the land south of the arctic basking in sun and fed with rivers of melting ice. A land of milk and honey!
As the ice receded there would have been space and food for all the survivors to proliferate and exploit their new found skills. This cycle of climate pressure and benevolent aftermath is analogous to the rapid innovation and evolutionary development we see in countries and companies during and after wars or other global shocks.
It might therefore follow that the idea that Homo Sapiens suddenly appeared “out of Africa” 80,000 years ago is a mistake. I think it is highly likely that these migrants appeared every 100,000 years and they interbred and with all the other global tribes that were forced to coexist in the declining habitable land space around rivers – sharing their cultures and their expertise. The groups that eventually dispersed as the climate became more temperate would thus have become more homogenous thus explaining the lack of really large genetic variation within the human species.
Homo sapiens definitely emigrated out of Africa long ago, such as Neanderthal in Europe and many sub-species of homo erectus in Asia. But homo sapiens sapiens, modern man, did not develop until about 60-80k in Africa, and it is this sub-species that moved out into Europe and Asia shortly thereafter, and eventually colonized the whole globe. There was some interbreeding with Neanderthals and Devonians, but over time all rival sub-species were wiped out.
No one know for sure why this happens, but some sort of mutations appeared in the African population that proved immensely advantageous. Probably a combination of some sort of intelligence multiplier, since this is the first time that rapid advances were made in tools, culture, and especially, burial rituals, indicating the beginnings of religion and belief in an afterlife. Another factor was likely the development of a more advanced voice-box capable of complex speech – not evident in other human sub-species.
Climate probably played a huge role in this. The eruption of Tambora created terrible climate effects around the globe, leading to our human ancestors in Africa being reduced to less than 2,000 total population, and possibly as low as a few hundred. That probably severely weakened other human sub-species elsewhere as well. These severe environmental stresses likely contributed to rapid mutation as a survival mechanism, producing modern man as a result.
I have to say more convincing is the theory of Svensmark, supported by the late Nigel Calder which claims that cloud nuclei from cosmic rays generated by nearby supernovae account for cooling and lack thereof promotes warming.
https://calderup.wordpress.com/2012/04/24/a-stellar-revision-of-the-story-of-life/
Here are the main results:
The long-term diversity of life in the sea depends on the sea-level set by plate tectonics and the local supernova rate set by the astrophysics, and on virtually nothing else.
The long-term primary productivity of life in the sea – the net growth of photosynthetic microbes – depends on the supernova rate, and on virtually nothing else.
Exceptionally close supernovae account for short-lived falls in sea-level during the past 500 million years, long-known to geophysicists but never convincingly explained..
As the geological and astronomical records converge, the match between climate and supernova rates gets better and better, with high rates bringing icy times.
David Hall–Very interesting–will have to read this (I just read Calder’s page on it). Per my note below, more clouds = more precip = feeding mechanism for growth of ice sheets. I’m looking forward to the day when ‘Climate Scientist’ includes (requires) the study of the astro-climate and geology, not just modeling CO2 levels and sea level. Between supernovae, variations in interstellar dust, cyclical comet strikes, and other factors, there is so much we don’t know. Unfortunately, intellectual humility is not something found today in the current AGW crowd or its mouthpieces (Mooney, Borenstein, etc.).
Willis–It’s never sat right with me either, and in my mind it’s the greatest puzzle in climate. While there are many papers examining the insolation-temperature relationship (a la Milankovitch/other cycles), I have yet to see anything that clearly and logically explains the localized precipitation-to-ice accumulation mechanisms that fed the Laurentide ice sheet and show likely rates of ice accumulation. It would be interesting if the science eventually ‘stood on its head’ and revisited some ‘sibling’ model of the Ewing Donn theory–a warm, open Arctic ocean feeding a growing ice mass on/around Baffin, along the lines of the growth of subtropical glaciers like those in NZ. It’s amazing to think about snow falling on Baffin and feeding a conveyor belt of ice eventually sculpted the hills of southeastern Wisconsin. Must it necessarily have been cold EVERYWHERE, or could it, like at the base of NZ’s glaciers, have been warmer than currently supposed? Cheers~
PS–Love your writing!
Actually there is very little doubt that up to about 1 million years ago climate (including relatively small amplitude ice-ages) was very closely tied to the 41,000 years Milankovich obliquity cycle. The cycle-length matches perfectly and so do the position of peaks, as far as they can be reasonably well dated. However during the “Mid Pleistocene Shift” climate gradually changed over to approximately 100,000 years long glacial cycles with a very much larger amplitude. The previously largely sinusoidal cycles also became much more complicated with usually several smaller sub-peaks (“stadials” and “interstadials”). So far we have been through eight full “100 KA”‘ cycles, and they have all been somewhat different, both in length, amplitude and number and timing of sub-peaks.
As for what caused the change from the “41,000 year World” to the “100,000 year World” it is, as they say, “not well understood” . There are a number of different hypotheses but none of them is very convincing.
There is an approximately 100,000 year eccentricity Milankovich cycle, but it only has slight effect on insolation. There is evidence from older geological periods that the longer 404,000 year eccentricity cycle has climatic effects, but very little evidence for any 100 KA cyclicity.
The theory is that with more regular orbits, the winters are warmer, but the summers are cooler and the ice never gets a good chance to melt. That leads to a positive feedback (both coming and going) from albedo.
And the orbital regulatity cycle (ie. circular vs ellipticL) is the 100k year cycle ??
The problem is that the effect is minute. If this very slight change drives ice-ages, why don’t others much larger changes (e. g. the 41 KA obliquity cycle) do too?
I`ve never been convinced that we know the cause of the Ice Ages. Nice work.
Clearly the solar insolation and temperature anomaly are cyclic. By definition, solar insolation is the deposition of energy, but it does not indicate how that energy is distributed. Energy is gained and lost in almost innumerable ways in our Earth’s system. It can also be stored in all sorts of ways, being released slowly or quickly depending on circumstances. The temperature anomaly gives an indication of energy being lost or gained, but not the mechanisms for how it happens. In order to connect the dots between the two graphs, if there is a connection, we need to determine all the mechanisms by which our system distributes gains and losses, and stored/released energy from the sun. So many questions still be answered and there are just way too many angles at this time for us to connect the dots.
Here is an example of another angle. How much does tectonics play a role? From the Utah Geological Survey http://geology.utah.gov/surveynotes/gladasked/gladice_ages.htm
“Do ice ages come and go slowly or rapidly? Records show that ice ages typically develop slowly, whereas they end more abruptly. Glacials and interglacials within an ice age display this same trend.
On a shorter time scale, global temperatures fluctuate often and rapidly. Various records reveal numerous large, widespread, abrupt climate changes over the past 100,000 years. One of the more recent intriguing findings is the remarkable speed of these changes. Within the incredibly short time span (by geologic standards) of only a few decades or even a few years, global temperatures have fluctuated by as much as 15°F (8°C) or more.
For example, as Earth was emerging out of the last glacial cycle, the warming trend was interrupted 12,800 years ago when temperatures dropped dramatically in only several decades. A mere 1,300 years later, temperatures locally spiked as much as 20°F (11°C) within just several years. Sudden changes like this occurred at least 24 times during the past 100,000 years. In a relative sense, we are in a time of unusually stable temperatures today—how long will it last?”
The graph shown with this article correlates well with the temperature anomaly graph that Willis has shown and adds notations for the glacial/interglacial periods which helped me visualize what is going on a little better. I doubt that tectonics somehow contributes to the cyclic nature of the temperature anomalies. However, I would bet tectonics plays a role in how fast or slow a change can occur – and tectonics is just one variable.
On a humorous note: do you suppose if the insolation graph was put into a sound synthesizer that it would be the song “Sunshine On My Shoulders”? It does appear to have a beat.
Records show that ice ages typically develop slowly, whereas they end more abruptly.
That could be the knock-on effect of CO2 variation (~100 ppm). Faster onset of interglacials and slower descent into ice ages.
I also didn’t realize that there is an underlying ~400,000 year cycle, which leads to the larger peaks at about 200,000 and 600,000 years before present (BP), and also leads to the very, very small peak at about 400,000 years BP.
Oh, yeah, the Milliecycles themselves are irregular, especially Eccentricity. There’s also a (proposed) “fourth cycle”, Inclination, involving a ~100k variation in the orbital plane, taking the earth through greater or lesser “space dust” conditions.
Note that the 20k variations roughly coincide with Precession, the “lesser” of the three cycles, the theory being that if the NH is tilted toward the sun during aphelion, there will be less warmth absorbed because there is less land surface in the NH.
“…because there is less land surface in the NH.” ??
Ditto
This is another for the climate file called, “It’s settled but not really” cross indexed with another climate file called, “It’s settled we’ll figure out why and how later”.
It does remind me of the countless conditions and mechanisms from the macro to micro level are in place and working together to make this earth very fertile for life. I’d call it a miracle, not in a supernatural sense, but in the sense it is astounding.
The Milankovitch cycles affect the distribution of insolation, not the insolation as a whole over the whole globe. So i dont think you can apply global temperature anomaly expected variation as a function of the insolation at any given latitude. Eg you cant say I expect global temperatures to go down because there is a 100W/m2 drop at 60 degrees north.
The general pattern is a rapid climb out of an ice age followed by an interglacial then a relatively slow decline back to lower temperatures. I believe the rapid climb out is due to an increase in northern latitudes insolation which melts the great ice sheets with reduced albedo feedback causing more warming etc etc …. But I agree with you it cant just be the insolation as the correlation is weak.
Whatever happened to low climate sensitivity? The negative feedback from clouds?
OK, I’ll bite. The clouds hate you! 😉
“ice ages typically develop slowly, whereas they end more abruptly.”
That is exactly how the ice-laying and ice-break happens in nordic lakes, each year.
The ice-break in spring, even in large lakes, happens within hours – but ice-laying can take weeks.
This is well-known for us in northern Sweden, but maybe not elsewhere?
The question is what summer solar insolation is required to melt out all the snow from the winter. Once, a location falls below about 420 W/m2 in the summer peak, that seems to be the level where there isn’t enough energy to melt the snow and ice in the summer and the only location where there happens is 75N to 90N.
The variation you show at 40N is always high enough to melt out the snow in the summer. And the other issue is the 40N insolation is really 1000 W/m2 in the daytime solar peak and 0 W/m2 at night. It is really the daytime solar peak one should be concerned about. And even at 65N, the summer daytime solar peak is always energetic enough to melt the snow.
The other issue is that winter, the solar energy has the opposite cycle to that of the summer. When the summer is down, the winter is up, so the annual change is not nearly so much different in the Milankovtch as the chart makes it seems. 40N is getting enough energy (at low Albedo levels) that it is warm enough to keep the snow away in summer and even in the winter at a low Milankovitch cycle.
75N is where the action is.
Then it is just a meter of how the ice-Albedo feedback kicks in and reflects the sunlight so that even an upturn in the Milankovitch Cycle does not do enough to melt the ice because, most of the extra summer sun just gets reflected away.
Bill Illis January 23, 2015 at 4:03 am
Thanks, Bill. There are several problems with your hypothesis. First, moving the measurements north doesn’t change the shape of the insolation curve, just the intensity.

Second, at 75°N, it’s daytime all the time in JJA.
Third, at 75N the peaks of the average insolation do not exceed 200 W/m2.
Fourth, there is still the pesky interglacial at 400 Kyears, and the peak insolation at 75°N at that time is only about 188 W/m2.
Fifth, the swing in insolation is much smaller at 75°N, only about 40 W/m2 max peak-to-trough.
But in any case, we’re nothing if not a full-service website, so here’s the 75°N data, you can check it for yourself.
w.
Eureka Nunuvut Canada at 80N solar radiation tower data from 2009.
By May, solar radiation down gets up to 400 W/m2, but the snow reflects back 70% of that and net solar is only about 50 W/m2.
By early June, however, the snow has melted and the net solar radiation rises into the 450 W/m2 range. The snow comes back in early September and the net solar falls toward just a few W/m2
http://www.esrl.noaa.gov/psd/arctic/observatories/eureka/img/eurekaData.png
The Ice Ages start right where this radiation tower is located. The SW data in this chart (left side) is the indicator of the ice ages.
When the summer daytime peak solar radiation falls to 410 W/m2 in a Milankovitch Cycle, the snow stops melting completely out over a summer period at Eureka and it builds up and turns into ice eventually. Then Milankovitch can vary by large amounts but 70% of it is just getting reflected back to space. Ice age lasts for 100,000 years until the ice has melted back starting at Chicago (18,000 years ago) and ending at Eureka (8,000 years ago).
The 400,000 year ago period was similar to that today in that the summer net solar radiation at Eureka always stayed above 420 W/m2 and the snow always melted out the summer. It lasted for only about 25,000 years however.
In the next 52,000 years, Eureka peak daytime solar radiation is going to stay above 440 W/m2 and there will be no Ice Age.
Assuming that TSI stays constant.
Bill, thanks for that lovely Canadian data, and I’d greatly appreciate a link to it … but how does that explain the interglacial 400 Kya ago when there was only a small increase in insolation up north?
Best regards,
w.
Eureka Radiation Tower data here.
http://www.esrl.noaa.gov/psd/arctic/observatories/eureka/eureka_tower.html
Other info on the station here which is a world-class climate monitoring station.
http://www.esrl.noaa.gov/psd/arctic/observatories/eureka/
http://www.esrl.noaa.gov/psd/iasoa/stations/eureka
And somehow, this guide for the station got hosted on WUWT?
https://wattsupwiththat.files.wordpress.com/2010/04/visitor_guide_to_eureka_apr_2010.pdf
If you smoothed the insolation data, and then took the derivative of it, there would be a close correspondence.
qwaezee, do you have a citation for that claim? Or perhaps a graph? I find lots of people are very sure of things that turn out not to be true once they go looking for actual data to support their hypothesis … including myself, sadly, as this post clearly demonstrates.
In any case, you say “smooth the insolation data” … I’m always extremely reluctant to use smoothed data in an analysis, because smoothing is known to introduce spurious correlations. See my 2008 post here for some practical examples of the problem, or google “yule slutsky”.
Best regards,
w.
I do not have a citation or a graph. But note that when the peak-to-peak value decrease, it gets colder. The opposite is true when they increase. There is a very strong correlation.
Now I know you’re just waving your hands, qwaezee. Look at the period around 400 Kyears ago … very small peak-to-peak values, very high temperatures.
w.
Willis, check Gerard Roe’s 2006 paper. There are several graphs in that paper, highlighting what qwaezee noted above. He was a former student of Lindzen’s.
Lubos Motl does a write up here
http://motls.blogspot.com.au/2010/07/in-defense-of-milankovitch-by-gerard.html
And the correlation between rate of change of ice volume and the Milankovich cycles is indeed close. But of course rate of change of ice volume vs actual ice volume begs the question as to how much impact albedo really has. Afterall we would expect faster rates of melt when there is more insolation…its a bit of a no brainer. But the analysis still doesn’t prove the point about albedo changes being the cause of ice ages.
The graph looks impressive:
http://lh4.ggpht.com/_4ruQ7t4zrFA/TDL7RSCEgZI/AAAAAAAAEGE/0HeA3XYGVmM/milankovitch-roe-fig2.JPG
Concerning albedo
How do you assess this factor when it happens that glaciation reversed when the albedo reached maximum? This hardly points to an important feedback mechanism.
Glaciers can have Albedos up to 75%. In the summer, Greenland’s Albedo is 75% on the majority of the glacier (the edges are lower). The changes in the Milankovitch do nothing to the central glacial mass since 75% of the changes are reflected back to space.
At the edges, now Milankovitch can have an impact and the melt has to start at the edge and move inwards. It takes a long time to melt out a 2km high glacier starting from the edges inward.
You are considering only N summer insolation but there is a reverse effect for winter and for S hemisphere so that things are largely cancelled out. Seems that the proper causes need to be considered and integrated over the year.
Ray, I’m just investigating the generally accepted explanation, which is that it is the insolation variations in the northern reaches of the northern hemisphere that make the difference. Globally, as I pointed out in the head post, the hemispheres largely cancel each other out.
w.
What warms the world is the ocean. So it would be insolation variation which caused most direct sunlight on most ocean water which causes global warming
If you heat land the most, one simply causing more energy to escape into space- the net result would be global cooling.
So we live in icebox climate because the ocean is not being warmed enough.
It also “seems” that when we begin get the ocean warmer we then dive into a glacial period.
So it appears the icebox climate has mechanism which stops ocean from warming up very much and thus prevents our world from being warm.
So our question is not what causes warming, but rather what causes cooling.
And rather look that things +10,000 years ago, we could start by looking at the Little Ice Age.
What caused the cooling which gave us the Little Ice Age.
Determining what caused the Little Ice Age is far more important to the humans currently living
on Earth, because a minor “little ice age” will kill million if not billions of people.
Or drop of .5 C is more important to the billion people living in poverty as compared to rise of twice as much [1 C].
Plus what causes cooling is more important in terms of scientific interest.
Anyways it’s thought volcanos and sun spot have something to do with the Little Ice Age, but to me this doesn’t fully explain it.
Though if it was merely sunspots and volcanic activity- that’s not good news, as it looks like we entering a low solar activity period- and we don’t control volcanoes.
gbaikie writes “If you heat land the most, one simply causing more energy to escape into space- the net result would be global cooling.”
This feels intuitively right to me. IMO there are far more things going on than simply changing insolation causing ice based albedo changes.
Ray, your point is related to the point I wanted to make. The Milankovitch cycles are obviously the superposition of a number of periodic effects. I don’t know the origin of all the periods, but perhaps a phase difference for the southern hemisphere cancels the 21k cycle and leaves something at 100k. That would help to explain why a 100k cycle is observed but a 21k cycle is not.
Is that possible?
If you want to try and match the northern hemisphere summer cycles you may wish to use Greenland ice cores not Antarctic ones. As others have mention when the insolation is low in the northern summer it is higher at other times and places, it all balances out pretty well over the year for the total earth. The theory is based on a lot of feedback from less summer snow melt. Like all model based climate theories I would be very skeptical.
Use the changes in global average insolation because the atmosphere and oceans transport heat quite efficiently around the world. Notice local insolation changes from 1,000 W/m^2 to zero in just 12 hours everyday but it doesn’t freeze in the tropics every night.
Yes, but local insolation changes to zero and back in the polar regions, and they definitely freeze alternately. If your theory that “the atmosphere and oceans transport heat quite efficiently around the world” actually worked, we wouldn’t have winter in one hemisphere and at the same time summer in the other hemisphere, would we? …
w.
Winter and summer are seasonal and geographic variations. Your Figure 1 is seasonal and geographic. Figure 2 is not seasonal and different geographic location. Don’t expect to find correlation much less causation between the two graphs. 3.7 W/m^2 is global and all-year round. If you’re looking for global changes in temperature, look at the whole picture – global changes in insolation.
Look at the seasonal variation of solar insolation at 40 degrees north latitude. It’s about 300 W/m^2 every year but it doesn’t cause big changes in global temperature. It’s offset by insolation variation in southern hemisphere. It’s important to look at the whole picture.
Just how do you measure insolation during the summer months 800 thousand years ago ?
Good question, WitchFinder. It’s calculated from the well-understood cyclical variations in the earth’s orbit around the sun …
w.
Why don’t we question the record from the ice cores at the EPICA dome in Antarctica?
Are we sure they are showing what we think they are showing?
And are we sure they are representative of anything, except the area of the EPICA dome in Antarctica?
Why should any sceptic want to question any ice-core record?
They show that climate on this planet change naturally, That it has varied in a cyclical pattern for hundreds of thousands of years, long before any possible suggestion of human causation. They show that previous inter-glacial periods were warmer than this one. They clearly show the Minoan, Roman and Medieval warm periods, contradicting Michael Mann’s hockey stick.
http://jonova.s3.amazonaws.com/graphs/lappi/gisp-last-10000-new.png
They provide what Science of Doom calls ‘An Inconvenient Temperature Graph’; well worth reading
http://scienceofdoom.com/2009/11/22/temperature-history/
Why question that?
Sometimes sceptics get so used to rejecting any scientific measurement that they end up rejecting evidence that supports their case (that’s what being a sceptic means I suppose).
I question the ice core record as it doesn’t seem to fit with the theory of how ice ages start,.
Just because evidence supports my case doesn’t mean I should support the evidence. My case might be wrong. Evidence supports my position – my position should have no impact on how I interpret the evidence.
And I still can’t see why a local thing like an glacier is expected to reflect the whole planet.
How do ice ages start? What doesn’t fit?
We have ice core records from both ends of the world, from Greenland where the GISP2 record comes from and from Antarctica where the Vostok ice-core comes from. All the ice-cores show broad agreement with the glaciation periods. What I forgot to mention is that the Vostok ice-core shows that CO2 levels follow temperature changes, not the other way around
http://upload.wikimedia.org/wikipedia/commons/c/c2/Vostok-ice-core-petit.png
The ice-cores provide the most important evicence for the sceptic position that climate varies naturally.
Is that an instrumental on a proxy, and does correlation of the rise at the end with the rise of CO2 mean there is causality?
Note the rises into the optima. CO2? Likely not. So where are you?
================
We should question it because we should question everything. Skeptics often rightly accuse AGW proponents of being spoon fed, or blindly following the MSM. Don’t blindly accept anything only because it currently supports your ideas.
MikeB wrote: “Why should any sceptic want to question any ice-core record?”
Because we are skeptics.
There are too many people on both sides of this debate who will blindly accept any evidence, no matter how specious, that supports their side and reject any evidence, even when quite solid, that supports the other side. A pox on such people.
The plot shown by MikeB shows significant increases of dust levels as each period of cooling progresses. When the dust gets to a sufficiently high level the temperatures rise rapidly, at which time the dust levels drop back to close to zero. Any explanations?
Could dust be driving climate?
(Dust in Norwegian is ‘fool’, so this must be a very foolish climate theory!)
Tim Crome,
More likely it is climate driving dust.
The cooler, the drier; the warmer, the wetter. At the beginning of the Holocene, precipitation doubled very quickly, as evidenced in the Greenland ice cores. Arid regions became well-watered, as the Sahara, the Gobi, the American west, other places.
Odd graph label, given that not one bit of it actually shows the Younger Dryas. This is the graph of the Holocene. The YD is about 2000 years left of the earliest date BP.
Makes one worry about how well the creators are connected to reality.
rgb
Willis, you have stumbled upon something which just about who has studied earth sciences comes across at some point, that Milankovitch cycles don’t correlate all that well with ice age records.
However, there are at least several suspected reasons I have heard why the fit isn’t too good.
First is that ice itself drives its’ own climate (mostly through albedo, but also changes in ocean currents and vegetation), and it takes long periods of time for this ice to build up and therefore there are also long delays for the full effects of large amounts of built-up continental ice to kick in. We are talking tens of thousands of years of delay.
Also, the rate of ice melt, once underway, is quicker than getting it built up in the first place. There is a tipping point when ice fails to melt in summer, and another major tipping point when the first land begins to appear beneath the ice in summer. In both cases, the relationship with insolation is not linear. On a continental scale, with a mile of ice over North America and Canada and Eurasia, this makes a difference. What you get is periods where temperatures are moving much more rapidly in one direction, particularly during the melt phase. There is no linear relationship here with incoming insolation, continental-scale ice likes to operate on its’ own timescales.
Another potential factor concerns how the build up of continental ice itself affects ocean currents. When the sea is 180m lower, the pattern of ocean currents and heat distribution changes. There is land between Australia and Papua New Guinea, as well as North America and Asia, as well as the UK and Europe, as well as other places (including possibly the ?Mediterranean, if I remember).
Also, because the world is cooler during ice ages, there is less vegetation and rainforest cover, which may affect temperatures.
Orbital variations include the actual time of year when the earth is closest and most distant from the sun (ice ages are strongest when the earth is furthest away during the northern hemisphere summer), as well as how far away in total it is, as well as variations in tilt. These combine in complex ways with ice build up and ocean currents. Most mathematicians are not glaciologists.
Hope this helps.
Excellent points. Additionally the Sun experiences fluctuation of solar output; sometimes more sometimes less which can be observed in ratios of various isotopes formed in the atmosphere by solar energy (and particle) interactions. Also given the long time cycles observed, it has been proposed that solar radiance may also be affected by “dusty” portions of space as our solar system cycles through our galaxy.Hence the resolution problem which likely has no single answer.
The correllation is fantastic if you consider the derivative of ice volume versus insulation at 60 N. See Roe 2006.
–First is that ice itself drives its’ own climate (mostly through albedo, but also changes in ocean currents and vegetation), and it takes long periods of time for this ice to build up and therefore there are also long delays for the full effects of large amounts of built-up continental ice to kick in. We are talking tens of thousands of years of delay.–
It may take time to do this. But suppose it were to occur in a instant.
So get a lot of snow and built the ice caps which were a mile high on north America continent-
this elevation of the ice, would cause the ice to be cold.
Or if average surface was 5 C per year- a mile up has below 0 C average temperature.
In in conditions of hottest year ever, such man made snow doesn’t melt.
And one could have more snow is added per year. And living near enormous ice mountain make the lower elevation around this ice, cooler- so that region’s snow doesn’t melt as much.
But other than regionally cold temperature, does this actually cause the world to cool?
I don’t think vast lava pit or vast ice mountain affects global temperature- it doesn’t warm or cool the world- it is hot or it is cold, but it’s not warming or cooling the world. It could do things like alter the jet stream and affect the world. It could involve a mechanism of sucking in moisture or could bringing moisture somewhere. Or it could change weather patterns, and because it alters weather patterns it could have some kind of a global effect- but vast lava pit might cool and ice mountain might warm.
Though of course it’s possible the lava pit could warm and ice mountain could cool the world.
Lands do not warm or cool oceans, oceans do warm land.
And it is the temperature of Earth vast ocean which is the Earth’s average temperature of 15 C.
Continental-scale ice cover affects albedo.
In geological history, there is a correlation with how much land is near the poles and ice ages, combined with how much the continents are all stitched together. This is because if there is more land nearer the poles, it allows more ice build up which re-inforces itself and leads to runaway icehouse. More land together also enhances this effect, as oceans provide a buffering effect to more ice cover. The actual shape of the continents also effect ice build up-more land polewards is generally better for ice build-up (such as North America, but not South America). There is also evidence that more land about both poles enhances the ice age effect, as is currently the situation.
We are currently heading into permanent icehouse, as Africa is joining Eurasia and gradually closing the Mediterranean, which is a remnant of the Tethys sea. What you will then have is land from northern Russia to Africa, which might be the final nail in the coffin where there are no more interglacials, which are able to melt away all the ice which advances from the north, but which is currently inhibited by the Mediterranean. Once the Mediterranean closes in a few million years, ice will be able to move down more easily into Africa from Europe. One wild card is the current break up of East Africa, which would allow warmer waters to eventually flood into Africa inhibiting ice build-up.
North America and South America have also now joined. In North America, ice advances from the north, but this will always be stopped by the shape of the Gulf of Mexico. If South America were flipped, ice ages would be worse, as currently there is little land south of Brazil, which doesn’t allow much ice build-up, but the shape of North America enhances ice build up, since most of the land is in the north.
So continental configuration and shape definitely affects ice ages and earth temperatures. We are currently getting colder and colder, larger due to Africa joining Eurasia, India has also joined Asia.
The 100,000 year cycle is dominant at present because even thought the 21,000 year cycle is stronger, it is too short to allow much ice build up. What happens is that the 100,000 year cycle combines with the 21,000/40,000 year cycles during a longer term cooling trend to tip the balance to widespread glaciation; the process needs multiple cycles which combine to enhance each other, in conjunction with longer term ice build up, to produce the greatest cooling effect.
Mathematicians don’t integrate the effect of long term ice build-up, so they miss it.
And by the way, the 400,000 year warming peak in the record probably occurs because of the lack of any cooling at that time over a longer period; it is this long period of relative stasis, which allows more continental ice to melt, to give a very low overall earth ice albedo, and a warmer, broader peak to occur.
Willis, have you done any of your frequency analysis on the ice core data? Are there any 21k yr / 400k yr signals to be found that way?
The Milankovitch Cycles are not as simple as this article assumes.
There are multiple components which do not vary in unison and so there is considerable variation in the way the componentrs interact such that there is an infinite number of different ways that the variations can impact on global temperature.
http://www.indiana.edu/~geol105/images/gaia_chapter_4/milankovitch.htm
Furthermore:
“It is of primary importance to explain that climate change, and subsequent periods of glaciation, resulting from the following three variables is not due to the total amount of solar energy reaching Earth. The three Milankovitch Cycles impact the seasonality and location of solar energy around the Earth, thus impacting contrasts between the seasons.”
Does the sun do something we’ve never see?
Pretty likely. We haven’t ‘seen’ it for long.
Better, since we have new ways of observing and theorizing, it’s doing something new every day.
==========
Correction, ‘new to us every day’.
===========
What happens to sun if a rock size of Vesta hits it [there are thousands maybe millions of Vesta rocks in our solar system. And Sun is the most hit object in our solar system [because it’s the biggest [and also gravity- but not just because of it’s dominating gravity].
Jupiter impacts we seen:
http://www.spacetelescope.org/images/?search=shoemaker+levy
And seen comets diving into the sun:
http://www.space.com/11661-comet-dives-sun-solar-eruption.html
So small rocks diving into the sun [and one time saw small rocks hit Jupiter] are
commonplace- but yet to see something big hit the sun.
Would it make massive sun juggle a bit?
I imagine if looking at a lots of stars we will see it [from safe distance].
Evidence that this will continue to be an extended interglacial period is put forward by the paper Evidence for a Global Warming at the Termination I Boundary and Its Possible Cosmic Dust Causeby Paul A. LaViolette.
The Cryogenian period may have ended ~635 million years ago due to volcanism under the ice sheets, or due to a reduction of albedo over time as lower precipitation rates persisted and the ice sheets became more translucent.
For some reason, it’s less controversial to point to a period in our distant past!
One thing I have read is there definitely seems to be faster plate tectonics (from palaeomagnetic reconstructions etc) around ~600Ma-500Ma, also meaning more volcanism. Not sure about exact timing with de-glaciation though.
Yes, the merger of the Rodinia super continent is supposed to have the freeze by interference with ocean temperature transport.
There is observational evidence from early astronomers from places like babylon and egypt that the current calculations for the earth’s obliquity cycle may not be correct. while this is routinely dismissed as incorrect due to their primitive instruments, one should keep in mind that these people were just as smart us, and perhaps had even a greater incentive to try and get the right answer in their quest, like us, to predict the future.
Nice point. It would seem they used more methods to predict the future, but I’d have to think about that.
==================
Lost a detailed comment due to wonky connection in a beach cabin in South America. May try again when closer to civilization.
But here’s the 1976 paper that convinced most climatologists that Milankovitch was right after his being ridiculed for so many decades:
http://www.ncbi.nlm.nih.gov/m/pubmed/17790893/
Willis…
…
Check out the diagram on page 3
http://www.math.wsu.edu/faculty/genz/315/lessons/l407.pdf
..
Looks like the Milankovitch cycles are forcing the glaciers as a harmonic system
..
Willis, I suggest you take a look at Gerard Roe’s 2006 paper In defense of Milankovitch, published in GRL. Roe maintains that one should not attempt to correlate temperature with insolation, but, rather, the time derivative of temperature.
See also comments by Luboš Motl: http://motls.blogspot.com/2010/07/in-defense-of-milankovitch-by-gerard.html#more
Henry, M-cycles fail on all counts:
1. correlation with climate is no more than by chance
2. slow evolving cycle cannot explain the precipitous temperature increases seen at the onset of interglacials or interstadials as evidenced in ice core records.
3. Ice age cooling was worldwide and included the tropics, yet tropical insolation would increase when high latitude insolation decreased per cycle.
From all considerations, M-cycles fail to account for ice ages.
Rather than take the time derivative of the temperature, which is always an iffy busines with data, take the integral of the Milankovitch cycle (minus the dc component) and then do the comparison to check out Roe.
I’ve done that, and the integral shows no correlation at all with the ice ages.
w.
One big problem with the proxie ice core data is estimating time. The estimates of oldest times can be off by thousands of years. Years ago I did a cycles analysis of all the ice core data I could download. Please read the section on ice cores in http://www.kidswincom.net/climate.pdf and give me your thoughts.
fhhaynie–
Nice work. Your data appears to end in 2009. I wonder now that 5 years have passed, whether another run of your least-squares fits to the several cycles would return similar estimates. You had predicted then a decline in SST in a few years, which does not seem to have developed.
As it turned out, it appears that a rise in a longer cycle tended to cancel some of the decline in the 20 year cycle so we ended up with a “hiatus” which was already in progress. There is a lot of error in my results. I haven’t looked at any ice core data younger than 1984.
Your observations are right on the money, and agree with my own when I first read about Milankovitch, looked at the data, and uttered a discrete “bullshit” cough before returning to my muttons. However, do not bring this up with a climate scientist, as (aside from veiled references to the 100,000 year problem) they will tell you that Milankovitch plus feedbacks is the Answer to it all. And truth be told, there is some evidence that Milankovitch is a (set of) factor(s) in glaciation, only not over the last 600,000 years. If you take the temperature data of the Pliestocene in general, 3 million years ago at onset the glaciation had a very clear roughly signal that more or less fits the short period orbital cycles e.g. obliquity at 41,000, precession of the axial tilt at 26,000. I’d say that the evidence is strong for this up to around 1 mya. The ~40 ky cycle then shifted to a ~100 ky cycle and nobody knows why!
This is up there with the argument that the Pliestocene started in the first place because of the closing of the Panama isthmus. Why? Because correlation, obviously, is causality! Except when it isn’t.
The scary thing about the Pliestocene record:
http://upload.wikimedia.org/wikipedia/commons/6/60/Five_Myr_Climate_Change.png
is that the glacial cycle is obvious deepening over the entire period of 5 million years. Look at the amplitude — the deepest parts of the Wisconsin were 9 C colder than the present. That’s centigrade! On a finer scale, the Eemian interglacial was 1-2 C warmer than the present in a significant pulse that lasted some thousand years.
I personally think that claims of knowledge of cause and/or ability to make pronouncements predictive, projective, prophetic, or just qualitative are highly exaggerated by all who participate in this discussion. There are far too many things about the evolution of the Earth’s climate that make little overt sense. No, it doesn’t correlate well with the solar cycle over the short run record. The annual ~91 W/m^2 variation anticorrelates with the annual temperature variation — the Earth is coolest, on average, when it is closest to the sun and receiving on a daily basis some absolutely stupendous number of joules of TOA insolation more than it does in NH summer when it is farthest away and global temperatures are highest. The relaxation times associated with Stefan-Boltzmann type radiation cooling are hours (or at least, order of days) — and I while I’m happy enough to imagine the ocean introduces a lag in forced response as it buffers all changes, it is difficult to understand the lack of immediate response in land based temperatures to the reduction in forcing. The glacial episodes do not correlate well with Milankovitch, and while sure, one can make up a story about glacial albedo feedback, this is highly implausible because if it were that simple, we’d be one enormous snowball as glacial ice would basically never melt.
I think that we are missing one or more major factors in the evolution of climate. One of them could simply be spatiotemporal chaos on stupendously long time scales with complex multivariate feedbacks and drivers. However, I’m open minded about many other possible explanations, including new physics. My favorite science fiction example is dark matter. If we postulate dark matter (defined as the non-EM-coupled mass that apparently screws up simple gravity so that galactic scale orbits don’t correspond to visible mass), then there should be an enormous amount of the stuff around. Since it doesn’t interact electromagnetically, it is not driven away from stars by things like solar wind (light pressure). At the same time, the vast clouds of the stuff are constantly being stirred by star systems as they orbit the galactic center, but it cannot clump together via short range forces the same way normal matter does, so it probably forms things like rings around star systems, with a fair chunk of the Sun’s mass at the core actually being dark matter that has fallen into it and the rest in a diffuse orbit, being dragged along and cleared out by the planets (which also probably have dark matter cores).
As the solar system orbits, however, it very likely moves in and out of new bands of the stuff. Dark matter macroscopically would be very wierd — over time one could easily enough build weakly (gravitationally) bound “whorls” of DM which wouldn’t form actual chunks like asteroids but would be more like a gas with a long range attraction force that cools the clumps to coalescence via evaporation to where they are semi-stable. These local clumps could have substantial mass — easily asteroid scale mass since DM is supposedly quite massive and prevalent.
What would happen as the sun and planets moved through this inhomogeneous background? A clump of DM falling into the sun (or a locally thicker patch of DM falling into the sun, or the earth) would have extremely odd effects. For one thing, there would be no spectacular explosion, because DM doesn’t interact with atoms more than enormously weakly. The hot Sun would remain hot, the DM would remain cool because the two forms of matter barely interact. BUT the clumps WOULD exert an IMPULSE on the solar interior, acting like a “pucker point” where solar mass gravitationally compresses out of place. This compression would heat up the solar matter locally in the pucker, which would affect solar dynamics global and local. I could easily see solar output being substantially modulated in a sustained way by passage through DM clouds and/or could see events like CMEs being associated with the orbits of invisible cold clumps of DM through the actual solar body and tracing the moral equivalent of compression wave along a line through the photosphere and nucleating a magnetic response. A second interesting question is what might happen if blob of comparatively dense DM condensate — say, one the size of Mt. Everest — intersected the Earth. Again, not what you’d expect, not necessarily mass extinction or the like, because it would be like a big blast of neutrinos — you’d never even notice it from direct interaction as the Earth is 99.99…% transparent to neutrinos. But it could cause a local puckering of gravity a gravitational anomaly that yanks the crust, the mantle, the ocean, the atmosphere, into a transient state of higher density and compression heating. And what the effects of these sorts of things might be it is hard to say. It could be the actual cause of many things we attribute to chaos or random chance — the emergence of a volcano, Tunguska-like episodes, lights in the sky at night caused by compression heating of chunks of atmosphere, ball lightning. Very difficult to detect as one cannot see the cause, only the effect, and the effects one sees often or even generally do not have specifically attributable causes.
Well, enough SF for the morning, back to work. But as I said, since the climate depends on physics, and since physics is incomplete, it is astoundingly difficult to exclude the possibility of exotic explanations that are simply omitted from consideration in any climate model or hypothesis because we don’t have a good enough grasp of or evidence for the physics itself to know how or whether to include it.
rgb
Might the planets, through their orbits, somehow moderate dark matter entry to the sun?
==============
My objection to the whole concept of dark matter is that it ought to be always there already.
It ought to be formed into rings around our Sun (like the asteroid belt. It ought to show up in the motion of the planets. It ought to be bashing our world all the time – with the volcanoes and new cracks in the tectonic plates.
But it doesn’t.
It just shows up between the stars.
It seems to me like it’s a math error or a failure of the physics model. Yes, I doubt that there is any physical thing to be found that is dark matter.
And don’t get me started on dark energy.
Heh, M C, turbulence?
========
http://wp.production.patheos.com/blogs/exploringourmatrix/files/2014/02/Doesnt-Matter.jpg
OTOH, the cosmological observations that support it are both old, repeatedly confirmed, and almost certainly neither a math error or observational error. It is a simple point of fact that the orbits of stars in galaxies and the variation of the expansion of the universe at long distances have anomalies that at the very least cannot easily be explained by Newtonian or Einsteinian gravitation.
But as I tried to point out above, DM is going to be highly counterintuitive because it lacks EM coupling. Normal matter cooled to where it coalesced by radiating away EM energy (now visible as the 3 K background). If DM is truly only coupled to other matter by gravitation, it has no fast cooling channel and is likely still carrying a lot of the kinetic energy it had immediately post Big Bang. Gravity wave cooling is likely enormously slow for DM interacting with DM, somewhat faster where DM interacts with large massive normal matter objects, so that it WOULD weakly condense into blobs around galaxies, but those blobs are very, very “hot” and have no EM stickiness and hence no tendency to form DM “objects” that can bash things at all. I’m not at all certain my assertion of POSSIBLE blobs (likely nucleated on dense chunks of ordinary matter) holds up — it depends in some detail on what you postulate as coupling mechanisms with ordinary matter.
Neutrinos are a perfect example of something we can actually measure (because they do couple to ordinary matter, however weakly, and carry essential energy and momentum in decay events) and that even have a tiny mass (probably) but they interact SO weakly that if you didn’t do just the right experiments and go looking for the missing mass-energy, you’d never find them. A neutrino is happy going straight through the middle of the Earth as if it weren’t there, and certainly doesn’t get itself into thermal equilibrium with the Earth.
So your worries about “whacking around” and it being “obvious” are well taken — certain less invisible forms of DM with some sort of coupling would indeed whack around, thermalize with ordinary matter, and might well be observable if we looked in the right places. But if DM REALLY only couples gravitationally, it isn’t clear that there would be any small scale stable condensate, merely a weakly bound “gas” at a temperature far higher than escape temperature from anything but black holes and ultra dense objects.
No whacking, and maybe only TINY modulations of things like solar density as it moves through slightly denser clouds of the stuff swirling through the galaxy. But tiny modulations can produce big effects for things like solar fusion efficiency and gravitational compression, and the dense heart of stars is the kind of place one MIGHT have sufficient local coupling to gravity to speed up thermalization, even if thermalization is comparatively hot.
rgb
Ok, probably not a math error then (although I doubt anyone could get published easily if it was). But I thought it far more probable that it was a failure of our model of gravity.
If you need to invent something that can’t be seen to make the physics work then you aren’t breaking Ockham’ s razor – but it’s being blunted.
OK, so there may be some form of dark matter that only interacts by gravity, more elusive than neutrinos, and yet somehow not evenly distributed. There might be.
But it still looks like a fudge factor to me. Perhaps I lack the poetry to stare at the stars and say “I feel I understand”.
How does this matter behave with respect to inertia? Does it resist acceleration or does that not even apply when it is only affected by gravity. Is it at least a normal form of mass and not merely an additional constant in only one type of calculation?
Not the gravitational interaction of the sun with the planets, rather the interaction of the planets with the dark matter, derivatively dark matter with the sun.
========================
rgbatduke: “No, it doesn’t correlate well with the solar cycle over the short run record. The annual ~91 W/m^2 variation anticorrelates with the annual temperature variation — the Earth is coolest, on average, when it is closest to the sun and receiving on a daily basis some absolutely stupendous number of joules of TOA insolation more than it does in NH summer when it is farthest away and global temperatures are highest. The relaxation times associated with Stefan-Boltzmann type radiation cooling are hours (or at least, order of days) — and I while I’m happy enough to imagine the ocean introduces a lag in forced response as it buffers all changes, it is difficult to understand the lack of immediate response in land based temperatures to the reduction in forcing.”
I didn’t understand that. Doesn’t the lower heat capacity of all that Northern Hemisphere land, where the insolation concentrates during our summer, make up for the lower overall insolation at that time? I.e., less heat but also less heat capacity so higher temperature?
(By the way, I did enjoy the “science fiction.”)
“Tunguska-like episodes, lights in the sky at night caused by compression heating of chunks of atmosphere, ball lightning.”
From personal observation I am convinced that some ball lightning is produced with an ionized metal core. Some years ago I was stopped in traffic on a city street because of a medium voltage power line that was torn lose from high wind and swinging into the adjacent power line, every time contact was made the arc ball was so bright that I had to look away. After several cycles of this, the one line finally snapped and a very bright ball of ionized gas from 1 to 2 feet in diameter was ejected from the broken line at a ~45 degree angle and flew some 500 feet disappearing into a residential area. The object seemed to actually have weight as it traveled in an arc like that of a tossed ball.
This is up there with the argument that the Pliestocene started in the first place because of the closing of the Panama isthmus. Why? Because correlation, obviously, is causality! Except when it isn’t.
I’d be interested in your argument regarding the closure of the isthmus of Panama formation.
There’s strong evidence of a divergence in the salinity of the Atlantic and Pacific Oceans following the shoaling of the Central American Seaway starting about 4.2 million years ago.
Nice segue, Phil.
Phil.,
Panama closure theory has been debunked. The isthmus has been there since the Paleocene. See Jamarillo et al, GSA Bull. 2014.
I don’t have one. I’m just not completely convinced by the observation of supposed coincidence in time. It also doesn’t explain the subsequent deepening of the glaciation. These are geological times. The Earth is as close to being in a local equilibrium as it is possible for it to be in movements at this scale, they are ALREADY coarse grain averaged/smoothed at the data level over hundreds or thousands of years when you plot climate on a million year basis.
It is too easy to wave one’s hands. I can believe glaciation can be triggered at ANY time by a purely chaotic fluctuation in the Gulf Stream, as we do not understand and cannot predict or compute the thermohaline circulation NOW. So we can understand exactly how it worked in imperfectly mapped oceans 3.5 million years ago? So sure, I can believe it. I also doubt it. How, then, can you increase my degree of belief, if mere coincidence isn’t enough?
rgb
You should check out this paper Willis, apparently climate scientists do not properly understand astronomers, or how to use their data. Insolation in the polar regions is normally done incorrectly and can have large consequences. http://www.duncansteel.com/archives/996
The basic point is that climate modellers do not understand the time system used by astronomers and get the insolation wrong because of that. Duncan Steel did a sabbatical at my department last year and was a solid scientist.
That is an interesting contribution. Thanks for the link. About twenty years ago I read a paper in Science (I think) by David Thompson which discussed the need for better de-seasonalizing of long term temperature records, and I had the idea at the time that he had confused precession of perihelion with precession of the vernal equinox. Duncan Steel has shown my concern was not misplaced.
Thanks, William. I’m sorry, but I don’t think that his arguments hold water. For example, he talks of changes in the timing of the perihelion, saying:
And he’s correct about the phenomenon and the size, a quarter of a percent is about 0.8W/m2 … but the problem is, it’s not a change in total forcing. It’s just a change in the TIMING of the forcing. He seems to think that such a timing change is important. He points out, for example, that because of the change in the timing of earth’s closest approach to the sun, the northern hemisphere is getting more energy earlier in the year, which is true. As a result, he says:
But that totally ignores the fact that if that were the cause we would see earlier freezing, but we would also see earlier melting … and that is definitely NOT “just what is observed”.
As you point out, his claim is that climate scientists don’t properly understand astronomers … my point is that at least one astronomer doesn’t properly understand climate science. Shifting the timing of the energy makes little difference. For example, suppose that for some reason, all over the world the sun rose ten minutes earlier, and set ten minutes earlier … would that change how hot the day got?
The paper is interesting, but I don’t think his claims stand up.
w.
Let us suppose for a moment that Duncan Steel does not propose any change in total insolation, but rather only a change in the timing of its variations through the year. Then this would still be significant in the following way: additional insolation during the Spring leads to earlier Spring, which in turn leads to lowered albedo, which leads to increased absorption. In this sense albedo is a positive feedback.
However, the passage that I quoted from Steel in my comment below should dispel any idea that he does not also propose a change in total insolation. The sequence of causation is this: Differences in precession of perihelion and equinox lead to the earth presenting a larger cross sectional area to the solar flux when it is closest the sun. This increases the total insolation value.
You describe him as a solid scientist–i agree. He certainly raises an interesting point.
This is a great thread, thanks to Willis and all who participated! I’m off to read Scienceofdoom.
Heh, ask Muller.
=============
Hi Willis, Thanks for another interesting essay. D isotopes from ice cores can indeed be a proxy for paleotemperature, but, as you are aware, it is uncertain over how wide a geographical extent the isotope measurements from a single ice core, or from Antarctic ice cores generally, are applicable. This is why the comings and goings of ice ages are commonly defined not by proxy-derived paleotemperatures but by proxy-derived global ice volumes. 18O/16O isotope ratios in the calcium carbonate shells of oceanic foraminifera (forams) vary with, and so can be used as a proxy for, the total amount of snow and ice on the earth’s surface. Several readers have mentioned the paper by Roe (2006) (http://earthweb.ess.washington.edu/roe/GerardWeb/Publications_files/Roe_Milankovitch_GRL06.pdf) where the author argues using graphical data that variations in insolation in the middle latitudes of the NH during the last half million years or so are tracked not by the absolute value of the 18O/16O ratio in foram shells (i.e. by the actual volume of ice) but by the rate of change in the O isotope ratio (i.e. by the rate of change of ice volume). Roe’s approach makes sense when you consider that you can have high values of insolation coinciding with large ice volumes and so on.
Perhaps also worth mentioning in passing that Roe was not the first to come up with the rate of change theory. Journalist Nigel Calder had published a short and quickly forgotten paper in Nature in 1974 making much the same point as Roe. See Nature, Vol. 252, No. 5480, pp. 216-218, Nov. 15, 1974.
We’re getting Calder and Calder, for how long even kim doesn’t know.
================
Willis, at one of the meetings for the CLIMAP and SPECMAP projects I recall that John Imbrie who was co-author on the 1976 paper that confirmed the Milankovitch hypothesis, Variations in the Earth’s Orbit: Pacemaker of the Ice Ages, speculating that continental ice might some effect on the temperature signal that made it different from pure insolation. My 35-year-old memory of a passing remark in another life is dim, but I think he was thinking about what you’re questioning. At that time the research effort was focused on orbital parameters over long timescales. It seemed plausible that ice could produce both damping and lagging effects through changes in albedo, ocean currents, etc. that modified the orbital forcing. I also recall comments about harmonic reinforcement of cycles complicating the picture. Imbrie was a geophysicist and FWIW an early recipient of the MacArthur award.
If 100w in solar input only give 12 degrees difference from iceage to present day temperatures the 1.2 w forcing from co2 cant give more than 0,12 degrees Celcius warming. So a doubling of co2 would give a wopping 0,24 C !
Thought this might interest you Willis — a quote from Dr Lindzen during a climate seminar (AMERICAN PHYSICAL SOCIETY) about this subject:
Well, that all about Roe’s hypothesis sounds great, and I hate to contradict Dick Lindzen … but the problem is, when Science of Doom looked at the actual data … well, I’ll let SoD tell it:
As is far too common, we see good agreement for a while and then it goes totally out of phase. SoD’s two posts on the subject are here and here, take a look for yourself …
w.
“I did a Pearson correlation…”
A useless calculation based on an inappropriate technique for the data. Should have done a cross correlation over frequency.
This puts all the emphasis upon the incoming solar variable where as it may only be the triggering event. When a relatively speaking very minor event such as the little ice age can cause it to snow in July in the temperate zone one must consider the changing of albedo. And then there are the oceans, and the thousands of years of less solar effect involved in the M cycles. Like all climate effects the single variable approach will never give the answer and our planet is 70 percent water covered and we still do not understand its effect upon climate.
Still have not figured out how to get percent and parenthetical on this android!!
Thanks Willis. Very interesting article, as always.
All I can say is I’m glad we are out of the ice box now. What’s not to like?
Meanwhile, we ponder the reasons and try to forecast the future.
We should think and act locally, there’s plenty to do to repair local problems.
Willis,
Thanks, once again for a brief essay that starts interesting discussion. With regard to insolation, we can calculate the orbital parameters accurately, but we cannot translate to absorption, which is the relevant quantity, with anywhere near the same accuracy. Thus, your Figure 1 should come with a large error band, but there is no means of estimating one. As Bill Illis (Jan. 23, 4:03 am) has pointed out there is albedo variation, and albedo feedback involved. It is extremely difficult to place a credible value on albedo, I will bet; in fact, I am not sure when people quote albedo values if they are quoting point measurement at specific pairs of angles or hemispherically averaged values–by hemisphere here I mean over the entire hemisphere above the plane of ground surface.
Also, many people have noted that insolation averaged over the entire earth surface varies by less than your Figure 3, because one hemisphere (of the earth) receives more when the other receives less. However, the two hemispheres are not equivalent with respect to ocean/land distribution. There is almost no land mass at 65 south, but a lot of land mass at 65 N. Once again the relevant quantity has to be net absorption.
I think what people don’t take into account is the CHANGE in those cycles that happens during an ice age. The buildup of ice, I believe, changes the location of the rotational pole moving it a bit toward Ellesmere Island. People look at how the wobble of the axis looks today and try to basically pretend that it stays the same but I don’t believe it does during glacial periods. Remove 100 meters of ocean and deposit most of that on the land mass of what is now Canada and things change. The wobble changes and the location of the rotational pole changes. The Southern Hemisphere doesn’t change as much because there isn’t a lot of land mass to accumulate ice relative to the Northern Hemisphere.
Bottom line: Don’t assume the wobble stays the same during glacial periods as it is today.
Thanks to Willis and also to rgbatduke for his fanciful ruminations.
The current hypothesis is that we should see a swing of ~3°C for each additional 3.7W/m2. So according to the current thinking, a swing of 100 W/m2 which is maintained for a thousand years should result in a temperature swing of about 80°C (146°F) …
No.
Steven Mosher January 23, 2015 at 8:43 am
Steven, I get so tired of your drive-by blanket assertions. Please either provide more detail or don’t bother. Look, I know that you’re a smart guy (although to be fair, you were stupid enough to block my comments on your fanciful Facebook claims just because you couldn’t answer my objections), but here you can’t block me.
So how about explaining your point? You may be right, but at present there’s no way to know.
My point was that there is a seasonal see-saw between the NH and the SH, where for half a year you get more sunshine on one half, and in the other half a year vice versa.
Now, at 40 degrees N the size of this seesaw is about 100 W/m2 LARGER at some times than at others. Presumably, this should lead to a much bigger swing, summer to winter. How much bigger?
Now, you’re right that I should have used the transient climate sensitivity (TCS) rather than the equilibrium climate sensitivity (ECS) … if that’s what you meant. According to the models, TCS is about 70% of ECS. So to give us some cushion, let’s use half of ECS as instantaneous climate sensitivity.
That would give us an increase in the annual swings of about 40°C (73°F) … and we don’t see that swing in the records either. And if that was your meaning, fine, I’ve changed the head post to reflect that.
But who knows what you mean? I have great respect for your mental abilities, Mosh, but your drive-by posting habits suck bigtime.
w.
My guess would be that he is raising the issue that although radiation on specific parts of the globe vary by up to 100W/m2 the total radiation on the planet as a whole is much lower?
Mosher is right. Total insolation hasn’t changed by 100W, only the NH view of it. Meanwhile the reduction seen in the NH is increased in the SH and so globally there is no change.
Maybe this discussion explains why the IPCC doesn’t include Milankovitch in their computer models.
Of course, there is always the problem in ignoring Milankovitch changes of omitting a major swing in insolation levels. But then, what’s a 100 watt per square meter swing in insolation here or there?
Time-scale you say? But isn’t this about the accuracy of science and the future of our grandchildren?
Models that try to explain the ice ages do include Milankovitch. The big problem with trying to use Milankovitch to model ice ages is not that the Milankovitch changes are so big but that they are so small. The Milankovitch cycles iproduce almost no change in global average insolation.
Willis, WRT stargazing, Orion’s prominent to the south now after sunset & more interesting than many think. Actually further away from the galactic center than we are, but alot of prominent supergiants. Betelgeuse and Rigel are 20 solar-mass supergiants, but the most massive is the center star in the belt, Alnilam, at a whopping 40 solar-masses. Another 40-masser is the biggest star in the Trapezium, but it’s very young & dimmed by dust. Those stars are truly dangerous to life in the long-run but fortunately far enough away from us.
When you say “far enough away” do you mean far enough away that when they go super nova we won’t be swept away?
Kevin — right. Even bigger stars like Eta Carina (maybe 100 solar-masses) may even produce gamma-ray bursts from a hypernova explosion, but it’s prb’ly far enough away (6000 light yrs) to not be a concern.
The galaxy is a dangerous place and in active areas with huge stars a radiation hell-hole.
Thank Willis. I did voice my own doubts about this process a wile back. Glad to see you have looked at it. However….
Is the southern insolation graph the exact reverse of the one you have for the northern hemisphere? Would that southern graph of insolation provide a better fit, with the Antarctic ice-temperature record??
Also, I don’t see how violent swings in insolation can produce a coherent rise or fall in temperature over many tens of thousands of years. How can the temperature maintain steady trend, up or down, when the insolation has just swung back the other way?
Also, I still have problems with the ice sheets ending just north of London. The UK might be a cold place, but the summers can still be baking hot. How does an ice-sheet remain, under such conditions. I have no doubt they existed where we are told they existed, as I have seen the evidence for ice-ponds in Cheshire and drumlins in Northern Ireland. However, I always have in my mind very cloudy and cool summers, to allow these ice sheets to remain during the UKs warm summers without melting away.
Ralph
So then: a) it wasn’t hot at all in the area where London now stands; b) it did get hot (like at the terminus of Fox or Franz Josef glaciers in NZ), but the snowfall feeding the glacier at its source area and outward radiating path to its terminus exceeded the melt rate; or c) there was a combination of factors minimizing melt (such as persistent cloud cover over the body of ice) along the way. Note that there are plenty of photos online of people standing at the base of the NZ glaciers in shorts and t-shirts. Yes, I know NZ has alpine glaciers, but again, where did the Laurentide ‘start’? Trace its retreat to mountain-covered Baffin Island, where a remnant of that ice mass can be found in the Barnes Ice Cap.
Regarding the loss of ‘green’ area during the Pleistocene–has anyone calculated the trade-off between land lost to the ice and land gained by dropping sea levels 300 feet? A lot of that ‘new land’ from exposed continental shelf is in equatorial or subtropical areas that, even if cooler than today, could have been incredibly productive.
Lastly, I agree that we do need to question everything, including ice core data and all the assumptions guiding our interpretation of it.
Since Earth’s big heat sink is the oceans, that is where we need to be looking. But there is less than a decade of Argo data, and that is not high resolution, nor covering abyssal depths.
It is pretty clear that the onset of the Younger Dryas was caused by a Laurentide meltwater pulse into the North Atlantic that interupted the Atlantic thermohaline circulation for millennia, with global consequences. Who knows how many other mechanisms might be at work varying both the deep and shallow currents, both ‘hot’ like Gulf Stream and ‘cold’ like Humbolt that redistribute heat from the tropics polewards. Simple polar ice formation drives thermohaline circularion. Given crucial shallows like the Bering Strait (avg 60 meters deep now) that were basically dry land at the peak of glaciation (sea level 120 meters lower) (completely changing Arctic ocean circulation by closing it off from the north Pacific), it seems plausible that cyclic changes in ocean currents might be the main drivers of climate change on various timescales like OD events or the 100k yr ice age beat. How and why, dunno.
Great post, Willis. Elicited many thoughtful comments. So much for settled science.
No Rud, no meltwater impulse, that’s unsupported arm waving and you should know better.
The Pleistocene is full of temperature spikes like the dangaard (?) or whatever and the ice core data reveal the stepdown which inevitably followed such spikes.
Nothing new or unusual.
Study the reconstructed temp record of the Pleistocene, please, and you will see that there is a good reason to watch out for the arm-wavers.
Not armwaving. Is the most accepted explanation for the YD onset. See Broecker et.al. Nature 330: 318-321 (1989). Or http://www.ncdc.noaa.gov/paleo/abrupt/ which uses it as a tipping point example. Water from Lake Aggasiz entered via what is now St. lawrence seaway when the glacial icedam went.
Rud
Agassiz drained through the Traverse Gap into the upper Mississippi, which see. Gary Pearse is very well informed and can tell about L. Agassiz. Believe me, the YD was not due to a catastrophic glacial flood. It’s all bs and arm waving.
Consider: annually the rivers of Siberia pour meltwater into the Arctic Ocean which volume totals over 30 cubic km/day at the max flood. The Ob, the Indigirka, the Lena, other big rivers draining a vast continent (the Lena=19 c.km/day). Here is your freshwater flood bigger than any glacial outburst flood, but where is your temperature plunge? Arm Waving by idiots, Rud.
@Mpainter, you forgot the melt water that goes there from Canada as well, McKenzie river etc.
Asybot,
Yes, add another 2.5 cubic km/ day at max flood. Scientists get these ideas and then become enamoured of their pets and never test them against reality.
Cycles associated with solar activity, the shape of Earth’s orbit and position of the axis of the earth relative to the sun may overlap. One thing is certain CO2 has nothing to make things.
This is a more accurate picture except that it should be far whiter where the ice-sheets are (70% Albedo), whiter where the sea ice is (45% to 65% Albedo), whiter where the land is especially in the winter where there was snow on the ground (45% Albedo) and it should be browner in the summer since most of the planet was tundra, desert and grassland (25% Albedo) (as in the Amazon rainforest was only one-third the size of today and forests grew in the US southeast but nowhere else in the US etc.
Solar Insolation * (1-Albedo) = Net Solar Insolation. The Milankovitch Cycles are not going to do anything to the white areas except melt them slowly from the edges. If a Milankovitch upturn does net melt enough ice from the edges before another downturn hits, the ice age doesn’t end.
Albedo is the big driver of the climate history on the planet. The component that changes the Earth’s Albedo the most, is when there is “white” ice and snow. Rearrange the continents so that none of them are near the poles and we have very little white frozen water. Put all the continents over the South Pole and we have Snowbal Earth. Move Greenland just that last 80 kms further north and we have periodic ice ages depending on how much solar insolation varies at 75N combined with the resulting Albedo that develops.
http://i.ytimg.com/vi/AHHTIFMUXA4/maxresdefault.jpg
http://www.cpc.ncep.noaa.gov/products/stratosphere/strat_a_f/gif_files/gfs_t70_nh_f00.gif
As I noted there are more than a dozen paradoxes and anomalies that disprove the theory that orbital changes to insolation at 65N causes the glacial/interglacial cycle. (See my above comment for three in your face paradoxes). There is unequivocal observational evidence in the paleoclimatic record of cyclic abrupt climate change. The finding of cyclic abrupt climate change (both poles) was not expected. What is causing the cyclic abrupt change both poles is what causes the glacial/interglacial cycle.
Look at the paper I provided a link to above and below that shows there were 342 cyclic warming and cooling events in the Southern hemisphere with the same periodicity of the cyclic warming and cooling in the Northern hemisphere. What the heck is causing cyclic significant warming and cooling of the planet, both poles? Insolation changes at 65N cannot cause cyclic warming and cooling and most certainly cannot cause simultaneous warming and cooling of both poles. Insolation is 180 degrees out of phase comparing the Northern hemisphere to the Southern hemisphere, come on man, the insolation theory at 65N is obviously an urban legend.
http://wattsupwiththat.files.wordpress.com/2012/09/davis-and-taylor-wuwt-submission.pdf
http://wattsupwiththat.com/2012/09/05/is-the-current-global-warming-a-natural-cycle/
The field of ‘Paleoclimatology’ is riddled with urban legend theories and old disproved mechanisms. There is no formal structural process in ‘pure’ science to remove incorrect theories by summarizing the paradox/anomaly observations that create irreconcilable problems for the theory/mechanism (the theories/mechanisms in question are dead, deceased, not viable, urban legends), to summarize all the data in a holistic manner, to force the field into crisis. A pernicious error in a field of science is to have multiple fundamental errors and incorrect theories, rather than no theory and the specialists are forced to try to solve the problem. It is impossible to solve a problem if the correct theory/mechanism is not considered. I will include a comment on the urban legend that changes to the Northern Atlantic drift current is the cause of the Younger Dryas abrupt cooling event or is somehow the cause of the Dansgaard-Oeschger cycle or is any way connected to the Dansgaard-Oeschger cycle.
The correct forcing mechanism (there are more than 50 logical pillars to support that assertion, i.e I did not guess, I went from field to field found the paradoxes/anomalies and solved the dang problems (multiple fields, urban legends/paradoxes all over the place) which makes all of the anomalies/paradoxes go away, the sun is different than believed, that is a big thing in terms of the scientific impact on cosmology and practically due to what is currently happening to the sun) that is causing abrupt cyclic climate changes on the earth is immense, cyclic changes to the geomagnetic field strength (factor of two to three less intensity in the glacial period and more in the interglacial period) and orientation that is caused by a cyclic immense change to the sun, that occurs after the solar magnetic cycle has been interrupted (there is astronomical observational evidence and piles and piles of astronomical paradoxes/anomalies to support the sun is different assertion). The immense cycle change to the sun causes the cyclic abrupt climate change (the geomagnetic field and the solar heliosphere block/deflect high speed cosmic particles that strike the earth causing ions which in turn changes the amount of cloud cover on the planet and cloud properties that changes cloud albedo and cloud lifetime) are modulated by the orbital parameters and are directly affected by the surface area and the location that is covered with ice sheets which explains why roughly a million years ago the glacial/interglacial cycle changed from a 41,000 year cycle to a 100,000 year cycle.
There is direct proxy evidence that cyclic abrupt changes to the geomagnetic field strength and orientation has occurred in the past (there needs to a mechanism explanation as to why the abrupt, too fast, too large, cyclic abrupt geomagnetic field changes occurred in the past). Interestingly or surreally the geomagnetic field intensity is currently/suddenly dropping at 5% per decade (it was previously dropping at 5% per century, the increase the rate of the drop in the geomagnetic field intensity to 5%/decade is a paradox, not possible if the primary cause of the geomagnetic field is changes in the liquid core, there are three more paradoxes associated with the core mechanism) which is 10 times faster drop than the last 200 years and is 10 times faster than possible if the primary cause of the change is liquid core changes, i.e. Something significant and unexplained is currently happening to the geomagnetic field, abrupt climate change cooling is not a theoretical problem).
Svensmark’s mechanism and the time delay for the liquid core to integrate rapid surface forcing to the geomagnetic field provides an explanation as to how an immense cyclic change to the geomagnetic field intensity and orientation would cause abrupt climate change on the earth, such as the Younger Dryas event (Last major Heinrich event at 12,800 yr BP, the 8200 yr BP event has a minor Heinrich like event) when the earth went from interglacial warm back to glacial cold in less than a decade for 600 years and then abruptly went back to interglacial warm.
Comment: The ‘Quaternary’ is the geological name for the period, the last 2.7 million years, in which ice sheets started to form in the northern hemisphere and the start of the global north and south glacial/interglacial cycle.
http://www.esd.ornl.gov/projects/qen/transit.html
This one chart proves that none of your objections is worth a hill of beans: http://en.wikipedia.org/wiki/Milankovitch_cycles#mediaviewer/File:Vostok_420ky_4curves_insolation.jpg
–AGF
First off the obliquity factor has to be factored into all of this when it comes to Milankovitch Cycles which show the tilt varies and this item has to be evaluated along with eccentricity of the orbit of the earth and precession, but Milankovitch Cycles are but one part of the Ice Age puzzle.
In addition the initial state of the earth’s climate( land arrangements ,elevation, magnetic field ,ice dynamic, random terrestrial events) , internal variation within the sun itself have to be taken into the account, along with the random, chaotic ,non linearity aspects of the climatic system of the earth and the randomness of outer space (say within 20 light years of earth) which is why x+x does not equal an x outcome when a given item changes in a given way that has an effect on the climatic system of the earth.
The one item cause giving an X climate result is not going to work.
In addition the climatic system of the earth is always trying to seek a balance which is why it is very hard to change the global temperature as a whole but not necessarily as hard to change it on a regional basis. In addition a paradox for lack of a better word is present which is in the grand scheme of things the climatic system of the earth is quite stable but it only takes a very small deviation from this stability to cause a drastic climate change to some regions of the globe.
Remember during Ice Ages the temperatures for many parts of the globe were not effected only certain regions and those being mostly the N.H. down to around 40 N latitude.
Then as to consider other abrupt climatic changes which can not be connected to Milankovitch Cycles per say because they occur and end much to rapidly to be correlated in a direct fashion to this cycle.
Panama isthmus closing changed salinity in the Atlantic. Atlantic is now the saltiest major ocean. http://polar.ncep.noaa.gov/global/nc/?-global-salinity-000-small-rundate=latest
Changed salinity will probably change global thermohaline circulation. Changes in the thermohaline circulation will have significant impacts on the Earth’s energy budget and climate.
The average temperature of the world ocean is only 3.9 °C. A well mixed ocean will be very cold for centuries or until it stratifies again.
Only the ocean have the heat capacity needed for fast climate change and the water moves around.
The very fast changed condition from glacial to interglacial periods may be to changes in the global thermohaline circulation. Wich also explain the fast paleo changes in atmospheric CO2 levels.
My bet is on the Benguela current impact on northbound currents in the Atlantic.
Northbound current is also a northbound flux of energy towards the arctic region.
http://polar.ncep.noaa.gov/global/nc/?-eqatl-temperature-100-small-rundate=latest
Consensus and settled science:
Sorry that was meant for tips and notes. Mods, remove please if you like.
I think Milankovich Cycles, the Initial State of the Climate or Mean State of the Climate , State of Earth’s Magnetic Field set the background for long run climate change but can not explain all the short term abrupt climatic changes which I think are tied in large part to the Initial State of the Climate which you see I am using as a factor for both long term/short term climatic changes.
The initial state of the climate (how close the climate is to the inter-glacial/glacial threshold) goes a long way in determining how effective a given force may be on the climate and how much of a change in that given force on the climate is needed to give a particular climatic outcome.
In addition the initial state of the climate takes into account random and the given state of terrestrial /extra- terrestrial events at a given time ,land/ocean arrangements all of which can cause the non linear climatic system of the earth to undergo radical changes at times of seemingly little forcing being applied to the climate system, or under go little change with that same amount of forcing or even a greater amount.
It’s clearly a clock circuit. So, in order to predict the circuit’s behavior, we’d need to understand what are the actual components in the circuit. I think we don’t really have a clue what they all are. One thing I would challenge the insolators with is, how do we know that temperature is more important than accumulation and the areal distribution of the accumulation? Here is food for thought. Some of the most amazing snow pack I’ve ever seen here in CA was when we had a strong positive ENSO. In reality, during a strong ENSO temperature is elevated above normal and the snow level tends to be 1 to 2K feet higher during the typical snow event. But the volume …
Everyone ought to read the paper which Mr. Handler references. It is 49 pages long, I warn, but it is quite readable and immensely interesting. Duncan Steel, author of this paper, offers two important things. First, that climate modelers have mis-understood how to apply solar insolation values from tabulated sources, and the correctly calculated values provide a forcing that is of the correct sign and larger magnitude than is needed to explain warming of recent centuries and also explain observations of climate change differences between the earth’s two hemispheres.
Second, he provides a useful discussion of albedo, and uses data from Aqua to calculate earth averaged values.
Assuming reasonable albedo values he then runs an experiment in absorbed energy between 1750 and present day. Here is the take-away point.
Moreover, here is my nomination for a climate quote of the decade…
Climate modelers are using enormous resources, and very powerful computers, to calculate the effects of climate forcing to a supposed level of uncertainty that one cannot justify on the basis of the uncertainty of foundational concepts. This is the very thing we tell engineering student not to do in engineering 101 through senior capstone design.
Kevin Kilty quotes Duncan Steele as saying: “Recall that the new IPCC (2013) estimate for the effect of AGW since the Industrial Revolution is 0.17 per cent of the solar flux at our distance from the Sun.”
Well that does not do much for Steele’s credibility. IPCC puts total anthropogenic forcing at 2.3 W/m^2, which is just under 1% of the total insolation of 240 W/m^2.
Haven’t actuall looked at Steele’s paper since I had trouble downloading it.
Ask yourself if there is a difference between flux and insulation.
Insolation
Willis,
As aligned in your graph (figure 3 above), there doesn’t appear to be much correlation between Insolation and Temperature. However, if you realign them with the Temperature of -10c being equal to the insolation of 575 Wm2 then there is a correlation, even between the major temperature peak during the low insolation peak of 400K years ago and the similar high temperature peak during the similar current low insolation peak
Havn’t had time to read all the comments, but…
There is a nice little book on this that gives the history of Milankovitch and along the way also explains the theory rather well. It isn’t just “how strong the sun shine is”…
http://books.google.com/books/about/Ice_ages.html?id=GIxRp9fRDGwC
Ice Ages: Solving the Mystery. By Imbrie and Imbrie.
The key bit most folks miss is that it is NOT how strong the sunshine is. It is how long the sunshine is strong…
When summer happens at apogee, there are more summer days than when it is at perigee. Thus more melting days.
So interglacials tend to happen when summers are furthest from the sun, and with slightly less sunshine due to that distance (but a whole lot more hours of it, and shorter winters too).
The book is a good read in any case, and still points out some of the loose ends, like the 41 ky vs 100 ky cycles change. IMHO that is just due to it being warmer in the past and some more minor ‘warm times’ were good enough to melt the polar ice at the N. Pole. Then things got colder and the weaker ones were no longer enough warmth. (That is in keeping with the general cooling trend observed, too).
Now we only get warm enough to melt N. Pole ice on the bigger 100 ky rises.
Eventually even that may not be enough and it is Snowball Earth again…
Oh, and there were also land form changes (Panama) and ocean current shifts that likely helped.
Panama is out. Recent study (Jamarillo et al GSA bull.2014) shows that the isthmus is a strip of continental terrain since before the Paleocene, according to dating. No seaway, no proto Gulf Stream, none of that .
Care to give a better reference to that?
What problems do you have with the reference?
I beg your pardon, I misspelled; should be Carlos Jaramillo et al GSA Bulletin 2014. NOT Jamarillo.
This was a big study funded by the Smithsonian Tropical Research Institute of Panama. It identified at the neck of the isthmus granites of the Paleocene intruded into a basement complex and uplifted and eroded by mid Eocene times. The Isthmus is apparently a strip of continental crust like Cuba or the Florida Peninsula, an accident of continental drift.
So the isthmus has always been there and the hypothesized closure of the Panama seaway and redirection of the proto Gulf Stream falls to the ground.
Most likely it is not just ONE thing triggering initiation/termination of Glaciation, but a multiple of forces all hitting a certain beat at the same time. This happens quite often in other areas of nature.
Possibly, but it is multiple very slow, very persistent forces in that case. The current ice age has had a gradual onset and has persisted for three million years with brief interglacials punctuating the ice, with the temperature lowering and persistence increasing of the glaciation intervals very smoothly throughout.
That smooth variation is actually remarkably difficult to explain, and yet it is obviously key to understanding the entire phenomenon. The system is clearly bistable, which means that underneath all of this there is a fairly well-known and reasonably well-understood system of differential equations that have an implicit description of the local equilibrium in both the warm and cold phase. A smooth variation in the stable cold phase to colder and colder temperatures is very, very difficult to explain. The closest that I can come to a hypothesis is that it has something to do with the cooling efficiency of the oceans that slowly, slowly alters with continental drift in a very systematic way, but there are so MANY alternative hypotheses — gradual alteration of atmospheric chemistry, new physics (dark matter, galactic cosmic ray background variation, very long period modulation of the sun’s output as it moves through galactic dust clouds, space aliens, God’s Will, pink unicorns, or just plain nonlinear dynamics with a life of their own).
I’m not even sure we CAN find sufficient evidence to accept or reject any of these hypotheses.
When I was young, I absolutely loved dinosaurs. I read every book I could get my hands on on paleontology by the time I was in the third grade, and not just children’s books, either. Ditto astronomy. I am struck by just how much of what was taught as “settled science” back in the 1960’s turned out to be complete bullshit, and how many of the alternative explanations that were taught as settled science in between turned out not to be as solidly supported as people might have liked to believe at the time since. The closing of Panama is just one in a long line of things that might — or might not — have happened. It isn’t easy to make completely defensible inferences from what the Earth leaves us after thousands, millions, and tens or hundreds of millions of years, because while some parts of the surface are comparatively stable, other parts are constantly churning and quite new, with things being cast up or pressed down. The Earth is not really “solid”; it just flows on geological time. It is so very easy to see some evidence here or there and overextend it to a complete theory of all sorts of stuff, only to find that the evidence one was basing the whole story on was incomplete or incorrect.
rgb
Re. Painter’s Panama: the critical evidence is paleontological: edentates evolved in isolation in SA until a few million years ago when NA animals moved in. There’s really no question about this. –AGF
agfosterjr,
I am aware of the paleontological side of the question. Where was the sea barrier? The isthmus of Nicaragua or the Isthmus of Tehuantepec? Or it could have been the Isthmus of Panama, with the most likely place at its juncture with S. America, the Atrato Rivet system. In any case, there would have been only shallow depths and no deep seaway.
There has been a heap of conjecture concerning the ice age piled on top of Paleontological evidence and it now falls under the weight of this study.
No one seems to have mentioned the possibility of the sun being powered by variable strength Birkland currents coming out of the center. .They would explain changes in sun and changes of earth’s warming into ice ages and back to variable warming.
That’s because (if I understand what you are saying) there isn’t any possibility of this being correct. The sun is “powered” by thermonuclear fusion taking place in its core. If one looks out at the night sky, one can see that this fusion takes place remarkably consistently and powers similar sized objects in similar ways and at similar temperatures. Birkeland currents are simply charged particles flowing along the magnetic field lines coupling the earth’s magnetic field to the Sun’s; back at the sun they are part of its already enormously complex magnetic field. The variations in this field (responsible for things like sunspots and coronal mass ejections) do modulate the surface state of the sun and do have various effects on the Earth (modulation of atmospheric neutron counts etc) but so far nobody has constructed a truly convincing model for how solar activity can modulate Earth temperatures. The biggest problem is that the effects themselves seem far too small to create the large responses attributed to them, followed by the substantial problem that there is no clean linear relationship between things like sunspot activity and global temperature, so one needs at the very least a complex multivariate model that is both more difficult to construct and to justify or verify in order to explain the times the sun is active but it isn’t warming and vice versa, even over only the last hundred-plus years where we have moderately good records.
rgb
Willis, you need to check the astronomical specialist lierature, which proves the MC cycle effects:
Or falsify the literature: paper from. MASSON-DELMOTTE, V. et el: GRIP Deuderium Excess
Reveals Rapid and Orbital-Scale Changes in Greenland Moisture Origin, Science, vol 309 (2005),
no. 5731, pp.118-121…..here: especially figure 1: Obliquity fluctuations.
I absolutely see a correlation. I don’t have the data, and I don’t have the time, but just looking at the overlapping graphs, you can see that, for the last 500k yrs, they trend down and up together. The only variance from the trend is around 220k yrs ago where the temp trend starts decending while the isolation upticks once more. But this also correlates with the largest spike during a temperature decent.
Willis, I can confirm Lubos Motl’s comment that Lindzen has looked closely at Gerard Roe’s analysis and is completely convinced by it. Lubos post http://motls.blogspot.ca/2010/07/in-defense-of-milankovitch-by-gerard.html was mentioned above, but I don’t think that you paid enough attention to it.
One possible difference in approach is whether one regards d18O values as a proxy for “ice volume” or “temperature”. I haven’t parsed Roe’s article, but the diagram shown in Lubos’ article is very convincing.
http://lh4.ggpht.com/_4ruQ7t4zrFA/TDL7RSCEgZI/AAAAAAAAEGE/0HeA3XYGVmM/milankovitch-roe-fig2.JPG?imgmax=400
From my own reflections on the data, early Holocene NH summer insolation was very elevated and its impact on the ice sheet was enormous. The proxy evidence for the Holocene is accumulating rapidly and in my opinion was underreported in AR5, especially given the overemphasis on Mannian reconstructions.
Steve McIntyre January 23, 2015 at 11:45 am
I didn’t comment at all on Lubos’s post because I didn’t see the link … however, I did discuss Science of Doom’s two-post critique of Roe’s hypothesis, which is here and here. I’d be interested in your comment on his take. He says, for example:
I note that Lubos did NOT actually look at the data himself, he just commented on the Roe paper … whereas SoD did look not only at the data that Roe used, but at the latest update of that data.
And looking at SoD’s analysis, I can’t find any fault in it … but then your eye is keener than mine, so I’m much interested in your take on it.
Best regards,
w.
Re albedo: Graeme Stephens, an accomplished climate scientist, has pointed out that SH and NH albedos are very similar despite very different land-sea arrangements.
Which hasn’t stopped one single person from telling me that the explanation for counterphase correlation between the annual insolation peak and global average temperature is due to variations in NH and SH albedo, but hey, what are facts in the face of a good argument?
The annual variation is roughly 91 Watts/m^2, too, which is absolutely enormous compared to the forcing attributed to CO_2.
Personally, I think that this is moderately incontrovertible evidence that simple linearized models for “sun heats earth” are naive in the extreme — they might capture the average in some sort of imaginary greybody limit, but the actual global climate dynamics can overcome stupendous differences in insolation and move the global average temperature the wrong way compared to the actual incident energy flow.
People comment on how much the earth is supposed to heat due to the tiny, tiny imbalance associated with increased CO_2 while failing to remark upon or adequately explain an actual annual heat imbalance almost two orders of magnitude greater.
Sigh.
rgb
But the summer is shorter which cancels out the extra insolation.
??? SH albedo is highly variable as far as sea ice goes; stable over the long term. NH albedo is variable over the long term. There is no Pleistocene hemispherical albedo symmetry. –AGF
Milankovitch Cycles are only good for the general climate trends but fail for all the abrupt violent short lived climatic changes.
In addition to the issues raised by Willis, the Milankovitch theory is fraught with a lot of other problems, (too many to fully discuss here). But, here are a few. First, let’s look at the basis for the theory—how good is the correlation with glaciations and interglaciations and how good is the dating? There are three cycles: (1) change in the tilt of the Earth’s spin axis-41,000 year cycle, (2) precession of the equinox-21,000 year cycle, and (3) eccentricity of Earth’s orbit-96,000 year cycle. All affect the distribution of solar energy per unit area reaching the Earth. Since each of the cycles has a different length, the sum of all three will sometimes be additive and at other times will cancel each other out. So at any given time, the sum of the three cycles will be different than at other times. To make things even more complicated, different weights can be assigned to each cycle to maximize the overall effect (e.g., you could say that the 41,000 year cycle is twice as important as one of the others and this will give you a different glacial/interglacial cycle.
Another issue is how good is the dating of the glacial/interglacial cycles? The Antarctic oxygen isotope curve is not well dated beyond the range of 14C dating (~40,000 years). So dating the ice hundreds of thousands of years is at best a very rough estimate. So where did the ages of glaciations come from? The ages of astronomical cycles can be calculated, but how can they be correlated with glaciations/interglaciations? This was done by identifying glacial cycles in deep sea cores using oxygen isotope analyses of microfossils and deriving a glacial/interglacial curve. But there is no good way to date the deep sea cores beyond the range of 14C dating. So what Imbrie and others did was to stretch and compress the astronomic and deep-sea curves until they got the fit they wanted. Then, knowing the chronology of the astronomical cycles, they applied this to the deep-sea cores they had just correlated to get a glacial/interglacial chronology. Then they concluded that the correlation of ages of the glacial/interglacial cycles to the astronomical cycles proved that Milankovitch cycles caused glaciations!
Another serious problem came to light with the discovery of Dansgaard-Oeschger sudden climatic reversals during the last glaciation. These were so abrupt that they could not possibility be caused by Milankovitch changes and since the magnitude of the Younger Dryas changes were from full non-glacial to full glacial temperatures and back to full non-glacial temperatures, it is clear that something other than Milannkovitch cycles can cause Pleistocene glaciations. To further complicate the issue, the Southern Hemisphere should be out of phase with the Northern Hemisphere. Strong evidence exists that glaciations in the Northern and Southern hemispheres were not only synchronous but, at least for the last glaciation, almost exactly simultaneous. Although a number of possible explanations have been put forth to explain this vexing anomaly, so far none has proven satisfactory, and, as Mercer (1984) put it, the globally synchronous climatic change “remains the fly in the ointment of the Milankovitch theory: the last interglacial and the last glaciation both appear to have affected the Northern and Southern hemispheres simultaneously, and with comparable severity.” This is also true of the Dansgaard-Oeschger reversals, which are almost exactly simultaneous in both hemispheres.
These are only a few of the issues related to the Milankovitch theory of glaciations. The bottom line that there is a lot of negative evidence related to Milankovitch cycles as the cause of ice ages and no positive proof.
Time will tell
” no positive proof”
###
Or rather, positively no proof.
All well said, and I agree. There is too much unexplained, the explanations that seem to “work” are often rather forced, and it is absolutely clear that it isn’t a predictive theory because any rule one abstracts abruptly changes or fails without warning. It also doesn’t explain, as I mentioned above, the gradual deepening of Pliestocene glaciation and temperatures, or the transition from roughly periodic/symmetric glacial/interglacial episodes to a highly asymmetric 90 ky of glaciation followed by 10 ky of interglacial that is observed over the last million years or so. At this point it wouldn’t (seem to) take much to erase the 10 ky interglacials altogether and remain in cold phase for a million years or three until SOMETHING we do not understand changes. Or to go the other way.
With luck nothing will happen abruptly in the near future either direction, but from what we can infer glacial melting or refreezing can happen remarkably abruptly on a geological scale, with rather enormous variations over as little as a century. And no, I don’t think we can explain any of this in a credible, evidence supported way, however pretty the epicyclic theories are that supposedly are the root causes.
rgb
Milankovitch Cycles have to evaluated against the back drop I present below.
In addition the initial state of the earth’s climate( land arrangements ,elevation, magnetic field ,ice dynamic, random terrestrial events) , internal variation within the sun itself have to be taken into the account, along with the random, chaotic ,non linearity aspects of the climatic system of the earth and the randomness of outer space (say within 20 light years of earth) which is why x+x does not equal an x outcome when a given item changes in a given way that has an effect on the climatic system of the earth.
The one item cause giving an X climate result is not going to work
Willis, it may not come to you as a surprise but as these data were available ten years ago, those observations have been made by others too, especially the missing 400Ky Milankovitch spike but other than that it’s obvious that the frequency spectrums are rather different on a large scale, although occasionally also surprizingly accurate on a smaller scale, for instance for the last 90ky. It’s obvious that the 100ky cycle is not from Milankovitch, hence one of the very few things that Spencer Weart happened to get right is:
“As one reviewer said in 2002, “The sheer number of explanations for the 100,000-year cycle… seems to have dulled the scientific community into a semipermanent state of wariness about accepting any particular explanation.”
source (but not peer reviewed!): http://www.aip.org/history/climate/cycles.htm
But I think one should be focussing on the oceanic 100ky cycle for the last million years (not before), which is likely closer to the cause of the ice core 100ky cycles.
Willis,
Global temperature will respond to changes in global forcing. The differences in insolation at different points on the globe do not cause the same level of differences in temperature. Global changes caused by the Milankovitch cycles are quite small – the below site suggests that the changes globally are between 340 at minimum and 343 at maximum.
http://www.climatedata.info/Forcing/Forcing/milankovitchcycles.html
David
Willis,
I particularly draw your attention to this graph:
http://www.climatedata.info/Forcing/Forcing/milankovitchcycles_files/BIGw01-milankovitch—cycles.gif.gif
Notice that insolation changes in July at 65 North are large. Insolation changes at 65 North for the entire year are smaller. Insolation changes over the entire year over the entire earth are smaller still.
David
If Gerard Roe’s work was so good, then why hasn’t it been projected forward in time. Perhaps Roe wasn’t sufficiently convinced by his own work. Without a projection then it is essentialy useless.
And I apologise: this is what I was responding to in your post:
“Now, I found that surprising. I hadn’t realized the size of the swings. The cycles are about 21,000 years long and the swings are quite large, up to 100 W/m2 from trough to peak. So IF the temperature is following the forcing as the current hypothesis claims, a swing of 100 W/m2 is certainly large enough to cause a very large swing in temperatures. The current hypothesis is that at equilibrium we should see a swing of ~3°C for each additional 3.7W/m2 of forcing. However, we’re talking annual swings. Transient climate sensitivity is about 70% of equilibrium sensitivity, so I’ll use 50% to give some cushion. So according to the current thinking, a swing of an additional 100 W/m2 which is maintained for a thousand years should result in an increased annual temperature swing of about 40°C (73°F) … and we don’t see anything in the geological records even half that size.”
Thanks, Willis and respondents for a fascinating post & discussion…..however, while a simple answer seems unlikely and a unified consensus (here anyway!) seems even less likely….. is, dare I say it, variable solar output the (long-suffering) elephant in the room?
You can fit the Milankovitch Cycles to the Ice core temp quite attractively, though you would lose a lot of money betting on it for extended periods:
http://www.robles-thome.talktalk.net/Milank1.pdf
A key point not often noted is that the variation in eccentricity actually changes the total annual insolation globally, not just its distribution.
R.
Thanks for showing us what professional climate workers who are paid to do this don’t. That mismatch between EPICA and insolation history is puzzling and they should dig deeper into it.
The Milankovitch insolation driver argument assumes that the sun puts out a constant amount of energy. Perhaps that assumption is wrong. Perhaps the sun itself has cycles to be considered.
Also, I wonder about the overall frequency domain characteristics of the ocean-atmospheric oscillator network. We barely knew what ENSO was 50 years ago and only recently started to comprehend PDO, AMO, etc. I would wager real money that such oscillations are not the only ones. Ones with much longer periods are highly likely. The “Ice Age” – interglacial cadence may simply be a long period oscillation of this network.
This graph at Wiki, a colored adaptation from the original Vostok report, doesn’t leave much room for argument over correlation: http://en.wikipedia.org/wiki/Milankovitch_cycles#mediaviewer/File:Vostok_420ky_4curves_insolation.jpg
Comically that report called it evidence of GHG’s running the show. The multi-thousand year lag between insolation and T is of course explained by the albedo lag–it takes thousands of years for the ice to accumulate or melt. When averaging insolation it’s important to specify the period. The most important figure is the roughly 80W/m^2 insolation difference in June at the edge of the ice–on the ground, at noon, on a clear day. All the ice has to do is melt faster than it snowed. And the T difference between a mile high ice field and a pretty lake 10ky later is what? 50K? The cores measure albedo. –AGF
Hi Willis,
Part of the explanation for a lack of obvious effect due to the 20,000 year cycle in high latitude insolation is that while the insolation does change as you note, the length of the summer period moves in the opposite direction. So while it is true that the southern summer currently has about 7% higher maximum solar intensity, the length of that higher intensity (the length of the southern summer) is considerably less than the northern summer… which has lower solar intensity. (Kepler’s laws of planetary motion.)
I suspect the key WRT ice ages is the total solar energy received during the warm half of the year…. which doesn’t change so much with the 20,000 year precession cycle.. Of course, that doesn’t answer why there are in fact ice age cycles. My guess is that ice ages are paced by crustal depression during glacial accumulation, which very gradually lowers (and so warms) the ice sheet melt front. Once the ice front starts to melt, ever more depressed land is exposed, and the melt tends to run away. When the ice sheets are gone, the slow continuing rebound of that now exposed land leads to a gradually cooler local climate and eventually the slow formation of glaciers/ice sheets again. The increase in albedo from ice/snow accumulation likely contributes to ‘locking in’ the ice age for a long time; the crustal depression has to become pretty extreme before the system becomes “unstable” and reverts pretty quickly to an interglacial.
.
The interesting thing is that the magnitude of the crustal rebound (up to 400-500 meters) when combined with the lapse rate (6C to 10C per Km, depending on local humidity) seems enough to ‘trigger’ season-to-season snow/ice accumulation at high latitudes.
(BTW, I am pretty sure there have been published papers, including some recent ones, which suggest an important contribution to glacial cycles from crustal depression/rebound.)
One piece of the puzzle that I have not seen anywhere and perhaps we do not have is the variation in solar output over these longer time scales. It is not likely to be very large percentage-wise, but is likely to be yet another confounding factor in trying to interpret the causes of climate change.
Most are speaking of what causes the ice ages. Isn’t that backwards? The natural state of the Earth is what we call the ice age. The question is what causes the interglacials. Increased insolation at 65 N will melt the great NH ice sheets but only when NH summer is at perihelion and eccentricity is low. Those events happen to come together about every 95-100K years. Since we know that to be true, and we know that interglacials happen about every 100K years at that time, is this a case of it’s right in front of our noses or a case of correlation is not causation?
Forgot to mention obliquity with also has to be at maximum. So max obliquity, low eccentricity, NH summer solstice at perihelion. All three must come together, not just two. Happens roughly ever 100K years. Lasts until obliquity lowers to 23 degrees, summer solstice moves away from perihelion and eccentricity rises.
TIF – Actually if you review geologic time up to the Pleistocene, you will find that the natural state of the Earth is not “ice age” but mostly “hot house”. It is true that we live in an interglacial period (past 10,000 yrs) and that the climate state for most of the past 2 million years has been mostly glacial/ice age, but the earth is 4.5+ b years old and most of its time, based on the rock record, it appears to have been ice free (or at least global ice free. Alpine glaciation excepted).
That’s true. I was referring to only the last 2-3 million years because that’s the period which has the interglacials we are talking about.
Many geologists theorize that the earth was covered completely by a shallow ocean about 2.5 billion years ago. No continents. Over geologic time periods plate tectonics are thought to have played a decisive roll in climate, resultant geothermal activity, continental uplift, ocean plate colapse, continental migration, all playing rolls in climate along with solar output changes and orbital drift. Lots of variables.
Willis,
I have not read all the comments so I don’t know if this is covered. In the main post you compare Northern Hemisphere insolation with Antarctic temperature. But you should recall that the pattern of Southern Hemisphere insolation is the inverse of that in the Northern Hemisphere. One can expect that Southern Hemisphere insolation will have some local impact on Southern Hemisphere temperature, including the interior of Antarctica. Consequently while the Northern Hemisphere ice-age driver dominates the accumulation and ablation of ice in North America and Europe, it is not the only significant factor for Southern Hemisphere temperature. One should not expect a perfect match between Northern Hemisphere insolation (and Ice volume) and Antaractic temperature. A reasonable match is the best that one should expect.
If you look at the smaller swings in polar temperature recorded over the last 100,000 years, more particularly those swings that last just a few thousands of years, there is in fact an anti-phase relationship between ice core records from Greenland and Antarctica.
Willis,
What Don Easterbrook say makes a fair bit of sense. The riddle of the cause of the ice ages has not been fully solved by anybody. The full answer is still a work in progress.
I think that orbital cycles constrain maximum temperatures in the summer and minimum temperatures in the winter so that if we went back to the holocene climate optimum maximum summer temperatures would be significantly higher than they are now.The maximum summer temperature has not risen significantly in the UK in the last hundred years while the average temperature,which climate scientists focus on,has risen significantly.
AAAAHHHHH,
Willis , please it is Friday, I prefer a story about some of your travels with the beautiful “Ex-Fiancee” thanks.
Tom in Florida
January 23, 2015 at 8:12 pm
Forgot to mention obliquity with also has to be at maximum. So max obliquity, low eccentricity, NH summer solstice at perihelion. All three must come together, not just two. Happens roughly ever 100K years. Lasts until obliquity lowers to 23 degrees, summer solstice moves away from perihelion and eccentricity rises.
Reply The problem is the glacial /inter-glacial cycles were not 100k until very recently (the last 800000 years) prior to this glacial/inter-glacial cycles seem to correspond to obliquity.
In addition the globe as a whole tends to cool or warm, in other words the N.H. and S.H. are in sync.
The underlying issue is about this interglacial and how it compares to the most recent ones. If the cycles of the last 800,000 years continue as they have need not concern ourselves with what happened prior to that. Now I am sure someone will want to address what would happen if these current cycles change. If they do, there is nothing we can do about it. The same goes for any major changes in solar output. We cannot influence that so there is no need to worry about it.
…… I just had an interesting thought while composing this reply. The evolution of humans began in earnest around the time of the current time periods of glacial – interglacial changes. I wonder if there is a connection.
There seems to be more of an issue with the “standard” approaches to comparing correlations. Precessional is the big dog but 65N is pretty limited for the general “climate” thing. Ocean insolation is the ticket.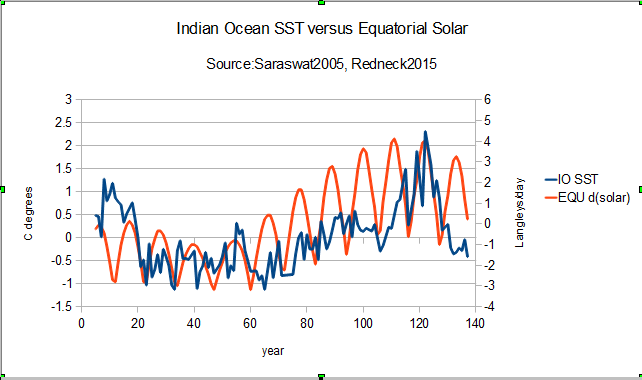
That is about a 50% correlation between equatorial solar variation and Indian Ocean SST as reconstructed by Sasaswat et al. Try using all the latitude bands and compare to your favorite reconstruction. I use Peak insulation not average, because that is the way I think is best.
Thanks, Cap’n. I gotta say, I greatly dislike graphs without links to the data. Your data claims a variation of about 3 langleys/day in 15 years, which is about 1.5 W/m2 variation. Where on earth does that large, rapid change come from?
I also distrust claims about SST without error bars or provenance …
w.
Well Willis, I guess you will just have to blow it off, but saraswat 2005 is just a google away and the equatorial solar would require a visit to my blog to get all the details.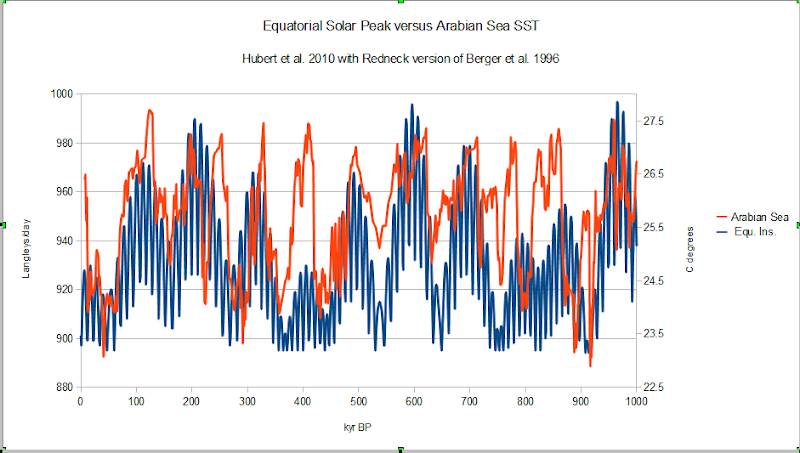
http://redneckphysics.blogspot.com/2015/01/the-solar-precessional-cycle-and-ocean.html
Try this, Herbert 2010 Arabian Sea would likely be at NCDC paleo and Berger et al 1996 should sound familiar. Now remember that ocean core paleo has some issues with dating, they can be off by a few thousand years. However, if you compare the correlation of tropical solar forcing variation with any quality paleo reconstruction of “Global” or tropical temperatures you have a fair correlation. Compare 65N insolation and you have not as good of a correlation. The oceans would appear to be doing the wagging.
captdallas2 0.8 +/- 0.2 January 24, 2015 at 2:21 pm
Sorry, Cap’n, but I’m not going to “try this”.
I don’t go on a snipe hunt for any man. Here’s why. Far too often in the past I used to try looking for what I thought someone was talking about. So I go, and I think I found it … but after sometimes hours of looking and finding and analyzing what they were referring to, I bring my results back, and the person says “Oh, no, that’s not what I was talking about all”, often accompanied by unfavorable comments on my intelligence and my antecedents.
So I gave it up. If you want me to look at something, then give me a link. And in this case, you’re right … I will just “blow it off”. If you can’t be bothered to properly cite your own graph and link to your own data, I can’t be bothered to discuss it.
w.
Willis, “I also distrust claims about SST without error bars or provenance …”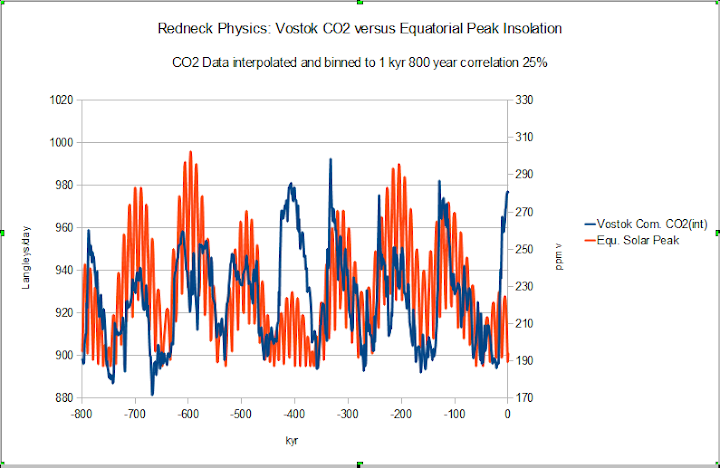
I can see that. Personally I would rather not see error bars than erroneous error bars.
“If you can’t be bothered to properly cite your own graph and link to your own data”
Since the chart is my own, I didn’t cite myself, that would be the reason that the quickly produced chart has an error in the “year” which should be kyear. The Saraswat et al, Indian ocean sst reconstruction is about 130 thousand years long. I do apologize for attempting to steer you in a different direction with regard to comparing Milankovitch Cycle insolation change to similar time frame climate reconstructions.
This also completely inadequately cited chart that I composed compares the Vostok Composite CO2 reconstruction to Equatorial solar variation estimated by Berger.
For the 800 ka length there is only a 25% correlation between the two, but for 800,000 years of “modeled” versus “reconstructed” data, that ain’t bad . If you compare this with the Herbert 2010 chart I posted earlier there is a fairly large “distraction” at ~400ka. Other than that I can find no reason for your statement, “I’m not so much interested in the existence of the 100,000-year cycles in the temperatures, as I am by the lack of any temperature response to the ~100 W/m2 swing in the insolation.”
Since the Solar Precessional data seems to agree fairly well with both temperature reconstruction and CO2 reconstructions, I found it a touch odd. The prompted my suggestion that perhaps you might want to look at the data from a more productive perspective.
Thank you Willis.
A very good post of yours, and especially when referring also to Steve McIntyre marvelous blog Climate Audit which seems to be a very good and significant challenge to the M. cycles hypothesis as an explanation of the glacial periods or put another way, the cause of a 100K year runaway cooling.
I have read most of the comments in this blog of yours, and as been one that is not convinced at all about the above explanation for the glacial periods, I will try to expand a little bit further my point of doubt, in hope that if I am not wrong, there will probably be some little more help in these kind of matter.
To start with, I have to say that in it’s bulk that hypothesis has merit and it is a “beautiful” one to start with, but that does not make it necessary by default as a highly probable or unquestionable one. It has to stand to the test of time and be proven and supported by the facts and evidence as the time passes, so to speak.
And as far as I can tell there is where it fails.
The evidence amounting against it out weights what supposes to support it.
At the time this theory was born, if I am not wrong (please some one correct me if that the case), it was considered as an explanation for the climate change mechanism, meaning that the M. cycles was the main force of climate change.
Even these days, from many, that is still considered as such, as shown in many comments in this blog.
But as far as I can tell, according to the latest day climatology, the M. cycles are not considered any more as the main climate changing force or mechanism.
Actually if looking carefully it can be seen that actually it is considered as only partially responsible for climate change, only for the cooling of climate, due to the triggering of ice built-up which leads to a long period of runaway climatic cooling……..a 100K years long period.
In climatology it is clearly explained that the warming, the abrupt one is not due to the M. cycles, as that warming caused by the warming oceans (regardless of what the unknown mechanism related to).
That is not a theory….it is based on evidence and facts from paleo climate data that the triggering of the end of the last glaciation periods was due to the warming of the oceans.
The warming started first, because of the warming of oceans, and then the Ice started to melt away, the contrary of as it should have been in the case of M. cycles impact or influence.
At this point is where the “marriage” of M. cycles and the Greenhouse effect (CO2 forcing ) is made.
The warming that triggers the end of the Ice Age (the last glacial period) is shown to be amplified from the greenhouse effect (increase of CO2 emissions) to a point that it gets climate out of the Ice Age and towards a further warming to the point of Holocene Maximum.
So according to climatology, the “abrupt” warming that ends the Ice Age and continues to the top of Holocene maximum is due to other causes than M. cycles.
That is how in modern time climatology the furore of AGW starts.
While the naturally slow emission of CO2 (the amplifying of warming) could not lead or cause a runway global warming, the anthropogenic rapid emissions of CO2 (the cause of warming) could very well do that.
So as in the case of M. cycles, where the build up of ice causes and leads to runway global cooling, the melting of ice due to anthropogenic forcing could very well lead to runaway global warming, as climate shown to be subject to it as in the case of runaway global cooling due to M. cycles.
Problem with that is that climate fails to cooperate at that point.
It clearly shows that is no subject to it, to a runaway global warming.
Most probably same holds true in the case of M. cycles.
Before going any further with evidence against the M. cycles as a cause of glacial periods, lets see what actually supports it.
The only one thing that supports it, as far as I can tell, is the interpretation of the ice core data.
Only one possible interpretation, not every possible interpretation.
Now from my point of view that interpretation suffers from what may be called a circular reasoning.
The supposed build up of ice through and during the 100K years of the supposed glacial period (the Ice Age) is estimated in the bases of temp ice core records explained due to the M. cycles.
So the temp records through the M. cycles theory establish the pattern of ice build up that than supports back the theory of M. cycles as a cause of such a pattern of build up, because the build up must be that way as the climate (globally) supposed to be cooling due to M. cycles triggering the cooling.
To put it another way…..the polar regions temp pattern is considered as exactly the global temp pattern as explained trough the M. cycles theory and therefor the same pattern of the ice build up is considered, which at that point is used to support and prove the M. cycles cooling impact.
So an ice build up estimation (the glacial period) is achieved due to that theory and than that same ice build up is used to prove that theory….funny is it not !
Further more it gets to a point that build up of ice (the glacial period) is indirectly measured in degrees C or degrees F of polar regions and not as actual measurements of weight, mass, volume or surface expansion, or any other indirect means, as far as I can tell. (If I am wrong at this, please some one correct me).
So apart from this and the “beauty” of the theory there is no much else to support the M.cycles as a cause or the triggering of glacial periods.
The main problem of that theory starts at the point that it claims and stands in a particular explanation.
The growth building up of ice causes or leads to cooling, not the other way around.
That is why the abrupt warming (that ends the Ice Age) has nothing to do with that theory, as that warming presides the melting of the ice and leads or actually causes it.
Further more, which is a much stronger case against the cooling due to M.cycles, is the climatic pattern through the Interglacial.
There is clearly shown significant climatic changes that have nothing to do or could be explained by that theory, but in contrary contradict it.
The two main ones are the Transient climatic periods that happen during the climatic trend change in climate. There is two significant trends observed during the last 18K years, that of warming (A 10K years long) starting at the very triggering of the Ice Age termination up to the very triggering of Holocene optimum termination,…..and there also is the ~ 7K years cooling trend from the very top of Holocene optimum to present. In both cases nothing to do with M. cycles.
Also there is other significant transient climatic periods (anomalies), like LIA or Y.D etc. that also have nothing to do with M.cycles.
The problem with many is the assumption of considering the Interglacial as a warm period, contrary of what it is, a warming and a cooling period. So far the Interglacial is a period of ~7K years warming followed by ~7K years of cooling.
In the mid of it, yes there is a warm period, the Holocene optimum, the end of which is triggered and the start of the cooling also by other means or causes than M. cycles.
So there is climate clearly showing a significant global cooling starting before the build up of ice which very possibly in continuation will lead and cause ice growth. No connection there to be found with M.cycles, but actually the contrary.
So whatever has being cooling for the last ~7K years the climate in continuation will cause it to enter an “Ice Age”.
As this has already come to a very long comment, I will simply leave it at this point by saying…yes the theory argued is in essential rational, intelligent and rational (beautiful, so to say), but when it comes to validate it and prove it as a correct one, there is not such thing as rational, but in contrary only paradoxes and contradictions with reality keep surfacing, same way as in the case of AGW.
That M. theory, as far as I can tell, creates more problems than solving any in regard to our better further understanding of climate and climate change.
Anyway, anyone that finds errors or faults with my above comment, as there probably could be many faults and errors,………. please do correct me……looking forward to better my understanding in this matter………..and also with my English too..
cheers
James Croll, a Scottish “scientist” – who started off as a janitor – wrote a theory about ice ages and orbit changes in 1875.
http://en.wikipedia.org/wiki/James_Croll
Decent discussion of the history of this here.
http://www.aip.org/history/climate/cycles.htm
Lots of discussion as to why the main cycle found appears to be 100 000 when this is associated with smaller calculated changes than other cycles such as 21 000
whiten says below and I am with you are several fronts, but questions remain.
My reply and questions
Question one what started the oceans to warm in the first place and hence the climate to change?
Question two which ties into question one is one would think with all other things being equal that a significant ice build up such as what occurred with the YD or any other major glaciation would feed upon itself due to the positive feedback of more ice/snow cover a higher albedo, colder temperatures but this does not happen since all glaciations come to an end sooner or later.
My candidates to explain the question I presented are
Internal solar variations with associated primary /secondary effects.
Earth Magnetic Field Changes such as excursions.
Random terrestrial or extra terrestrial events but the problem I see with this even though I listed it is there are to many abrupt climatic changes for that factor to be the reason.
Initial State of Climate- when it is near the threshold of glacial/inter-glacial conditions but then the question is what brought the climate to that threshold in the first place.
My conclusion thus far is I think it is a combination of all that is being discussed that somehow results in given forcing having a general influence on the climate but because the climate system is non linear ,random and chaotic and constantly in a different Initial State that given forcing is not going to result in a given climate result and thus allows counter trends to occur within a broad underlying trend.
In summary I think nothing can be eliminated when it comes to why the climate does what it does , rather I think every item that is being discussed has some role to one degree or another. Even Milankovitch Cycles despite short comings.
Below are some of Whiten’s commentary
The growth building up of ice causes or leads to cooling, not the other way around.
That is why the abrupt warming (that ends the Ice Age) has nothing to do with that theory, as that warming presides the melting of the ice and leads or actually causes it
In climatology it is clearly explained that the warming, the abrupt one is not due to the M. cycles, as that warming caused by the warming oceans (regardless of what the unknown mechanism related to).
That is not a theory….it is based on evidence and facts from paleo climate data that the triggering of the end of the last glaciation periods was due to the warming of the oceans.
The warming started first, because of the warming of oceans, and then the Ice started to melt away.
Hello Salvatore.
First thank you for your reply. Appreciated.
Now, in answering your first question:
The warming of the Oceans was served as it is considered by climatology, an evidence not a hypothesis.
There could be many ways to try and come with what could have being the reason for it, but as far as I can tell the way it stands is possible to be whatever a reason but not the M. cycles effect.
Lack of having a proper explanation for such as, does not necessary mean that it should (or must) be explained somehow by the M.cycles effect.
I could give you one reason I may think of but that will get us out of the subject, and will be far longer and tiresome, most probably wrong too.
The main point is that a better understanding of climate will help a lot with that, and the inability to think out of M. Cycles box makes it even much more harder than supposes to be.
If 100K years of the glacial periods length happens to be a figment of a “scientific” imagination only then it will be very hard to understand why and how climate changes.
As per the Question two:
Simple, no matter what, I do not think you seriously are saying that Y.D was caused or triggered by M. cycles.
Then, influence is another thing. I my self, still do not doubt of a potential influence of M. cycles, but the degree of it I consider it to be of very little significance to climate change. As I have mention it before on my previous comments, it could be only significantly enough in regional impact, that of polar regions by defining their extremity in respect to the climatic period, which is completely independent of M. cycles effect.
The orbital forcing is an “inherited” planetary process expected to influence the earth system , but is also feasible enough to think of the atmosphere, another such a planetary process, as able enough through its existence and evolution to have become resilient enough to absorb and stabilize such an effect to the min possible.
Any way in the end my point in the comment you replied to is simple:
In the last 400 K years there is not even a single climatic event that could be explained by the M. cycles, but in contrary there is many significant ones that could be explained any other way but not through the M. cycles effect.
So if you say that M. cycles effect has amplified some of the glacial periods, or even most of them, but actually not triggering them, I will not complain..:-). But that will be another different story and theory than the one argued here.:-)
In my opinion that theory, which seems to be the main climatic explanation of the longer periods during the last 400K years, is the one that seems pretty much a potent candidate to be eliminated from the very short list of one(s) with a significant effect in climate.
Some time progress and evolution comes through elimination of what not useful anymore.
Please do find me one single significant climatic event that can be explained as triggered or caused by M. Cycles effect. 🙂
It shouldn’t be hard, I guess..:-)
cheers
For question one, might the answer be that the lowered surface area of the oceans produced fewer clouds and more of the sun’s energy entered the ocean?
==============
In reverse at times of accelerated warming like the Paleocene /Eocene thermal maximum again why did not an increase in CO2 /warmer temperatures create a positive feedback that would go on for eternity?
In conclusion there is something that is always bringing the climate back to it’s mean state no matter how far the climate may drift away from that mean state.
The question is what are the reasons?
.
@ brokenyogi
January 24, 2015 at 6:50 am
“There was some interbreeding with Neanderthals and Devonians, but over time all rival sub-species were wiped out”..
My great aunt was a Devonian – she came from Torquay, and spoke with that wonderful, slow, drawling West-country accent. And there was definitely considerable interbreeding with other members of the human race.
But perhaps you meant Denisovans?
With regards,
LK
A change of 40C is 40*1.8 or 72F. This is minor but over an analysis this can be significant.
The analysis does not seem very surprising.
Exactly.
Willis says
I gotta say I’m just not seeing it. The biggest oddity is that around 400,000 years, the very small insolation peak is correlated with a very large temperature peak. In addition, in general there seems to be very little correlation between the swings in insolation and the swings in temperature. Finally, the most interesting thing is the total lack of any 21,000 year cycle in the temperature.
Enjoyed the post. I gotta say nonlinear, multivariate and somewhat chaotic in nature with M cycles playing a role as an answer to your comment above. And I know these echo some of the comments above. Sorry no qotation marks as I have yet to find them on this new android.
Willis
Just a suggestion. Plot insolation at the summer solstice at the tropic of cancer (which moves from 21.4 to 24.5 degrees north) against the eccentricity cycle. You also have to include the fact that because of precession of the equinox the date of the Earth’s aphelion shifts quite rapidly, on the 21,000 year cycle. Today the Earth is at aphelion early in July, I think around the second or third. In 11,000 years that reverses and we will be near perihelion then. (northern hemisphere)
Help,
I do like, using a favorite saying of mine, to go have a little ‘look see’. i.e. download the data and play around in a spreadsheet. I’ve done that with the data outlined in the article. Added June, July and August. Dived by 3 for an average. Multiplied by 0.4843 (as per instructions in the read-me) to convert to w-2.
Trouble is – I come out with a graph that looks like yours but has and average insolation of 484 whilst yours is about 590 w-2. My peak figure is 537 m-2 whilst yours is about the 650 mark.
What idiocy am I perpetrating?
Help!
Derek