Guest Post by Bob Tisdale
[Update: Corrected a few typos in the paragraph before Figure 4. My thanks to rogerknights.]
I hadn’t read the NOAA State of the Climate (SOTC) Report for 2014 when I prepared the post Does the Uptick in Global Surface Temperatures in 2014 Help the Growing Difference between Climate Models and Reality? (WattsUpWithThat cross post is here.) I simply presented data and climate model outputs in that post.
The following are a few observations about the annual NOAA report. NOAA biased their report by omitting key discussions. First an introduction.
THE 2014 GLOBAL HIGHLIGHTS OF THE NOAA SOTC REPORT
With respect to surface temperatures, the Global Highlights of the NOAA State of the Climate report reads (my boldface):
Global Highlights
- The year 2014 was the warmest year across global land and ocean surfaces since records began in 1880. The annually-averaged temperature was 0.69°C (1.24°F) above the 20th century average of 13.9°C (57.0°F), easily breaking the previous records of 2005 and 2010 by 0.04°C (0.07°F). This also marks the 38th consecutive year (since 1977) that the yearly global temperature was above average. Including 2014, 9 of the 10 warmest years in the 135-year period of record have occurred in the 21st 1998 currently ranks as the fourth warmest year on record
- The 2014 global average ocean temperature was also record high, at 0.57°C (1.03°F) above the 20th century average of 16.1°C (60.9°F), breaking the previous records of 1998 and 2003 by 0.05°C (0.09°F). Notably, ENSO-neutral conditions were present during all of 2014.
- The 2014 global average land surface temperature was 1.00°C (1.80°F) above the 20th century average of 8.5°C (47.3°F), the fourth highest annual value on record.
Of course, the global highlights are what the mainstream media and alarmist blogs parrot. Some may even report on the Global Temperatures and Regional Temperatures portions of the NOAA report. Few will venture beyond that.
BIAS OF OMISSION 1
It’s not until readers scroll down to the rankings table in the SOTC report that NOAA introduces uncertainties. See my Figure 1. So, according to NOAA, the “annually-averaged temperature was 0.69°C (1.24°F) above the 20th century average of 13.9°C (57.0°F), easily breaking the previous records of 2005 and 2010 by 0.04°C (0.07°F)”, but then NOAA clarifies their global surface temperature anomalies as “+0.69 ± 0.09” deg C. Alas, we discover that the new record high by 0.04 deg C is within the +/-0.09 deg C uncertainty of the dataset.

Figure 1
Still farther down on the webpage we come across the links to NOAA’s Supplemental Information.
Supplemental Information
The first link brings us to the Calculating the Probability of Rankings for 2014 webpage. There, after an initial discussion, they write (my boldface):
Using a Monte Carlo approach (Arguez et al, 2013), NCDC considered the known uncertainty of the global land and ocean annual temperature in the 2014 annual ranking. Taking into account the uncertainty and assuming all years (1880-2014) in the time series are independent, the chance of 2014 being
Warmest year on record: 48.0%
One of the five warmest years: 90.4%
One of the 10 warmest years: 99.2%
One of the 20 warmest years: 100.0%
Warmer than the 20th century average: 100.0%
Warmer than the 1981-2010 average: 100.0%
NCDC follows these conventions to categorize the confidence associated with assertions made with respect to ranks used in the report:
My Figure 2 is the “conventions to categorize” table that follows that discussion, with my highlight:

Figure 2
So, according to NOAA, the chance that 2014 was the warmest on record was 48.0% and based on their table, the global surface temperature anomalies in 2014 appear in the range of “more unlikely than likely”.
Curiously, the NOAA omitted that all-important “more unlikely than likely” language from its main 2014 State of the Climate report webpage. You have to click on the Supplemental Information links to discover that 2014 was “more unlikely than likely” the warmest on record.
Therefore, NOAA has biased the “Global Highlights” of their State of the Climate report by failing to note the likelihood, actually unlikelihood, that 2014 had the highest global surface temperatures on record.
BIAS OF OMISSION 2
The next topic is the El Niño event in 2014.
Under the heading of Global Temperatures on the main page of the NOAA SOTC report, they state:
This is the first time since 1990 the high temperature record was broken in the absence of El Niño conditions at any time during the year in the central and eastern equatorial Pacific Ocean, as indicated by NOAA’s CPC Oceanic Niño Index. This phenomenon generally tends to increase global temperatures around the globe, yet conditions remained neutral in this region during the entire year and the globe reached record warmth despite this.
NOAA’s Oceanic NINO Index is based on the NINO3.4 region (5S-5N, 170W-120W) of the equatorial Pacific. See the NOAA map of the NINO regions here. And according to a Hovmoller diagram of the sea surface temperature anomalies from the NOAA GODAS website, Figure 3, El Niño conditions (sea surface temperature anomalies equal to or greater than +0.5 deg C) existed along the equatorial Pacific east and west of the NINO3.4 region for most of 2014.

Figure 3
In other words, the sea surface temperature data indicate El Niño conditions existed for most of the year, but not in the region that NOAA uses to define an El Niño. Further to this, as we discussed in the most recent ENSO update and in the post The Little El Niño That Didn’t or Might Have (Depends on the Agency and Index), the Japan Meteorological Agency (JMA) notes that El Niño conditions have existed since June.
In December 2014, the NINO.3 SST was above normal with a deviation of +0.9°C and five-month running mean of the NINO.3 SST deviation was +0.5°C or above for five consecutive months from June to November (Table and Fig.1). SSTs were above normal in most regions from the western to eastern equatorial Pacific (Fig.2 and Fig.4). Subsurface temperatures were above normal in the eastern equatorial Pacific (Fig.3 and Fig.5). These oceanic conditions indicate that El Niño conditions are present in the equatorial Pacific…
And the reason the JMA makes this claim is they use the NINO3 region (5S-5N, 150W-90W), which overlaps and runs east of the NINO3.4 region.
Therefore, NOAA has omitted the fact that data indicate El Niño conditions existed along the equatorial Pacific, outside of the region they use as an ENSO index, so they could claim ENSO “conditions remained neutral in this region during the entire year and the globe reached record warmth despite this.”
Of course, the intent of that NOAA statement was to give the impression that there was a general overall warming that could not be attributed to El Niño conditions, when, in fact, El Niño conditions did exist in 2014.
BIAS OF OMISSION 3
This is a discussion of the additional cause of the elevated sea surface temperatures.
NOAA notes in their “Global Highlights” (my boldface):
Much of the record warmth for the globe can be attributed to record warmth in the global oceans. The annually-averaged temperature for ocean surfaces around the world was 0.57°C (1.03°F) higher than the 20th century average, easily breaking the previous records of 1998 and 2003 by 0.05°C (0.09°F). The first four months (January–April) each ranked among their seven warmest for their respective months and the following seven consecutive months (May–November) were record warm. The year ended with December third warmest on record for the month.
In 2014, the warmth was due to large regions of record warm and much warmer-than-average temperatures in parts of every major ocean basin. Record warmth for the year was particularly notable in the northeastern Pacific Ocean in and around the Gulf of Alaska, much of the western equatorial Pacific, parts of the western North Atlantic and western South Atlantic, and much of the Norwegian and Barents Seas. Nearly the entire Indian Ocean was much warmer than average with a broad swath between Madagascar and Australia record warm. Part of the Atlantic Ocean south of Greenland and the Southern Ocean waters off the southern tip of South America were much cooler than average, with one localized area near Antarctica record cold.
NOAA mentioned the elevated sea surface temperatures in the eastern extratropical North Pacific in passing. An unusual weather event in the North Pacific (along with the El Niño conditions) was, in fact, the primary reason for the elevated sea surface temperatures in 2014. That is not so [to] say that there were [weren’t] elevated sea surface temperatures in specific parts of other ocean basins, but in general, those elevated temperatures in basins outside of the North Pacific had no impact on the record highs. As a result, if we plot the sea surface temperature anomalies since 1997 for the oceans outside of the North Pacific, 2014 was not an unusually warm year…nowhere close to a record high. See the top cell of Figure 4. The bottom cell is for the global oceans, including the North Pacific. Obviously, in 2014, the events in the North Pacific were the primary reasons for the elevated sea surface temperatures globally.

Figure 4
There were two “weather” events that impacted the surface temperatures of the North Pacific in 2014: (1) the El Niño conditions in the tropical Pacific, which directly impacted the surface temperatures of the tropical North Pacific, and (2) the unusual weather event in the eastern extratropical Pacific, which is so well known that climate scientists call the hotspot it created “the blob”. Because of the two weather events in the Pacific, not human-induced global warming, sea surface temperatures were elevated globally in 2014. In turn, because land surface temperatures were not at record highs, it is logical to say that those two weather events were responsible for the record high combined (land and ocean) surface temperatures that were “more unlikely than likely” to have existed in 2014.
We have discussed in numerous posts the reasons for the elevated sea surface temperatures in the eastern extratropical North Pacific this year. See:
- On The Recent Record-High Global Sea Surface Temperatures – The Wheres and Whys
- Axel Timmermann and Kevin Trenberth Highlight the Importance of Natural Variability in Global Warming…
- Alarmists Bizarrely Claim “Just what AGW predicts” about the Record High Global Sea Surface Temperatures in 2014
- Researchers Find Northeast Pacific Surface Warming (1900-2012) Caused By Changes in Atmospheric Circulation, NOT Manmade Forcings
- Did ENSO and the “Monster” Kelvin Wave Contribute to the Record High Global Sea Surface Temperatures in 2014?
As we noted and illustrated in the second post linked above, the unusual weather event in the eastern extratropical North Pacific lasted for 2 years. It also contributed to the California drought. And we illustrated the following in the first post linked above.
As an exercise, if we start our analysis in 2012 and work our way back in time, for how long of a time period did the sea surfaces of the North Pacific show no warming? The answer, using NOAA’s ERSST.v3b data, is 23 years, yet the climate models used by the IPCC indicate they should have warmed about 0.5 deg C in that time.

Figure 5
NOTE: If you were to click on the link to the first post, you’d note that using NOAA’s satellite-enhanced sea surface temperature dataset we can extend that period to 24 years. [End note.]
It’s unrealistic to assume the warming of the surfaces of the North Pacific in 2013 and 2014 were caused by manmade greenhouse gases, when they hadn’t warmed in at least 23 years before then.
CLOSING
According to NOAA definitions, global surface temperatures for 2014 were “More Unlikely Than Likely” the highest on record, but they failed to note that on the main page of their State of the Climate report. NOAA used a specific ENSO index to claim that El Niño conditions did not exist in 2014, when at least one other index says El Niño conditions existed. And NOAA failed to discuss the actual causes of the elevated global sea surface temperatures in 2014, while making it appear that there was a general warming of the surfaces of the global oceans.
NOAA never stated specifically that 2014’s record high surface temperatures were a result of human-induced global warming, but they implied it…thus all the hoopla. NOAA has omitted key discussions within that report, which biases it toward human-induced global warming. In other words, the NOAA State of the Climate report was misleading. NOAA has once again shown it is a political entity, not a scientific one. And that’s a damn shame. The public needs openness from NOAA about climate; we do not need to be misled by politically motivated misdirection and misinformation.
# # #
[Oops, I forgot to thank BruceC for noting NOAA’s uncertainties in a comment at WUWT. That comment prompted this post.]
NOAA – Never Omit Another Alarm ?
I saw the 0.07 deg F “record” in the paper this morning and instantly knew it was inside the error of the readings. When I try to explain measurement error to the uninitiated, I get blank stares. I am sure that is what the alarmists are counting on, the peoples will only look at “warmest on record” and blindly believe.
An “average” is not a measurement. It is a descriptive statistic about a set of numbers.
http://qualityamerica.com/images/ebx_-2138538623.jpg
root (N-1) for a sample of a larger set.
An average is not a measurement.
Warmist – speak with forked tongue!
Thanks to Alec and Charles for setting him straight.
No wonder he’s shouting so loud. Propaganda works better that way.
Integrating data converters measure things. In layman’s speak they are averaging converters.
This does not apply for surface measurements of temperature as they are dispered both spatially and in time. You would need parallel measurements at the same location and the same time, to be able to use this formula.
It’s certainly what the uneducated masses in the media do. (blank stares that is)
@oeman50
Some will always believe. But most never did. They simply went along. And they don’t anymore. Sure, they don’t speak up but it matters little. There is a reason why the warmist tribe is concerned about “communication”.
The fact is that predictions were made and shouted from the rooftops. Not have come to pass. It is the reason why we are where we are. Or, iow, this blog would be empty if the warmist had been right. Instead, it is flooded while the warmist ones sink.
So “record” or no “record”, they’ve lost. They know it. We know it. The population at large knows it. It is not yet time for the masses to speak up but, well, when they do they tend to support whatever nonsense it is fashionable at the time, oftentimes a lynching of sorts. I kinda prefer to hear hate on “deniers” than on Muslims, Mexicans, homosexuals, etc who are their usual prey.
Either inside the margin of reading error or just natural variation….background noise almost….either way,there is no clear trend line to suggest long term “global warming”
While on the issue of measurement error, I can’t find any estimates of the uncertainty in the 30-year mean temperatures used in the generation of the temperature anomalies.
I expect those uncertainties to be greater than the annual mean temperatures. But the temperature anomaly uncertainties published by GISS don’t appear to include that factor. The error in the anomalies appears to be equated to the error in the mean temperatures alone.
Mr Tisdale….
…
Check out the “ENSO Meter” over on the right hand side of this page ======>
David, I reported on the decaying El Nino conditions 4 days ago. I don’t believe I cross posted it here at WUWT. Sorry you missed it:
https://bobtisdale.wordpress.com/2015/01/13/the-little-el-nino-that-didnt-or-might-have-depends-on-the-agency-and-index/
The needle has been hovering in the yellow zone for much of the time and only in the last few days ventured back into neutral zone.
Tisdale forgot another omission. The likelihood that the second warmest year (2010) was warmest.
http://www.ncdc.noaa.gov/sotc/briefings/201501.pdf
~18%
That is “Unlikely”
Or that 1998 was warmest: ~5%
“Very unlikely”
Ranking of Record Years is Sensitive to Methodology and Coverage
http://www.ncdc.noaa.gov/sotc/briefings/201501.pdf
The above image was reproduced by Steven Goddard with the added tweet
“Implausible Deniability
…They get the propaganda out there for the White House and major news outlets, then try to generate implausible deniability through back channels like twitter. None of this was mentioned in the NASA press release….”
https://stevengoddard.wordpress.com/2015/01/17/implausible-deniability-2/
Jimbo:
The BBC do this all the time. You watch a prime-time BBC news report containing incredible bias (climate, politics, whatever). You complain that the BBC never give the opposing viewpoint, and they say: “please see web-page number 32,873 down at the bottom of the 53rd paragraph, where you will see that we did address this issue……”
Ralph
Ralph–you made me laugh out loud!
So there’s a 10% chance (NOAA) or 18% chance (NASA) that none of these years was the warmest.
‘January 21, 2014: The GISS analysis was repeated this morning based on today’s status of the GHCN data. The changes were well within the margin of error, e.g. the L-OTI mean for 2013 changed from 0.6048+-0.02°C to 0.6065+-0.02°C, a change of less than 0.002°C. However, rounding to 2 digits for the L-OTI table changed the 0.60°C used in some documents prepared last week to 0.61°C. This minuscule change also moved year 2013 from a tie for the 7th place to a tie for the 6th place in the GISS ranking of warmest years, demonstrating how non-robust these rankings are.’
http://data.giss.nasa.gov/gistemp/updates_v3
And the number for 2014 is STILL 48%. What the chances of other years being the warmist is doesn’t change the percentage for 2014 and still makes 2014 “more unlikely than likely” to have been the warmist.
Gotta love the confidence and certainty: “…easily breaking the previous records of 2005 and 2010 by 0.04°C”. I guess coming up with numbers you want using statisitics is easy. Average surface temperature of the Earth to a precision of a hundreth of degree. It boggles the mind.
How they can use the word “easily” and .04 in the same sentence is beyond me. But after following all this for 6 years nothing surprises anymore. Every headline ought to cite .04 and see how many eyer rolls they get from the public.
Thanks for a well written report, appreciate it!
2014 is really a remarkable year. The first ninjo-year with no ninjo conditions at the beginning of the year.
Fingerprint of AGW?
I believe that’s the most nonsensical thing you’ve written to date, rooter. Most El Nino evolution years do not start in El Nino conditions. In fact, many El Ninos develop in the latter part of the calendar year. If you’re not aware of it, ENSO events are normally tied to the seasonal cycle.
Indeed Tisdale. That is exactly the point. Ninjo evolution starts in the latter part of the calendar year. Therefore ninjo years starts with ninjo conditions. 2014 did not start with ninjo conditions because there was no ninjo evolution in the latter part of 2013.
Another big miss there Tisdale.
Rooter is starting to turn nasty, you can tell from his tone. How long do you think before he/she/it gives up?
It’s so satisfying to watch these people humiliating themselves here.
rooter, is English a second language for you? Because you still make no sense whatsoever.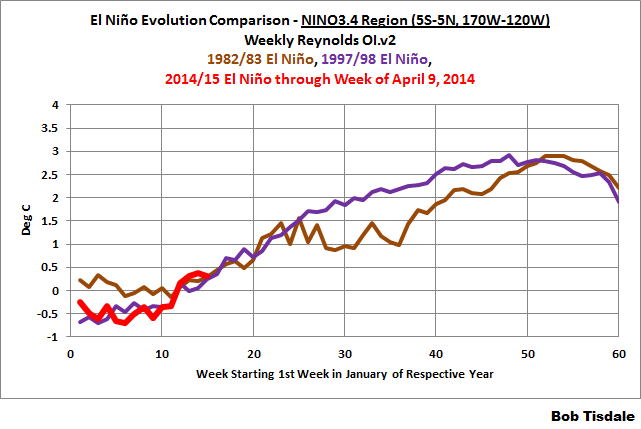

Here’s a graph that shows the evolutions of the NINO3.4 SSTa for the very strong 1982/83 and 1997/98 El Nino events, along with the beginning of the 2014 event [oops, forgot the link the first past through]:
None of them started the year above the +0.5 deg C threshold of an El Nino.
That graph is from this post:
https://bobtisdale.wordpress.com/2014/04/14/201415-el-nino-part-3-early-evolution-comparison-with-198283-199798-el-nino-events/
Same type of graph, rooter, but this one includes the evolutions of all of the other satellite-era El Nino events (excluded is 1987/88 because it was the second year of a 2-year El Nino):
Only 1986 started in +0.5 deg C El Nino conditions, but they soon dropped out and then rose thereafter.
That graph is from this post:
https://bobtisdale.wordpress.com/2014/04/17/the-201415-el-nino-part-4-early-evolution-comparison-with-other-satellite-era-el-ninos/
Once again, you’ve wasted everyone’s time, rooter.
Seriously, your total lack of understanding of the subject matter would be welcome at HotWhopper. There, they’re happy to ramble on nonsensically. But your misunderstandings and misinformation are not welcome here at WUWT, rooter. Here, you just waste everybody’s time…especially mine.
Have a nice day, rooter.
Another good one, Bob. Appreciate the time and effort you take producing these articles.
Next, Charles says:
Rooter is starting to turn nasty, you can tell from his tone.
They are all getting like that. Planet Earth has been consistently proving to the alarmist crowd that they are flat wrong. None of their alarming predictions have come true, not a single one. So their tone gets ugly, their ad-hom attacks ramp up, and using psychological ‘projection’ becomes another form of arguing.
They are losing the public debate, and they know it. We saw it here first, when they were not able to produce even a single measurement of AGW. Belief in a ‘human fingerprint’ is sufficient for that crowd. But not for skeptics. Skeptics say, “Show us”. But we’re still waiting…
[Oh, and rooter, it’s ‘El Niño’. There’s no ‘j’ in it.]
Is your point that you categorize 1997 as a ninjo year Tisdale?
Very well. Then you must compare the 2014 temperature to 1997. What year was warmest?
Or perhaps you are predicting a super ninjo like 1998 in 2015? Maybe. I don’t know. The SOI has at last shown some strength. In that case we will have back-to-back record years.
Thank you for bringing humour to this blog, you never fail to make me laugh.
rooter:
Palmprint of God/Gaia/Nature maybe.
AGW? hahahaha!
No evidence for AGW whatsoever; to credit AGW requires more faith than most religions.
If one believes there is such a thing as natural warming (and apparently many do not), most likely an effect from rebounding from colder than usual conditions in the Little Ice Age, then one would also expect to see “the warmest year on record” every now and then. What I can never seem to get across to people is AGW has to demonstrate additional warming to be a valid theory – not just warming. Even if the data were perfect and the methodology was not so screwed up as to produce junk science, +0.04 warming in a year every now and again is the expected normal state! Mixed in with some years that get +/-0.1, +/-0.02, +/-0.03 you end up with natural variation and a slight natural warming. Why is this even news? Never mind their data and process is broken (again, LOL).
When did the LIA end Robert?
How does rebounding work? What are the origins of the warmth? Where does it come from?
Good morning Rotorooter. Thanks for the cut and paste comment. Gave me a smile over my second cup of coffee this morning. Off to feed my livestock with a smile. The LIA just started. (Laughing In Absentia.)
To understand why it has warmed up since the 19thC, you need to understand why it cooled down after the Middle Ages.
Your red herrings show you clearly have no idea at all.
The best explanation for why it cooled down since Medieval times is axial precession. The most recent time when perihelion and the solstice occurred on the same date was 1246 AD Isolation would have increased in the centuries before 1246, and decreased afterwords.
What are your equations for that claim of axial precession causing the Medieval Warming Period, and its subsequent descent into the Little Ice Age?
rooter;
When did the LIA end Robert?
You keep asking this question. What point are you trying to make?
Warming comes from multiple adjustments to data sets, Rooted.
Do try and pay attention.
Equations….
http://www.imcce.fr/Equipes/ASD/insola/earth/online/
Source of equations…
http://www.aanda.org/articles/aa/abs/2004/46/aa1335/aa1335.html
NASA says:
The Maunder Minimum
Early records of sunspots indicate that the Sun went through a period of inactivity in the late 17th century. Very few sunspots were seen on the Sun from about 1645 to 1715 (38 kb JPEG image). Although the observations were not as extensive as in later years, the Sun was in fact well observed during this time and this lack of sunspots is well documented. This period of solar inactivity also corresponds to a climatic period called the “Little Ice Age” when rivers that are normally ice-free froze and snow fields remained year-round at lower altitudes. There is evidence that the Sun has had similar periods of inactivity in the more distant past. The connection between solar activity and terrestrial climate is an area of on-going research.
http://solarscience.msfc.nasa.gov/SunspotCycle.shtml
Well, I guess we need to educate you a little about the real world and natural processes and natural (undamped) process control feedbacks.
You are obviously assuming the earth has some “stable” natural temperature where input (solar radiation + the small amount of internal molten rock) and output (longwave thermal radiation into space) are perfectly in balance. A pendulum – if absolutely stationary – stays absolutely stationary, but your CAGW-required assumption of temperature equilibrium cannot be justified for the earth in space.
The CAGW religion likes to use the term “forcings” . So, the earth’s global average temperature (an equally bad assumption!) was “obviously” “stable” somewhere between the maximums of the Minoan Optimum, the Roman Optimum, the Medival Warming Period, and today’s Modern Warming Period (see any pattern there?) and the Minimums of the Dark Ages, the Little Ice Age and the upcoming Modern Ice Age – all interspersed between the last Big Ice Age and the Next Ice Age (see any other patterns here?) .
Except the earth’s global Average Temperature NEVER WAS STABLE when the global average temperature was 0.0 degrees. Like the sun’s position on the horizon when the there are 12 hours of darkness and 12 hours of sunlight at the two equinoxes each year: The sun rises and sets exactly on the equator but the sun’s movement across the horizon fastest when the system is at zero.
A pendulum is moving fastest when its displacement is zero – when it is vertically up and down. The same pendulum is stopped (momentarily!) when its displacement is at the maximum right point then again when its displacement is at minimum left point. But the “forcing” due to gravity has never changed.
More generally, ANY sine wave’s velocity is fastest when the displacement is zero, and is slowest when the displacement is at maximum high and maximum low.
So, under constant “forcings”, EVERY physical system with two forcings (one positive and one negative) WILL overshoot its equilibrium point until the effect of the positive forcing is overcome by the effect of the negative forcing. At this point, it has ALREADY gone past equilibrium and will begin slowing until the maximum is reached, at which point it will begin accelerating until once again the system GOES PAST equilibrium and heads towards a minimum point.
Now, that is a p=”perfect system” with constant forcings, only two forcings, and nodelay in either forcings. Add two, three or four MORE forcings of different periodic lengths, of different magnitudes, and of different feedback mechanisms. The result? Still a “stable system” but one whose trait (temperature in this case) is STILL BOUNDED by maximums and minimums and a total cycle period, but with smaller cycles superimposed on the larger sum. Exactly what we see on earth today and in years past.
But that total system is NEVER in equilibrium: Its global average temperature CANNOT be “stopped” at some equilibrium point where everything is in “perfect balance”. The system temperature is ALWAYS higher (or lower) than the mythical “zero.zero” equilibrium point.
You asked, “When did the Little Ice Age end?”
My answer? Halfway between the depths of the Little Ice Age (typically claimed 1650 AD) and the maximum of the Modern Warm Age. Which might be 2000-2010.
Or more likely 2070-2080.
Or 2150 – 2160.
Could be 2210-2220, but not likely.
You did NOT ask “What caused the Little Ice Age?”
My answer: “The same forcing that was present in the Dark Ages 900 years before, reached its maximum effect in the Medieval Warming Period 450 years before, and was still present 450 years later in 1650. The same forcing caused the Little Ice Age is present now, at the same degree it is present now. The same forcing that caused the Medieval Warming Period is causing some (or all) of the Modern Warming Period now, to the same level that it was affecting the earth’s temperature then.”
RACookPE1978 –
You’re going to have to send rooter back to school to learn a very little calculus.
Not sure that’shappening . . .
Rooter:
“When did the LIA end?” When it stopped being constantly cooler.
“How does rebounding work?” We don’t know what caused the LIA and so don’t know what causes rebounding. When we don’t know, it’s better to admit we don’t know and keep searching for plausible reasons. No explanation that I have seen including CAGW fit the data. Except maybe just the natural fluctuations of an inherently chaotic but well-constrained system. Well-constrained in the sense that the climate of earth never gets very hot (like Venus) or very cold (like the moon at night).
“What are the origins of the warmth?” Same answer as above.
“Where does it come from?” Same answer as above.
It depends upon the source, Rooter. The commonly accepted views are either when the LIA cooling trend bottomed out or when conditions reached an approximation of the modern “normal.” The former would be the 18th or early 19th centuries while Mary Hill at UCB places the end of the LIA in the Sierra Nevada in California at 1900.
“How does rebounding work?”
Good question. LIA is just a descriptor of a cool period. As part of its definition, it has warmer bits at each end. To say we’re “recovering” from the LIA is tautological. You could take any time series and say – look there is a low bit. Then there is a high bit. What caused the high? Rebounding from the low. What caused the next low? Relapsing from the high?
Doesn’t tell you anything.
rooter says:
When did the LIA end Robert?
Please quit asking that, you sound like socks. If we had the answer, we would know a lot more than we do.
Questions like that indicate that you have run out of answers, so you’re deflecting and trying to change the subject. The fact is that the man-made global warming narrative sounds good to the credulous — but there is no real evidence to support it.
There isn’t even one credible, vewrifiable measurement of AGW. So what makes you think that man-made warming is happening? Based on all the available evidence, global warming is not caused in any measurable degree by human emissions.
Science isn’t about emotions, it is about facts — or the lack of facts. There are no testable, verifiable facts showing that AGW exists. It may. But if so, it is just too small to measure. The proof? There are no measurements of AGW.
**When did the LIA end**
LIA was centuries long period in which temperate Zone glaciers were advancing, and around 1850
glacial began on average to retreat. So what made the LIA a period was it was a period of advancing glaciers, globally. So more glaciers were advancing than retreating worldwide, and this turned around at around 1850 and so that was considered to be the ending point of LIA.
But in minor fashion glacier started advancing again in 1970’s
Wiki:
“The Little Ice Age was a period from about 1550 to 1850 when the world experienced relatively cooler temperatures compared to the present. Subsequently, until about 1940, glaciers around the world retreated as the climate warmed substantially. Glacial retreat slowed and even reversed temporarily, in many cases, between 1950 and 1980 as global temperatures cooled slightly.”
http://en.wikipedia.org/wiki/Retreat_of_glaciers_since_1850
So a local glacial can advance or retreat irrespective of whether there is global warming or cooling
but when it’s globally cooler this increases the chances of any one glacial to advance.
So 1850 is roughly the period where most glacier stopped advancing and began to retreat.
But in terms temperature there is delayed effect upon glacier, so in terms global warming there would some warming conditions prior to 1850, which result in halt of glacier advance and lead to the retreat of most glacier starting around 1850.
The beginning of LIA has less agreement and obviously variation within LIA- just there variation within the last century.
But if [you] count melting all the glacial ice which was added during the LIA, some predict that may take 50 more years or say by around 2050.
rooter says:
When did the LIA end Robert?
rooter, please stop asking that question. If we knew the answer, we would be discussing something else. And if we do find the answer, Anthony will no doubt have plenty of articles explaining it. So have patience.
As far as I know, the planet is still recovering from the LIA — one of the coldest episodes of the entire Holocene. We will know more if/when global T begins to decline, or starts to rise again.
If it declines, the LIA recovery is probably over. But if there is more global warming, obviously the recovery from the LIA is continuing. We just have to wait and see. Until then, please stop asking that question, you sound like sockrates. You certainly don’t want that< do you?
Paul Homewood:
Why did it cool after MWP? And when did LIA end?
So I now ask you What are the origins of the warmth between 1910 to 1940? There was also a hottest year on the record during that time.
http://www.metoffice.gov.uk/media/image/j/l/warmingtrend.gif
Here you go Jimbo
This IS the path to follow http://en.wikipedia.org/wiki/Chain_Home
The next major rise started around this time http://kfarr.com/2008/01/26/satellite-tv-how-did-it-start/
jmorpuss, can you please explain what the first link is supposed to imply?
Jimbo you asked
So I now ask you What are the origins of the warmth between 1910 to 1940? There was also a hottest year on the record during that time.
Funny how the spike around 1920 lines up with the advancement of RADAR and the spike around the 70’s lines up with satellite TV .
They knew the results to their actions was atmospheric heating way back then, so what’s changed ?
jmorpuss, show me the peer reviewed evidence (at least 3 papers) for this claim of yours. If you cannot then please stay off drugs.
Seems like Jimbo says LIA ended in 1910. I might of course be mistaken and that is not Jimbo’s view. However, if so the LIA ended when anthropogenic CÔ2 was increasing.
http://www.phy.duke.edu/~rgb/cCO2-to-T-volcano.jpg
Jimbo Give yourself a least 5 slapers to the head while repeating the IPCC is corrupt .
Their mantra: “How can we fool them today?”
It’s not science, it’s $cience; create a crisis and cash in. Easy to do when news producers simply cut-and-paste headlines into the prompter for “journalists” to regurgitate.
“The 2014 global average ocean temperature was also record high, at 0.57°C (1.03°F) above the 20th century average of 16.1°C (60.9°F), breaking the previous records of 1998 and 2003 by 0.05°C (0.09°F). Notably, ENSO-neutral conditions were present during all of 2014.
The 2014 global average land surface temperature was 1.00°C (1.80°F) above the 20th century average of 8.5°C (47.3°F), the fourth highest annual value on record.”
If CO2 in the atmosphere causes warming then primarily it warms the atmosphere, The land is warmed by radiation from the Sun, which in turn warms the atmosphere further by radiating heat which sets up convection currents in the atmosphere. Seawater is a great deal more dense than air and therefore has a much higher specific heat capacity and like air the main method of warming is by convection currents. Radiation from the sun will only warm water if there is solid matter that will absorb the water within say 6 feet of the surface which will ideally be black. Any radiation warming at depths greater than that even with the sun overhead is negligible. Warm water will stay near the surface because cool water is denser (until it freezes), therefore this heat cannot be convected downwards. If the oceans have warmed [by] 0.57 Celsius and the land by 1.00 Celsius, the implication is that seawater has a SHC of less than 1/2 of air, which is nonsensical!
Can someone please explain to me how this “missing heat” has warmed the oceans, am I missing something here?
If the missing heat was able to get into the oceans then global warming would be a non issue since the heat capacity of the ocean is over 1000 times that of the atmosphere. Of course there is no missing heat since the enhanced greenhouse effect violates the 2nd law and doesn’t exist. Then there is the small matter of whether increasing CO2 concentrations has a net positive (acting as an insulator to surface IR cooling) or negative (radiating heat from atmosphere) effect on the planets temp.
rooter, thanks for quoting me out of context. Par for the course from you. I subsequently explained and illustrated how that was possible. There’s no reason to play games here, rooter. Everyone can read through your nonsense and no one has the time for it.
Have you considered hanging out at HotWhopper? They love to quote me out of context, misrepresent what I write, redirect the topics of discussion, etc. You’d fit right in there, and they’d love to have you. Here, you’re just a troll, rooter.
Have a good day.
HotWhopper and RC need rooter badly. The Alexis figures are abysmal
Bob: Didn’t you leave out a “no” before “elevated sea surface temperatures”?
(Maybe this is what has misled Rooter.)
Also, change “so say” to “to say”.
rogerknights, thanks for finding the typos. They’ve been corrected. I do not believe they were the cause of rooter’s problem. He simply took the quote out of context.
Amazing. It’s like hitting a Bobo doll. It just bounces back up as if nothing had happened.
You have corrected typos. Fine. Your point is the same though. That the temperature in the NE Pacific is the “cause” for the record warm ocean temperatures. It was a “bias of omission” to mention the elevated sea surface temperatures in the eastern extra tropical North Pacific in passing. Perhaps it was a bias of omission to mention the NE Pacific first? Or perhaps it was a bias of omission not to omit the other areas with elevated temperature?
But not even you believe that the temperature in the NE Pacific is the “cause”. In your plot you include the whole of the Pacific north of equator. You include the equatorial western Pacific (with record warmth), the NW Pacific (with record warmth). So you actually had to include two of the areas outside NE Pacific to get your result.
What is that? Bias of inclusion?
Saw this story on PCBS last night. If you are wondering what station that is.. it is the horrible conglomerate of PBS anchors on CBS, ie PCBS in the morning and the PCBS nightly news with.. you guessed it Charley Rose.
Given peoples real world experience of this “warmest year on record”.(yes we do go outside).. do they honestly believe that ANYONE believes a word they are saying? It would seem to me that by declaring every year the hottest, until it gets revised later they are losing believers right and left. It becomes a joke. The chants of WE DON’T BELIEVE YOU are getting deafening. Wonder what it will take for the anti-evolution warmists to figure this out?
Here are the calculation I would like you to make for me. I think this would quiet the alarmism.
Calculate the average yearly increase in global temperature from the start of the 20th century to the present. Extend this average temp to the end of this century. What would be the average global temp be in the year 2100.
Then calculate the average yearly increase in global temperature from the start of this century to the present. Extend this average temp increase ( or decrease ) to the year 2100.
You do the math but I would bet in the first case the number would be way below the alarmist projections.
In the second case would certainly make the case that AGW is nothing to worry about.
Joe Kropko
Wow. Very interesting.
It’s a shame that NOAA has been politicized.
Still waiting for these super hot seas to warm up the atmosphere!
Apparently, that’s exactly what caused the hottest year ever.
http://www.smh.com.au/victoria/warm-oceans-make-2014-the-hottest-year-on-record-mildura-victorias-hottest-town-20150117-12sbpq.html
Funny. First time I knew Mildura was on the coast, for the warm waters to impact.
Yes, and that’s the point. Yet, Peter Hannam get’s away with writing this rubbish at the SMH and far too many people read it as fact. In fact Peter Hannam does not allow comments on his articles now because he’s been proven wrong time after time. And yet, her still get’s to publish.
Even GISS know you need to allow for uncertainties.
After 2010 they said this:
Global surface temperatures in 2010 tied 2005 as the warmest on record, according to an analysis released Wednesday by researchers at NASA’s Goddard Institute for Space Studies (GISS) in New York.
The two years differed by less than 0.018 degrees Fahrenheit. The difference is smaller than the uncertainty in comparing the temperatures of recent years, putting them into a statistical tie.
http://www.giss.nasa.gov/research/news/20110112/
Paul, as far as I can tell from Hansen et al (2010), the GISS LOTI uncertainty is +/-0.05 deg C. See their Table 1.
http://pubs.giss.nasa.gov/docs/2010/2010_Hansen_etal_1.pdf
Hansen et al explain the basis for that uncertainty – spatial coverage. They estimated what change you would get, in any one year, if the stations were differently distributed in space.
But in comparing 2010 and 2014 the stations were essentially the same. No major change in distribution. So that uncertainty does not apply to the difference.
Nick, that’s nonsense. The temperatures in the holes in their grid may be completely different and could easily reverse the ‘true’ order.
“could easily reverse the ‘true’ order”
They could reverse the order. But +/-0.05 is not the estimate for that. That’s a between station distributions estimate.
Nick Stokes says: “Hansen et al explain the basis for that uncertainty – spatial coverage.”
You are correct, Nick. The +/- 0.05 deg C is the uncertainty due to spatial coverage. Have you found the annual GISS uncertainty estimates?
Once again the Gore effect has dampened their “GOTCHA” At the same time they announce that 2014 is the “HOTTEST YEAR EVAH!!!!!” the snow comes down all over Northern England, the frost sets in and the only reaction amongst the normal people (i.e. people who’s salaries do not depend on hyping the heat) is a universal, “So what?
They have managed to cobble together a 0.04 degree rise within an error bar of 0.09 and instead of announcing a tie they have issued a statement which, quite frankly, is corrupt. Neither RSS or UAH agrees with their mantra. In reality they have announced that the cessation of warming has continued within the errors stated and dressed it up as a huge increase, (By implication)
I have hovered on the fence for a while but now I am given no choice but to recognise that the deception is deliberate. I was hoping against hope that they would give an honest assessment of the state of the climate and even I have to agree that they have not.
BEST came out with an honest assessment….basically saying that 2005, 2010 and 2014 were much of a muchness so from now on I will treat them as the terrestrial authority and the two satellite sets as the lower atmospheric authority.
It is a great disappointment to me that NOAA and NASA have proven that they are advocates and not scientists
I agree they are political. I believe they have been since at least the mid 2000s. What is the real “average” temperature without all the adjustments?
Ivor, my journey looks to be similar to yours. It was the undeniable corruption which converted me to skeptic.
Ivor, PG. Its actually worse than you fear, or the misperception created by the misleading PR that BT points out in this excellent post.
See essay When Data Isn’t for irrefutable illustrations of wilful, knowing malfeasnace by NOAA, NASA, and many others. See essay Credibility Conundrums for US government as a whole misleadingly spun the entire overview to the 2014 National Climate Assessment. Every single example. Not a single honest comparison in the lot. Both essays in ebook Blowing Smoke.
Pure politics of the sort we have come to expect from OBummer. Right up there with ‘if you like your insurance you can keep your insurance’, ‘Putin is a man I can work with’, and ‘the science is settled, skeptics are Flat Earthers’.
It’s snowing down to 1,000 metres again today in southern Tasmania. This morning it was 9°C at my place (elevation 200m). Some of us want some global warming… Why is it always somewhere else?
Now that’s something that I have never heard or read of in the Australian press. Although up here in Newcastle, NSW, the only phrases of late have been 5 metres and 1700kg.
For those overseas, the above figures are those of a ‘visitor’ we have had prowling (and closing) our local beaches for the past 9 days or so…..a Great White.
To put this in perspective, I own a 2003 Holden Monaro CV8-R (Pontiac GTO in USA, Vauxhall Monaro VRX in GB), it is 4.8m long and it’s weight is 1586kg!
Git,
Wow, that’s the equivalent of snow on July 17th in the Northern Hemisphere. I thought Tasmania was warmer than that.
You need some global warming! Better keep Algore far away.
No sharks this far above sea level; it’s too cold for them 😉
Average temperature range for January here is 10 – 22°C. It’s still 9° @ 11 am today. Hottest ever was a couple of years ago: 40°.
Don’t worry about Algore. They tell me rendered fat makes a fine fuel to keep warm. And burning fat generates plant food 🙂
TPG … we’ve had an abundance up here in Brissie for the past few days, bloody trough sitting right over the top of us refusing to beggar off. Turn on your fans and send the cold up here, please.
Streetcred, the fans are blowing somewhere. Wind speed gusting to 50 k/hr +. Temp has reached 15°, probably the maximum for today.
You could become the first climate refugee and migrate to somewhere where there is better warmth!
Lots of “non-technical” folks I’d labored over the years to “bring around” on this subject turned their backs on me this week. This most recent government propaganda blast was grievously effective.
Showing them a chart of the temps of the last dozen years or so should help.
It won’t go on forever. As it is they have to keep ramping things up, year after year. They’re stuck on this treadmill, and the only thing they can do is fall off sooner or later. (Especially if my own perceptions are correct and it’s been cooling for the last 5-10 years.)
Another great post Bob. Thanks for all you do.
I would like to point out a question asked on another blog.
I think that is a great question. Site policy forbids listing a link to the very sort essay but anyone interested could find it by a google search.
The only thing we know for sure is that, overall, the climate has warmed some since the end of the Little Ice Age. I hope that the climate is still warming a bit and recovering (overall) from the LIA as I think the climate is way too cold right now. Give me more warmth!
~ Mark
The WMO know that NOAA’s claims are unscientific, saying this in 2007:
All temperature values have uncertainties, which arise mainly from gaps in data coverage. The size of the uncertainties is such that the global average temperature for 2006 is statistically indistinguishable from, and could be anywhere between, the first and the eighth warmest year on record.”
https://notalotofpeopleknowthat.wordpress.com/2015/01/17/wmo-demolish-noaanasa-claims-of-hottest-year/
The devil’s the details. If I could have one wish come true it would be that the media, journalists in other words, always publish headline grabbing averages with the uncertainty of estimate. Alas, this would always slow down a good story.
Are there any CAGWers (individuals, groups) anywhere that are NOT government-funded?
That is very good news. The world hard record warming, and it had no bad effects. The massive widespread deaths due to heatwaves as had been predicted over and over again did not occur.
Quite simply the earth had record warming, and it had no effect. Thus, we should not expect future warming to have bad effects either.
+1
And, also, the feared ‘amplification’ has still not kicked in.
Not only the ‘hottest’ year evaaaah, but we also had the ‘hottest’ decade evaaaaaah. The Earth just trudged along as usual despite their imaginary claims of a deteriorating climate and / or extreme, and inclement weather events.
If anyone wants to claim deteriorating climate / extreme weather trends then you need to do a couple of things.
1) Present the peer reviewed evidence (at least 5 papers which should be easy since it’s everywhere) showing worsening trends for 30 years or more (climate per IPCC / WMO)
AND
2) Show that the worsening trends are caused by man’s greenhouse gases as opposed to natural climate oscillations.
Speculative drivel and caveat riddled papers will be just that.
In fact it felt cold. Must be another strange effect of CO2.
Rooter must have gone to church. No wait. It’s Saturday. There are few thread bombers as prolific (and vacuous)! Rooter, are you an “occupy” fan? Do you “rail against the machine” in your spare time?
Mike,
I wonder if Rooter is aware of Oz usage of the term?
As in “couldn’t organise a root in a brothel”?
I still struggle to accept NOAA were able to determine a global land and sea average to an accuracy of 0.04C back in 1880.
Patrick,
I don’t really have a problem with the 2 decimal places of accuracy back in 1880. When you are just making up numbers anyway, then the number of decimal places is of little importance.
🙂
Temperature of Antarctica was measured from the Falkland Isles for the first half of the 20thC.
Taking into account the uncertainty and assuming all years (1880-2014) in the time series are independent, the chance of 2014 being….
Why would they assume all years are independent when the temperature one year is bound to be affected by the previous year?
That made me stop and think too. I think the answer is the measurement/calculation processes for any point are assumed not to influence the others, however when you come to look at the time series you have additional information because of the autocorrelation in the series i.e. you have other constraints on the estimate beyond the measurement/calculation errors. If this information were used the error bars on the estimates of each temp may change and with it the outcome of the comparison.
David Socrates and Rooter, I made some observations and asked two questions at 09:29 17/01/2015 on this post. Would either, or both of you, care to answer them please?
Your comment @9:29 need to be spruced up a bit.
One thing is “ … cool water is denser (until it freezes) …”
The ocean is “salt water” so things are a little different. See,
http://van.physics.illinois.edu/qa/listing.php?id=1722
“… this heat cannot be convected downwards.”
Here is a very simple diagram of the outflow of the Mediterranean Sea with quite warm high salinity water.
http://upload.wikimedia.org/wikipedia/en/b/b1/Camarinal_Still_Water_Mixing_%28Simplified%29.jpg
This is just one way for warmer water to reach deeper than you are allowing for. Major rivers such as the Mississippi and the Amazon carry millions of tons of sediment and while the river water may float on the sea, the sediment sinks. That sediment is not “freezing” when it gets carried to the ocean, but it does sink.
There is more about this that you can incorporate in your questions to folks such as Socks and Root.
Regards, John.
Thanks John!
Well spotted Bob. In the small print NOAA are saying that 2014 is unlikely to be the warmest year on record. The Press seemed to have missed that.
Nice work Mr. Tisdale. Might I mention the more I see NASA associated with this garbage the less relevant NASA becomes. Gone are the days when we thought of NASA as enlightenment – now I think of them as barely mediocre. How could this organization allow itself to be so utterly marginalized? This should be fun with a republican House and Senate.
“Taking into account the uncertainty and assuming all years (1880-2014) in the time series are independent, the chance of 2014 being
Warmest year on record: 48.0%”
To my mind, this sounds like even more drivel to sex-up the NOAA calculations so as to make them sound “scientific” and give them a patina of gravitas. Statistics on nonsense. The assumption that Nature suddenly resets climate variables to “default” on an annual basis is ludicrous. Oh wait–is that the annual calendar year or the new –to me–“meteorological year,” that I just read about on WUWT? I guess Nature is supposed to know. Let’s declare a new Climate Change Law of Nature: “The Past has nothing to do with the Future,” and calculate some pretend statistics.
I am not able to comment on how not making the assumption of independence would affect the “warmest year” argument–viz., more or less probable. But, for me, this is just another eye-rolling example of built-in bias. Sigh.
I haven’t received my new calendar yet, so I am challenged to mark up the
sighing as well
According to the reference quoted in the NOAA report (Arguez et al, 2013):
“Accounting for persistence between years does not materially affect the results versus presuming statistical independence. ”
http://dx.doi.org/10.1002/2013GL057999
Clear and thorough, Thanks again, Bob (and good work with rooter).
Why don’t you do it?
Not that it would matter.
Thank you Dr. Tisdale, this was very very helpful.
Here’s an article about “hottest year” report.
http://www.wnd.com/2015/01/scientists-undermine-hottest-year-claim-by-feds/
Does anyone but me notice that all of the warming, always, is outside of the Tropics and Subtropics (61% of the earths surface and 73% of the total solar insolation) in the area of negative radiation balance for a spherical earth?
You’re right! Thunderstorms and cyclones cause welcome cooling during cyclone season. This does not happen until the seas gets hot enough. Thank goodness for monsoons.
http://www.washingtonpost.com/blogs/capital-weather-gang/wp/2015/01/16/great-lakes-ice-makes-a-leap-after-january-cold-snap/
Mercy pardon, SACRE BLEU ! 2015 will be the warmest year ever.
I love Paris, ah the French they build monuments to the history they wished they had. I’d love to go back to see the Louvre and the Invalides . Alas some day.
michael
Thanks Bob.
I’ve noted your post on this at Jo Nova – she had hers up a little before yours as she has a day’s head start.
I’ll go in a different direction. I’m old enough to remember when people age about 20 did not believe anything the US government said. Some were so obsessed about their government’s policies that they went to Canada and other better regarded places. Now some of the same folks, in their 60s, are so sure of the things their government does that they can ignore their own senses, history, and basic arithmetic, chemistry, and physics. I have very little contact with today’s 20-somethings but read they too believe all the AGW hype.
Exactly! What gives with the sheeple? With so much technology at their disposal to investigate on their own, one would think the public outcry would dwarf the Vietnam protests and Watergate fiasco. What’s Up With That? (also, remembering well those days…)
My “kids” are in their 20s and they don’t believe what they read about AGW. They’ve left the fold, so my ranting has minimum effect, but they have also had excellent educations in the maths and sciences – not the studies fields. I believe that many lack the equipment or skills to reach their own conclusions from the main stream and many many turn on the boob tube (we don’t have one) to the channels that preach what they want to hear. I don’t know fundamentally how they decided what they want to hear. That is still a missing link for me.
Last year I did a contract at a very techie facility…the younger gens were glued to droids and ipods; movies, facebook, texting, friends, games, junk programs….everything but science, or news of any sort other than the brain dead mass media splash headlines. Also noted how mean they are toward those outside their circle of acceptance. In love with Islam, down with Christians and Jews, (off subject, but an example of extreme lack of understanding culture outside their atheistic proclamation) down with anything that resembles any reasonable code of ethics. So three cheers for those who rise above the norm I experienced. Example: Nice kid says there are too many people on the planet…population needs to be reduced to 500,000. Knowing exactly where he got that notion I asked him if he would volunteer to jump off a cliff. Uh…no…well then who should decided who stays? ANS: …after some pause, “ME” Next question: “can I stay, or are going to you have me terminated…” ANS:” All old people should be exterminated..” …and define old? and so forth it went. And that is just one. They are seriously messed up on their media sharing gratifications.
“highflight56433
January 17, 2015 at 1:36 pm”
Reminds me of the film “Logan’s Run”.
That’s why this AGW thing is such a gift. The 20-year-olds may not be able to analyze an argument, and they may believe all sorts of facile nonsense, but I assume they still go outside – and someday they’ll have to pay heating bills. All the propaganda in the world can’t make people feel warm when it’s cold. So sooner or later the cognitive dissonance will kick in – and kick in big.
John, the young people are fed the AGW line from an early age, if the parents do not teach them how to think for themselves the kids simple accept what they are told. Why would they not? Most of them are open to counter arguments, Show them they are being mislead and that they do have “skin” in the game, that it is about their future and what kind of civilization they will have to live in and they will start thinking for themselves. the problem has been how to reach them to start the conversation. That is the problem we grown-up must address
michael
agreed and our public schools are not helping with any critical thinking
Your “different direction” has got me to thinking. When in my 20s, I considered going to Canada because of that insane Vietnam conflict and my father, a WWII veteran, was just boggled by that – in the mold that what government did had to be good. In his later years, he changed his mind.
I’ve been driving all over town today urging 60 year old folks to attend a meeting and use their voices. With the exception of 1 nuclear engineer and 1 physician, these folks have little science but all thanked me for the opinions I have written in the local paper about climate, global warming, CO2 . . . I asked why they appreciated what I’ve written (and I live in the Greenest state) and they pretty much all said that the propaganda just failed the common sense test.
better regarded than canada? oh, the ignominy.
such as Oz …
“It’s unrealistic to assume the warming of the surfaces of the North Pacific in 2013 and 2014 were caused by manmade greenhouse gases, when they hadn’t warmed in at least 23 years before then.”
Conversely, from the manmade greenhouse crowd, colder years must occur as a lack of greenhouse gases? (ya right)
No! That’s just weather!
Bob Tisdale. Excellent post.
“The year 2014 was the warmest year across global land and ocean surfaces since records began in 1880.”
This is a a non-scientific statement because it is not supported by the data. We should not tolerate non-scientific statements from our government science agencies.
Funny how all the ocean hot spots are in volcanically active areas too.
So the currents, tide, and wind doesn’t move the surface water? Cheers
Here is part of an interesting interview with Dr. James Hansen (2005) via NTZ.
Is there room here for adjustments?
A few years ago, Dr. Richard Lindzen commented to the effect that future generations would look back on this debate and wonder what all the fuss over a few tenths of a degree was. Little did he know that the debate would turn into a fuss over a few hundredths of a degree.
NOAH probability of warmest year from report:
2014 ~48%
2010 ~18%
2005 ~13%
2013 ~6%
1998 ~5%
I wonder if any of the other 10% not shown is found in the 30’s?
NASA probability of warmest year from report:
2014 ~38%
2010 ~23%
2005 ~17%
1998 ~4%
I wonder if any of the other 10% for NOAH and 18% for NASA not shown in the report are found in the 30’s? Would be nice if they could place the charts at 100%, wouldn’t you think?
http://www.ncdc.noaa.gov/sotc/briefings/201501.pdf
Even if you take this article at face value, the reported temperatures do not support CATASTROPHIC Anthropological Global Warming hypothesis, even if you attribute the entire rise to CO2. Politicians are good at changing the argument. We are no longer arguing about catastrophic global warming but rather whether there is any warming at all, and whether a few hundredths of a degree is significant.
All of which are all firmly within the margin of error for the instruments used to collect the data. Once again the Alarmists are all hyped up about NOTHING… Misdirection and Data manipulations… It is truly sad that this is what those we pay to tell us the truth, value agenda over the truth.
Mr Tisdale:
The following graph shows that ave global temps continue to rise irrespective of the ENSO/PDO state.
http://environmentalforest.blogspot.co.uk/2014/04/a-prediction-of-global-surface.html
So – are you saying the El Nino drives GW?
Because plainly it does not, as that is akin to lifting yourself up by your own braces.
The graph shows 1970 onwards but the data behind the graph shows 1950 onwards. cherry pick.
Third hand data that has been tortured and manipulated at every step indicates nothing; especially warming or relations to AGW.
Find direct evidence, preferably something relatively insolated from spurious ‘adjustments’ by people with issues. Use the Satellite temperatures for genuine global influence.
Buy and read Bob Tisdale’s books! You need them.
Toneb says: “So – are you saying the El Nino drives GW? Because plainly it does not, as that is akin to lifting yourself up by your own braces.”

I hadn’t mentioned it in this post, but, yes, strong El Nino events contribute to the long-term trend in global warming. Based on your comment and your link, Toneb, you obviously misunderstand ENSO. ENSO acts as a chaotic, naturally occurring, sunlight-fueled, recharge-discharge oscillator. The aftereffects of the strong El Nino events of 1986/87/88, 1997/98 and 2009/10 can be seen in the sea surface temperature data of the South Atlantic-Indian-West Pacific subset (represents more that 50% of the surface of the global oceans).
The upward shifts (Trenberth “big jumps”) are tough to miss once you know they’re there:
I include that graph, along with the sea surface temperature data for the East Pacific…
…which shows very little warming and represents about 33% of the surface of the global oceans, in my monthly sea surface temperature updates:
https://bobtisdale.wordpress.com/2015/01/07/december-2014-sea-surface-temperature-sst-anomaly-update/
For an introductory discussion see:
https://bobtisdale.files.wordpress.com/2013/01/the-manmade-global-warming-challenge.pdf
But in this post, the discussion of the El Nino conditions were directed toward the uptick in surface temperatures in 2014. See:
https://bobtisdale.wordpress.com/2014/12/04/did-enso-and-the-monster-kelvin-wave-contribute-to-the-record-high-global-surface-temperatures-in-2014/
Bob,
Thanks for your contributions; always welcome. Well, by sane people anyway…
I would like to point out the difference in trends in the surface data and the satellite data over the last two year.. SINCE Gavin took over at NOAA.
Up until that point in time the trends are all pretty much the flat from 2001-2013.
http://woodfortrees.org/plot/hadcrut4gl/from:2013/plot/rss/from:2013/plot/hadcrut4gl/from:2013/trend/plot/rss/from:2013/trend/plot/uah/from:2013/plot/uah/from:2013/trend/plot/gistemp/from:2013/plot/gistemp/from:2013/trend
I now understand why they have been trying to disparage the satellite data…..
…. to make way for their “adjustments” to keep “the warmest ever” farce going.
Via Paul Homewood I have found this on uncertainties. The hottest year claim could be decided by picking your temp.
Reading through the ‘Global Highlights’ at the top of the page I get a Global Temperature for 2014 of 13.085 centigrade.
Quote-“The annually-averaged temperature was 0.69°C (1.24°F) above the 20th century average of 13.9°C (57.0°F)” so (13.9+0.69) adds to 14.59 oC.
Quote-“The 2014 global average ocean temperature was also record high, at 0.57°C (1.03°F) above the 20th century average of 16.1°C (60.9°F)” so (16.1+0.57) adds to 16.67 oC.
Quote-“The 2014 global average land surface temperature was 1.00°C (1.80°F) above the 20th century average of 8.5°C (47.3°F)” so (8.5+1.00) adds to 9.5 oC.
So when I add 9.5 (Land temperature)to 16.67 (Ocean temperature) I get 26.17,then I divide by 2 to get the Average of 13.085 oC.
Is this climastrology or me suffering from Alzheimer’s disease ?
Land area = 30% of the earth’s surface, oceans = 70%.
Using that approximation, technically, I would recommend adding 3/10 of the land global average temp to 7/10 of the ocean global average temp rather than simply adding the two together for an assumed average.
Now, to be more correct, the ocean temperature is a “sea surface (water) temperature” and the land temperature is a “2 meter air temperature” – which is NOT the “land (dirt or ground) surface temperature”. But lettuce not distract you any further as you chase that rabbit down Alice’s hole into wonderland.
So where does the Average of Global temperature of 13.9 oC come from?Cherry Trees?.
Please mister Crook, could you please explain to NOAA where they went wrong, ie, “not dirt temperature” Rabbits have to know’
D.I.
Averaging averages is mad math.
One, i.e. you personally, have to add all of the temperature readings used for the global average, then divide by the number of readings.
You asked, so you get to do the work.
You have to laugh: “easily breaking the previous records.”
I was taught in statistics not to report results to more decimals than the data justified. So 0.04 degrees should be rounded to 0.0
It would be rounded to zero, if it was 0.04º lower instead of higher.
I suspect the timing of the NASA+NOAA (Dept. of Commerce and not really independent) has to do with the World Economic Forum in Davos Switzerland and drumming up fears of climate catastrophe than even NOAA’s love of Numerology.
While “according to NOAA, the chance that 2014 was the warmest on record was 48.0%”, the chance is 100% that the solutions that will be proposed by climate alarmists will converge on less personal liberty, higher taxes and expenses, larger government and yet more socialism.
Me? I am waiting for some peer-reviewed papers that propose what the optimum climate is for our biosphere. The first question that would naturally flow would be where is our current climate and trend in relation to this finding.
Strangely, nobody seems interested in this vital comparison.
Wildlife is thriving in cities up to 10- 20 degrees hotter than the surrounding countryside for starters.
“NOAA has once again shown it is a political entity, not a scientific one. And that’s a damn shame. The public needs openness from NOAA about climate; we do not need to be misled by politically motivated misdirection and misinformation.”
What a shame. All science will suffer from this type of political interference in science.
I predict President Obama will note in his State of the Union address that 2104 was the hottest year on record due to CAGW and that we must cut carbon emissions significantly (he may tout his deal with China) and redistribute wealth from the richer countries to poorer countries as a recompense for our past transgression of polluting the planet. Interesting that the NOAA report came out just before the address.
After adjusting out the ENSO, AMO, solar and volcano impacts (according to a regression model which I have been running for 6 years now),
… the NCDC data would only be the second highest year on record and we have between 0.3C and 1.2C of warming yet to come by the year 2100.
http://s4.postimg.org/5d3eobh0d/NCDC_Warming_2014_to_2100.png
Hadcrut4 produces very similar results, second warmest, 0.3C to 1.2C yet to come etc,
http://s15.postimg.org/jdx6oqdbf/Hadcrut4_Warming_2014_to_2100.png
The lower troposphere temps, however, show much lower warming to date numbers (indicating there are unjustified adjustments in the surface temperature records) and the lower troposphere is actually supposed to be warming at 1.3 times as fast as the surface (the tropical troposphere hotspot) but it is actually the opposite. The lapse rate is changing or the surface temperature records are actually doubly adjusted out of whack. Take your pick. That is what the numbers say. Warming to date, 0.45C, warming yet to come by 2100, 0.55C.
http://s8.postimg.org/mx3q7hx1x/UAH_RSS_Had_AT_Warming_2100_Dec_2014.png
No disasters can come from 0.3C, 0.55C or 1.2C of further warming.
So what you are saying Bob is that NOAA’s number crunching has (let’s see if I can kinda sound like Leif) NOT made an elephant’s trunk wriggle but they said it did anyway.
Ultimate fail this time NOAA. Ultimate fail. Sounds like NOAA has drank the cool aid of post modern science. Ignore gold standard measures of significance. Instead you use WORDS to determine significance. Right? Does this mean that statisticians are unnecessary and not welcomed at your table?
NOAA?
NOAA?
Ferris?
Ferris Bueller??????
Very good charts, Bill. Thanks.
From Climate Audit, regarding the ever increasing overheating discrepancies between models and observations. It notes that 2014 was the fourth highest in recorded history and five of the largest warm discrepancies occurred in the last six years.
My recollection of the beginning of 2014, there was very severe freezing cold temps. I seem to remember that all States saw snow and all five of the Great lakes froze and remained frozen well into Feb./Mar. It was quite a severe winter. Where did all this ”warmest year ever” come from? I don’t remember much reports of exceptional warmth at any time throughout the year.
Eamon.
Thanks, Bob. Very good analysis!
I think this a case of “sour grapes” as a response to a super El Niño that would have resolved the stoppage of global warming into a continuation of it.
Though luck!
WoW like really WoW.
So we started with , “Global Warming” then moved to “Climate Change” then moved to “Anthropogenic Global Warming”, them stumbled into “Carbon Anthropogenic Global Warming” and NOW we arrive at the “Human Pressure Critical Level”.
http://www.savingadvice.com/articles/2015/01/17/1032139_human-pressure-earth-danger-critical-level.html
Edo Emperor GISS Gavin Schmidt announces to President Obama, “We had hit a ‘Human Pressure Critical Level’ Point”.
Ha ha
Of course there are omissions. Grant applications don’t write themselves. Hype wins the day.
I thought NOAA had resurrected the 1930s as the hottest decade not long ago?
Bob–typos:
So, we broke the 2010 record (possibly) by .04. Also 2005. going by 2010 this is .01 a year. We are told we need to keep warming under 2 degrees total. At this rate it would take 200 years. If we go from 05 then it is over 400 years. Obviously I simplified it, and am skipping over many things but I dont see anything alarming here at all. This is getting silly.
It always has been silly, Randy.
It was not silly back in 1880. Just weather. The “weather” got silly…after 1988, politically that is. For most the weather was just…errrmmm…weather!
averages do not exist and are really meaningless, example: john and henry have two apples. john has no apples, whereas henry has 2 apples. on average john and henry have 1 apple each. john is very hungry and wants an apple. but on average he has one apple and should thus stop complaining and stop asking henry for an apple. he should eat his one apple he has on average.
as for rounding. you can only round to the same decimal your data has. if it has 1 decimal you can only round the average to 1 decimal since you have no information about the 2nd decimal: 0.1, 0.10 0.0 is on average 0.0333333333 etc, and thus it must be reported as 0.0. However, the average of [0.1, 0.0, 0.0] is 0.06666666etc and must be report as 0.1. Those are the rules of rounding. period.
edit of typo: first set of data is of course 0.1, 0.0 ,0.0
There was a climate modeler who drowned ina river whose average depth was 2.79 feet.
According to my 1850 desk thermometer “Temp rate ” = 56F .” Sumrheat ” = 76F
The only reliable yearly global temperature data we have are the satellite temperatures from 1979, that is 37 years. The rest of the data is a manipulators paradise.
So when the climate-“science”-industry giants say “This also marks the 38th consecutive year (since 1977) that the yearly global temperature was above average.” what average are they talking about.
The only reliable yearly global average temperature is the 37 yer average and according to the satellite records 2000 and 2008 have been below average and the coldest year was 1984.
http://www.drroyspencer.com/
“The year 2014 was the warmest year across global land and ocean surfaces since records began in 1880.”
Not according to the satellite records. It was the third warmest since 1979.
“The annually-averaged temperature was 0.69°C (1.24°F) above the 20th century average of 13.9°C (57.0°F), easily breaking the previous records of 2005 and 2010 by 0.04°C (0.07°F)”
Again not according to the satellite records. According to them 2010 was not cooler by 0.04 C but warmer by 0.15 C. The difference between the 2 records is 0.19 C or in other words the difference between the satellite data and the climate-“science”-industry giants data is 475%.
600 weather stations in Canada reduce to 35 , mostly based around urban areas. Makes you shudder when you think they are using estimations like that to clobber the west with huge taxes.
Anyway based on that , next time I am at the doctors I will get him to estimate my temp, seems like you can get hundredths of a degree accuracy from that.
I am not the Richard above the Canada article who writes with fluidity.
Lookup “march of the thermometers”.
Thank you richard
The fact is that all this information strongly supports the view that there has been a ‘pause’/’hiatus’/standstill’ to the warming these past 17 or so years. This is the important take home from the latest NOAA release.
Within margins of measurement errors (which I suspect are in any event out by an order of magnitude), it is not possible to detail whether 1998, 2005, 2010, 2013 or 2014 was the warmest years on record. There is no statistical difference in these.
The upshot of this is that there is no statistical significant temperature trend these past 17 years.
Notwithstanding the BAU rise in CO2, there has simply been no measurable warming these past 17 years and it appears (that for the time being) some plateau has been reached but no one knows what will happen next.
The latest data therefore rather than supporting AGW, undermines it.
I also seem to remember (this has not been mentioned for some time on WUWT) the Climategate e-mails and their content of “getting rid of the Medieval Warm Period” and the siting of themometers next to airport runways etc.
It does not matter which aspect of the “science” of AGW that is examined, it all boils down to lies and misrepresentation.
I wonder if anyone has compared the 2010 data when it was released with the 2014 data? I could be interesting to see if it has cooled.
Another significant omission in the summary NOAA press release was the fact the US 2014 ANNUAL TEMPERATURE according to NOAA was only the 33 warmest since 1895 or 2.73 degrees F below the record. The official Environment Canada figures will not be out for another two weeks but going by their seasonal figures, their annual 2014 departure will also be below a record . Thus it would be fair to say that the 2014 North American annual temperature will be l below any record . Now I wonder why this fact was omitted since the press release was for the American public and paid for by the public taxes.
I notice that BERKELEY EARTH did report on the US situation. They said,
4. For’the’contiguous’United’States,’2014’ranked’nominally’as’the’38th’warmest’
year’on’record’since’1850.”
‘
I see little discussion about all of the uncertainties in deriving a global temperature estimate from ground based temperature sensors in the first place. I don’t believe NOAA’s “0.09C” error bar is really representative of all of the uncertainties in the data and is quite misleading in that respect. I have not researched the full uncertainties involved, so I would like to see what others know about this subject since it is very pertinent to understanding the significance of changes in global temperature over time.
I have worked with temperature data for over 40 years primarily in relation to weather forecasting, air quality, and related data quality and representativeness. We now have a flood of surface temperature measurements at our fingertips as can be seen on the Wunderground map globally and these data help to highlight the large variations that can occur over small distances and due to sensor accuracy and exposure. We also now have a tremendous number of automated weather stations at airports with fairly uniform siting criteria and even the USCRN. The vast majority of these measurements are not used for determining global temperature over historical periods, in part because many of them did not exist even 20 years ago.
But I digress. Back to uncertainties in global temperature estimates based on near-ground-level sensor measurements. My gut feel for uncertainties includes the following.
1) Station temperature sensor measurement ~0.2C
2) Station representativeness of temperature measurement for a broader area ~0.5C
3) Selection and homogenization of the data ~0.5C
4) Lack of station coverage over much of the globe ~1C
Some of these uncertainties tend to cancel out by averaging and random nature over time. On the other hand, changes of representativeness over time, as in increasing urban heat island effects over time at many stations or station moves, may add to uncertainties over larger time scales. Changing sensor technology and siting criteria are also likely to add to uncertainty over larger time scales.
If I add up my numbered uncertainty estimates above, the total is over 2C. I realize that these uncertainties are probably not additive, but my best guess is that trends in temperature anomalies over time scales of 30 years or more are probably no more accurate that about 0.5C and quite possibly less accurate. Again, I am no expert in this matter and I would like to see how others feel about the full uncertainty in these global temperature estimates and trends over time.