Guest Post by Bob Tisdale
This post includes calendar year 2014 global surface temperature data from GISS and NCDC.
I thought it would be interesting to begin the introduction as if GISS and NCDC were announcing year-end business profits at their press conference today. [sarc on.]
INTRODUCTION
Today, two of the world’s climate-industry giants—the NASA Goddard Institute for Space Studies (GISS) and the NOAA National Climatic Data Center (NCDC)—posted their much-anticipated annual results for 2014. According to GISS, global surface temperature anomalies were an astounding +0.02 deg C higher in 2014 than they were in 2010, making the 2014 results the highest in the history of GISS. These record-breaking results from GISS are under the guidance of their new Deputy Director, Gavin Schmidt. If you’re not familiar with numbers that remarkable, they’re read two one-hundredth of a deg C, which is equal to less than four one-hundredths of a deg F. According to the NCDC, their global surface temperature results were +0.04 deg C higher in 2014 than they were in 2005 and 2010, their two previous best years. The warmest years are within the margin of uncertainty for the data*, making it impossible to determine which year was actually warmest. Even so, these results bring new hope to global warming investors, who have had to endure disappointing results in recent decades. GISS and NCDC are once again showing why the CO2 obsessed turn to them for global warming data. GISS and NCDC are global-warming industry leaders…known for eking out record years from poor source data, even during these hard times of global warming slowdown. In related news, based on similar source data, Berkeley Earth too announced record highs in 2014, but only by 0.01 deg C. [sarc off.]

Figure 1
*The uncertainties are assumed to be the same as those shown in the Berkeley link (in the range of +/- 0.04 to 0.05 deg C).
Those results, especially the NCDC results, appear somewhat curious. We showed in the post here that the Meteorological Annual Mean (December to November) were 0.01 deg or less between 2014 and 2010. Then again, the differences between the Meteorological Annual Mean and Calandar Mean are being measured in hundredths of a deg C.
There will be all sorts of bizarre proclamations now that the 2014 global surface temperature data from GISS and NCDC (and Berkeley Earth) were found to be a tick warmer than the prior warmest year(s).
What eludes those making the claims—or what they are purposely directing attention away from—is the growing disagreement between the real world and the global surface warming simulated by climate models.
MODEL-DATA DIFFERENCES
We’ll use the GISS data for this discussion. Similar graphs, but with the NCDC data, follow later in the post.
The teeny-tiny uptick in global surface temperature anomalies does not really help the growing difference between observations and the projections by climate models…because the modeled surface temperatures continue to rise, too, and modeled surface temperatures are rising faster than observations.
Figure 2 presents the annual GISS global surface temperature data for their full term of 1880 to 2014. Also shown on the graph is the average of all of the outputs of the simulations of global surface temperatures by the climate models stored in the CMIP5 archive, models with historical forcing through about 2005 and with RCP8.5 (worst case) forcings thereafter. The predictions of gloom and doom are based on the worst-case scenarios so we might as well use them for the comparison. The models stored in the CMIP5 archive were used by the IPCC for their 5th Assessment Report. Anomalies were calculated against the averages for the period of 1880 to 2014 so that the base years did not bias the presentation.

Figure 2
We use the average of the model simulations (the multi-model ensemble member mean) because it best describes how surface temperatures would vary if (big if) they varied in response to the numerical values of the forcings (anthropogenic greenhouse gases, aerosols, etc.) used to drive the climate models. For a further discussion, see the post here.
It’s very plain to see that the observed global surface temperatures have not risen as fast as predicted by climate model simulations in recent years.
Let’s put the growing difference between models and observations into perspective. We’ll subtract the annual values of the data from the modeled values, and we’ll smooth the difference with a 5-year running-average filter (centered on the 3rd year) to reduce the volatility from El Niños, La Niñas and volcanic aerosols. See Figure 3. The horizontal red line is the value of the most recent model-data difference—for the 5-year period of 2010 to 2014. Over that period, the model projections are running on average about 0.17 deg C too warm. Keep in mind, these climate model projections are only a few years old and already their performance is terrible.

Figure 3
We can also see that the models have not simulated surface temperatures this poorly (have not deviated 0.17 deg C from reality) since the 5-year period centered on about 1910. That earlier deviation was caused by the model failure to properly simulate the cooling of global surfaces that took place from the 1880s to about 1910. The present deviation is caused by the model failure to simulate the recent slowdown in global warming.
30-YEAR MODEL-DATA TRENDS
The carbon-dioxide obsessed often say we need to look at 30-year trends, so let’s do exactly that. See Figure 4.

Figure 4
An explanation of what’s shown in that graph: Each data point presents the 30-year linear trend (warming and cooling rate) as calculated by MS EXCEL in deg C/decade. The last data points at 2014 are the linear trends (warming rates) for the 30-year period of 1985-2014. Working back in time, the data points at 2013 are the warming rates for the period of 1984-2013…and so on, until the first data points at 1909, which show the model and observed trends for the period of 1880 to 1909. The term “trailing” in the title block indicates the data points are keyed to the last year of the 30-year terms.
The 30-year period when global surfaces cooled fastest ended about 1909. At that time, the models showed surface temperatures should have been warming if Earth’s surfaces responded to the forcings in the same way as the climate models. Obviously they didn’t. From the 30-year periods ending in 1909 to just before 1925 (when the data trends were still negative but the negative trends were growing smaller) global surfaces were cooling, but the cooling rate was decelerating. (To simplify this discussion, keep in mind that the years discussed are the last years in 30-year periods.) Starting just after 1925 and running through about 1945, Earth’s surfaces had warmed and the observed 30-year warming rate grew faster (accelerated), while the models did not show the same multidecadal variability in warming over that time.
IMPORTANT NOTE: In fact, for the period ending in 1945, the climate models show that global surfaces should only have warmed at a rate that was about 1/3 the observed rate—or, in other words, from 1916 to 1945, global warming occurred at a rate that was about 3 times faster than simulated by climate models—or, to phrase it yet another way, natural variability was responsible for about 2/3rds of the warming from 1916 to 1945. If Earth’s surfaces warmed much faster than simulated by the models, then the warming was caused by something other than the forcings used to drive the climate models…thus it must have been natural variability. Of course, that undermines the claims that all of the global surface warming in the latter part of the 20th Century was caused by man’s emissions of carbon dioxide. If natural factors were capable of causing about 66% of the global warming from 1916 to 1945, there is every reason to conclude that a major portion of the global surface warming during the latter warming period was caused by natural factors. The fact that the models better align during the latter part of the 20th Century is not proof that the warming in that period was caused by manmade greenhouse gases…the climate models have already shown that they have no skill at being able to simulate global surface temperatures over multidecadal periods. [End note.]
From 1945 to about 1964, observed global warming over 30-year time spans decelerated at rates that were much faster than simulated by models. But the modeled trends aligned with the data from the mid-1950s to the late 1960s, then diverged slightly during the 1970s and realigned until about 2003.
Over the last 11 years, the observed 30-year global warming rates decelerated slightly while the climate models show that global warming should have continued to accelerate…if carbon dioxide was the primary driver of global surface temperatures. While the 30-year trends do not show global cooling at this time, they also do not show global warming accelerating as predicted by climate models…and that is the problem that climate scientists are still trying to explain and coming up with dozens of excuses. If history repeats itself, global warming will continue to decelerate, maybe for as long as another 20 years.
30-YEAR MODEL-DATA TREND DIFFERENCES
Figure 5 shows the differences between the modeled and observed 30-year trends (trailing) in global surface temperatures. Referring back to Figure 4, the data trends were subtracted from the modeled trends. For the 30-year period of 1985 to 2014, the models show that global surfaces should have been warming at a rate that’s about 0.085 deg C per decade faster than has been observed. The last time the models showed 30-year global warming rates that were that much faster than observed was around 1920. Now consider again that these climate model projections are only a few years old.

Figure 5
NCDC GLOBAL SURFACE TEMPERATURE DATA
Figures 6 through 9 are the same as Figures 2 to 5, but with the NCDC global land+ocean temperature anomaly data. The curves are so similar to those with the GISS data that there’s no reason to repeat the dialogue.
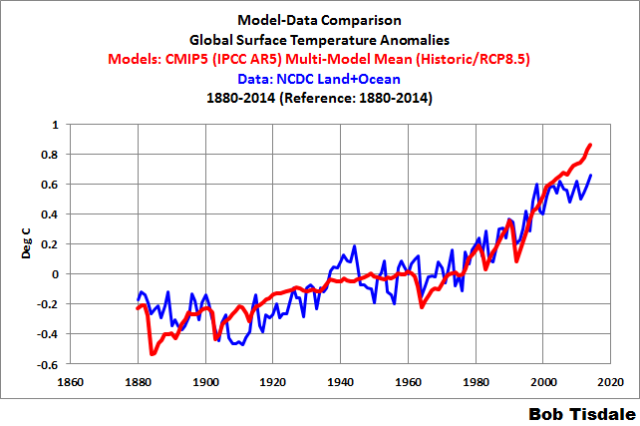
Figure 6
# # #

Figure 7
# # #

Figure 8
# # #

Figure 9
THE REASON FOR THE 2014 UPTICK IN GLOBAL COMBINED SURFACE TEMPERATURES
Figure 10 presents the global sea surface temperatures for the period of 1997 to 2014 based on NOAA’s ERSST.v3b data, which is used by GISS and NCDC for their combined global land plus sea surface temperature datasets. The 2014 value was 0.044 deg C warmer than the previous warmest year 1998. Obviously, because the oceans cover 70% of the surface of the planet, the uptick in global combined surface temperatures was the result of the larger uptick in global sea surface temperatures.

Figure 10
We have been discussing for more than 6 months the reasons for the record high sea surface temperatures in 2014. Recently, we confirmed that the uptick in global sea surface temperatures was caused by the unusual weather event in the eastern extratropical North Pacific. See the post Alarmists Bizarrely Claim “Just what AGW predicts” about the Record High Global Sea Surface Temperatures in 2014. No other ocean basin had record-high sea surface temperatures in 2014.
The following is a reprint of a discussion from that post under the heading of On the Record High Sea Surface Temperatures in 2014:
Again, of the individual ocean basins, only the North Pacific had record high sea surface temperatures this year, and the weather event there was strong enough to cause record warm sea surfaces globally, in the Pacific as a whole and in the Northern Hemisphere.
We’ve been discussing the record high sea surface temperatures since the June Sea Surface Temperature (SST) Update. We identified the location of the unusual weather event, the likely reasons for the record high sea surface temperatures and the fact that climate models could not explain that warming in the post On The Recent Record-High Global Sea Surface Temperatures – The Wheres and Whys. We discussed the topic further in other posts, including Axel Timmermann and Kevin Trenberth Highlight the Importance of Natural Variability in Global Warming… Our discussions of the unusual warming event in the eastern extratropical North Pacific were confirmed by the 2014 paper by Johnstone and Mantua (here) which was presented in the post Researchers Find Northeast Pacific Surface Warming (1900-2012) Caused By Changes in Atmospheric Circulation, NOT Manmade Forcings. Jim Johnstone, one of the authors of the paper, joined us on the thread of the cross post at WUWT and provided a link to his webpage. There you can find a link to the paper. Also see his comment here for an update on the recent unusual warming event in the extratropical North Pacific. Under the heading of NE Pacific coastal warming due to changes in atmospheric circulation at his webpage, Jim Johnstone updated one of the graphs from their paper and wrote:
Jan 1980 – Nov 2014. NE Pacific monthly coastal SST anomalies (red) and SST modeled from regional SLP. Recent warming from Jan 2013 to Nov 2014 occurred in response to low SLP over the NE Pacific, consistent with long-term forcing. Gray bars mark data beginning in January 2013 that were not included in the study. Negative SLP anomalies generate anomalous cyclonic winds, reducing the mean anticyclonic flow and winds speeds throughout the Arc. The drop in wind speeds reduces evaporation rates, producing positive surface latent heat fluxes and SST increases.
Also refer to the NOAA summary and FAQ webpage about Johnstone and Mantua (2014) for discussions about the paper in less-technical terms.
As we’ve been saying for years, coupled ocean-atmosphere processes can and do cause regional warming, which, in turn, lead to the warming of ocean surfaces globally.
ONE LAST NOTE
The NOAA press release from Wednesday includes the following statements (my boldface):
NOAA and NASA independently produce a record of Earth’s surface temperatures and trends based on historical observations over oceans and land. Consistency between the two independent analyses, as well as analyses produced by other countries, increases confidence in the accuracy of such data, the assessment of the data, and resulting conclusions.
NOAA and GISS may produce the surface temperature data independently, using different methods to infill missing data, but they rely on the same sea surface temperature data (NOAA’s ERSST.v3b) and, for the most part, on the same land surface air temperature source data (NOAA’s GHCN). Though GISS does include a few other surface temperature datasets in areas where the GHCN data are sparse, they rely primarily on the same data for both land and oceans. They cannot be independent if the suppliers rely on the same source data.
CLOSING
As illustrated and discussed, while global surface temperatures rose slightly in 2014, the minor uptick did little to overcome the growing difference between observed global surface temperature and the projections of global surface warming by the climate models used by the IPCC.
This post will serve as the annual surface temperature update for GISS and NCDC. The full monthly update will follow later in the day or tomorrow.
SOURCES
See the GISS global Land-Ocean Temperature Index (LOTI) data page and the NCDC data are accessible here (can be very slow).
(A wasted posting effort by a banned sockpuppet. Comment DELETED. -mod)
A cheap shot. No Info or explanation.
*ignore*
(A wasted posting effort by a banned sockpuppet. Comment DELETED. -mod)
@icouldnthelpit,
So explain. What Law of Energy? E=MC^2? That doesn’t see to fit.
icouldnthelpit
A good troll technique is to make unfounded/documented claims (you’ve done that).
Unfortunately, WUWT is not a good troll environment.
Either man up, state & defend your differences with Bob, or go away.
That anonymous troll routinely shows up and makes ad hominem attacks on Bob T.
(A wasted posting effort by a banned sockpuppet. Comment DELETED. -mod)
Delete.
What on earth are you babbling about? There is no such thing as “The Law of Energy”, There is conservation of energy and there are the laws of thermodynamics. I’m pretty sure Bob Tsidale understands those concepts better than some anonymous, internet blow hard.
Don’t feed the troll, but don’t delete his/her/its ranting either
and you sir are an idiot
Wow, icouldnthelpit! You’re clueless, aren’t you? You obviously haven’t any idea about what was presented in this post.
You need to go back to troll school. Come back in a couple of years.
+1 “go back to troll school” = Priceless
Isn’t Miriam O’Brien the Head Mistress of Troll Sckool?
(A wasted posting effort by a banned sockpuppet. Comment DELETED. -mod)
Please quote said law.
What “Law of Energy”? Perhaps you are referring to the Law of entropy. Or perhaps the law that states the total amount of energy in the universe is constant Or perhaps the Law of Conservation or perhaps the First Law of Thermodynamics or perhaps the laws on energy being passed by various governments which pertain directly to the law of being clueless.
Hah! How do you argue with that, “The Law of Energy.” I don’t think any of us have the Holy Book of Global Warming where this law must be stated. Thank you for choosing WUWT to express your freedumb, we all enjoy a good laugh here.
wow I like it! “freedumb” it really is appropriate for so many things! thank you for the laugh RWturner. I should say laughs as I am sure to think of it and laugh later on.
Cheers,
Joe
Hey icouldnthelpit I have another “Law” you can memorize.
Q: What is the simplest way to observe the optical Doppler effect?
A: Go out at and look at cars. The lights of the ones approaching you are white, while the lights of the ones moving away from you are red.
What’s the law of energy?
How much model-data difference would Bob categorize as the models performing well?
Bill2, Im not Bob, but my answer is “it depends on what you want to do with the model results” . In the past I ran models for other reasons, and the idea was to have models give us a set of curves with possible outcomes. Using these we decided whether and how to spend up to say $5 billion dollars. Given what I see in those models I would want a much tighter match of a 50 run ensemble which uses actual greenhouse gas concentrations and solar forcing. Average within 0.1 degrees C and a well crafted coherent explanation for the model and real life behavior. And no weird tricks.
I would also want a resolution of what’s the actual temperature. I don’t want anomalies when I have to consider what happens to corn crops.
Thanks, Bob.
Now we get annual global temperatures measured to hundreds of a degree!
This is because if expressed in tenths of a degree they show no change at all.
I have access to 7 phones. Their average number is 492-220-7784.166667
So you now have my precise telephone number
The value and its precision is about as meaningless.
You calculated the average wrong. You divided by 6 and not 7.
Of course it is possible that your sum (before the averaging step) ended in xxx8.166669 – but I think that unlikely.
I guess I don’t understand “The Law of Energy” either. What is it?
🙂
Whats funny is they measure savings account interest in hundredths also. What is different is that getting 2 hundredths of a percent interest is a completely negligible meaningless amount of return, while 2 hundredths of a degree increase in temperature is apparently cataclysmic.
Fortunately we only have to pay more tax dollars and more for energy to pretend to solve the pretend problem and all be happy.
Yes their .02 interest increase may be there, but due to inflation, we are still ending up colder.
https://notalotofpeopleknowthat.wordpress.com/2014/06/26/massive-temperature-adjustments-at-luling-texas/
https://stevengoddard.wordpress.com/2014/06/01/more-than-40-of-ushcn-station-data-is-fabricated/
LOL – thoroughly enjoyed Bob’s “year end profits” style of presentation.
However, speaking as a retired CFO, any public company presenting financial results as poorly measured and requiring constant “restatement”, such as the supposedly “scientific” climate data, would have an immediate and serious Sarbanes-Oxley problem.
‘Growing Difference between Climate Models and Reality’
And reality says
‘2014 was hottest year on record’
2014 was hottest year on record across the globe, US government scientists say
http://www.bbc.co.uk/news/science-environment-30852588
And this when solar cycle 24 is the lowest sunspot record since 1910. With no El Nino and with tons of Chinese smog reflecting the sun’s energy back to space. . .
There was an El Nino this year. Believe it or not, NOAA did not invent the phenomenon and their definition of what an El Nino is is quite arbitrary.
Global heat content will not react immediately to changes in solar activity. See thermal inertia.
Tisdale is doing his usual technique which resembles, metaphorically, someone who takes a microscope to a photo of a supermodel and finds what he thinks is a nasty mole or a zit and screams out to anyone who will listen “look she’s ugly, and so are all her relatives too!” Sometimes he might find a tiny insignificant flaw in the supermodel’s perfection but quite often what he mistakenl thinks is a real problem is actually an artifact the photo – a dodgy pixel, not evidence of ugliness at all!
If there were as many flaws in mainstream climate science as this website portrays, how come even Big Oil now no longer disputes the science, as anyone can see if they look on their corporate web sites, starting from the largest – Exxon-Mobil – on down. You won’t find a trace of “sceptic” views nowadays. Big Oil has the biggest financial incentive to want to believe that there are holes in mainstream climate science, yet they no longer do. In the light of this development in Big Fossil Fuel’s position over the last few years, surely contributors to this site should realise that their beliefs simply must be mistaken?
BIg Oil has simply adapted to its regulatory environment. Perhaps we should simply adapt to the climate as it changes too.
Sorry, Nick, your analogy doesn’t work. Climate models aren’t simulating Earth’s climate. And these aren’t microscopic problems in climate models; they blatantly obvious failures.
Cheers.
Exactly the opposite. It’s the government agencies that use the “microscope” to make a few hundredths of a degree warmer as the “Hottest year ever” alarm. Stepping back, to the big picture, if AGW theory was correct and the IPCC models valid, then almost every consecutive year would lead to a new “hottest year ever” claim.
What in fact we see is a temp anomaly trend that is flat for 15+ years, with small ups and downs corresponding to rhe El Ninos and La Nina episodes. Meanwhile, as Bob hammers home, the models’ upward projections continue to worsen the growing discrepancy between in silico temps and real world temps.
I am sorry Nick, the fact that “Big Oil” does not fight it anymore is $$$. They tend to get pounded in the stock market if they say anything politically incorrect. If their logo offended any religion other than CAGW, they would get pounded too.
Concerning that there is a large overlap in the “sky is falling” believers and the “we’re at peak oil and gas prices can only every go up” believers, perhaps Big Oil is trying to get in on the Green bandwagon. See: plunging oil company revenue…
You know, that thing were lowly taxpayers like myself pay more in taxes, and somehow, big companies reap the windfall.
Peak Oil, first defined as the day of peak production. Then as reserves grew, still valid if the original estimates were revised upward retroactively. Then, realizing technology might affect both demand and supply, the definition changed to the day the cost of oil would become unaffordable because new technologies are expensive. Finally realizing that the cost of technology is not static, in fact it becomes more cheaper and more efficient over time, adherents to the theory are scrambling for a new definition!
It will be fun to see what they come up with.
Personally I think the value of the last barrel of oil will be zero because it won’t be needed. But that doesn’t mean today’s major energy companies won’t be deeply invested in whatever replaces it by that time. Big Oil is really Big Energy, and the guys running these companies aren’t fools.
Where exactly are these windfall profits? They would LOVE to find them! Perhaps you should check on where oil companies rank in profit margins compared to other industries.
Want to know where your money goes when you buy gasoline? 13-20% to the royalty owner, 12% to the local government where the oil was produced, 8% to the state it was produced in, and 25-40% to the federal government. Take out the cost of the investment and that explains why oil companies rank near last in margins among all industries.
But rest easy knowing that companies like Apple have twice the margins because they are providing the world with a necessity, not that worthless energy stuff. /s
In the oil industry we define crude oil as a hydrocarbon found in the reservoir in liquid conditions. At this time we are hovering right around peak oil.
We also have a class called condensates. These are found as a gas phase hydrocarbon which condenses at the surface. Condensate production has been increasing a little bit due to increased gas production around the world, and the tremendous push to produce the Eagle Ford formation in Texas.
If we add crude and condensate we get a liquid class we can feed to a refinery. This class is barely increasing (due to condensate increases and some rather marginal developments which rely on high prices). So we can say the crude and condensate class will require high prices to continue rising (my guess is upwards of $100 per barrel).
The statistics also lump natural gas liquids in the total. But those aren’t oil. They are ethane, propane, and butane.
Other liquids being tossed in the pot are ethanol and biodiesel. There’s also a small amount of syncrudes from gas and coal.
With that background in mind now you can handle the topic with a bit more sophistication. And when you sharpen the pencil you will see we are indeed approaching the peak of crude and condensate. This means replacements are already taking place. And the current low price environment will be short lived. By 2035 we are going to be in a much tighter market.
Fernando Leanme – An intelligent comment!
We probably have reached peak production of conventional oil. The huge layoffs currently occurring around the world in the fracking and drilling industry with oil at under US$50 a barrel attests to that. If Saudi keeps pumping as they are, they will see a decline in production and have to drill/frack more wells and that will put oil back to the $65 – $100 per barrel oil where Bakken and other non-conventional oil becomes profitable. You will likely see Peak Production in less than 15 years, and then we’ll see coal gasification and other technologies in play. I may be too old to see it happen, but I wish my children and grandchildren well with new energy management. Bonanza Pilot – You are right of course. The Oil Producing nations have several definitions for peak oil. I don’t remember them all but someone here will I bet.
Big Oil has simply learned how to play the game. It’s all part of marketing now. For example, if companies contribute to Al Sharpton’s “charity” (National Action Network), he leaves them alone. Otherwise, he’ll call their business policies “racist” and engage in a shakedown operation that hurts profits. Even Fox News gave him money. In a similar way, if you contribute to environmental groups, you can get them to leave you alone. If you contribute to Democrats, they’ll refrain from attacking you and might even steer some government business or grants your way. It’s called crony capitalism. Of course the right engages in it too. But for the left, it’s the only form of capitalism they like.
Projection
Sorry guys, your responses just don’t realistically stack up in the real world of financial bottom lines. Let me repeat an excerpt from my comment which you all appear to have missed…
“Big Oil has the biggest financial incentive to want to believe that there are holes in mainstream climate science, yet they no longer do”
Get that? All of your “they’re doing it for politically correct reasons” speculation just doesn’t fit. If there truly were the significant discrepancies which you guys seem to think are real, then Big Oil be trumpeting your findings from the rooftops to protect their (humongous) bottom lines. Instead, there is not a shred of your arguments on their corporate websites. Check ’em out!
Remember, Big Fossil Fuel has more money than God to pay the best analysts on earth to find genuine reasons why the emissions from their primary product are not a clear and present danger to civilisation. If your ideas had much validity, if Bob Tisdale’s ideas had much validity, they would be beating a path to your door. Any of you hear knocking on your doors any longer? No? I thought not.
“then Big Oil be trumpeting your findings from the rooftops”
Oops! Should be:
“then Big Oil would be trumpeting your findings from the rooftops”
Oil at sub $50/b means lights out for green energy and climate alarmists like Nick Palmer who is looking for “significant discrepancies” which is exactly the point…there aren’t any. Climate changes, man has little to do with it. “Big Oil has the biggest financial incentive to want to believe that there are holes in mainstream climate science, yet they no longer do” is the mantra of a fool. We buy oil and gas from big oil willfully and without coercion. Big Government collects taxes at gunpoint. The End.
Nick, I would imagine “Big Oil” learned their lesson from the tobacco industry. When the American Cancer Association funded a 25 year study into causation of lung cancer in non-smokers with second-hand smoke, their initial findings after 20 years were negative; they pulled the funding. The tobacco companies funded the study for the remaining 5 years and when the results were published there was no risk to non-smokers. Of course all the “good guys” collectively stated that the study was funded by the tobacco companies and of course it would say that wouldn’t it.
This is modern “science”, belief transcends logic.
Actually, Nick, Big Oil is playing the game perfectly. If Big Government wants to throw Billions at Green Energy the oil companies want to have their hand in that sizable pocket. What a better way than to agree that climate change is a problem and start developing “green” energy projects for the government handouts.
If governments were to crack down on oil and gas production, they are now a “green energy” company. If green energy fails/AGW finally accepted for the farce it is, they are still an oil/gas company. If they were to post things to their website or say things publically against CAGW do you think the government would keep giving them money?
All the while they are drilling and pumping more oil and natural gas than ever…. it is a brilliant strategy IMHO.
““then Big Oil be trumpeting your findings from the rooftops”
Are they trumpeting the findings of NOAA?
I would think at this point, it’s better for them to stay neutral, and take any AGW benefits ($$) thrown their way?
Your premise is flawed in thinking “Big Oil” is single minded against AGW. These companies are not run by idiots, they have learned how to game the system quite well. It’s quite logical for them to place themselves on the side of the Government policy makers, what every the political direction blows to maintain their subsidies and virtual monopolies on energy.
If you understand that government issued regulations can work not only to prevent “environmental harm” from being done, they also work to keep competition at bay. So it makes perfect sense to go with the flow so to speak. Hardly a win for the warmists, solid win for the cronies. /
“Big Oil has the biggest financial incentive to want to believe that there are holes in mainstream climate science, yet they no longer do.”
“Big Oil” are countries like Saudi Arabia. What you really mean is “Big Energy” as these companies provide energy, whether it is manufactured from fossil fuels or not.
Your claim about “Big Energy” having a financial incentive to dispute global warming is false. Since Governments are subsidizing solar, wind, ethanol, etc. “Big Energy” is actually getting money because of it.
You made your point the first time, now you’re sounding desperate.
I’m at a loss on how to debate people that keep claiming that abstract objects have opinions.
Hint: Big oil cannot have an opinion. Big oil is not a something you talk to or even touch and certainly is not a cognitive entity. Just like NASA, NOAA, Universities, private organizations, etc. are incapable of cognitive activity. I feel like anyone that doesn’t understand this is incapable of the intellect needed for a scientific debate.
Nick Palmer apparently never heard of Jonathan Gruber.
Nick, consider why the “Big Healthcare” insurance providers in the US were on-board with ObamaCare. They were guaranteed a source of millions of new customers, subsidized by the taxpayers. The downside risk was met with guarantees of revenue protections from losses (due to many of those new customers’ pre-existing conditions), with the “risk corridor” provisions funneling tens of billions of dollars into the insurance industry’s bottom lines, an individual mandate to force healthy young single men to have maternity coverage, and a bounty of new forced taxes to keep the pyramid scheme running.
Now look at your “Big Oil” and the AGW scam being run by the Watermelons and their Progressive allies.
1. Nuclear power is being slowly shutdown. Coal production and power generation from coal is being severely throttled. Steel, cement, and electricity production will continue though.
2. Wind generation and solar electric, as anyone with a modicum of intelligence should realize, can not and will not even come close to replacing the lost generation capacity of coal and nuclear. The wind stops blowing and night always follows daytime, so electricity generation to meet demand must continue.
3. The Greenies love embracing electric cars as the way of the future. Plug in that car, drive to work, and back home. Never buy another gallon of gas again… right? Oops… what does that plug-to-wallsocket attach to (in the electrical connectivity sense)?
The only conclusion one can come to is:
4. Drill baby drill. No other choice. And now more of it because of decisions to cut back on coal and nuclear. And now the energy companies are guaranteed to pass on the costs to consumers, get in on the action of carbon trading schemes, and other liberal wealth re-distribution schemes, that merely increase taxes on the middle class.
Now some like to compare Big Oil companies to the Big tobacco companies. But lets be clear there. Smoking is entirely a voluntary recreational activity for mankind.Driving to work, keeping your home, office, and factory warm or cooled, lighted and humming is mandatory. Running the world’s’ agricultural machine and distributing the fruits of that bounty to feed 7+ billion people is mandatory.
There’s nothing available to tell us that oil companies use that “clear and present danger” line you used. I just checked several websites, and the strongest I got was this from Shell:
“Shell’s future energy scenarios don’t see the 2°C objective being met. However, they do suggest that you can bring emissions down to nearly zero within this century and effectively stop the further build-up of CO2 in the atmosphere.”.
In other words, what Shell is writing is that we could bring emissions down to nil by 2100. Big deal. Shell knows by then oil will be history, gas would be nearly depleted, coal would be very expensive, and replacements will have kicked in.
I already published an estimated concentration peak at around 630 ppm due to fossil fuel burning, which takes place before the end of the century. I don’t see a problem with their position.
Other companies aren’t as aggressive as Shell. And why are they publishing these platitudes? Because their oil production is already going down. Take the sum of oil production for the five largest privately held companies and you’ll see they already hit their peak. Also, this way they avoid stupid lawsuits by entities who want to blame climate incidents on them.
But I thought that all the skeptics were receiving massive amounts of money from Big Oil. Can’t have it both ways, can you?
Strange kind of a distraction.
” If there truly were the significant discrepancies which you guys seem to think are real,”
What we would like to see is where you can show there is NO discrepancy. There is a lot of illustration in Bob’s post, can you please provide similar that shows he is wrong? So we can see where you’re coming from.
Eamon.
It’s not just Big Oil that “gets it.” We also have years of reports from military machines around the globe about peak oil, AGW, etc. The financial marketers also know what’s up: One of the best summaries ever is from British money market trader Tullet Prebon: “Perfect Storm” by Dr. Tim Morgan. Check it out.
So called “Big Oil” doesn’t give a hoot about the Global warming idiots and offers very little to the so-called deniers , simply because the AGW movement is to the advantage of big oil . Lets get one fact right , oil is going to be continued to be used for the next 100 years and there is no way around it . Bio fuels (Growing crops to produce high energy density liquid fuel)is stupid, inefficient and many other negatives which the “Industry ” is rapidly finding out now.
Agriculture production is totally reliant on fossil fuels for its production, processing and distribution . Go and tell those people involved in Agriculture that they will have to get rid of fossil fuels and they won’t stop laughing for 10 minutes. How are you going to power a 400hp tractor for 10 hrs a day that uses 200 liters of diesel a day and does the work of 100 men. Batteries ? alcohol? and please no one suggest Hydrogen!
No, the restricting of fossil fuel use which will happen will only increase the value of the stock in the ground. It will continue to be used but at a higher price (when the economy come right) and over a far longer time line therefore very much more profit in the long term. And one more thing .It is a myth oil will run out, it won’t , it will just get more expensive .
Actually Nick, if you are an “energy” company, and you see peak oil down the road, then maybe you should start drilling for gas, or investing in coal gasification, or in nuclear, or …
Like Siemens and GE – they can build turbines for wind, coal, gas, steam, nuclear, Ivanpah like solar – doesn’t matter, it’s just business and only they know what the real reserves of different grades of fossil fuels they have. If there is no oil, then they must be investing in ????
Nick Palmer
You say
NO! People ignored your comment because it is a statement of your ignorance which is so divorced from reality that it did not merit a response.
” they no longer do”? No, the oil companies have supported the “cause” of the scare from the start. They contributed funds to establish the Climate Research Unit (CRU) at East Anglia and the ‘climategate’ emails revealed that maintaining the supply of funds from the oil industry continued to be an important activity of those at the CRU who promoted the “cause” under the guise of “mainstream climate science”. Promoting a “cause” is pseudoscience: it is NOT science of “mainstream” or any other kind.
The scare makes energy more expensive and oil companies sell energy so promotion of the scare is part of their advertising expenditure.
Richard
Nick,
The truth doesn’t matter because oil companies are not regulated by the truth. They are regulated by the government. You know the “no medical use” (CSA) government. If the truth is inconvenient the government will not use it.
Nick Palmer is petulantly unaware that Big Government has always had more invested in warming than so called big oil.
and why should big oil spend any more money than the need to. Rockefeller Brothers co-opted 350 dot org, they marched in NY railing against coal and sure enough natural gas has come to save us. And the winner is?
Nick’s tin hat appears to be a mite tight…..
Work in marketing and you’ll soon figure out why Big Oil promotes mainstream climate science: because they don’t want to be seen as the bad guy. Simple as that. They want a positive image for the public to see. If a positive image is submitting to modern scientific reasoning on climate, whether that science is true or not, then Big Oil is going to submit!
“Big Oil has the biggest financial incentive to want to believe that there are holes in mainstream climate science”
And there’s the flaw in your logic. Exxon doesn’t have a license to print money. Their profit margin depends upon their ability to sell products that’s value is determined by economic forces such as the law of supply and demand for more than it costs them to get it to the customer. Note that Exxon’s profit margin is (pretty low compared to other industries) typically less than 10%: http://ycharts.com/companies/XOM/profit_margin
Ok, so, should the supply of their product artificially be limited by some global agreement this would only serve to increase its value thus in all probability resulting in profit margin remaining the same or increasing as long as Exxon maintained its market share. So, why would Exxon risk a PR boondoggle that might risk market share over something that’s probably not going to affect its bottom line?
If I owned a big oil company I would encourage renewables knowing these competitor pro cuts are way way more more expensive to produce , and wherever energy prices go up so do my profits
plus you need that baseload energy to back up the intermittent
Nick,
The energy companies are not foolish enough to fight a stupid government policy since they are in business to serve their shareholders and facts don’t seem to matter to our governments. The last thing they want to do is embarrass the Administration with facts then be subject to a thorough review by Holder, EPA, and the IRS. We currently have a very vindictive government and as they say “you can’t fight city hall”. They are smart enough to know if they are going to stay in business, they have to fight government regulations via the court system. If they subsidized the skeptics, the compliant MSM would destroy their reputation with the public.
I suspect Bob found the beginnings of some melanoma and leprosy on the model after inspection.
Nick. I don’t quite understand your thinking. From where I sit, it seems you are suggesting that the differences between predicted temperatures and actual temperatures are too small (running about 0.17 degrees C too warm in recent years) to be in any way meaningful. However, at the same time you seem quite comfortable in accepting that 2014 was the hottest year recorded by 0.01 to 0.04 degrees C (+/- .04-.05 degrees C) depending on whose data is used.
What am I missing here?
Mr. Palmer,
The oil market, or Big Oil as you call it, is not what you think it is. Few in this country understand it. You are confusing the commercial, or corporate, public relations face of the domestic oil industry with the actual position oi
When the oil embargo happened as a result of the Yom Kippur war in October, 1973, the Joint Chiefs of Staff were shocked to discover that their forces worldwide had a max 2.5 days’ supply of fuel, 60% of the nuclear subs and all of the diesel-fueled subs became inoperable, airforce jets couldn’t fly, food and supply lines were jeopardized, trucks and troops stopped along the road. It was a disaster, quite apart from the domestic interruption of the nation’s food supply chain, which is 27 days. From a 1980s private conversation my friend had with James Schlesinger, who was Secretary of Defense at the time, oil then became National Security Item #1. Still is.
According to Schlesinger, who’s dead now, the reason why we go to war over oil is to deplete other nations’ supply before we use up our own. Alaska’s Prudhoe Bay field was only allowed because of the fear of Russia using the then newly-perfected slant drilling technique into the Alaska fields. Kissinger made a deal in 1975 with the Saudis to keep the price of oil high if they promised to invest their profits in our treasury securities; this established globally that oil would be paid in USD. This also meant that oil for military purposes purchased from other countries would be paid for in keystrokes—i.e. zilch cost to the federal government–as a result of the August 15, 1971 change to 100% US sovereign currency instead of gold for international payments.
To put it bluntly, the government doesn’t give a s**t about domestic gas/fuel needs. They are perfectly happy with solar and wind, alternative fuels, commanding the public’s attention for whatever reason, and that is what you see reflected in oil company statements for public consumption. I suspect that Saudi Arabia’s recent oil play is anger at the US for violating that 1975 agreement by allowing the LNG production succeed to the point of exporting and upsetting Saudi business. Some think it’s a US/Saudi play to disrupt Russia; I doubt it, the Kingdom always acts in its own best interest. Besides, Obama’s stupid sanctions against Russia have given rise to China’s currency swap agreements for fuel and resources, which will threaten the US’s reserve status if China can build the financial infrastructure to replace the current $500 billion/day US treasury security market over the next 15 years. Britain has already fallen for it, and recently became the first country to sell Chinese bonds on their stockmarket.
The first paragraph should read as follows. I must have hit a key inadvertently:
And the last sentence should read:
You mean like taking the calendar mean and comparing it with 4 years ago and finding that it is not higher (they’re the same because of the uncertainty of ±0.05°C) but still reporting it as higher?
This is the same value (within error) of the 12 month period from Sept. 1997 (0.65±0.4), or if you want to ignore the El Nino spike, the same as the 12 month period from October 2001 (0.62±0.4). Modelling suggests that 12 month records should be broken by 0.15°C about every 15 years, at least.
Your comment suggests that someone has already pointed that out to you.
No wonder you guys aren’t respected much any more if that’s how you respond to a perfectly obvious and simple point. A child could grasp it, yet most of you jump straight to labyrinthine conspiratorial thinking. If Big Oil/gas/coal could convincingly show the rest of the world that the sort of thinking and arguments prevalent here had any validity, and that there are significant problems with mainstream climate science, then they would do so in a heartbeat, so they could go on selling carbon emitting products indefinitely – their major assets would not be in danger of being stranded and they would not have to alter their business model or have to invest in new technologies etc. If they could prove there was no need for renewable or alternative fuels they would do so to head off having to change their business models radically. They know that giant corporations rarely succeed in moving into differnt areas.
The plain fact is that the mainstream science is now so strong that it would be commercial suicide for Big Fossil Fuel to deny it any longer as they would be laying themselves open to the most humongous legal liability case in recorded human history, making what happened when Big Tobacco got fined for denying science, look like fiddling small change. They are endorsing the science because the executives know that if they don’t, then many lawyers will be sharpening their pencils…
This is the first time I have posted here and I am not impressed that you can’t even see the obvious when it is right in front of you. You’re all fooling yourselves and being very irresponsible in your overconfidence that you are right, because if you are wrong and your ideas confuse too many of the voting public so that they don’t OK the mitigation of emissions fast and far enough, then it will be you lot who will be responsible for any damage, death, disruption and destabilisation that ensues because it will be your seemingly plausible (to a naive public) but mistaken arguments that muddied the public’s perceptions.
[No, Nick, this is not your first time posting. You have posted here several times before. .mod]
So then it will be YOU (Nick Palmer) who will admit responsibility for the ACTUAL millioins of deaths and ACTUAL harm done billions worldwide due to the politic cry for deliberate energy restrictions and energy starvation to billions of innocent poor worldwide, right?
Nick palmer
What an ignorant rant you can spew.
“This is the first time I have posted here…” says Nick Palmer. This is a very good sign (and especially that your comment haven’t been deleted like mine were a few years ago when I challenged the “consensus” on WUWT. Thanks for posting. Maybe the worm is turning. Please people, do the research and think for yourself.
Nick Palmer,
I fear that you are maligning the oil companies.
I confess that I have been paying them to extract crude and gas from the ground for years and years.
All of my friends and associates have been doing the same, some for a lot longer than I have.
Nick Palmer
I refuted your nonsense above and this link jumps to the refutation.
Iteration does not convert your ignorant nonsense into sense.
Richard
“The plain fact is that the mainstream science is now so strong”
No, the plain fact is that public _belief_ in the mainstream theory is now so strong that most of the large players think it’s not worth fighting to change it. It wouldn’t be the first non-rational belief that’s become widely accepted and very hard to change, you have plenty of examples in religion (“Christianity is the only true religion”, “Islam is the only true religion” etc.) and politics (“capitalism is the only functional macroeconomic system” etc.). Multiple official sources have put their reputation behind alarmist claims continuously for about 4 decades now. It would take at least as much effort to change the public’s mind, especially now that anyone going against the mainstream view has also been successfully labeled a “denialist” and “anti-science” and “ignorant” and so on.
Just try to convince the multitude of believers in the 10% of the brain myth that humans do actually use 100% of their brains or the believers in brain hemisphere dominance that there’s no neurological evidence of brain hemisphere dominance and you’ll see what Big Oil is up against. The best strategy for them is to ride the waves of public opinion rather than try to move specific waves to specific places using only a boat paddle.
Nick. The the science of AGW has consistently been disproved. Since satellite data, which is accurate and cannot be cherry picked, has been used to measure global temperature, there has been no warming. Certainly nothing like the computer models predicted. What has been impossible to argue against is the belief in AGW, it is like arguing against a particular religion. When a consensus exists and an organisation that exists to make money, but goes against the flow of the consensus, then that organisation is villified This was my analogy in a previous post with the tobacco companies, they were perceived (and rightly so) as protecting their shareholders at the expense of their consumers. Oil companies are perceived as protecting their shareholders at the the expense of the planet.
As an individual living in a country (UK) with rights of free speech, I can say and write what I like, companies who are the antithesis of the “Belief” do not have that luxury
[No, Nick, this is not your first time posting. You have posted here several times before. .mod]
Perhaps if I clarified that I meant this was the first substantial comment I have made that “stuck” it might help with the nitpicking?
[If that summary is accurate, so be it. .mod]
Big Oil/Big Chemical/Big Computing have always been a major supporter of the Climate Scare.
Big Nuclear has really benefitted too.
As for tiny microscopic things, how about the 100th part of ONE DEGREE your ‘climate scientists’ claim to have detected…now that’s what I call small!
“their beliefs simply must be mistaken” — They don’t care.
must be? That is a religious statement. In science we say “probably”.
But OK. I’ll play along. Please explain the Dalton and Maunder minimums. Since the science is so well understood.
Simon says:
Please explain the Dalton and Maunder minimums.
Please stop it. If we knew the answers we would be discussing something else.
This seems to be the new alarmist rhetoric: asking questions like that. Enough.
Damn, so that is where my cheque went. /sarc
but on every other blog, i hear how big oil is paying for all these skeptic websites… which way is it?
I know some “warmistas” with outdated info still wrongly spread this falsity but, when I see it, I shoot it down. Big Oil stopped sponsoring contrarianism in the early 2000s (google Global Climate Coalition). I’m just trying to keep these discussions real so I often take on over-the-top warmistas too. I know some on my “side” wouldn’t do this because they don’t like to criticise anyone on the same “side”. But I do. I do this largely because I have frequently criticised the way some contrarians post scientific rubbish that probably embarrasses the main thrust of this site, which I think is “lukewarmist”, yet I rarely see them shot down. Therefore, I sometimes shoot down the wackier elements in my own “side” just to try and “be the change I want to see”
Re: All the posts imagining ever more fantastic reasons why Big Oil would knowingly promote science they know is false.
If that could be proved, they would likely get sued for trillions. Someone had the nerve to say my “tin hat was tight” when it is you lot coming up with conspiracy type thinking to explain away why you think Big Oil is secretly supporting and promoting mainstream climate science that, your theories suggest, they know to be false. RichardSCourtney had the nerve to link that he had debunked what I said because he seems to believe Big Oil has been supporting climate science for their own Machiavellian reasons from the start. Newsflash from the real world! I suggest it is far more likely that Big Oil’s executives wanted to know how much of a threat to their business’s bottom line that developing climate science might prove to be and that is the real reason why they sponsored UEA etc- in true SunTzu style, they were keeping their friends close and their enemies closer. The strange concept, that some here put forward, that Big Fossil Fuel want people to believe climate science because it will somehow make all energy, including greenhouse gas emitting energy, more expensive and therefore boost their profitabilty is just jaw-droppingly wrong. Economics just doesn’t work like that in the real world.
Deutsche Bank’s leading analyst, Vishal Shah, is predicting that solar systems will be at grid parity in up to 80 per cent of the global market within 2 years, and says the collapse in the oil price will do little to slow down the solar juggernaut. http://reneweconomy.com.au/2015/solar-grid-parity-world-2017
While coal can still, for the time being, undercut this we still have hundreds of years of relatively cheap coal available so why would Big Fossil Fuel deliberately encourage the acceptance of climate science, that mandates cutting carbon emissions, which coal is stuffed with, if they weren’t being forced to by the reality of the threat to us all? If they had such a get-out-of-jail-free card – that the ideas promulgated here by WUWT’ians would give them – why wouldn’t they use it? If the holes in climate science that you lot seem to think are there were actually there, then BFF would simply say to the world that their analysts had shown that climate science was bunk and that there was no threat from CO2 emissions and just go on selling cheap coal for the next few hundred years. The world is more likely to listen to any proper science they came out with, rather than internet bloggers and a few maverick scientists. The ‘alternative science’ promoted by Big Tobacco delayed their eventual fall from grace for decades. It was only when they were shown to have known that their ‘alternative science’ was bunk that they lost credibility. If WUWT style ideas still had credibility, that would not happen.The world could relax, climate science would get a lot of egg on its face and the fossil fuel extraction and sale businesses could carry on as usual. If any of you look at their corporate websites you will see that while they explicitly acknowledge that emissions have to stabilise then reduce, they grudgingly sort of admit that they might have to cut the emissions that they are responsible for but they hold out a lot of hope that carbon capture and sequestration technology will save their business model – in particular, Big Coal do (see The American Coal Council’s website). CCS technology would only make their product less competitive.
Using conspiracy type ideation that somehow the fossil fuel companies secretly know that climate science is bunk yet are now lying to the world that they accept it, to gain commercial advantage, is just so Illuminati-style off-the-wall that you all should be ashamed that some of you are putting this forward as a credible defence against the simple notion that if even those companies with the most to lose financially now accept climate science, and the emissions mitigation that it mandates, there can be no real value to the ideas spread via this website – they must be just very, very mistaken and silly! Though I don’t expect many of you to see this…
luv it – (1) Nick bases appeal to authority on Big Oil – (2) he admits befuddlement over the skeptics’ failure to fall into line behind Big Oil’s abandonment of skepticism – not realizing that it demonstrates Big Oil’s lack of influence over skeptical science
I’m awarding you the prize for the most convoluted avoidance of seeing the true picture, and boy! did you have a lot of competition here.
You lot seem completely unable to grasp a simple concept – let me make it easier for you. If an asbestos manufacturer had been denying the science that said asbestos was a health hazard for years, and sponsoring maverick scientists who backed them up and backyard Galileo wannabes who thought there was no problem with it, then changed their corporate position and put, on their corporate websites, that yes, asbestos was a problem even though they knew it would likely affect their sales badly in future but they could no longer deny the science, how would you regard the views of the “asbestos sceptics” who came up with total nonsense and similar reasons to those you lot have above up to try and pretend that Big Asbestos was doing it to be “politically correct” or to make more money because the price of asbestos would go up and improve their profits and blah blah blah? You would think they were away with the fairies!
What’s that rattling noise?
Nick Palmer –
thanks for the “He dares to disagree with Nick Palmer” Award – i will display it proudly
as for simple concepts – how about this one – Big Oil has shifted their perspective NOT becuz of the “science” of alarmism – BUT from increased profits from carbon trading and sequestration
of course – that broad viewpoint will only be seen by those sophisticated enuf to discern ALL the possible motives – an award that you won’t likely be given
it would be like the asbestos manufacturers of your example changing their tune cuz they will realize more profits from the removal and recycling of their product – get it?
and of course – your asbestos example contains a profound error – unlike those bought skeptics – most AGW skeptics didn’t receive a penny from Big Oil – so when Big Oil fled the field of battle – they merely continued the battle – but freed of the taint of Big Oil corruption
it’s nice of you to recognize that situation – even tho you remain confused – unable to grasp that skeptical science has always stood apart from the agenda of Big Oil
Quote from NOAA’s annual summary…
“This is the first time since 1990 the high temperature record was broken in the absence of El Niño conditions at any time during the year in the central and eastern equatorial Pacific Ocean, as indicated by NOAA’s CPC Oceanic Niño Index. This phenomenon generally tends to increase global temperatures around the globe, yet conditions remained neutral in this region during the entire year and the globe reached record warmth despite this.”
As much as this article has tried to imply this record year is not significant, the paragraph above would say otherwise.
NOAA is playing games, Simon. They well know that this year’s El Nino was not focused on the NINO3.4 region. The JMA uses the NINO3 region and they’ve stated that El Nino conditions have existed since June 2014:
http://ds.data.jma.go.jp/tcc/tcc/products/elnino/outlook.html
When a climate running on 3 cylinders can break records, imagine what will happen when it runs on four?
It is playing games to use the definition of ninjo they have always used.
It is playing games to not suddenly change that definition.
Some gameplaying
That reciprocating engine analogy makes no sense…. Where is the misfiring cylinder today in your climate-engine analogy?
Record temp years have almost always been during an El Nino….. that is until recently. 1998 the most classic example. That smashed all records at the time. Not any more… we are reaching the bar and getting over the wall, without the El Nino “leg up.” That to me is a concern. And I would have thought Bob (who clearly has considerable understanding with regard to the impact ENSO can have) would share my worries. But he doesn’t and that is a puzzle.
Simon,
We have been predicting exactly what you’re saying now. We knew you would say it. It is obvious that those believing in catastrophic AGW would use the argument that the only thing that could explain the fact that the models are wrong, is because human CO2 emissions are saving us from climate catastrophe. And not just counteracting AGW — but couteracting it exactly.
Don’t you realize how crazy that sounds? You are claiming that human CO2 is rising at the exact rate necessary to keep global temperatures from changing at all.
The rise in anthro-CO2 has been steadily changing. It was very low in the 1950’s, then it began to really ramp up. Now there is a lot of CO2 being emitted — and you believe that it exactly counteracts the presumed rise in global T? Because there has been no global warming or cooling for many years now.
An argument can be made for coincidences. But that argument is just too preposterous in this situation. You’re saying that human CO2 emissions are inadvertently calibrated to counteract AGW completely — and exactly. And that as human CO2 emissions change, it is precisely enough to counter anthropogenic global warming.
Sorry, that is just too much to swallow. The simple explanation is natural climate variability.
dbstealey, it’s not too much to swallow; they’re incoherent.
Simon says ‘Record temp years have almost always been’, but conveniently doesn’t tell us when it wasn’t.
If 2014’s temp “highest” record were not due to Pacific El Nino conditions, then a coming year’s La Nina shouldn’t “erase” the gain.
An empirical analysis ( based on recent prior historical ENSO data records) suggests a La Nina event by the early fall 2015 continuing into early 2016. A temp anomaly drop from that will greatly worsen the ability to make alarmist claims versus the growing model discrepancies. That will be just in time for the US 2016 election cycle.
Anyone with half a brain will realise you don’t compare La Nina years with El Nino…….
No, anyone with the ability exercise critical thinking and basic science aptitudes realizes that the temperature anomalies seen are better explained by natural climate variations and by the sunlight fueled ENSO superimposed on that variability, and not GHG forcing.
If one wants to use faith and appeal to higher authority to hold firm to their climate change beliefs, they are entitled to that. But don’t call it science, at least not “good science” to be sure.
Freedom to practice Climate Change religion is allowed. However, in the USA, the Bill of Rights-hating Leftist-warmistas want to deprive skeptics of Free Speech rights (many, many examples from so-called intellectuals), but I digress.
joelobryan
“Freedom to practice Climate Change religion is allowed. However, in the USA, the Bill of Rights-hating Leftist-warmistas want to deprive skeptics of Free Speech rights (many, many examples from so-called intellectuals), but I digress”
Not only did you digress, you shot the comment you made about “good science” down in flames.
Simon – As a ‘good scientist’ are you really getting excited over a change in an ‘average temperature’ that is inside the margin of error?
joelobryan, I believe another factor that must be concerned is the amount of overall energy released by the oceans, the issue being that it is quite possible that a La Niña will not necessarily overcome significant El Niño events. After all, the world has undergone little ice ages and warm periods where the El Niños and the La Niñas respectively of the relevant time period were not able to alter the situation.
From GISS LOTI, the 5 year mean from 2002 was 0.588°C and for the last 5 years, it was 0.605 (not updated). The difference is less than 0.02 or half of the error estimates for individual years.
HadCRUT4 has it dropping by 0.01 (not updated on WFT) and 0.03 on RSS.
Lap times are steady rather than going up.
The MEI Index shows clear El Nino conditions for most of 2014
http://www.esrl.noaa.gov/psd/enso/mei/
I wonder why Gavin forgot to mention this fact?
Half-truths are deceptive in that they allow an incorrect impression in the minds of the naive and/or gullible.
Some call it a “lie of omission.” It is frequently practiced by the legal profession and by activist scientists hiding their ethical lapse in the false cloak of a “Noble Cause” rationalization.
Half-truths were the essence of Dr Gruber’s oh-so inconvenient revelations about how the Affordable Care Act lies were hidden and was passed by a Democrat-controlled Congress. Democrats relied on the gullibility, stupidity, and economic ignorance of the average American voter.
Gruber-fication of the large parts of the US federal government is the key to understanding most of what has transpired in regards to NASA, NOAA, DoE, IRS, EPA, FCC, NLRB, FWS, and on and on.
joelobryan
January 16, 2015 at 12:46 pm
You left out the CSA “no medical use”.
Tech-geeky debates over data anaysis are fun and all, but I hope they doesn’t distract us from the big, crucial questions:
1. Are human beings making climate & weather more dangerous for themselves?
2. Is a warmer climate more dangerous to humans than a cooler one?
3. Would reducing atmospheric CO2 make our planet safer for humans?
4. Are climate & weather going to be more dangerous for humans in 50 years? 100 years?
I try to keep these first and foremost in my mind when I visit here. And for the record, my own conclusions to date are:
1. No
2. No
3. No
4. Unknowable
10,000 years? Probably, since we will probably be in another Ice Age at that point.
Analysis, sorry. I do know how to spell.
Doesn’t = don’t. Good grief. *sigh*
Seth Borenstein, writing for AP reports:
The heat is on; NOAA, NASA say 2014 warmest year on record
Jan 16, 11:26 AM (ET)
By SETH BORENSTEIN
WASHINGTON (AP) — For the third time in a decade, the globe sizzled to the hottest year on record, federal scientists announced Friday.
Both the National Oceanic and Atmospheric Administration and NASA calculated that in 2014 the world had its hottest year in 135 years of record-keeping. Earlier, the Japanese weather agency and an independent group out of University of California Berkeley also measured 2014 as the hottest on record.
NOAA said 2014 averaged 58.24 degrees Fahrenheit, 1.24 degrees above the 20th-century average.
But NASA, which calculates temperatures slightly differently, put 2014’s average temperature at 58.42 degrees Fahrenheit, which is 1.22 degrees above their average, which they calculate for 1951-1980.
http://apnews.myway.com/article/20150116/us-sci–hottest_year-b64ea00652.html
Why in the world would anyone even consider any writing from Seth Borenstein of any serious value ? Borenstein is a paper-salesman, not even a reporter…..and certainly not a scientist.
TomBR
Noting Mr. Borenstein’s article was posted because, this is the meme blossoming all afternoon.
By evening, this will be the story copied by the U.S. TV news and by Saturday’s newspapers.
Sheer repetition will create false truth.
Regards,
I agree, Mr. Doyle. That is the sad truth. I was not “pointing at” you….just commenting that Mr. Borenstein is hack whose silly AP articles are comically misleading and inaccurate. Oddly, the MSM hasn’t quite figured out they are slowing becoming irrelevant, saved only for the moment by sensationalism and alarmism.
Anybody noticing the globe sizzling? I didn’t either.
Animated graphic on National (Irish) news this evening, shows the globe turning from blue (1880) to a piping hot red of present day. The Arctic looked like it was boiling. The whole ”warmest year ever” was given plenty of coverage, complete with all the warnings for the future.
Of course we all know the real reason behind this declaration of warming. There would be no Paris 2015 without it.
Eamon.
With all the wind farms constructed worldwide, and the amount of solar panels installed, and all the countries undertaking carbon(sic) action, we still get “2014 the hottest year ever”?
If 2014 hottest year ever is a KPI for action on carbon(sic), by all measures action on carbon(sic) is a failure.
I left my KPI home. Can I borrow yours?
Temperature is not energy. The system may or may not be gaining energy. Finding out whether or not it is will involve more than thermometers and computers and might prove very interesting.
Indeed.
However, why worry about enthalpy when you can get headlines for a one hundredth of a degree change in the wrong metric?
And I’ve not sold my coat 😉
The evidence clearly and overwhelmingly indicates the global system is gaining energy.
Where is the missing heat?
NOAA and NASA political appt’ee managers were undoubtedly under pressure from the White House to make sure their products came out on the market in timex and with sufficient uptick in temp, for Obama’s State of the Union address next Tuesday.
Fudge anyone?
“The warmest years are within the margin of uncertainty for the data*, making it impossible to determine which year was actually warmest.”
_____________
Not according to NOAA and GISS. As mentioned at the press conference, both GISS and NOAA have calculated the statistical probability that any given year in their records was the warmest. This is different from just pointing to a difference of 0.02 or 0.04C between one year and another, since the same types of corrections and adjustments are applied to data for all years.
In the case of NOAA, the probability that 2014 was the warmest year on record was given as ~ 48%. You could look at that and say ‘that’s less than 50/50’. Or you could compare it to the probabilities of the other contending years having been the warmest on record instead. According to NOAA, the next most likely year other than 2014 to have been the warmest on record was 2010, with a probability of ~18%.
In other words, while confidence that 2014 was the warmest year on record in NOAA is less than 50%, it’s still statistically more than twice as likely to have been the warmest year on record than is its nearest rival. In GISS the likelihoods are smaller: 2014 has a ~38% likelihood of having been the warmest year in the GISS record, which is about 1.5 times more likely than its closest rival, also 2010 (~ 23%).
The director of NOAA stated clearly that, while absolute numbers could well change retrospectively, it’s very unlikely that the current NOAA year ordered rankings will.
Yea, like GISS’s never changed their claims of the hottest year before? Why would anyone think these claims of hottest are serious or even relevant when neither agrees with the satellite records and NOAA has been proven to have been adjusting historic data in the surface temp records in the US?
http://cloudfront-assets.reason.com/assets/mc/_external/2014_01/kmele-totally-called-him-barry.jpg
more?
“There are three kinds of lies: lies, damned lies, and statistics.”
– popular belief is Mark Twain (Samuel Langhorne Clemens) said it, but others earlier may have.
Benjamin Disraeli I believe.
And to paraphrase him in regards to the statistics of Michael Mann:
You get lies, damned lies and hockey sticks
😉
David R, I justified my statement in the note attached to the asterisk, which read:
*The uncertainties are assumed to be the same as those shown in the Berkeley link (in the range of +/- 0.04 to 0.05 deg C).
http://static.berkeleyearth.org/memos/Global-Warming-2014-Berkeley-Earth-Newsletter.pdf
Does this ever so slight uptick mean the pause is over? The pause, to my mind, made the models look bad. But even then, the overall trend was still, however negligibly, in a warming direction. The models are still off. But is it time to stop using the pause as part of the critical response to hysterical claims, such as the ones that have appeared on the front page of the NYTimes today and yesterday, i.e., we are killing the oceans, and 2014 was the hottest year on record. Hundredths of a degree. Does it really even mean anything? I just want to have my facts straight when I holler at believers.
just go here for background:
http://www.drroyspencer.com
What does the NASA satellite data show? It might be buried in the graphs above, but I did not see it. The monthly updates that I have run across were showing that temperatures for 2014 were not abnormally warm.
Lochlomond – the NASA satellite data is not quoted. From that you can deduce that the satellite record does not show 2014 as the warmest year.
Even if ncdc is correct, at that rate, the earth is warming at 0.24 degrees per century. We can live with that. The headlines should be shouting that Earth is warming much slower than originally thought, we are saved.
Anomaly charts may be nothing more than meaningless small random variations.
.
All the variations in these charts are taking place within a natural warming cycle, which appears to have started around 1850.
.
There is no clear indication that warming trend has reversed to a natural cooling trend, nor should anyone want that to happen.
.
A thirty year average is only slightly more useful than annual data.
.
What do we learn from anomaly charts?
.
We learn that the average temperature varies from year to year — nothing else.
.
The charts show about one hundred years of data — a very tiny percentage of the 4.5 billion year climate history of Earth — that’s equivalent to studying variations of the climate during ONE hour of one day of the year, and then jumping to conclusions about the climate for the whole year.
.
What appears to look like short-term trends on anomaly charts may be nothing more than random variations (like flipping a coin and getting heads several times in a row.)
.
The comparisons of climate model predictions versus actual data is usually useful, but the surface temperature data are so inaccurate, and so frequently “adjusted”, they are not worthy of being placed on any chart — please use satellite data on all charts here, or explain why they are LESS accurate than the surface data and should not be used (I won’t hold my breath for that explanation).
.
Climate models are the modern-day equivalent of a man standing over a hole in the ground claiming there’s gold down there!
.
Of course the models say whatever the programmers want them to say … and make whatever prediction will get the modelers more grants to play computer games for another year — predictions that will be stated with great confidence — 105% confidence — maybe 100% ! (confident predictions of gloom are a scam Roger Revelle developed).
.
I’m not a scientist, but I follow this subject because it has economic consequences, and I’ve written an economic newsletter as a hobby since 1981.
.
I believe the important goals for skeptics (a complementary term, in my view), should be:
.
(1) Explain why more CO2 in the air is good news for green plants, and the humans and animals who eat them, and why we should want more CO2 in the air,
.
(2) Explain why modest warming is good news for human health and happiness, and why we should want more warming (especially since the only other choice is a cooling trend, very unpopular in anecdotes from prior centuries),
.
(3) Quote past predictions of gloom (for DDT, acid rain, hole in the ozone layer, global warming, etc.) and show what actually happened,
.
(4) Discuss the quality of CO2 level and average temperature data, and
.
(5) List real pollution problems, such as in China, to prove we skeptics are REAL environmentalists, not people who do not care about the environment.
.
These real environmental problems could be an alternative focus for left-wing environmentalists, and other do-gooders, rather than their current counter-productive cause of demonizing CO2 (which is an indirect way of demonizing economic growth and population growth).
.
I have no intention to insult Mr. Tisdale, who is obviously a very intelligent person, and would probably outscore me by 30 points on an IQ test … but I wonder how his typical focus on anomaly charts, surface data, and very short periods of Earth’s history, will help accomplish any of the worthy goals I listed above?
.
Mr. Tisdale:
Please feel free to ignore EVERYTHING I’ve written, since I’m an old grouch fearful of how successful the climate change scam has been … but please do consider the following useful advice:
.
I like the fact that the title of your article is a question?
.
However, a well written article would start with a concise answer to that question in the first paragraph — perhaps even in the first sentence.
.
START YOUR ARTICLES WITH A SUMMARY (please!),
back up that summary with data, facts, and logic the body of the article,
and then end the article with another summary of what you just said.
If you do that I’ll never complain about your anomaly charts and use of surface data again.
.
The most complicated subjects can be explained in very simple easy-to-understand language if one has really mastered that subject
“However, a well written article would start with a concise answer to that question in the first paragraph — perhaps even in the first sentence.”
In the Army they called that “Bottom Line up front” and it is most certainly an effective communications technique that both gets the conclusions up top for the busy or lower information types and sets the total context for the rest of the information presented for those that must or want to dive into the details in the body.
but I think Bob was having some fun for us
and then he got trolled and it was even more fun
Richard,
“Climate models are the modern-day equivalent of a man standing over a hole in the ground claiming there’s gold down there!”
In most of the world, and in most of mankind’s history, a man standing over a hole in the ground is meant for something else besides gold. I think the substance of Climate Change is somewhere in that hole, i might be gold for some, but the smell suggests otherwise.
You all are engaging in the wrong argument.
The uncertainties are not the issue. We have all seen numerous articles on this website showing that these datasets use unwarranted adjustments, and that those adjustments all push up the present temps while pushing down the past.
The bottom line is, this so-called uptick in the average world temperature anomaly isn’t real in the first place… regardless of the uncertainties. These datasets are garbage. The more we treat them as if they show some actual metric, the more we play into the hands of the warmistas. Please end this discussion about whether this “uptick” means anything… and instead talk about how it doesn’t really exist in the first place… take away their absurd adjustments, and poof… it’s gone.
looks like 2014 set a record for all-time warm global temperature
“All time”. In 4+ billion years. Right.
Not according to the less fiddled with satellite temp records.
Halfpenney! Biting my tongue. Have a good day.
In a year from now, it is not unlikely that the average global temperature for 2015 will be calculated to have been 0.05 colder than 2014. I wonder if NOAA (and others) then will announce that there has been a significant cooling during 2015?
Oh what a tangled web we weave,
When first we practise to deceive!
– Sir Walter Scott, in Marmion, Canto vi. Stanza 17.
That sums up the AGW activist-scientists problems going forward.
Given that the world has been warming more or less continuously since about the mid 1800s, has anybody ever calculated on average how many years in an any given ten year period were “record” high years. It seems to me that it would be quite a few and I wonder if our latest ten year period is statistically different than the mean in terms of the number of record high years typically recorded in any ten year period? I keep thinking that I would like to do this calculation myself, but surely somebody has done it already?
The Sun,PDO,AMO and other natural climate cycles have an effect on the climate.
Hyperbole is the narcotic of rhetoric.
The problem with hyperbole is that ever-increasing doses are required in order to maintain the euphoria of the state of excitement. The lethal dose hardly ever changes, however, so eventually it becomes impossible to achieve the desired ‘high’ without the use of a lethal dose.
In rhetoric, a ‘lethal dose’ is a level of hyperbole that stretches credibility beyond the breaking point.
What happens when the lethal does is 40,000X the euphoric dose? There are some drugs like that.
So there wasn’t an El Nino event this year, but sea surface temps are way up? I’m confused. Of course, I’m no expert so that explains the confusion. To the laymen that seems like talking out of both sides of your mouth.
According to the Japanese Meteorological Agency (JMA), there has been an El Nino on-going since June 2014, is now apparently winding down.
http://ds.data.jma.go.jp/tcc/tcc/products/elnino/outlook.html
NOAA’s definition of an El Nino uses a different spatial extent in the equatorial Pacific compared to JMA’s region 3. This year the El Nino didn’t play by NOAA’s formal rules for ENSO event declarations, but JMA’s criteria captured an El Nino event none the less.
Jason, linked in the post were discussions of the causes for the elevated sea surface temperatures this year. See:
https://bobtisdale.wordpress.com/2014/08/16/on-the-recent-record-high-global-sea-surface-temperatures-the-wheres-and-whys/
And:
https://bobtisdale.wordpress.com/2014/11/19/axel-timmermann-and-kevin-trenberth-highlight-the-importance-of-natural-variability-in-global-warming/
And:
https://bobtisdale.wordpress.com/2015/01/11/alarmists-bizarrely-claim-just-what-agw-predicts-about-the-record-high-global-sea-surface-temperatures/
And:
https://bobtisdale.wordpress.com/2014/12/17/researchers-find-northeast-pacific-surface-warming-1900-2012-caused-by-changes-in-atmospheric-circulation-not-manmade-forcings/
Also see:
https://bobtisdale.wordpress.com/2014/12/04/did-enso-and-the-monster-kelvin-wave-contribute-to-the-record-high-global-surface-temperatures-in-2014/
Cheers
“Recently, we confirmed that the uptick in global sea surface temperatures was caused by the unusual weather event in the eastern extratropical North Pacific. See the post Alarmists Bizarrely Claim “Just what AGW predicts” about the Record High Global Sea Surface Temperatures in 2014. No other ocean basin had record-high sea surface temperatures in 2014.”
The ocean was warmer because one area of the ocean was warmer.
Well, aside from the strange logic (and physics), it is not correct:
http://i.imgur.com/Tm0PdFT.png?1
From here:
http://static.berkeleyearth.org/memos/Global-Warming-2014-Berkeley-Earth-Newsletter.pdf
Perhaps Tisdale will provide another “theory” in true anti-Popperian fashion. Something like: “The uptick in global sea surface temperatures was caused by the unusual weather event in NE Pacific, western equatorial Pacific, Mid-Atlantic, northern Atlantic, southern Atlantic, Indian ocean.”
Closer to truth. And more meaningful?
All these record SST’s will no doubt soon pop out in the atmosphere, where satellites will pick them up.
But I will not hold my breath.
rooter,
Be careful of BEST. They put their spin on the data:
http://wattsupwiththat.files.wordpress.com/2011/10/article-2055191-0e974b4300000578-216_468x4731.jpg
Indeed. Be careful with BEST dbstealey. 2014 warmest.
Besides: the do not produce their own SST. The use hadsst3.
Miss and miss dbstealey.
But if you are not satisfied with that: Try NOAA:
http://www.ncdc.noaa.gov/sotc/service/global/map-percentile-mntp/201401-201412.gif
rooter:- Indeed. Be careful with BEST dbstealey. 2014 warmest.
BEST have made no such claim. They regard it too close to call;
The global surface temperature average (land and sea) for 2014 was nominally the warmest since the global instrumental record began in 1850; however, within the margin of error, it is tied with 2005 and 2010 and so we can’t be certain it set a new record.
…and
Numerically, our best estimate for the global temperature of 2014 puts it slightly above (by 0.01C) that of the next warmest year (2010) but by much less than the margin of uncertainty (0.05C). Therefore it is impossible to conclude from our analysis which of 2014, 2010, or 2005 was actually the warmest year.
They also state “..that the Earth’s average temperature for the last decade has changed very little”
BruceC:
The numbers are in. BEST 2014 land-ocean is warmest. The certainty of that is like the other indexes. More likely that 2014 is the warmest than other years.
I personally am a bit surprised that BEST came in that high when Cowton&Way seems to come out lower. Perhaps it is because BEST includes more temperature stations.
Rooter thinks atmospheric CO2 warms oceans.
Wrong, rooter.
Ever heard of reduced heat loss mpainter?
Rooter…….mpainter doesn’t understand the concept of putting on a sweater when it gets cold.
Or closing the window when there is a draft.
Rooter chooses not to explain his weak, befuddled science. He seems to know better than to try.
Sockrats piles on with his usual non sequitur.
You two make a pair.
Seriously mpainter
…
Do you own a home?
Is it insulated?
Do you pay for heating and/or cooling?
…
Do you wear a jacket or a sweater when it’s cold outside? These are simple concepts. I think you are aware of them. Guess what? Atmospheric CO2 has a similar effect.
SST increased because of increased insolation via reduced cloud cover, starting in the mid-eighties.
Oceans cool mainly by evaporation. Incident IR only increases rate of evaporation because water is opaque to IR.
CO2 does not warm the sea. DWIR does not warm the sea.
You SKS types are suckers for junk science: rooter, sockrats, et al.
“Oceans cool mainly by evaporation”
…
The planet cools by emitting electromagnetic energy
…
I’m sure you know that….or is there another way our planet cools?
You are a hard case, sockrats. The surface of this planet cools mainly through evaporation.
CO2 has no effect on SST, black body to your heart’s desire. Where is your pal rooter, your paired SKS dupe?
or as we say in Australia…rooted!
rooter, the map from Berkeley Earth does not contradict my statement. I was very specific in what I wrote. You obviously missed that I had written, “No other ocean basin had record-high sea surface temperatures in 2014.” The key phrase in that sentence is “ocean basin”.
Feel free to present data for the individual ocean basins as I had to show that my statement is wrong.
https://bobtisdale.wordpress.com/2015/01/11/alarmists-bizarrely-claim-just-what-agw-predicts-about-the-record-high-global-sea-surface-temperatures/
rooter says: “Well, aside from the strange logic (and physics)…”
There’s nothing wrong with the logic or physics, rooter, but obviously you have trouble reading times-series graphs. We’ve already been through that exercise and I can document that my statement is correct. We can remove the extratropical North Pacific from global sea surface temperature data, and the record highs disappear:
From the post here:
https://bobtisdale.wordpress.com/2014/12/04/did-enso-and-the-monster-kelvin-wave-contribute-to-the-record-high-global-surface-temperatures-in-2014/
If you believe my statement is wrong, feel free to remove the North Pacific from the global SST data and present the difference to us in a time-series graph. If you can’t so that, you’re wasting your time and mine.
Adios, troll.
Tisdale tries some semantic escape. That says that the south Atlantic, the western Pacific, even the NW Pacific, the Indian ocean, the north Atlantic are not oceans basins.
By all means Tisdale. Feel free to remove those regions from global SST data and present to us a time-series graph.
Actually I know you will not do that.
Ps: In case you do not know: Also the NE Pacific is a part of the globe. Why use the same method to “explain” the temperature in 2014 by highlighting the record level temperatures in Europe?
OK, Bob went out of his way to explain, but the endless questions are… well, endless.
Endless questions are a hallmark of the alarmist clique here: no one is better than socks, but rooter is getting there. Why won’t either of you take a stand?
What I would like to know is this: What exactly, do you believe??
Endless questions indicate insecurity. Children are insecure by nature. Get it?
Still, I want to know:
Exactly what do you believe in? Be specific. Maybe we can even agree on some things.
With apologies to “roto”. I assume the name was picked with something like that in mind. It really is too bad folks can’t sit back and laugh at themselves. Last week it was 29 C below at my house. Today it hit +5. Neither was a record. And I should worry about a hundredth of a degree. Rotoroot that. Yeah, apologies, that isn’t science or politically correct, but somehow I have been making a lot of copies of humourous comments for my files from the posts today. Thanks for the science AND the humour.
dbstealey wants to know what I believe in.
Many things. Such as the Indian Ocean, the western equatorial Pacific, the south Atlantic, the North Atlantic also are parts of the global ocean.
Feel free to differ.
rooter,
What do you believe in?
Do you believe that human activity is the cause of most global warming? If so, what are the measurements you base that on?
Please send that 0.02° to Michigan.
Right on point. Winters are still winters that have direct costs to survive. Folks living around the equator aren’t paying any costs of winter. The world would more prosperous without “winter.” So bring on the heat.
So there is a discrepancy between the mean of model runs and temperature.
Ok. So what? The models are wrong then. We should all be glad if the warming will be less than projected.
But that does not mean that AGW is not happening. That does not mean than ninjos create energy out of nothing. It does not mean that increased heat loss from earth during ninjos will make the earth warmer. Quite the opposite.
The key metric is climate sensitivity to a CO2 doubling. Alarmists have always realized that number needs to be at or greater than 2º C. If it is less than that, alarmism doesn’t work, since adaptations and eventual negative feedbacks and carbon source exhaustion ensures vastly more beneficial effects from energy use than negative outcomes.
The current observations strongly support a sensitivity in the < 1.5 C range, and it keeps falling the longer the Pause continues. To be sure, the Pause does continue, as the IPCC model scenarios demand much higher temp anomalies than what is seen so far to date, and the temp anomalies described by NCDC and GISS in their press releases are well within the errors bars of said measurements (something they don't say).
There is good reason to believe climate sensitivity to CO2 doubling is in the 0.6º – 1.2º C range (beyond the discussion here). If that is the case, then the good that comes from a warmer, more drought resilient biosphere (longer growing seasons, more CO2 fertilization, more rainfall, fewer freezings) far outweigh any local-regional warmer summers.
It is the temperature anomaly growth failure, aka The Pause, that now motivates the Watermelons to abandon the +2.0º C warming scam, and simply go straight to CO2 as the boogeyman of all things.
Why not use the observations then. Temperature increase ~ 0.8 C last century.
Is the net forcing increase 3.7 w/m2 the last century?
Btw: what pause?
http://www.woodfortrees.org/graph/hadsst3gl/compress:12/plot/hadsst3gl/from:1975/trend
Rooter:
Ahh…There’s none so blind as them that will not see – even if all they do is look at selective data. It’s so good to read your comments….’you does make us larf’.
What is selective by this Passfield?
http://www.woodfortrees.org/graph/hadsst3gl/compress:12/plot/hadsst3gl/from:1975/trend
Rooter: You should change your handle to Cassandra. You really, really, really WANT there to be AGW. And not only AGW, but the kind that is the ‘end of days’ AGW. You’re one these guys who, if it could be proven that there was a fix for AGW would want the fix to fail. You don’t get warm by it, you get moist.
But anyway, you and I agree on one thing: The world is warming (notwithstanding 18-20 years when it didn’t – really), but, “so what!! And when it cools, as inevitably it will (and you must agree on that, surely), it won’t be enough to shrug and say, ‘so what’. The world will be in a poorer place.
In any case, what the hell is GAT? It’s surely a meaningless number. Gavin Schmidt was being interviewed this evening on the BBC and explained how they had had to massage and adjust 2014’s temp records to allow for ‘gaps in measuring sites’ and other oddities. Even so, he said, 2014 was still 0.065 Deg C above any other year as far as the GAT goes. What rubbish! Simple thought experiment: What is the average temp on the moon? Is it meaningful? Would you design a space-suit to allow for MAT?
GAT is meaningless.
And the world did not warm for 18-20 years.
Why do you put such claims in sequence? Do you see a problem with that?
Good catch rooter !!
Oh boy! Rooter and Socrates are going to need to get a room!
I’m so glad you agree that GAT is meaningless, Root. But as you guys do like to use such meaningless measures we sceptics have to humour you. By ‘your’ measurements, there has been no warming for 18-20 years. But you think a few hundredths of a degree change in Oh My GAT! is enough to throw a party.
I hope you and Socrates are very happy together.
rooter says:
The models are wrong then. We should all be glad if the warming will be less than projected.
Why? Warmer is better.
You are incoherent.
Indeed he is incoherent. There has been warming after all?
Very funny, rooter.
Bob,
We are visual animal and the words are over powered by the visual impact of narrow band charts by a 1000 to 1 power factor.
Please use a broader temperature range in your charts as the extreme directional changes shown by 0.02 or 0.04 deg C differences as shown are alarming. Scary looking charts are one of THE reasons for the power the warmists have, and charts used by skeptics that are similarly scaled do not counter the impression of dramatic changes we SEE even in your charts.
I agree. In addition to that point is the colors used in temperature graphics which play with how the brain interprets differences.
Ray,
Good point. I have always thought the graphs should use a scale that encompasses the typical range of temperatures that we experience over a year’s time. The year to year variability displayed on a 50 degree C scale would be hard to get excited about.
Is there somewhere on the interweb thingy that shows us where in the world it warmed, what time of day was most impacted, and why “small volcanoes” didn’t prevent it? Given the record I’m finding it difficult to believe anything a climate scientist says. There are too many experts offering information at cross purposes. The most recent cause for the pause flies in the face of the claim of unprecedented warming.
What Bob was much too polite to say was that the “Hottest Ever year” was totally MANUFACTURED by NCDC & GISS Adjustments to the Raw Data.
ie THEY ARE NOT REAL.
So to recap, it’s been warming since the 1970s, as the graphs say. The figure #4 for example tells that the trend has been positive since the 1970s, far surpassing in trajectory the positive 40 year trend in about 1925-1965. Only time the trend has been negative was about the 5 year period in 1965-1970.
Actually, as it is presented in this article, it has been mostly warming up since the beginning of 1900. In essence, Bob Tisdale just bought a hockey stick.
Since 2002 the range in value is less than 0.2 C. This entire graph/curve/line/points are a statistical construct, nothing but noise in the data. Include the boundaries of uncertainties and statistical deviations, the min/max of the raw data to the graph. There’s nothing to see here, folks, move along.
Allowing for margins of error, 2014 is in a statistical tie with 13 other years.
https://notalotofpeopleknowthat.wordpress.com/2015/01/16/giss-hottest-year-claims-not-supported-by-the-data/
Oddly enough, James Hansen recognised this aspect in their report on 2010 temps, but Gavin forgot to mention it. Perhaps he is under new orders!
They also wheel out the latest in a series of warm years mantra. But why should anybody be surprised or alarmed that temperatures have remained stable for the last 18yrs?
People would be a lot more worried if temperatures started falling back to 1970’s levels.
They are merely gearing up for Paris. That is why we still see articles claiming unusual ice loss at the arctic and pretending that the NW passage is really open during the summer. They even did their best to resurrect their Polar bear poster boy with old data when their Emperor Penguin substitute didn’t work out. Heck now they have even enlisted the Devin to their cause with the Pope wagging his finger. Wanna bet we hear this warmest year claim in the State of the Union on Jan. 20th? Expect to find more manufactured firsts and dooms day numbers in the next few months. All working up to try and “make progress” in Paris next fall. I still bet Paris won’t “accomplish” much despite their orchestrated campaign.
The AGW scammers are getting desperate. Since the late 90’s, they have been banking on a boat load of new taxes to redistribute, green energy schemes to profiteer from, and industrial wealth to be controlled.
As the Earth’s natural cycle of temperatures is likely to head down again regardless of any Climate GHG forcings in the coming 20 years, they need to get the CO2 emission gravy train out ahead of this natural decline so they can take credit for it.
If the Earth’s temps get cooler while human CO2 emissions are demonstrably still heading upwards, the party is over for the scammers.
Do you think O will have the b_lls to actually go to Paris given current events? I don’t mean to be disrespectful as our Prime Minister just sent a lacky – Minister of Public Safety – so he lacks courage as well.
“Allowing for margins of error, 2014 is in a statistical tie with 13 other years.”
Your article goes wrong when it says:
“Although GISS do not tell us what their error bars, or as they call them estimates of uncertainty”
They are not the same thing. Error bars are the uncertainty about what was actually measured. The GISS estimate of uncertainty is whether it lies out of the expectation range of some statistical model of the variation.
It’s like asking who is the tallest kid in a class. You can get a result with the error of the ruler. That is the genuine uncertainty about who is tallest. Or you can ask whether he is outside the 95% limits of the distribution of class heights – is there something about that kid that requires explanation? That is statistical uncertainty. It doesn’t bear on who is tallest.
The GISS estimate of uncertainty relates to statistical significance. Not relevant here.
Nick Stokes:
Yes, climate science is where you make a guess with a greater degree of certainty than when measuring.
How happy for you, Stokes.
What matters to skeptics (and we should all be skeptics if we are true to the scientific method) is justifiable distrust, unspecified uncertainty and errors in the skill of the models and the agenda that ensures that lack of skill prevails. That they are the primary drivers of the current climate alarmism movement, flawed models are proof science doesn’t matter. If no models then no alarmism therefor models are essential, science not so much. Wait – you knew that.
Need more proof? The number of sites collecting data is dropping while the amount of money being spent on adjusting the existing data records, modelers, modeling, and modeling hardware is skyrocketing pretty much along the same curve as the discredited hockey stick.
Question: As I understand it, the CMIP5 models were constructed and run somewhere around 2008-2010. Is that correct? If so, it seems that a vertical line should be drawn on the various charts on that year to indicate that everything to the left is hindcasting and only to the right is forecasting. Otherwise these charts seem to imply the models have decades of accuracy rather than decades of modification to fit known data. Is that correct or am I not understanding the process?
How the hell do you measure the average global temperature and its uncertainty to hundredths of a degree?
I don’t know whether to laugh or cry that people take the precision in these measurements seriously.This is insanity.
All that matters to them is the Headlines. And they’re getting them.
Right on cue, hysteria from The New York Slimes:
http://www.nytimes.com/2015/01/17/science/earth/2014-was-hottest-year-on-record-surpassing-2010.html
http://www.nytimes.com/2015/01/16/science/earth/study-raises-alarm-for-health-of-ocean-life.html
and The Washington ComPost:
http://www.washingtonpost.com/national/health-science/scientists-human-activity-has-pushed-earth-beyond-four-of-nine-planetary-boundaries/2015/01/15/f52b61b6-9b5e-11e4-a7ee-526210d665b4_story.html
Expect film of smokestacks and a red sun at 6 and 11.
/Mr Lynn
commented on NY Times article with a link to WUWT – banned
And I bet it didn’t surprise you one bit!
I don’t understand why anybody would get concerned about a small annual rise in global temperature. We have had global warming for some time (since the end of the last ice age) and on average I would expect any year to be slightly warmer than the previous one. What is clear to me, and what Bob has pointed out, is that the current rise is not exceptional and certainly cannot be used as evidence of man’s influence on global climate. The IPCC models show what we could expect if anthropogenic CO2 really had an influence on global temperatures and they have patently failed to match reality. What we have here is evidence of climate behaving as it always has with temperatures varying from year to year but with a slow upward trend and no sign of a human fingerprint. What should concern us much more is the point at which that slow upward trend is reversed.
When did the LIA end Plail?
About 18 years ago.
Are you a Little Ice Age denier?
Until scientists can explain why the RWP & MWP, followed by the LIA occurred, they cannot explain why natural forces cannot account for the rise in temperatures since the 19thC.
BTW – if you want to get clever about dates, please tell me when the LIA started.
Why don’t you tell us when the LIA ended, rooter?
My thought is if global cooling starts, the recovery from the LIA is pretty much complete. But if global warming starts up again, then the planet is still recovering from the LIA.
There is no credible evidence that the global warming since the LIA is anything other than natural, since the rate of rise is the same whether CO2 was low, or high. Even Arctic ice is confounding the alarmist narrative.
Dbstealey…..
..
What is the physical process underlying what you term ” the recovery from the LIA”
Peter Plail,
Excellent points. The IPCC was flat wrong. That is a given, and it is proven by real world evidence. The only ones who will argue are those who will believe any old nonsense.
Lord Monckton et al’s model is closer to the truth. Much closer. In science, that is all we can ask.
Since the IPCC and this paper cannot both be right, it is obvious to even the most casual observer that the IPCC is still headed down the wrong path.
Next: will the IPCC change direction, and jettison their relatively worthless GCMs? Or will they continue with their remit, which is to convince the public that human emissions are the cause of global warming — whether or not reality agrees?
I predict that as long as big money is involved, the IPCC will continue to try and sell people a pig in a poke. That is what they are being paid to do. And of course, the more brainless and credulous people are, the more likely they are to believe the IPCC.
Fortunately, the general public is beginning to see through the IPCC’s shenanigans. That skepticism will only continue to grow. The public believed Chicken Little at first, too.
‘Socrates’ says:
“…the recovery from the LIA”
What else would you call it, except a recovery from the Little Ice Age? Or do you have a new George Orwell term for it?
Dbstealey…
…
I asked you what was the physical process…….
I didn’t ask you what the “label” was
..
Reading is fundamental.
What is the physical process underlying what you term ” the recovery from the LIA” ??
Moving back toward “normal”… and before you dismiss this, please define what is “normal”.
Or do think the LIA was “normal”?
PS Yes, I know I didn’t name a “physical process”. I don’t know it. But I do know that there are many, many more “physical processes” going on than the man-made CO2 obsessed have accounted for in their theoretical single process.
Gunga Din
I checked my physics book, and there is no reference to “Moving back toward “normal”
Where do you find it….”law of motion?”
Thermodynamics?
Quantum chromodynamics?
What is the physical process ????
Gunga Din,
Pay no attention to “sockrates”. He is just running interference here because he has nothing better to do. Some of these alarmists apparently attended the ‘site pest’ school of commenting.
They are like little children, always asking, “But why??”
I would be interested if they had any credible answers. But they don’t.
Dbstealey…
Gunga Din has written…..
..
“PS Yes, I know I didn’t name a “physical process”. I don’t know it.”
…
Can you tell us what physical process is responsible for the “the recovery from the LIA”
…
We are all really interested in your explanation of your statement.
You brought it up.
dbstealey, 😎 True. I’ve had kids. They ask because they want an answer to whatever is the present focus of their endless curiosity. But SockDude is [NOT] asking to get an answer.
It’s easy to argue by asking questions you don’t know the answer to yourself.
That’s why I asked him what “normal” was. He ignored that normal was in quotes. He didn’t answer the question. He presents himself as if he knows but he really hasn’t got a clue.
This is probably a waste of time, but, Sockpuppet,
You present yourself as one who does know how and why Man has caused “normal” to become “abnormal”.
Please explain.
PS If you can’t explain or define “normal”, then how can you imply anything is “abnormal”.
Gunga Din
Mr Dbstealey brought the subject up when he posted…..
” the recovery from the LIA is pretty much complete”
…
Then I asked the question…
..
“What is the physical process underlying what you term ” the recovery from the LIA””
You have not answered the question, and Mr. Dbstealey has not answered the question.
…
Can anybody reading this thread answer the question?
TYPO!!!
“dbstealey, 😎 True. I’ve had kids. They ask because they want an answer to whatever is the present focus of their endless curiosity. But SockDude is asking to get an answer.”
Should be:
<"dbstealey, 😎 True. I’ve had kids. They ask because they want an answer to whatever is the present focus of their endless curiosity. But SockDude isn’t asking to get an answer.”
Mr Gunga Din
…
I will be blunt.
…
Can you tell me what Mr Dbstealey is referring to when he says ” the recovery from the LIA”?
..
Certainly you must know the cause of the LIA, and what event started the “recovery”
..
No. We do not know WHY there is an apparent 900 year long climate cycle, nor why there is an evident 66-69 year short climate cycle.
We do NOT know why the earth warmed into the Roman Optimum.
We do NOT know why the earth cooled after the Roman Optimum.
We do NOT know why the earth warmed again into the Medieval Warming Period.
We do NOT know why the earth cooled again into the Little Ice Age.
We do NOT know why the earth warmed again into the Modern Warming Period.
All of these occurred due to UNKNOWN natural causes, because ALL of these changes occurred BEFORE man began releasing CO2 into the atmosphere. All of these changes began without man’s influence, and all of these changes ended without man’s influence.
Mr RACookPE1978
….
Thank you.
..
Could you please tell Mr Dbstealey to refrain from using the term “recovery?”
If you have no knowledge of something, I think it’s a good thing to admit it, instead of throwing around unsubstantiated terms, which not only are meanness, but even YOU admit you have no knowledge of.
…
I will admit though, that I have to laugh at you.
You say you don’t know anything, but then you say, “All of these occurred due to UNKNOWN natural causes”
…
Why do you claim they are “natural” if you don’t know what has caused them?
…
Did the Klingons cause them?
The Romulans?
…
Maybe they were caused by gemlins……or elves?
Mr RACookPE1978
…
Did you forget about the 1284 year cycle?
Did you forget about the 34902 year cycle?
How about the 490023 year cycle?
…
Or the 29398498 year cycle.
…
Darn….you’ve got all those cycles…..but you don’t know why you have them.
David Socrates
Despite your sarcasm, only two cycles matter in the next 600 years: The short 66-69 year cycle and the longer 900 year climate cycle.
We are, admittedly, extrapolating the future – though with far more accuracy than the much-hyped GCM costing many billions to produce, run, administer, worship and re-program each year, but the future is, modestly speaking, unclear. Is the Modern Warming Period reaching its maximum in 2000-2010, only to slide dangerously downhill back towards the Next Little Ice Age in 2450?
Is the Modern Warming Period only a 15-20 year “pause” in the 450 year gradual natural warming since 1650 (like the 1890’s, the 1940’s, and now the 2000-2010’s)?
Will the Modern Period Period peak some 70 years from now in 2070-2080, then go down into the Next Little Ice Age?
the Medieval Warming Period was actually a long, drawn-out series of hotter years with a few sharp dips spanning almost 300 years? Are we now only at the 1050 point – awaiting 200 years of good weather and better crops?
Tell us what: When YOU can tell us what caused the previous warming and cooling periods, when YOU can tell us what causes the PDO and AMO and SMA oscillations, then I’ll listen to your claims.
Ah ha. I’ve got it Rooter. It’s a unicycle!
Exactly. It is normal to expect record highs in the later years of any period in a warming world. We know the world is warming, we better get used to it. It will continue to warm until it stops.
And this reliance on surface temperature data really confounds me. The satellite datasets are better in every meaningful way in terms of climate. In terms of weather, we still need surface temps, but how any serious scientist can say (and they do) that the surface dataset is more important for looking at climate than the satellite…it’s not credible.
Why is it warming?
sockrates says:
Why is it warming?
Is that like, “How high is up”?
Science is designed to try and answer questions. But a basic understanding is required first…
…so once again: the WUWT archives are a great place to start. With enough reading, maybe even you can answer that question. Or both of them, who knows?
I’ve seen what WUWT has to offer…..
…
I’ve seen other points of view.
…
You didn’t answer the question.
Mr S:
Hey, if “socrates” can’t answer the question of why global warming happens, why even try? ☺
In case you haven’t noticed, that is the quetion we are all trying to answer.
Only someone who doesn’t even know the right questions to ask would ask a pointless question like that. The rest of us know that is the central question.
Sorry that not everyone understands that.
And:
I’ve seen what WUWT has to offer…..
You clearly don’t like what’s being offered here. But no one is forcing you to stick around asking your inane questions. Also, you have zero converts to your way of thinking. Maybe you should try to figure out why that is.
The Alarmists claim it has been warming because of anthropogenic CO2. The Null Hypothesis is that it warms and cools for reason we do not yet understand, which we call ‘natural’, for want of a better term.
The Alarmists have yet to offer any empirical evidence that anthropogenic CO2 has caused any measurable warming, distinguishable from other causes. They have created computer models incorporating their hypothesis, which made predictions that have been falsified.
The Null Hypothesis remains unscathed.
/Mr Lynn
PS Memo to Governments: Please stop funding the Alarmists.
Why is it warming? asks sockrats, as if it were, poor confused fellow.
“Why is it warming”
No DS, the question you need to answer is ..
“Why is it NOT warming” (all that extra CO2 and all that !! 😉 )
David Socrates
You say to some not-named person
I assume you were talking to yourself because you have studiously avoided the very reasonable question put to you by Gunga Din; viz.
So, please state the “normal” climate you think human kind has disrupted; was it the LIA?
Everything you have posted in this thread is meaningless gobbledeygook until you provide the clarification requested of you by Gunga Din. Indeed, your meaningless twaddle about “physical processes” merely serves to obscure your inability to clearly state what you are waffling about.
Richard
I do not deny the LIA Homewood.
Do you deny LIA? When did the LIA end?
rooter, please.
Why not give your own reasons why you think the LIA has ended? Or why the LIA is continuing? Or anything else.
Make your point. If you think the LIA has ended, or not, explain why you think that is.
You have not told us what process is responsible for the “recovery” from the LIA.
..
Or for that matter, what caused the LIA in the first place.
More pointless commentary. The alarmist clique can’t even answer their own questions…
We seem to have a recovering 1d10t
Recovery from LIA:
Reasons for temp. rise prior to 1950 unknown except it is generally agreed that it was not due to AGW.
Concerning the late warming trend circa 1977-97, we know that this was due to increased insolation via reduced cloud coverage globally.
Since 1997, temp. have not trended upward (see satellite data RSS)
Going back to 1980, then, the models predicted a 20 bps increase in temps and the actual temps have risen 10bps. And we are supposed to stop the world and let half the population die based on this track record?
http://icecap.us/images/uploads/ncep_cfsr_t2m_anom_2014.png
Data from Weathebell which has data far more accurate and reliable then what was presented today.
Bob this article is bogus because the data that this article is based on is in question at the very least if not just plain wrong. To give this data so much attention is not the way ,instead data that runs counter to this BS, should be given the attention in trying to expose this shame AGW.
Weatherbell data shows there is a problem here, in that their data does support what has been presented.
Look at the data.
Prete is looking at model output.
And calls it data. Does not Prete know that?
rooter says:
…model output. And calls it data.
Explain that concept to your cohort, please. Some of them don’t understand the difference.
Thanks.
Dbstealey…
…
What rooter is referring to is exactly the same thing you did when you posted a graph of model output and claimed it represented the history of CO2 going back millions of years. …
…
You even claimed it was 20x higher in the past…
Socrates’ says:
You even claimed it was 20x higher in the past…
Yes. You wouldn’t know about that, because the only factoids you are aware of are those that support your confirmation bias. CO2 being high in the past doesn’t fit your Belief, so you are not aware of it.
I can post a peer reviewed paper showing that CO2 was twenty times higher in the past. But I am not going to do it just to satisfy you, but also to satisfy me.
Now, if I can post a peer reviewed paper showing that fact, will you just go away? You don’t like this site or our host, you’ve made that clear. I cannot understand why you waste your time here, because you are convincing no one of anything that you Believe in.
So if I post the paper, will you go away — or at least quit bird-dogging my comments? I know you are fixated on me, but it is getting embarassing and cloying.
Please post your peer reviewed paper….I’m interested in reading it.
I offered a quid pro quo. It’s yours to take, or leave.
The decision is yours.
Monckton makes you look like you don’t know much
rooter,
I never mentioned Mr. del Prete. I was referring to another commentator. Also, I am having trouble following the rest of your comment.
does not I had meant in the above post my last sentence.
GISS “new Deputy Director, Gavin Schmidt” record temperatures, who’d of guessed.
Does someone have a good model of the thumb on the scales?
http://weaponsman.com/wp-content/uploads/2013/01/ThumbOnScales.jpg
The mean daily temperatures compiled to represent monthly and yearly graphs, to me, confuses much of the public. Just like comments “hottest year ever” tend to not tell the story even if GISS data is being used rather than RSS or UAH.
To place the story into perspective a mean graph needs to be accompanied by a Tmax and a Tmin graph. Then another graph scaled to present current mean temperatures in context with maximum interglacial temps and minimum glacial temps. It is amazing how minimal warming of the last century was and how, realistically, we are close to temps of the LIA.
this thread is getting a little hot an bothered. time out for a laugh:
14 Jan: The Onion: New Climate Change Study Just 400 Pages Of Scientists Telling Americans To Read Previous Climate Change Studies
WASHINGTON—Co-authored by several dozen of the nation’s top climatologists, a new climate change study released Wednesday by the U.S. Global Change Research Program reportedly consists of 400 pages in which scientists just tell Americans to read previous climate change studies.
“Not sure if you saw this one from the Intergovernmental Panel on Climate Change from 2012 about how rising sea levels are putting billions of people in coastal cities at risk, or L.G. Thompson’s 2009 paper on the loss of Kilimanjaro’s glaciers, but really, you should check them out,” read the study in part, which is titled “The Global Climate At Risk: A Broad Survey Of Climate Change Reports That We’ve Been Publishing For Decades And That You Should Actually, Seriously Read.” “Look, there are hundreds of studies on Greenland’s rapidly melting ice sheet alone.
If you could just skim the abstract of one of those—just one, that’s it—that would be great. They’re all online, and our JSTOR password is USGCRP90, so you can go and check one out right now.” The report is said to conclude with a single exasperated 28-page run-on sentence urging people to “just come on and look at these damn things, for the love of God—what more do you want from us—Jesus, this is ridiculous.”
http://www.theonion.com/articles/new-climate-change-study-just-400-pages-of-scienti,37761/
Funny how people can interpret and summarize data so that it can be used to market their position.
So we have a new global temperature record by some measures, being referred to as “The hottest year ever”
We also know that the last decade was “The hottest decade ever”
The relevant question is not: Did it get warmer or not? Both sides agree that it should be getting warmer when you add tons of beneficial CO2(OK, so one side says it’s pollution).
The relevant question is: Was the warming dangerous? Even using the warmest measures, it was so miniscule as to be insignificant.
So here is the point:
This is much better than a cooling planet and also better than a planet warming dangerously. Increasing CO2 is irrefutably causing a booming biosphere and vegetative health as well as boosting record crops and global food production. As a operational meteorologist, I can say with confidence that extreme weather has not increased from global warming(why would it, if there hasn’t been any significant warming for so long?).
So WTF is going on here?
It would be like having an American football game(we’ll say it’s only in the 2nd quarter, since there is a lot of climate science to play out for those having open minds) and the side getting beat 21-7 is claiming the game is over, time for the other side to concede defeat because their 7, is higher than a 2 or a 1.
Might be so but when you put those 2 numbers together, like when you put climate science/weather and biology together in the real world we live in, based on the effects of CO2, the tremendous benefits are crushing the outdated, busted theories.
Sometimes it feels like we are living in the Twilight Zone (-:
Only extreme cognitive bias, hidden agenda’s, ego’s, political/governmental objectives, effective marketing schemes with the media providing widespread coverage working in tandem can explain why the team with 7 points is perceived to have won the game already in the 2nd quarter.
And the team with 21 is being called deniers for questioning the other side’s view.
Twilight Zone (-:
Because the un-scientific zealots and activist scientists have taken over the gate keeper duties on decades of carefully curated temperature databases. And they are now playing unethical games with said data for activist schemes.
History will not be kind to the Gavin Schmidt’s of climate science. Does history remember the names of the Vatican’s scientists who disputed Galileo’s claims? No. History only mocks them in caricature.
Gavin Schmidt and his ilk will be mocked one day, but not by name, but with names.
I know virtually nothing about statistics. i can figure the area of an irregular shape or a helix like a screw conveyor. I can do ratios and proportions. I can figure out the most efficient way to move a pile of stuff from point “A: to point “B” in a given time with equipment with varying load capacities and operating costs. So I’m no scientist nor analyst, nor statistician. What I have learned over the years is to determine when there is a high level of probability I’m being fed a line of Bull! And THAT is why I’m a skeptic.
The climate has been changing since this earth has had an atmosphere and it will continue to change. And I won’t deny that the human animal, the most successful species to ever inhabit this earth, has changed the environment and thus the climate some little bit. But when “scientists” start changing or eliminating data from the relatively recent past. Data that is backed up with all kinds of historical anecdotal evidence, such as the event of the MWP, then the BS detector starts pegging out. When I have to judge the veracity of data processed by a Spencer against that processed by Mann or Gavin, Spencer will win out every time.
Totally worthless adjusted, readjusted and re-readjusted “global” surface data by
agenda driven organizations. Strongly at variance with both truly global satellite data sets. Thanks for the info Bob!
Just out of curiosity, has anyone graphed the older versions of GISS versus the latest version?
Older versions can be found using TheWayBackMachine ( http://archive.org/web/web.php ).
Changes were made going back to the very first number. (January 1880, if I remember correctly.)
Did anyone else notice the very biased NOAA press release for 2014 . They conveniently ignored most of CONTIGUOUS UNITED STATES and , CANADA(, or AN ENTIRE CONTINENT really ) which were freezing in 2014. HIDE THE DECLINE AGAIN ?
The global annual temperature record for 2014 may be of interest to some but it has very little interest and significance for many regions of the globe, especially North America . The 2014 annual temperature anomaly for Contiguous US was the 4th coldest in 17 years and only 0.26 F from being the coldest in 17 years. The annual temperature anomaly for US has been trending negative at -0.47 F/decade since 1998. In United States where annual , winter, spring, fall and 9 month of the year temperature anomalies are all trending colder or negative for almost 2 decades or 17 years , a one year global temperature spike due to mostly ENSO effects has very little significance to the general public .. However it will be played up in anticipation of the Paris Conference and all other more relevant temperature trends like the cooling of North America seasons and Northern hemisphere winters , may not be even mentioned in the media headlines.
Just to illustrate further why the 2014 global annual temperature is meaningless unless the figure is presented in proper context of what is really happening globally in all major parts of the globe. The YEAR-TO DATE [ Jan-Nov] NORTHERN HEMISPHERE LAND TEMPERATURE ANOMALY for 2014 was the 11th coldest in the last 17 years . In other words , there were at least 6 years warmer than 2014 for the year- to- date period of January to November or most of the year.
You simply make too much sense. Nobody can argue with your presentation of the data.
Indeed your presentation will be ignored in the media. You are telling the truth but the truth is not of “ratings” importance since everything is going very well in North America, even including some negative fluctuations in California.
*The uncertainties are assumed to be the same as those shown in the Berkeley link (in the range of +/- 0.04 to 0.05 deg C).
So these clowns are seriously trying to tell us that they can measure the surface temperature of ‘the earth’ to within 100th part of one degree! And then use this amazing fact to panic already nervous activists?
This statement alone illustrates the absurdity of the present ‘scientific’ discussion.
Salvatore Del Prete
I see you also noticed that 2014 annual global record had significant areas that were actually colder like North America, South America and large parts of Asia and Africa .. So how can a record global anomaly make any sense or signifigance as a global figure when 2 entire continents or parts of the two other largest continents were actually colder . I agree ,we should blog Weatherbell’s excellent graph as a separate track in the future.
The idea that a global figure for temperature means anything is absurd. Global anomalies? Nonsense.
In high school, 60 years ago, we learned agricultural growing zones (regions) temperatures published by the US Agriculture Department. Still working just fine in USA and same in Canada.
More food produced every year since 1940, not only due to same climate regions and obviously some help with increasing CO2 (our only gaseous fertilizer) and a variety of other improvements in agricultural production and distribution.
A little more increase of both temperature (1 to 3 C) and CO2 (100 to 200 ppm) in North America would bring great agricultural benefits as well as reforestation and such benefits would be distributed to the entire world.
I don’t want to exclude other continents about changes in temperature or CO2 concentration affecting them.
Their situations may be different and this is why “global temperature and global anomalies” are absurd.
@David Socrates January 16, 2015 at 2:32 pm
Gunga Din
I checked my physics book, and there is no reference to “Moving back toward “normal”
I checked my statistics book but cannot reproduce it here, so how about this –
Regression toward the mean You can check on-line.
Some fields of study have a different name for this, for example, from the study of ancestral heredity there is Galton’s law.
Hmm-m-m, still no socrates.
They sure like to ask questions, don’t they? But when one interesting item like JFH mentioned above screams out for a response… nothing.
Here is the way one media outlet reported what NOAA said about the record temperature .. Not a word about the areas that were colder. Then compare these words with the Weatherbell graph . No wonder the public is misinformed about global warming. Good job Weatherbell for bringing reality to the discussion. .
The western U.S., parts of Russia, interior South America as well as most of Europe experienced record heat, NOAA said. Northern Africa, western Australia and parts of the Pacific, Atlantic and Indian oceans also were warmer.
“The record warmth was spread around the world,” NOAA said in a statement.
The 2014 temperature beat previous highs set in 2005 and 2010 by 0.07 degree, the agency said.
http://www.bloomberg.com/news/2015-01-16/rising-temperatures-on-land-and-sea-made-2014-hottest-year-ever.html
The NOAA reports that 2014 average temperature across global land and ocean surfaces was 0.69C above the 20th century average. Given that the JMA reports 2014-15 as an El Niño year, how does the 2014 average temperature compare with the 20th century average of El Niño years?
We shouldn’t be to worried about 2014 being warmest; after all early in 2016 we will, no doubt, be informed that 2015 was warmest — what with all the “necessary” adjustments.
We can then look back and smile contentedly at how “cool” 2014 was.
It will be ever thus as long as the foxes are guarding the hen house.
What I saw in my state (Washington) was several warmest ever low temperature records, but few, if any, warmest ever high temperature records. This situation did indeed produce a higher average temperature for the year, but I would rather call the year “Least cold on record”. This label fits the facts better.
SR
Bob, if I’m not mistaken, NOAA use an uncertainty value of ±0.09°C.
http://www.ncdc.noaa.gov/sotc/global/2014/13/supplemental/page-1
Thanks, BruceC. Using their definition, then 2014 was “more unlikely than likely” the warmest on record.
And the probability of 2010 being the warmest was 18%. Using their definition: “Unlikely”
http://www.ncdc.noaa.gov/sotc/briefings/201501.pdf
Does that make Tisdale happy?
Also notice that the probability for 2014 being warmest is lower in gistemp. That is because of better infilling (Bob likes that after all) and captures better lower anomalies in areas with sparse coverage. But wait for Cowtan&Way, Even better infilling. There 2010 will (probably) be warmer than 2014.
So go for C&W. Might solve your problem with 2014 being the warmest.
rooter, Cowtan and Way use a different method for infilling than GISS. Are you positive it’s better than the GISS method? Both are, in reality, fiction.
Of course C&W use another method for infilling. That is the point Tisdale. A better method.
Suddenly infilling and interpolation is no-no again. Whatever happend to Tisdale’s preference for Oiv2 and Hadisst? In the fiction-bin?
Some think it is better to do the infilling with the hemispheric average. That is not the method for Oiv2 or Hadisst Tisdale. Perhaps Tisdale would like to tell his favorite infilling method. The one least fictitious.
multiple links and quotes…
16 Jan: Climate Depot: Scientists balk at ‘hottest year’ claims: Ignores Satellites showing 18 Year ‘Pause’ – ‘We are arguing over the significance of hundredths of a degree’ – The ‘Pause’ continues
http://www.climatedepot.com/2015/01/16/scientists-balk-at-hottest-year-claims-we-are-arguing-over-the-significance-of-hundredths-of-a-degree-the-pause-continues/
just for fun:
16 Jan: CNS News: Terence P. Jeffrey: Price of Electricity Hit Record High in U.S. in 2014
Even as gasoline prices plummeted and the overall energy price index calculated by the Bureau of Labor Statistics declined, electricity prices bucked the trend in the United States in 2014…
The average price for a kilowatt hour of electricity in the United States was 13.5 cents in December. That is the highest average price for KWH of electricity in the month of December since the BLS started recording the December monthly price for a KWH in 1978. In December 2013, the average price for a KWH was 13.1 cents…
In the first nine months of 2014, solar power equaled about 0.46 percent of total electricity generation. Wind power equaled about 4.3 percent of total electricity production.
http://cnsnews.com/news/article/terence-p-jeffrey/price-electricity-hit-record-high-us-2014
If you’re presenting a single trend line for “global temperature” or “anomalies”, you’re not presenting reality. Hottest where? Can’t say everywhere, because that’s definitely not the truth, and YOU CAN’T AVERAGE TEMPERATURES FROM DIFFERENT PLACES AND COME UP WITH ANYTHING PHYSICALLY MEANINGFUL!!! Just because it’s “all we have” doesn’t make it useful or meaningful.
Don’t believe the record temperatures.
Between the Jan 15th and 16th they added no new usable data to the GHCN unadjusted file. There were 3 months of data added for 2014, but they were all immediately marked defective.
To build their adjusted file they start with the cleaned(no defects) unadjusted data. Since that didn’t change, their adjusted file should have stayed the same for both the 15th and 16th. It didn’t. They changed 18656 lines on the 16th. Over 200,000 months of data. Those figures are since the 19th century. All changes were in the US, Canada, Mexico and the Bahamas. Nowhere else.
GISS also uses the GHCN adjusted data, so they can’t claim independence.
They have been busy beavers since at least the 6th of Jan. removing and inserting data all over the world.
Well. Go for unadjusted. See what you get.
Even now some people have not noticed that the record 2014 is because of the ocean temperatures. The adjusted land measurements show 4th warmest.
Hi Bob,
Could you please explain this a bit more? It sounds like scientific fraud, but I don’t quite understand the details.
As an aside, this alarmism has been getting huge coverage in the Australian media today, especially the ABC (no surprise there, unfortunately!). I think that if the public get to understand that this whole thing is about such an insignificant (assuming real) temperature rise, there’s going to be a backlash. They have really over-sold this puppy!!! If it turns out even this tiny amount was derived fraudulently, this IPCC & cohorts crowd will lose what little credibility they have left.
Joe.
As a retired but still licensed and boarded neuropsychiatrist, I am not even sure a human could detect a 0.02 degree Celsius temperature increase. It would be absolutely imperceptible. Biologically, I could not vouch that any organism would be affected by such a minuscule change. I am no expert on thermometers, but isn’t that just a bit beyond their 95% CI?
Nick Palmer:
“The plain fact is that the mainstream science is now so strong”
“if you are wrong and your ideas confuse too many of the voting public”
Very telling that a true believer posted that as “WHEN you are wrong and IF your ideas confuse…” Apparently, the evil WUWT virus of denialism is spreading! LOL
You’ll have to explain your point better. You didn’t make yourself clear.
Ah come on folks the breathless good looking blond newscaster on Global news Vancouver uses the poor ski season on the local mountains as proof positive of CAGW so it must be true. No mention of PDO.
Pete’s ‘Wunderful’ data, taken from poll of English Wunderground stations with a reasonably long record.
For 2014, the results are:
Brampton, 2nd out of 15 years, 0.4°C below record year of 2006
Manchester, 9th out of 14 years and 0.7°C below record of 2001
Taunton, 6th out of 12 years and 1.0°C below previous record of 2005
Bedford, 1st out of 10 years and 0.3°C above previous record of 2009
Derby, 2nd out of 11 years and 0.4°C below previous record of 2006
Stowemarket, 1st out of 10 years and 0.2°C above previous record of 2006
Taken that The Satellites are ‘seeing’ radiation and according to Stefan’s Law, Planet earth is surely shedding more energy than it previously was. This is entirely consistent with my little clump of numbers because the ‘warm’ places are on the dry eastern side of England and the cooler (going nowhere) places are on the wetter western side of England. One cubic metre of humid air at 10°C contains 7kJ more energy than a cubic metre at 20°C. As Harold Ambler stated somewhere here, temperature is not energy.
That Earth is losing energy really is a cause for concern and stacks up with the facts that adding CO2 to a nitrogen/oxygen mix increases its emissivity and also increases its thermal conductivity. Something sublimely pointed out by the warmist trolls we’ve just been reading where they talk about and confuse radiation trapping with wearing an overcoat or adding insulation to your house. They themselves tacitly admit, without even realising it, that conduction/convection cool the planet’s surface. Such confused thinking – better lay off the carbs and the grog I’d suggest.
Of course its my beautiful theory and I’m hopelessly biased, but the wet/dry observation in conjunction with the ‘headline’ shows/proves mankind is changing things and he’s doing it by desertifying the place. The extra CO2 we see has come from the dirt and the higher temps come about because the organic material that was in the soil (now CO2) retained moisture and restrains the temperature wee see ‘on the ground’.
Less soil organic means less retained moisture means greater temperature variation, consistent with higher temperatures with less energy within the Earth System.
“Of course it’s my beautiful theory and I’m hopelessly biased, but the wet/dry observation in conjunction with the ‘headline’ shows/proves mankind is changing things and he’s doing it by desertifying the place.”
On the contrary….
“How Fossil Fuels are Greening the Planet”
To check the accuracy of Matt Ridley’s assertions regarding the NDVI Satellite observations I went to this site.
http://www.pecad.fas.usda.gov/cropexplorer/Default.aspx
When there go to the “MODIS NDVI Time Series” tab. I cannot find a “global” map but all of the individual regions I displayed all show a greening since 2000 (which appears to be the limit of the data they make available).
To your “Of course it’s my beautiful theory and I’m hopelessly biased” one hopes that the actual data will help convince you otherwise..
Looking forward to seeing the publication of Ranga Myneni’s research in due time.
yes, there is been no ilttle unease in the Village following the ‘2014 news’. A warm thank you to all contributors sowing doubt on, well, any part of it the news really. Normal mindset has been reastorede
You know that 4.26 is 4.3 which is 4.5 which is 5 which is 10, right?
Its all in how you round up.
http://icecap.us/images/uploads/Screen_shot_2015-01-15_at_8.04.49_PM.png
More evidence which shows 2014 is not the hottest year not even close.
This is what I use to determine where global temperatures have been and are going.
The ocean (in particular) still exists Prete. But perhaps you think the atmosphere’s heat capacity is greater than the ocean.
Perhaps a reason for choosing MSU/AMSU is that those indexes requires the most amount of adjusting and even modelling? You have previously shown that you prefer model output.
And why do you have to average the indexes? Perhaps to hide the divergence between the two indexes.
http://www.woodfortrees.org/graph/rss/offset:-0.10/mean:12/plot/uah/mean:12/plot/rss/offset:-0.10/from:1979/to:1998/trend/plot/rss/offset:-0.10/from:1998/trend/plot/uah/to:1998/trend/plot/uah/from:1998/trend
CO2 has no effect on SST, rooter.
Exactly CO2 has no effect, and this year 2015 will be colder then year 2014 and this trend should continue for many years going forward. In fact IR only penetrates the top MM of surface ocean waters while visible sunlight penetrates many meters below the ocean surface.
AGW theory has been proven to be wrong not only as far as the stability in global temperatures for some 18+ years and counting but by all the responses to the earth’s atmosphere they called for which have not occurred.
A few examples would be the tropospheric hot spot near the equator combined with more frequent El Nino’s both of which have not happened.
The atmospheric circulation becoming more zonal which has not taken place. Instead the atmospheric circulation has become more meridional and then to cover themselves they try to link it with Arctic Sea Ice melting due to global warming which is bogus on two fronts. Front one being if Arctic Sea Ice melt was caused by global warming why is it that Antarctic Sea Ice is at or near record high values? The second front being if one looks at the Arctic Sea Ice dynamic in the 1970’s one will find above average values of Arctic Sea Ice with an atmospheric circulation as meridional as today.
AGW theory also suggest that the stratosphere will cool in response to CO2 ,and that OLR emissions to space would decrease. OLR emissions have not decreased and as far as the stratosphere, the cooling in the lower part can be linked to two items that have nothing to do with AGW ,those being lack of large volcanic eruptions post Pinatubo and low solar activity resulting in less ozone cooler lower stratospheric temperatures.
Prete: A link that will show that AGW theory suggest that OLR emissions to space would decrease?
Hint: Emission height.
http://www.google.com/url?sa=t&rct=j&q=&esrc=s&source=web&cd=1&ved=0CCAQFjAA&url=http%3A%2F%2Fwww.americanthinker.com%2Farticles%2F2010%2F02%2Fthe_agw_smoking_gun.html&ei=Oba6VKz5IouvyQSGpoHQDw&usg=AFQjCNFrU2MuqxB2KLN4EEbZyjpTBPFwig&bvm=bv.83829542,d.aWw
There have been more recent studies confirming this one.
A tale of two datasets…
http://postimg.org/image/mknoos3vl/
[Thank you. .mod]
“Beware the Ides of March”. What happens if we take the average monthly temperature form March 1998 to February 1999. (OK I cherry picked this period). However, surely the average 12 month temperature and the decision as to whether a particular 12 month period was “the warmest on record” should not depend on the starting month? And then again, perhaps the Roman period was warmer than now because the Roman calendar year started in March! (/s).
2014 – Global temperature distribution picture shows, some areas are warm and some other areas are cold. The same is not reflected in 2010 Global temperature picture. That means, these are associated with the differences in localized general circulation patterns – natural variations may be a part of this. The global temperature rise trend is a function of several factors. These include local/regional factors like heat-island & cold-island and global factors like global warming. Accuracy of met observations over space & time are quite different [Africa versus Europe/USA]. Met net work over space & time are quite different [for example northeast Brazil and USA]. In the case of local/regional factors, urban-heat-island effect is overemphasized with dense met network & rural-cold-island effect is underemphasized with sparse met network in the global temperature averaging. Then, there is another important factor: extra-terrestrial affects. Or are the highest and lowest are the part of natural cycle??? Can we separate all these factors while assessing the highest or lowest global average yearly temperature? So, the best way account this is from satellite data. Let somebody present this information. Then we can understand the slowing or pause or something else.
Another point is if two data sets differ in 2014, it is is true even with 2010 or 2005 data set — then what will be the cumulative difference? The same will also apply to all those years prior to 2014. Is it not show?
Dr. S. Jeevananda Reddy
[Were the 2014, or the 2010 global temperature pictures, associated with the local circulation patterns you mentioned? .mod]
“Today, two of the world’s climate-industry giants..posted [that] global surface temperature anomalies were an astounding +0.02 deg C higher in 2014 than they were in 2010 ! These record-breaking results from GISS are under the guidance of their new Deputy Director, Gavin Schmidt. … these results bring new hope to global warming investors, who have had to endure disappointing results in recent decades.”
Now the world can safely go back to the view that we shall all roast to death and/or drown as Climate Armageddon marches swiftly on to its fiery conclusion (and no more white Christmas’s, snow, Mammoths, reindeer and Santa)
Other headlines from our climate science industry:
“Big Acceleration in Human Activity Since 1950”
“Does Global Warming Reduce Wheat Production?” (Answer – Yes if you haven’t guessed)
“Volcanic Eruptions Help Explain Warming Hiatus”
“Climate Affects Fish” -who knew
And a few that are plain wrong!
“Alaska Fish Adjust to Climate Change” – they are talking of Fish folks not humans, who as we well know are incapable of adapting to anything except extreme cold.
And
“The great greening: The coming of our new lush Earth” – New Scientist
Now that headline is wrong as you can read from the article itself: That headline should have been “CO2 promotes weeds and global warming!”
“A greener planet sounds wonderful, … But ..more plant growth … will accelerate global warming” got it? More green plants more global warming and catastrophe.
Also “the plants that thrive most could be weedy pests” – got it? more weeds less grass, less roses and less wheat. (Never mind the figures)
“Why there is more growth overall has been much debated, with explanations ranging from increased rainfall to changes in land use. Earlier this year, though, a study led by Randall Donohue of CSIRO, Australia’s national research agency, suggested that in warm, dry regions, rising carbon dioxide levels are the main cause of the greening.” What !? “suggested”? how dare he? Carbon Dioxide? That noxious gas?
Never fear “not everyone is convinced by this study. “I don’t think it’s plausible,” says Belinda Medlyn, also at Macquarie University, whose team has helped carry out some CO2 enrichment experiments…While Medlyn is holding out for an explanation not solely based on CO2, she concedes that there is no convincing alternative just yet.”
Not to worry some inventive person will come up with one. We are also holding out for some other explanation.
The +0.02 oC raise in global temperature is not global warming.
Dr. S. Jeevananda Reddy
Why is anyone using a linear trend when it so clearly has a cyclic waveform element dominating? Show it with a best fit curve and the gap between climate science and reality is even more pronounced.
Just to reply to the overconfident Jeyon’s comment at http://wattsupwiththat.com/2015/01/16/does-the-uptick-in-global-surface-temperatures-in-2014-help-the-growing-difference-between-climate-models-and-reality/#comment-1839765 .
Jeyon wrote: “most AGW skeptics didn’t receive a penny from Big Oil”
Thus demonstrating that he/she has no idea whatsoever of the long history of the propaganda war waged by Big Fossil Fuel. I even mentioned earlier how drive-by commenters like Jeyon could check this out for themselves. Clearly he/she didn’t. Quel surprise… For anyone who wants to know, here’s what I wrote: “Big Oil stopped sponsoring contrarianism in the early 2000s (google Global Climate Coalition)” in my comment at
http://wattsupwiththat.com/2015/01/16/does-the-uptick-in-global-surface-temperatures-in-2014-help-the-growing-difference-between-climate-models-and-reality/#comment-1838285
In case Jeyon is just claiming that sceptic blogs never got any money, then he/she is just nitpicking. Even though individuals get some funds for appearances etc, I don’t think that is evidence of corruption – why shouldn’t they get paid for their time and work? However, as Jeyon seems ignorant of the long history of amateur scepticsm/denialism/contrarianism perhaps he/she might like to research it. It is undeniable that the fossil fuel companies sponsored denialism, they even had offices to do it. Many of the seemingly plausible arguments put forward by amateur bloggers and institutes like Heartland are actually rehashed versions of genuine scientific objections to the growing development of climate science that took place way back in the 1950s and 1960s. Why the warmist side is often very dismissive of the views of self-described sceptics these days is because all those arguments were looked at and rejected 50 years ago. They have been resurrected, not because they still have have any valdity, but because the likes of the Heartland Institute see them as being ideal weapons to twist the minds of a whole new bunch of people who cling onto these ideas because they wrongly think they are smarter than the vast majority of climate scientists and the vast majority of the 150 years of climate science development. Now even Big Fossil Fuel accepts the reality of the threat from global warming, which continues almost exactly as projected, despite all the navel gazing and fallacious graph/trend interpretation indulged in by the scepticosphere, no doubt that old human weakness hubris does not allow the dwindling case and weakening support for the “sceptic” case to sink in to those who cling onto it. I expect the scepticosphere to continue to turn a blind eye and a deaf ear to the clear and present danger, because they, to a man, appear to be just about incorrigible about the simple facts that show that virtually no-one of any credibility still disputes mainstream climate science.