Guest Post by Bob Tisdale
In his post Schmidt and Sherwood on climate models, Andrew Montford of BishopHill commented on the new paper by Schmidt and Sherwood A practical philosophy of complex climate modelling (preprint). I haven’t yet studied the Schmidt and Sherwood paper in any detail, but in scanning it, a few things stood out. Those of you who have studied the paper will surely have additional comments.
DO CLIMATE MODELS SIMULATE GLOBAL SURFACE TEMPERATURES BETTER THAN A LINEAR TREND?
The abstract of Schmidt and Sherwood reads (my boldface):
We give an overview of the practice of developing and using complex climate models, as seen from experiences in a major climate modelling center and through participation in the Coupled Model Intercomparison Project (CMIP). We discuss the construction and calibration of models; their evaluation, especially through use of out-of-sample tests; and their exploitation in multi-model ensembles to identify biases and make predictions. We stress that adequacy or utility of climate models is best assessed via their skill against more naïve predictions. The framework we use for making inferences about reality using simulations is naturally Bayesian (in an informal sense), and has many points of contact with more familiar examples of scientific epistemology. While the use of complex simulations in science is a development that changes much in how science is done in practice, we argue that the concepts being applied fit very much into traditional practices of the scientific method, albeit those more often associated with laboratory work.
The boldfaced sentence caught my attention. A straight line based on a linear trend should be considered a more naïve method of prediction. A linear trend is a statistical model and it is definitely a whole lot simpler than all of those climate models used by the IPCC. So I thought it would be interesting to see if, when and by how much the CMIP5 climate models simulated global surface temperatures better than a simple straight line…a linear trend line based on global surface temperature data.
Do climate models simulate global surface temperatures better than a linear trend? Over the long-term, of course they do, because many of the models are tuned to reproduce global surface temperature anomalies. But the models do not always simulate surface temperatures better than a straight line, and currently, due to the slowdown in surface warming, the models perform no better than a trend line.
Figure 1 compares the modeled and observed annual December-to-November (Meteorological Annual Mean) global surface temperature anomalies. The data (off-green curve) are represented by the GISS Land-Ocean Temperature Index. The models (red curve) are represented by the multi-model ensemble mean of the models stored in the CMIP5 archive. The models are forced with historic forcings through 2005 (later for some models) and the worst-case scenario (RCP8.5) from then to 2014. Also shown is the linear trend (blue line) as determined from the data by EXCEL. The data and models are referenced to the full term (1881 to 2013) so not to skew the results.

Figure 1
Over the past decade or so, the difference between the models and the data and the difference between the trend and the data appear to be of similar magnitude but of opposite signs. So let’s look at those differences, where the data are subtracted from both the model outputs and the values of the linear trend. See Figure 2. I’ve smoothed the differences with 5-year running-mean filters to remove much of the volatility associated with ENSO and volcanic eruptions.

Figure 2
Not surprisingly, in recent years, the difference between the models and the data and the difference between the trend line and the data are in fact of similar magnitudes. In other words, recently, a straight line (a linear trend) performs about as well at modeling global surface temperatures as the average of the multimillion dollar climate models used by the IPCC for their 5th Assessment Report. From about 1950 to the early 1980s, the models perform better than the straight line. Now notice the period between 1881 and 1950. A linear trend line, once again, performs about as well at simulating global surface temperatures as the average of the dozens of multimillion dollar climate models.
Obviously, the differences between the trend line and the data are caused by the multidecadal variability in the data. On the other hand, differences between the models and the data are caused by poor modeling of global surface temperatures.
For those interested, Figure 3 presents the results shown in Figure 2 but without the smoothing.
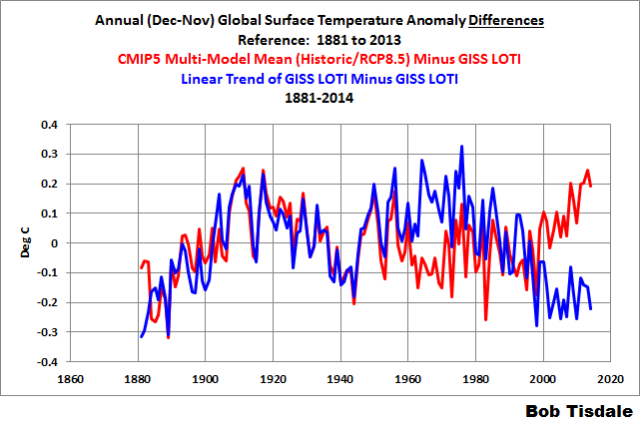
Figure 3
SCHMIDT AND SHERWOOD ON SWANSON (2013)
The other thing that caught my eye was the comment by Schmidt and Sherwood about the findings of Swanson (2013) “Emerging Selection Bias in Large-scale Climate Change Simulations.” The preprint version of the paper is here. In the Introduction, Swanson writes (my boldface):
Here we suggest the possibility that a selection bias based upon warming rate is emerging in the enterprise of large-scale climate change simulation. Instead of involving a choice of whether to keep or discard an observation based upon a prior expectation, we hypothesize that this selection bias involves the ‘survival’ of climate models from generation to generation, based upon their warming rate. One plausible explanation suggests this bias originates in the desirable goal to more accurately capture the most spectacular observed manifestation of recent warming, namely the ongoing Arctic amplification of warming and accompanying collapse in Arctic sea ice. However, fidelity to the observed Arctic warming is not equivalent to fidelity in capturing the overall pattern of climate warming. As a result, the current generation (CMIP5) model ensemble mean performs worse at capturing the observed latitudinal structure of warming than the earlier generation (CMIP3) model ensemble. This is despite a marked reduction in the inter-ensemble spread going from CMIP3 to CMIP5, which by itself indicates higher confidence in the consensus solution. In other words, CMIP5 simulations viewed in aggregate appear to provide a more precise, but less accurate picture of actual climate warming compared to CMIP3.
In other words, the current generation of climate models (CMIP5) agrees better among themselves than the prior generation (CMIP3), i.e., there is less of a spread between climate model outputs, because they are converging on the same results. Overall, however, the CMIP5 models perform worse than the CMIP3 models at simulating global temperatures. “[M]ore precise, but less accurate.” Swanson blamed this on the modelers trying to better simulate the warming in the Arctic.
Back to Schmidt and Sherwood: The last paragraph under the heading of Climate model development in Schmidt and Sherwood reads (my boldface):
Arctic sea ice trends provide an instructive example. The hindcast estimates of recent trends were much improved in CMIP5 compared to CMIP3 (Stroeve et al 2012). This is very likely because the observation/model mismatch in trends in CMIP3 (Stroeve et al 2007) lead developers to re-examine the physics and code related to Arctic sea ice to identify missing processes or numerical problems (for instance, as described in Schmidt et al (2014b)). An alternate suggestion that model groups specifically tuned for trends in Arctic sea ice at the expense of global mean temperatures (Swanson 2013) is not in accord with the practice of any of the modelling groups with which we are familiar, and would be unlikely to work as discussed above.
Note that Schmidt and Sherwood did not dispute the fact that the CMIP5 models performed worse than the earlier generation CMIP3 models at simulating global surface temperatures outside of the Arctic over recent decades. Schmidt and Sherwood simply commented on the practices of modeling groups. Regardless of the practices, in recent decades, the CMIP5 models perform better (but still bad) in the Arctic but worse outside the Arctic than the earlier generation models.
As a result, the CMIP3 models perform better at simulating global surface temperatures over the past 3+ decades than their newer generation counterparts. Refer to Figure 4. That fact stands out quite plainly in a satellite-era sea surface temperature model-data comparison.
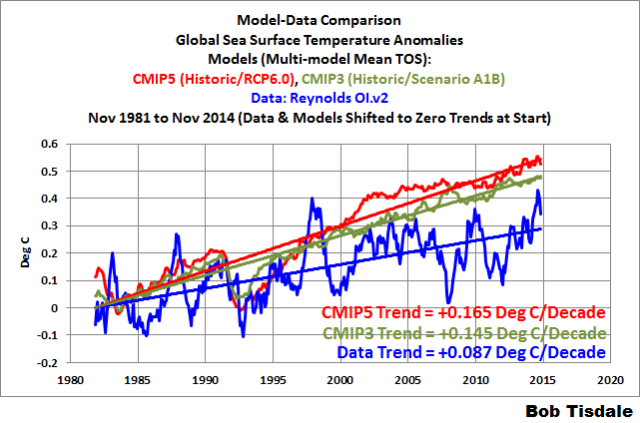
Figure 4
CLOSING
Those are the things that caught my eye in the new Schmidt and Sherwood paper. What caught yours?
There is no reason wharever to think that global surface temperature, which is the result of a combination of effects from ackowledged non-linear dynamic systems, can be scientifically and accurately representedby a “straight line — a linear trend”.
There have been papers discussing this recently — how to model a “trend” of a non-linear system.
The ONLY reasons to attempt to use linear trend lines to represent global temperatures are all propagandistic . Up, Down, Flat – all propaganda.
I’m guessing you didn’t actually read the article. The only purpose for the linear model was to compare the CMIP5 ensemble against it.
That is, if they can’t beat even a linear model, then they are pretty pathetic.
Talking about model checking and comparison, is there any reason whatsoever the model code is not open sourced? I am a software professional now ( migrated from Physics ) and the open source approach has revolutionised software engineering. Indeed, open source projects are some of the highest quality code around. That’s because the code gets checked and tested by many mnay sets of eyes – peer review if you like.
So why don’t the modellers open source their code? It might actually help produce better models.
My point exactly — the linear model does not represent anything at all physical — but an idea that intentionally misrepresents the real world in order to shoot down another system that (intentionally or otherwise) misrepresents the real world.
Intentionally using misrepresentations to attempt to convince others of a viewpoint or opinion is the definition (mol) of propaganda. It certainly isn’t science.
Opinions on this will vary, mostly depending on one’s position in the Climate Wars.
Kip Hansen: Intentionally using misrepresentations to attempt to convince others of a viewpoint or opinion is the definition (mol) of propaganda. It certainly isn’t science.
It looks to me like you missed the point of both articles: Schmidt and Sherwood and Tisdale. Schmidt and Sherwood proposed that the test of modeling is how much the model results improve upon the naive expectations. Tisdale took them at their word and suggest a particular naive model for comparison, and using their standard showed that the CMIP5 models do not measure up to the naive model, and that the CMIP5 models do not measure up to the naive model as well as the CMIP3 models did. There was no “misrepresentation” of Schmidt and Sherwood, merely a particular instantiation of their standard, which was left kind of vague: “naive”. The only thing “more naive than a straight line” is a flat line, which even the most naive of readers already knows is false for this problem. “Less naive than a straight line” would be polynomials of higher order, straight lines with break points, splines, and Fourier analysis and harmonic regression.
Can you proffer a better example of “naive”, one that does not “misrepresent” Schmidt and Sherwood?
Reply to Marler ==> I was not and am not writing about either the Schmidt paper or the Tisdale response — just making a general observation.
Both S&S and Tisdale are attempting to do science with what I label, rather cavalierly, propaganda. One has to take several giant steps back to see what they are doing — using sciencey language and words to try to score points in the Climate Wars has a long long history.
There is no science gain– no new knowledge produced — no new understanding produced — by this “Schmidt and Sherwood proposed that the test of modeling is how much the model results improve upon the naive expectations” — in which the true scientific expectation is “we don’t really know how this system works”. In this case, there is NO TRUE NAIVE model to compare to — they are trying to make their model compare to a known incorrect model ==> temps == CO2.
Tisdale makes a new known incorrect model — a simple straight line — to prove them wrong.
Both are — bluntly — full of it — simply propaganda that is.
Kip Hansen: I was not and am not writing about either the Schmidt paper or the Tisdale response — just making a general observation.
ok
Both S&S and Tisdale are attempting to do science with what I label, rather cavalierly, propaganda.
Make up your mind.
Paul Mackey,
Many codes aren’t open-sourced, but quite a few are. This list is a bit dated (2009, CMIP3) but the major CMIP5 players are still well-represented and it gives a pretty good rundown of what can be freely downloaded and compiled and what can’t: http://www.easterbrook.ca/steve/2009/06/getting-the-source-code-for-climate-models/
RealClimate has a short list of GCMs for which source is freely available: http://www.realclimate.org/index.php/data-sources/#sthash.y0npnezM.dpuf
Model codes (GCMs)
Downloadable codes for some of the GCMs.
GISS ModelE (AR4 version, current snapshot)
NCAR CCSM(Version 3.0, CCM3 (older vintage))
EdGCM Windows based version of an older GISS model.
Uni. Hamburg (SAM, PUMA and PLASIM)
NEMO Ocean Model
GFDL Models
MIT GCM
Paul Mackey, PS: EdGCM now requires a paid license which probably means the code is no longer open. This also somewhat dates RealClimate’s list. Google is your friend, however.
The log of the atmospheric CO2 concentrations is going up steadily in a linear fashion. Fitting a straight line is about seeing if the overall trend of temperatures is responding to this, assuming that other factors are only short term.
Fitting a sin t+t^2 function to the data is naive, I suppose.
http://postimg.org/image/jlsuu32hv/
The rate of change of temperature from HadCRUT4 shows how good the fit is. I have no physical explanation for why the fit is so good, just saying that any modelling should be equally as good for it to be taken seriously.
http://postimg.org/image/b0b87m737/
65 years is the apparent base period of the AMO in contemporary times. That term drives the periodicity of the fitted curve. post hoc selection. But your linear term in the equation is simply the post hoc average warming rate coming out of LIA from the mid-19th Century. There is no reason to believe that term is linear over longer terms (millenia) and it likely isn’t. That implicit linearity is such that it will drive a huge divergence with reality if used as a predictive tool. The climate has millenial scale cycles that are not predictably periodic.
“But your linear term in the equation is simply the post hoc average warming rate coming out of LIA from the mid-19th Century.”
+ getting rid of that 40s blip.
I think it’s fair to say, though, that if you have a highschooler with a ruler and graph paper make a forecast, the skill of that forecast ought to be a starting point for evaluation of the skill of a climate model and supercomputer modeling the same data. The 20th century trend is up. I could do “up” reasonably accurately with ruler and graph paper. The model ought to do better and it better be statistically significant or it is unnecessarily complex. A computer model that just says more of the same and maybe a bit more is ultimately pretty uninteresting because there’s not much to distinguish it from the boy and his ruler.
…no reason whatever…
Obvious comment – Footnote 1:
So,
A) How often is the purpose (the “certain task”) described in the papers that use the climate models?
B) Are all climate models made with the same purpose? If so why do they not all agree? If not, how can they be “averaged”.
C) In policy making and in the Summary for Policy Makers is the intended “certain task” of the models described? And is that “certain task” to assist in policy making.
I think the aim of the paper is admirable. Not so sure of the achievement though. It neglects to even consider the possibility that the models may be of negligible usefulness at all.
“Are all climate models made with the same purpose? If so why do they not all agree? If not, how can they be “averaged”.”
All climate models are made with the purpose of modelling the atmosphere/ocean for long enough that climate can be determined. As is well known, weather is chaotic, and as determined from initial conditions is effectively random. That’s why models don’t agree. But they have a common climate signal determined by forcings etc. The way to get an underlying signal obscured by random noise is to average a large number of instances.
Average of random noise=true signal?
Is this what climate scientists do?
Is the noise random? Has that been firmly established? Isn’t it more likely the noise is 1/f?
Given that paleo data appears to be scale invariate – a fractal distribution – isn’t it most likely that cliamte is not bound by the Central Limit Theorem, with all the statistical implications that result?
No, average of instances of signal with random noise = signal with less noise (cancellation).
mpainter: Average of random noise=true signal?
No. We can assume that the ‘true signal’ itself is not random, but just buried in random noise. Using the Central Limit Theorem, we know that the arithmetic mean of a sufficiently large number of random noise variables is approximately normal. Further, the expected value (mean) of additive white Gaussian noise is zero.
This has long been known as a simple but effective means of noise reduction. If multiple samples are taken of the same quantity with a different (and uncorrelated) random noise added to each sample, then averaging N samples reduces the noise variance (or noise power) by a factor of 1/N”
What climate scientists do:
Treat the product of the GCM’s as actual observations and vaporize about “noise” and “signal”.
When one pretends that invented data is real, you twist yourselves into a pretzel trying to explain away actual data, as in the “pause” (57 explanations so far for the “pause” so far)
Nick: I can get the average of the last 20 years of lottery numbers in the UK. They are meant to be random (RGBatDuke would have something to say about that) so, if I had the average, what use would it be? Would I become a millionaire from it? I mean, Mann and a few others of his ilk have from their random averaging….
That doesn’t make any sense. You could initiate all climate models to the same initial conditions and they should not deviate because of chaotic weather.
Nick Stokes December 29, 2014 at 2:17 pm
“That’s why models don’t agree.”
Nick, you know better than that (particularly in the absolute).
Er, no.
That only works for a stationary system, chaotic systems average is no more predictable that the raw data. To accept that you can average weather to climate one must accept that weather data is stationary, that is, it even has a stable average… and this has NOT been shown.
The average of weather data varies markedly depending on what subset you select.
“Nick: I can get the average of the last 20 years of lottery numbers in the UK. “
Lottery managers make very sure that there is no signal there, else you could make money. But averaging to get a common feature is ancient, common, and not invented by climate scientists.
Swedes taller than Greeks? Maybe. But no use checking one Swede and one Greek. Average 1000 heights of each and if there is a tallness signal there, you may be able to quantify it. Nothing new here.
“You could initiate all climate models to the same initial conditions and they should not deviate because of chaotic weather”
They certainly will. That is the defining characteristic of chaos. The tiniest difference grows until the weather diverges.
“Is the noise random?”
Probably not. The essential requirement is that averaging produces cancellation of noise relative to signal. Unsynchronized cycles will cancel too.
HAS
“Nick, you know better than that (particularly in the absolute).”
Well, OK, the indeterminacy of weather is one big reason why models don’t agree, on a decadal scale, with each other or with Earth.
average of instances of signal with random noise = signal with less noise
==================
not true. that only works to cancel random (white) noise. pink cannot be cancelled by averaging, because there is always a frequency with a longer time period than your sample.
The way to get an underlying signal obscured by random noise is to average a large number of instances.
============
that only works for noise of the form 1/(f^n), where n=0.
no matter how many samples you average, 1/f noise is not expected to converge on the true average, because you cannot eliminate the noise component with a larger period than your sample, and that is on average the largest portion of the noise. All you are doing is averaging out the small high frequency error wiggles and leaving the much larger undulating error wiggles untouched.
“Is the noise random?” Probably not.
========
agreed
The difference Nick is that comparing heights is comparing real data. Comparing modeled results is comparing imaginary data.
Doing something to imaginary data doesn’t make it more real.
“not true. that only works to cancel random (white) noise. pink cannot be cancelled by averaging, because there is always a frequency”
No, that’s overstated. White and pink noise both have all frequencies present. And averaging a finite number of samples can’t remove all noise at any frequency. But it does enhance the signal relative to the noise, of whatever color.
Here is the “underlying signal obscured by random noise”.
10 years later the ‘science’ moves on. New model discoveries are made and mankind is grateful.
Now you just wait until we get a trend warmer winters – “THE MODELS PREDICTED IT!” Of course they did darling. It’s called a rightwrong precipitation model.
Good night.
“As is well known, weather is chaotic, and as determined from initial conditions is effectively random. That’s
why models don’t agree. But they have a common climate signal determined by forcings etc. The way to get an underlying signal obscured by random noise is to average a large number of instances.”
All his usual spin and BS. See:
http://www.ig.utexas.edu/research/projects/climate/GCM_uncertainty/wpe6.gif
A substantial number of models go off and do their own thing, which has nothing to do with weather noise. There is no point debating the nuances of Stoke’s statements when they are not even true.
Nick Stokes December 29, 2014 at 4:46 pm
” … the indeterminacy of weather is one big reason why models don’t agree, on a decadal scale, with each other or with Earth.”
Internal variability (the stuff that averages out) is a minor reason why models don’t agree, on a decadal scale, with each other or with Earth. Structural uncertainty probably swamps all others when comparing with earth (but models share the same structure and so artificially hide this) and differing parameter estimations probably exceed the impact on internal variability.
You might get a common signal out of different model runs, but what it is telling you about future climate and its relationship to forcings etc is moot.
Unless of course you define future climates to be what the models predicted once they have been averaged out.
Using the Central Limit Theorem, we know that the arithmetic mean of a sufficiently large number of random noise variables is approximately normal.
====================
that only applies to certain classes of problems. for 1/f noise and a great many dynamic systems in nature this does not hold true.
the problem with climate models is that they have made a large number of simplifying assumptions without establishing that the assumptions are correct.
one of the major flaws remains the assumption that averaging reduces noise and what is left over is signal. but this is complete nonsense.
you cannot remove 1/f noise with a period of 1000 or 10,000 or 100,000 years by averaging 150 years worth of data. Yet the amplitude is much greater than 10 or 100 year noise. So you are simply fooling yourself that you are removing the noise.
Will Nitschke December 29, 2014 at 6:15 pm
To really push the point home perhaps show a graph of the increase in the modeled absolute temperature from a common starting absolute temperature.
how [do] we know that the 60 year quasi cycle seen in ocean currents isn’t simply 1/f noise with a period of about 60 years? Because the frequency is approaching zero 1/f means that the magnitude of the noise will be very big in comparison to higher frequency noise.
How can you determine if the 60 year ocean cycles are indeed cycles or simply long period, high magnitude noise? So, if one was to use a 60 year running average for example to remove the quasi cycle, would you be removing noise or signal? Thus the danger of averaging, and why you don’t perform statistics on averages. You use the underlying data to avoid generating spurious correlations and trends.
“A substantial number of models go off and do their own thing”
Again, I wish people would give their sources. That plot is from Fig 9.6, Cubasch et al, 2001. Things have changed. But yes, as I said above in response to HAS, weather noise is not the only source of deviation. But on a decadal scale, it is a big one.
Nick Stokes wrote: “As is well known, weather is chaotic, and as determined from initial conditions is effectively random.” That is true. But then he wrote: “That’s why models don’t agree”, which is false.
In doing a single long model run to determine the climate sensitivity of the model, most of the random noise should cancel. The resulting sensitivity is then a property of the physics assumed in the model. Look at the graph Nitschke posted; the trends are much larger than the noise, so slightly different noise won’t change the trends. If you run a model with one set of initial conditions, then do a second run with randomly varied initial conditions, the trend will not be very different.
The various models give very different sensitivities due to different assumed physics, mostly to do with how they parametrize clouds. You can not average out errors in physics. Averaging a wrong result with a right result gives you a wrong result.
Mike M.
“But then he wrote: “That’s why models don’t agree”, which is false.”
It was incomplete, as I’ve agreed. I’ll repeat my response to HAS above
“Well, OK, the indeterminacy of weather is one big reason why models don’t agree, on a decadal scale, with each other or with Earth.”
“Look at the graph Nitschke posted”
As I said above, that is from Cubasch et al, 2001. Those are fairly early days for AOGCM’s.
“You can not average out errors in physics.”
Averaging reduces noise, and gives a more accurate version of signal. If models are returning different signals, you don’t get a further improvement in the same way. The ambiguity of sensitivity etc remains. That is what people have been working on since 2001, and will continue to do.
ferdberple December 29, 2014 at 6:34 pm
You are 100% correct as regards time averaging. I think Nick is thinking more of ensemble averaging. What he is claiming isn’t generally true, though, except when the system is linear and dissipative.
Stokes is still full of it. Standard excuse, yes the models of 2001 were wrong, but the models used in 2014 are now fine. Since it’s trivial to disprove this excuse, why make it? In the hopes nobody will check that you’re lying, of course.
You can readily identify a consistent 1.5C spread between models, even the current generation, like shown here –
http://wattsupwiththat.files.wordpress.com/2013/10/cmip5-90-models-global-tsfc-vs-obs1.jpg?w=640&h=576
Or you can consult figure 9.8 in the IPCC, Model Evaluation Chapter 9 AR5. (Except this diagram does its best to try make the information difficult to interpret using the old fashioned spaghetti vomit technique.)
Will Nitschke December 29, 2014 at 8:53 pm
” … you can consult figure 9.8 in the IPCC, Model Evaluation Chapter 9 AR5.”
As I noted above, Fig 9.08 also shows that the models have a range of absolute temperatures of 2.8 C for their 1961 – 1990 mean temp.
Which climate were they converging to Nick?
And just what is the freezing point of water on that planet?
It’s called structural uncertainty etc, not weather variability – and these runs are over the period the models were tuned to and have the same forcings as our planet.
What happens when we move outside their comfort zone?
Will Nitschke,
If you’re into accusations of lying, perhaps you’d like to explain why you showed a plot from 2001 with no indication of source?
But
“You can readily identify a consistent 1.5C spread between models, even the current generation”
In what way consistent? Your CMIP5 plot shows the much greater role now of weather noise vs secular differences, even after 5-yr smoothing. No-one has claimed that models do not still have systematic differences. What I have said is that model runs have differences due to weather noise, and averaging will reduce this.
Nick Stokes December 29, 2014 at 10:19 pm
“No-one has claimed that models do not still have systematic differences. What I have said is that model runs have differences due to weather noise, and averaging will reduce this.”
Nick Stokes December 29, 2014 at 2:17 pm
“As is well known, weather is chaotic, and as determined from initial conditions is effectively random. That’s why models don’t agree. ”
If you are going to agree you over-egged the pudding at 2.17 pm, why not acknowledge this rather than re-write history at 10.19 pm.
The reason I’m being picky about this is that Schmidt and Sherwood are applying lipstick to the pig rather than helping to get things back onto a more scientific basis, and you are singing in the chorus using the same type of song sheet.
Anyone who has looked at climate model runs can see *obvious* structural differences. Many models run consistently hot. A few bump along the bottom of the spread. The rest are all over the map.
And I accuse Stokes of lying because he lies through his teeth. Even a cursory look at the model runs of 2001 (forecast up to 2030) show a spread of 0.5C. But the CMIP5 model runs over the same range show a spread of around 1C. The CMIP5 models are LESS structurally consistent with each other, although that is likely an artifact of comparing 90 models in one chart to 9 in the other.
There are really only two possibilities here. Stokes is a professional BS artist or he is ignorant. I don’t think the guy is ignorant.
Chaotic – in other words recursive and the result is highly sensitive to very small changes to the starting conditions. So if you run it enough times with very slightly different inputs you will eventually get a result you like. Or another way to put it is that the results are not computable, as you never know the starting conditions in sufficient detail.
Lorenz, who discovered this branch of mathematics, was a meterologist, and came across this whilst trying to predict the weather.
So I don’t agree with Nick Stokes when he says they have a common clmate signal. Not if the system is truly chaotic. Unless of course, that common signal has been assumed and programmed in. So let them open source the model code and we can all see for ourselves!
Nick: the unexplained variance in climate data isn’t necessarily “random” its merely unexplained. Theres a big difference, and to assume that the unexplained variance is white noise is perhaps unwarranted. Just because we can’t attribute the variance to a known cause does not make it random.
Mods: this is a repost because my first attempt vanished.
Nick Stokes
You assert
NO! Absolutely not! And you know you have presented falsehood!
The chaotic nature of weather is NOT why the models don’t agree.
The models don’t agree because each model is of a different and unique climate system.
And you know that because I have repeatedly explained it to you.
For the benefit of those who do not know, I again explain the matter.
None of the models – not one of them – could match the change in mean global temperature over the past century if it did not utilise a unique value of assumed cooling from aerosols. So, inputting actual values of the cooling effect (such as the determination by Penner et al.
http://www.pnas.org/content/early/2011/07/25/1018526108.full.pdf?with-ds=yes )
would make every climate model provide a mismatch of the global warming it hindcasts and the observed global warming for the twentieth century.
This mismatch would occur because all the global climate models and energy balance models are known to provide indications which are based on
1.
the assumed degree of forcings resulting from human activity that produce warming
and
2.
the assumed degree of anthropogenic aerosol cooling input to each model as a ‘fiddle factor’ to obtain agreement between past average global temperature and the model’s indications of average global temperature.
More than a decade ago I published a peer-reviewed paper that showed the UK’s Hadley Centre general circulation model (GCM) could not model climate and only obtained agreement between past average global temperature and the model’s indications of average global temperature by forcing the agreement with an input of assumed anthropogenic aerosol cooling.
The input of assumed anthropogenic aerosol cooling is needed because the model ‘ran hot’; i.e. it showed an amount and a rate of global warming which was greater than was observed over the twentieth century. This failure of the model was compensated by the input of assumed anthropogenic aerosol cooling.
And my paper demonstrated that the assumption of aerosol effects being responsible for the model’s failure was incorrect.
(ref. Courtney RS An assessment of validation experiments conducted on computer models of global climate using the general circulation model of the UK’s Hadley Centre Energy & Environment, Volume 10, Number 5, pp. 491-502, September 1999).
More recently, in 2007, Kiehle published a paper that assessed 9 GCMs and two energy balance models.
(ref. Kiehl JT,Twentieth century climate model response and climate sensitivity. GRL vol.. 34, L22710, doi:10.1029/2007GL031383, 2007).
Kiehl found the same as my paper except that each model he assessed used a different aerosol ‘fix’ from every other model. This is because they all ‘run hot’ but they each ‘run hot’ to a different degree.
He says in his paper:
And, importantly, Kiehl’s paper says:
And the “magnitude of applied anthropogenic total forcing” is fixed in each model by the input value of aerosol forcing.
Kiehl’s Figure 2 can be seen here.
Please note that the Figure is for 9 GCMs and 2 energy balance models, and its title is:
It shows that
(a) each model uses a different value for “Total anthropogenic forcing” that is in the range 0.80 W/m^2 to 2.02 W/m^2
but
(b) each model is forced to agree with the rate of past warming by using a different value for “Aerosol forcing” that is in the range -1.42 W/m^2 to -0.60 W/m^2.
In other words the models use values of “Total anthropogenic forcing” that differ by a factor of more than 2.5 and they are ‘adjusted’ by using values of assumed “Aerosol forcing” that differ by a factor of 2.4.
So, each climate model emulates a different climate system. Hence, at most only one of them emulates the climate system of the real Earth because there is only one Earth. And the fact that they each ‘run hot’ unless fiddled by use of a completely arbitrary ‘aerosol cooling’ strongly suggests that none of them emulates the climate system of the real Earth.
And it cannot be right to average the model outputs because average wrong is wrong.
Richard
Mods:
I have twice tried to make a post in reply to N Stokes but both attempts have vanished.
Please see if the attempts are in the ‘bin’ and if so then retrieve one of them and post it. Alternatively, please let me know they are lost so I can make a third attempt.
Richard
Nick writes “As is well known, weather is chaotic, and as determined from initial conditions is effectively random. That’s why models disagree.”
It’s common belief among AGW enthusiasts that the earth cannot maintain different energy levels resulting in global temperature changes far beyond decadal scales. That’s the basis for the “its CO2 wot done it cause we can’t think of anything else” line of reasoning.
If you’re right then the whole “it must be because of the CO2” argument falls apart.
Paul Mackey
“So I don’t agree with Nick Stokes when he says they have a common climate signal. Not if the system is truly chaotic. Unless of course, that common signal has been assumed and programmed in. So let them open source the model code and we can all see for ourselves!”
Weather is truly chaotic. And we do have a climate. Chicago is different to Miami.
There is open source code, and documented too. Eg
GISS
CCSM 4.0
davideisenstadt
Nick: the unexplained variance in climate data isn’t necessarily “random”
I agree. As I said above, the essential feature is that it is subject to cancellation on averaging. Maybe not complete, but enough for climate information to emerge.
Reply to Stokes ==> Please reference the peer-reviewed paper that clearly demonstrates that the climate signal found in common amongst models is in actuality a climate signal and not simply a result of common parameterization.
The IPCC is of the opinion that CLIMATE is a bounded non-linear dynamic system — not just weather. Thus climate is also highly sensitive to initial conditions and sensitive to the tweaking of parameters in the models. Not so?
Johanus: Using the Central Limit Theorem, we know that the arithmetic mean of a sufficiently large number of random noise variables is approximately normal.
that does assume that they are an iid sequence from a population with a finite variance (actually, it assumes slightly more than that, but this is enough for now), neither of which is known for the climate simulations.
For practical purposes, the further assumption is that the mean to which the sample means converge is close to the actual “signal” or mean of the population that you hope you are sampling from — something else not known or demonstrated for the climate simulations. The divergence of the sample mean from the subsequent data suggests indeed that the mean of the population from which the simulations are a sample is different from the true climate trajectory. That is the point that the Schmidt and Sherwood article is attempting to discredit: that the divergence shows the model underlying all simulations is wrong.
Nick Stokes: But they have a common climate signal determined by forcings etc. The way to get an underlying signal obscured by random noise is to average a large number of instances.
As I wrote in response to Johanus, that is only true if the function to which the mean of the samples is converging is in fact the true signal. In the case of the climate simulations, the (growing) disparity between the actual climate and the simulation mean indicates that the “common climate signal” assumed by all the models is not the true climate signal.
Put differently, the means of a large biased sample converge almost surely to a function that is not the signal. A question much addressed by critics of the modeling, ignored by Schmidt and Sherwood, is whether the disparity displayed so far (between climate and model means) is enough evidence that the models are useless for planning purposes.
Nick Stokes: As I said above, the essential feature is that it is subject to cancellation on averaging. Maybe not complete, but enough for climate information to emerge.
I agree. With respect to the climate models, the “cancellation” to date shows that the mean does not in fact lead to climate “information”. The “essential feature” is not present in climate models.
Since Climate is a non-linear system, there is no underlying signal in the noise, what looks like noise is actually the signal, how would you average this?
The ideas of “signal” and “noise” are appropriate in relation to the problem of communication but inappropriate in relation to the problem of control. In the latter case the signal and noise come from the future thus having to travel at superluminal speed. This, however, is impossible under relativity theory.
Well point B has led to some interesting challenges and discussion. Me happy.
But what about Points A and B?
Especially how Point B can be a point at all if peer review is functioning correctly?
I should like to make a request that might appear off topic. Both at University and in industry I was taught to never rely solely on the color of the lines on a graph to differentiate the data. Two reasons were given – they don’t reproduce well in black and white (probably no longer an issue), and there are color-blind people in the community. I was taught to use color and different line types / line weights. Possibly those submitting to WUWT might consider this in future submitals.
Please do not consider this a criticism of this post, or any others. Just a suggestion.
Thanks, and may we all have a happy 2015, with another totally ineffective CoP in Paris next December.
Jim
I second Jim’s suggestion. Different line types is an excellent policy to follow.
My first experience of Excel graphs was as part of a presentation to the Finance Director. We had utilised all the colours for the charts. We went through the presentation only to discover at the first chart that he was colour blind. A lesson that was taken on board for all future presentations.
Your advice is excellent for all bloggers.
A good discussion of this subject here: http://www.climate-lab-book.ac.uk/2014/end-of-the-rainbow/
@retired Engineer – very good point well made.
Thank you Jim.
I am red/green color blind and have an extremely hard time differentiating fine gradient lines of those colors.
PS – I don’t sort socks either…
What we really need, in order to say the models are no better than a line, are hindcast comparisons. For example, fit the line to data from 1880 to 1920, and then see how well it predicts 1921-1940. Repeat for other segments of the record. The analysis shown here is just fun with graphs.
Barry
You assert
That is not true if the purpose of the models is to forecast the future.
Ability to hindcast is NOT an indicator of ability to forecast
The reason for this is that
(a) there are an infinite number of ways to adjust a model to agree with the single known past
but
(c) there is only one way the unknown future will evolve from among the infinite number of possible futures.
Richard
Hi
I commented a couple of times over at Bishop Hill on this, particularly contrasting the the breezy confidence exuded by Gavin Schmidt and Steven Sherwood that all is well with climate models with Leonard Smith’s of CATS at LSE view that “.. climate models were not up to the standards in relation to other computational fluid dynamics groups in terms of validation, verification, uncertainty quantification, and transparency …”, and that “the demonstrated value of weather/climate forecasts as a function of lead time:
– Medium-range: Significant, well into week two +
– Seasonal: Yes, in some months and regions
– Decadal: Not much (global and regional)”
[I’m quoting a summary of a Smith workshop presentation http://www.eas.gatech.edu/sites/default/files/SmithTalkGT.pdf from a Judith Curry post on the workshop in question http://judithcurry.com/2014/02/18/uk-us-workshop-part-iv-limits-of-climate-models-for-adaptation-decision-making/ ]
Smith’s point is that climate modelers need to build greater trust (as other CFD modellers have done) by not concealing the problems. Schmidt and Sherwood are very much in the latter camp i.e. part of the problem rather than part of the solution.
One of the sub plots here is that the current preoccupation with GCMs might be counterproductive on a decadal scale, and we should be investigating other models that would better meet the policy maker users’ needs. The argument is that what GCMs model is not what we need to know, and what we need to know GCMs can’t deliver.
On that score Mr Tisdale is there some accessible literature on using the larger scale atmospheric oscillations as the basis for modelling on a decadal scale?
I was wondering if anybody ever tried training a neural network to predict the global surface temperature??? The program could be fed all sorts of data, including the CO2 and other concentrations, the solar flux, magnetic field strength, forest cover, amount of dirty coal being burned, volcanoes, you name it. I bet the neural network would do a better job.
The advantage of a well-trained neural network is that we don’t really understand how it works – we get a huge matrix of coefficients, and that’s all. A great fit for climatology.
Reply to Fernando ==> CG makes a valid point — since we do not understand (on a deep level) how the climate system as a whole works and since we do know that it is some type of a coupled, bounded, multi-faceted , non-linear dynamical system(s), a neural network might be good a describing the system, but would not be capable of telling us how it works nor predicting its outcomes.
They need to separate policy from science, politicians from scientists, oracles from forecasters. They routinely and intentionally leave the scientific domain and venture into universal (i.e. space) and even extra-universal (i.e. time and space) domains. Likely for the same reasons that science was exploited and corrupted hundreds and thousands of years earlier.
The system is incompletely characterized and unwieldy, or chaotic. Statistical methods are only valid within an indefinite period of time and space. The scientific method is a framework designed to reject philosophical inference and necessarily limit scientific inquiry through deduction.
That’s one step forward for man. Two steps backward for mankind.
The climate models are built without regard to the natural 60 and more importantly 1000 year periodicities so obvious in the temperature record. The modelers approach is simply a scientific disaster and lacks even average commonsense .It is exactly like taking the temperature trend from say Feb – July and projecting it ahead linearly for 20 years or so. They back tune their models for less than 100 years when the relevant time scale is millennial. The whole exercise is a joke.
The entire UNFCCC -IPCC circus is a total farce- based, as it is, on the CAGW scenarios of the IPCC models which do not have even heuristic value. The earth is entering a cooling trend which will possibly last for 600 years or so.
For estimates of the timing and extent of the coming cooling based on the natural 60 and 1000 year periodicities in the temperature data and using the 10Be and neutron monitor data as the most useful proxy for solar “activity” check the series of posts at
http://climatesense-norpag.blogspot.com
The post at
http://climatesense-norpag.blogspot.com/2014/07/climate-forecasting-methods-and-cooling.html
is a good place to start. One of the first things impressed upon me in tutorials as an undergraduate in Geology at Oxford was the importance of considering multiple working hypotheses when dealing with scientific problems. With regard to climate this would be a proper use of the precautionary principle .-
The worst scientific error of the alarmist climate establishment is their unshakeable faith in their meaningless model outputs and their refusal to estimate the possible impacts of a cooling rather than a warming world and then consider what strategies might best be used in adapting to the eventuality that cooling actually develops.
Do these long-term periodicities exist? Aren’t we better off by assuming an auto-correlated random number sequence? Do we really know enough – in 2014?
Curious George – Yes they clearly exist see
http://climatesense-norpag.blogspot.com/2014/07/climate-forecasting-methods-and-cooling.html
Dr. Norman Page wrote: “the importance of considering multiple working hypotheses when dealing with scientific problems”.
This is indeed important and does seem to be a problem with the climate modellers. They downplay possibilities like natural oscillations, random walks in a potential well, and climate being primarily an ocean phenomenon rather than an atmospheric one. Then they all move in a herd.
That seems to be an increasing problem in science in general, not just climate science. With an ultra-competitive environment for funding and increasing reliance on all sorts of performance metrics, woe be to researcher who does not move with the herd. He will be trampled, or left behind to be picked off by the wolves.
Mike M.,
No. Virtually everything you know about oscillating internal climate variabilities comes from the fact that those things are very much not ignored, and are rather studied in extensive detail.
An experimental protocol:
1) Select a penny at random from your spare change bin.
2) Flip it 10,000 times.
3) For each outcome of heads record a 1 in your lab notebook. -1 for each outcome tails.
4) Sum the results.
5) Repeat 2-4 100 times.
Perform whatever statistical test of your choice on the results. If you find that you get a statistically significant non-zero result across your 100 trials, it’s a safe bet that your penny is biased, and no one sane will call you crazy for ingoring random walks.
Oceans are a dominant factor, but they do not create energy, nor destroy it; they only soak it up and dole it back out and have a far greater capacity for doing so than anything else in the climate system. However, energy still has to come in through the atmosphere and get back out through it. Ignore radiative molecules in the atmosphere at the peril of doing very schlocky science.
Brandon Gates wrote: “climate variabilities comes from the fact that those things are very much not ignored, and are rather studied in extensive detail”. Yes but so far as I am aware the models do not reproduce anything with more than a vague resemblance of the decadal oceanic oscillations. If you can cite references to the contrary, I would be very interested in them.
“An experimental protocol:
1) Select a penny at random from your spare change bin.
2) Flip it 10,000 times.
3) For each outcome of heads record a 1 in your lab notebook. -1 for each outcome tails.
4) Sum the results.”
About two-thirds of the time, this will produce a sum between -100 and +100, 1/6 of the time lower, 1/6 of the time higher. The root-mean-square month-to-month variation in global temperature is about 0.1 K.There are about 1800 months in the instrumental T record. So repeat your experiment flipping the penny 1800 times and summing values of -0.1 and +0.1. About 1/6 of the time the sum will be less than -4.5 and 1/6 of the time greater than 4.5. That is much larger than the observed T range. Including negative feedback will narrow the range, which is why I said “random walks in a potential well”.
” Ignore radiative molecules in the atmosphere at the peril of doing very schlocky science.” Absolutely true. Increasing atmospheric CO2 will warm the climate. the question is how much. Treating the ocean as little more than a source of water vapor and a sink for heat, as many models do, also puts one at peril of doing poor science.
Mike M.,
Well you’re in luck, here’s a 2014 open access paper that is CMIP5-specific: http://iopscience.iop.org/1748-9326/9/3/034016/article
Abstract
Abstract
We analyse a large number of multi-century pre-industrial control simulations from the fifth phase of the Coupled Model Intercomparison Project (CMIP5) to investigate relationships between: net top-of-atmosphere radiation (TOA), globally averaged surface temperature (GST), and globally integrated ocean heat content (OHC) on decadal timescales. Consistent with previous studies, we find that large trends (~0.3 K dec−1) in GST can arise from internal climate variability and that these trends are generally an unreliable indicator of TOA over the same period. In contrast, trends in total OHC explain 95% or more of the variance in TOA for two-thirds of the models analysed; emphasizing the oceans’ role as Earth’s primary energy store. Correlation of trends in total system energy (TE ≡ time integrated TOA) against trends in OHC suggests that for most models the ocean becomes the dominant term in the planetary energy budget on a timescale of about 12 months. In the context of the recent pause in global surface temperature rise, we investigate the potential importance of internal climate variability in both TOA and ocean heat rearrangement. The model simulations suggest that both factors can account for O (0.1 W m−2) on decadal timescales and may play an important role in the recently observed trends in GST and 0–700 m (and 0–1800 m) ocean heat uptake.
That last sentence caught my eye in particular because my own dirt simple regression analyses of observational data only suggest that AMO alone can contribute on the order of +/-0.2 W/m^2 of variability throughout its entire ~60 yr cycle.
If you’re looking for a model that nails the timing of ENSO, PDO, AMO, NAO, AO, etc., I got nuthin’. AFAIK it wasn’t attempted by CMIP5 models for AR5, but CMIP6/AR6 and the emerging decadal forecast concept may contain the beginnings of trying to do such a thing.
Yet for an unbiased coin, one would expect 100 seperate series of 10,000 flips to show no clear pattern, yes? I.e., a distribution test ought to come back with “probably normal” if the coin isn’t biased.
Eyah, monthly data are pretty noisy. I ‘spect you’re looking at anomaly data. For HADCRUT4GL absolute, I come up with an RMS month-to-month variation of 0.64 K (tavg = 13.87, tmin = 11.06, tmax = 16.54, trange = 5.47, n=1975). It’s kind of remarkable how well constrained this random walk of yours is, innit.
Tut. Seems a tad hasty to make any conclusions about sloppy researchers doing crappy models in absence of any specifics … especially with things like the ARGO program ever being expanded with more and better buoys, paper after paper based on their data, etc.
Brandon Gates,
Thanks for the reference, I will read it with interest.
“If you’re looking for a model that nails the timing of ENSO, PDO, AMO, NAO, AO, etc., I got nuthin’.” I would not expect a model to do that, it would be like asking to forecast the formation dates of hurricanes. I’d be impressed by a model that can get the statistical properties (duration, amplitude. etc.) of those things right.
Yes, I used anomaly data. The 0.64 K variation you found would be almost entirely seasonal changes. I don’t see why you would say that a 95% confidence of +/-9 K is well constrained.
My complaint with the models is not simply with whether they are crappy. It is with the way the modellers seem to assume they have things right in the absence of adequate attempts at falsification. That includes both inadequate consideration of alternate hypotheses and an insufficient willingness to say “such-and-such a model is wrong because …”. Some models don’t even conserve energy to better than a few W/m^2. But they seem to be deemed just as good as any other model in constructing ensemble averages.
The thing that really got be questioning the quality of science in climate modelling is that 35 years ago the range of estimates in equilibrium sensitivity was 1.5 to 4.5 K and today it is 1.5 to 4.5 K. Not much progress for all the money and effort. But in spite of the lack of progress in narrowing the range, the certainty of the predictions has increased enormously.=, as if they really had pinned things down.
Mike B.,
You’re quite welcome for the reference. I look forward to any response once you’ve read it.
I see my own prejudices bite me — so many here don’t make that latter distinction, and assiduously avoid confronting it when those are pointed out as the most reasonable metrics.
We may be talking past each other, but as you note the largest portion of variability from the comes from those seasonal fluctuations. Even anomalized, the monthly data still retain a lot of fuzz which I usually tamp down with a moving 12 month average if I absolutely want to see things at that resolution.
The main thing here is I have a much different approach to visualizing relative stability, hence predictability — I make some kind of prediction and throw a confidence interval around that based on the standard deviation of the residual. The 95% CI is on the order of +/- 0.2 K for a regression of 2xCO2 alone against temperature, with a clear secular trend. The Hiatus is comfortably inside of that envelope, even when I treat post-2000 temperature data as out of sample.
IOW, the coin is biased. See also: coin-tosses are independent events. Pretty sure you take that into account by suggesting month-to-month variabilities, but I do want to make sure it’s explicitly understood that causal chains matter in climate whereas in pure chance gambling they do not.
If you’re saying that CO2’s radiative function in the atmosphere is an unwarranted assumption, you may as well tell me so is the Big Bang. I don’t think you are, so maybe you should give me a specific or two. In the meantime, go read Schmidt and Sherwood’s paper referenced in this article if you haven’t already — I think it takes fairly unvarnished look at the state of what is amiss in AOGCMs, why those things are difficult to address, and some of what’s being done to fix them. Also referenced here, Swanson (2013) is even more pleasingly pointy-tipped. I’ve got a third paper littering my hard drive from a year or two back that’s got several eye-openers.
Aaack! Like what hypotheses specifically? Speculations are a dime a dozen, hunches two for a dollar. I heard rumors of a special this week: four SWAGs for 99 cents, get ’em while they’re hot. There literally isn’t much new under the Sun that hasn’t already been hashed out in primary literature since the late ’50s. If you tell me a hypothesis you think isn’t getting its due consideration, chances are I can cough up a reference from a decade or three ago where it was considered in earnest.
Harumph. That depends on who you read and when. It’s also quite a matter of personal taste, therefore opinion. I myself prefer, “this is where the thing is b0rked, but this is how it’s still useful,” because all models are always going to be crappy and the trick is to know how best to heed their guidance. Which is very subjective else we wouldn’t be having this debate.
It does suck when something is well and truly busted and nobody realizes it.
Dangit, you made me dredge up that other paper I mentioned above: Mauritsen et al. (2012), Tuning the climate of a global model http://onlinelibrary.wiley.com/doi/10.1029/2012MS000154/full
Open access. Yes, some GCMs leak energy. Oi vey.
They say there are two things you don’t want to see being made if you like them: laws and sausages. GCMs may be a close third. Thing you need to keep in mind is that ALL models probably have some problem you’d find just as glaring and pretty soon there would be no ensemble at all. Which is not an uncommon refrain on the contrarian side of the fence. World I live in, we do the best with what we have, constantly improving as we have time, resources and creativity to do so.
Oh I don’t know, I think it rather speaks to the integrity of those involved in the effort that after 35 years they have the honesty to report the full, unchanged range of uncertainty. Consider the possiblity that figuring out how to simulate an entire planet isn’t exactly rocket science, and update your metaphors and expectations accordingly.
Ah, well that may be mashing two things together which don’t belong. The all but settled part of the science is that our activities are having a noticeable effect. The forward looking portion of things is still considered largely uncertain, which I think is quite appropriate.
“Those are the things that caught my eye… …What caught yours?”
What caught my eye is that the word “performs better” should be replaced by “doesn’t perform as poorly” for this article.
They need a supermodel.
Preferably, one that is low-maintenance.
Do they exist?
What stood out for me was that section 5 (Practical climate model philosophies) was (as far as I’ve been able to determine so far) this and nothing else: an effort to dodge the idea that since the models suck and show little skill, therefore it doesn’t make sense to pay much attention to them.
Hooey I say.
Mark Bofill: What stood out for me was that section 5 (Practical climate model philosophies) was (as far as I’ve been able to determine so far) this and nothing else: an effort to dodge the idea that since the models suck and show little skill, therefore it doesn’t make sense to pay much attention to them.
I agree with you. Model results to date have no demonstrated utility, and Schmidt and Sherwood have written an intellectual exercise of a sort to avoid addressing the issue of how accurate model results should be in order to be considered useful.
Thanks Matthew.
Serious scientists should stop discussing climate models as if these represented serious science.
mpainter – I agree entirely we should be discussing the forecasts made using the natural cycles as illustrated at http://climatesense-norpag.blogspot.com/2014/07/climate-forecasting-methods-and-cooling.html
The problem is that Arctic sea ice is above normal and the only “spectacular” event is the wholesale manipulation of the GISS data. The models are never going to track if they keep diddling with the temperature data. (image from https://stevengoddard.wordpress.com/2014/12/18/arctic-warmed-six-degrees-from-1900-to-1940/ )
“…While the use of complex simulations in science is a development that changes much in how science is done in practice, we argue that the concepts being applied fit very much into traditional practices of the scientific method, albeit those more often associated with laboratory work…”
Sounds like model output as “Data”. Utter Cr*p.
I have a different objection to this business of averaging model outputs. Nick wrote well above that averaging the results of multiple models gives a more precise answer and that it removes noise – do I have that correctly?
That is wrong in a sneaky way. Averaging the runs of One climate model can do that at least in part, assuming there are no big omissions from its representations of physical systems.
However it is quite a different thing if the answers being averaged are from different methods of calculation. The ‘many runs’ averaging has to be for one model, not the averaging of the outputs of many models. They do not work in the same way. It is trying to remove different sets of background noise from multiple signals which are themselves not the same.
Averaging 100 runs of a model that can’t produce the temperature record doesn’t give a ‘better answer’. Averaging the averages of model 1 with the average outputs of model 2 which is worse at producing the temperature record does NOT increase the precision of anything and certainly doesn’t predict future temperatures
This is nonsense. Averaging a warm model with a hot model is done to produce an alarming forecast. They should eliminate all models that can’t reasonably reproduce measured temperatures.
Crispin in Waterloo December 29, 2014 at 9:26 pm
Yes – the models have different structures and parametrisation and so does the earth. There are systemic rather than random errors between models and the earth (I’ve talked about structural uncertainty above). I’ve also just commented above that even when the model families are run using the same forcings and across the period they have been tuned to the 1961- 1990, global absolute temperatures range over 2.8 C. The problem is that a number of really important things in the atmosphere depend on absolute temps – I use the example of when ice freezes – we are talking about models that are reproducing the physics in quite different ways.
Bob
It’s funny you should take this approach in almost “tongue-in-cheek” article. A friend of mine used to work for a hedge-fund and for all the Oxbridge math graduates creating complex models in that company, the methods that were most useful were projections from running averages – non-parametric statistical models.
@CD – Long Term Capital Management – they made the same mistake with models as I recall….
So the deep philosophical conundrum is to determine whether climate models are better than the equation:
N = N + X
Whether climate models are, or are not, better than N = N + X, is apparently not a straightforward question to answer.
I think the problem and not expanded upon in the article is the use of the different methods as a means to testing a hypothesis. I think the best method of doing this as we have three hypotheses – the two methods and the null (no change) – is to use a Bayesian approach from the out-of-sample set. This should at least give us a “score” of suitability (or rather conditional probability of being correct; conditioned on the observations). All this playing around with plots is a bit of arm-waving on everyones’ part.
I once tested whether an autocorrelation-based estimator could produce useful forecasts for a time-series containing several decades of measurements. Call the measurement data d(i) at time ‘i’.
I took a contiguous subset of the measurements from d(1) to some d(n), keeping in-hand some measurements after ‘n’. I calculated autocorrelation parameters using only the data up to d(n), and used these in a moving-average-type estimator to produce forecasts ‘f’. f(n+j) would be the forecast of d(n+j) for a forecasting horizon ‘j’.
As I had only used a subset of the data, I had data in hand to immediately calculate forecast errors for the points immediately following n.
I needed a benchmark forecast whose performance could be compared with the more sophisticated method. The ‘no-brainer’ forecast simply used the last data point d(n) as the forecast f(n+j) for any forecast horizon ‘j’. (My data had no definite trend, but de-trending could be used if there had been issues.)
What would a similar test say about climate models? We have GAST time series. We could take a contiguous subset ending at GAST(n), leaving some already-known data after n. The no-brainer forecast would be f(n+j) = GAST(n), for horizon ‘j’. If a GCM is calibrated using only data up to ‘n’ and initialised at point ‘n’, could it produce better forecasts of GAST(n+j) compared to the no-brainer?
“What caught yours?”
THIS:
“If we had observations of the future, we obviously would trust them more than models, but unfortunately observations of the future are not available at this time. (Knutson and Tuleya 2005)”
Also, a climate paper with no figs? What is the world coming to?
It’s too bad they won’t trust CURRENT observations more than models.
A few things.
(Knutson and Tuleya 2005):
If we had observations of the future, we obviously
would trust them more than models, but
unfortunately observations of the future are not
available at this time.
It has been 10 years now, so they do have observations of the future. Models still not close.
This multi-model ensemble (MME) of opportunity provides an immense resource for climate model evaluation. There are opportunities to assess the structural uncertainty of model predictions, to identify interesting and potentially informative patterns of behaviour across models, to tie future projections to past skill in out-of-sample paleo-climate tests with the same models, and to assess the impact of specific model characteristics (e.g., scope, grid size) on specific aspects of behaviour and fidelity. Many hundreds of papers looking at the CMIP5 results have already been published.
However, the MME was not designed with a particular focus, and consequently the variations in structure
are somewhat haphazard (following the preferences of individual groups rather than any pre-determined
plan) (Knutti et al 2010). The histogram of any particular prediction or result from this set of models should therefore not be interpreted as any kind of probability density function (van Oldenborgh et al 2013; Allen et al 2013), although its breadth offers qualitative guidance if interpreted carefully. Curiously, the multi-model mean is often a more skillful predictor on average across a suite of quantities than is any individual model (Reichler and Kim 2008), though the effect soon saturates (Tebaldi and Knutti 2007). Systematic biases across all models are clearly present that cannot be removed via averaging
So hundreds of papers published all based on particular predictions with no kind of probability density function.
More generally, in response to these challenges and as outlined by Betz (2013), the increasingly dominant way to convey this information (for instance in the Fifth Assessment report from the Intergovernmental Panel on Climate Change (IPCC AR5) (Stocker et al 2013)) has been to supplement key conclusions or predictions with a confidence statement reflecting the expert judgment of how strong is the evidence that underlies it (Cubasch et al 2013). Simulation results, for instance, related to tropical cyclone intensity changes, are given as numerical indications, but with low levels of confidence, reflecting the lack of supporting evidence for skill in modelling changes for this metric in this class of model. In our view, this is effectively an ’informal’ application of the concepts of Bayesian updating but with no actual calculation of the likelihoods or posterior probability3.
Honestly, we are experts with judgment and all that Bayesian math is really hard to do.
Bayesian math is really hard to do
If you’re being serious here then you are wrong. It may seem convoluted when brought up on the frequentist approach. Where we have multiple and competing approaches it is the obvious, and although I’d admit, most attempts to explain it are awful it really is very simple and incredibly eloquent.
On a more technical level, the only problem is that you have to make assumptions to begin with and only with enough time and a recursive approach are the posterior and prior likely to converge to something akin to the “correct answer”. But then how long is long-enough.
cd – if it is only a technical problem, then why don’t they do it, instead of taking the easy, “we’re experts and know all” approach. I always got down marks for not showing my work on math problems.
DD
I guess cause they’re academics they can arm-wave cause in the end academics don’t have to actually produce something that is tested for the real world. They can drop the bomb and walk away unscathed because when they walk into the arena of the real world it’s just for fun.
Listen to one of your greatest living Americans.
My second comment, is: using GISTEMP Global at Wood for Trees, linear trends from 1970-2000, 1980-2000, 1970-2010, and 1980-2010 hit the middle of the temperature bracket from the last 3 months.
Interesting. What happened to the great pause?
(Knutson and Tuleya 2005):
If we had observations of the future, we obviously
would trust them more than models, but
unfortunately observations of the future are not
available at this time.
We do not even have measurements for most of the planet in the past. In 1881, we certainly had no measurements from the interior of Antarctica, and very few ocean temperatures. The temperatures collected are essentially from places people lived. This creates a geographical bias. People did not collect temperatures from places where it was undesirable to live! It looks like all of these computer models are attempting to model fictitious data in the past.
Even observations of the present and recent past require “adjustment”, suggesting that the climate science community does not trust them either.
Excellent point. Climate Scientists never seem to be concerned about the quality, quantity, accuracy or precision of the past data they spout as gospel — a telling sign that the data matters far less than their preconceived foregone conclusions.
I’m guessing you’re correct. But then BEST have at least made an attempt to address these issues using kriging. They’ve never produced any kriging variance maps yet though. And they’ve never produced any maps of locally varying mean (e.g. trend models of altitude and latitude etc.). But on that very issue I’d also expect these to change with time as the effect of urbanistaion, agriculture, deforestation etc. is certainty likely to have resulted in changes in these structural models (used for detrending) with time. They aint been forthcoming with these either. They also may be making the mistake of dealing with the land and ocean as single statistical domains – in my line of work that’s sloppy or naive geostats. Furthermore…oh I’ll stop there.
If data are important enough to analyze, they should be important enough to collect.
What has been proven thus far is no one has shown any capability to forecast seasonal climate trends let along the climate going forward on any semblance of consistency.
They all have one thing in common they do not know what makes the climate system work and reacts the way it does. They prove this each and every time.
Worse they all will come up with excuses to show why they were not really wrong.
I have my own climate forecast which is easily falsified or verified which I have put forth on this site many times. I am not in wait and see mode and will be monitoring the climate.
In other words, “CMIP5 simulations are more consistent in their inaccuracy”.
I guess there is something to be said for consistency, for example career criminals are pretty consistent.
No what it means is that they’re wrong but are right by virtue that they aren’t as wrong. It’s a bit like the idiot who drank a poisonous liquid (that wasn’t water) rather than ate a watermelon because it looked more like water. But then that’s the intellectual capacity and scientific illiteracy in this field.
…than the melon that is
Nick Stokes;
The way to get an underlying signal obscured by random noise is to average a large number of instances.
That is nonsense, and demonstrably so.
If we were to take the 20% of models closest to observations, we’d get a different result than averaging all of the models. We could even cherry pick a small group of models (say 5) that gave the best average of any other group of 5 models. We’d have a different result still. We could run all of these forward and, they would diverge. The “best” 20% and the “best” 5 models would be unlikely to be the same ten years hence. We could even cherry pick model results that are wildly wrong in one direction with model results that are wildly wrong in the other direction, and get a “better” result out of the average of those than we do out of average of all, or 20%, or best 5. We’d have a “more” accurate average based on the least accurate models!
You just can’t take a whole bunch of models with known problems and use them to cancel each other’s errors out. If 500 new models showed up tomorrow, all even worse than the ones we have now, would you add them too? Even if they made the average worse?
Averaging wrong answers in the hopes of getting closer to the right answer is just nonsense. All it does is give a purpose to one set of completely wrong models to off set the answers from another set of completely wrong answers as an excuse for maintaining both sets.
david, I think Nick was saying they didn’t average enough of them together to get a flat line…../snark
Yeah but if your lively hood depends on it, you gotta do what you gotta do.
DavidMHoffer:
“Nick Stokes;
The way to get an underlying signal obscured by random noise is to average a large number of instances.
That is nonsense, and demonstrably so.”
No, read it again. What you are talking about is something different – models which may have different signals. Then averaging still reduces noise, but does not remove the effects of the inconsistency. It is still worth doing.
Nick, DavidM is correct.
It you have to use demonstrably wrong model outputs to get the error – compensated truth, you only know the answer for periods for which you have measurements. Looking forward, there is no way to know which erroneous models to average in order to get the future temperature until they have been measured.
This is not even sleight of hand. It is just increasing the error bar height at vast expense. An ensemble mean is a wrong answer with larger error bars than the components that make it up. That’s an arithmetical fact.
C-i-W
No, my original statement was correct. It said nothing about demonstrably wrong models. It is a simple proposition that a signal obscured by random noise can be revealed by taking an ensemble average.
What you and DMH are talking about is the situation where you can’t get a sufficient ensemble of instances; where the ensemble has members that are not identically distributed. Then indeed you get an approximate answer.
The problem is the assumption that the underlying signal may not be obscured by RANDOM NOISE but rather may be obscured by SYSTEMATIC ERROR. Averaging measurements from instruments that always read too high will result in an average estimate that is too high.
Say what?
The models do have different signals. They diverge over time, the longer you run them, the more they diverge.
Nick Stokes December 30, 2014 at 4:40 am
C-i-W
No, my original statement was correct. It said nothing about demonstrably wrong models.
But they are!
It is a simple proposition that a signal obscured by random noise can be revealed by taking an ensemble average.
There is no signal in a model! A model is purely abstract. If we had an ensemble of proxy data sources, all of which could be shown to respond to the same signal in one way or another, it might be instructive to “average” them in some way. But this assumes observational data. Models produce calculations, not data, and averaging calculations achieves nothing but a new calculation which can only have less information in it than the calculations it is derives from.
What you and DMH are talking about is the situation where you can’t get a sufficient ensemble of instances; where the ensemble has members that are not identically distributed. Then indeed you get an approximate answer.
No, we’re talking about the madness of averaging calculations which are not derived from observations. There is no justification in science or math for this. It is a smokescreen to mask get us all focused on the manner in which the models compare to each other instead of comparing any of them to observational data, which is the ONLY metric by which they should be measured.
Nick Stokes: No, read it again. What you are talking about is something different – models which may have different signals. Then averaging still reduces noise, but does not remove the effects of the inconsistency. It is still worth doing.
Consider the possibility that the model mean, or the mean of the diverse model means, is not the climate trajectory. Then the larger the sample you have, the more clearly will the sample mean differ from the climate trajectory. That is what has been happening. Something that all those models have in common, which underlies the claim that their mean is meaningful, is wrong.
The best “model” by far that really does correlate with Earth’s temperature records is that which shows the 934-year and superimposed 60-year cycles in the inverted plot of the scalar sum of the angular momentum of the Sun and all the planets seen here.
Planetary magnetic fields reach to the Sun and affect insolation and cosmic ray levels, the latter affecting cloud formation. Carbon dioxide has nothing to do with it, though the “greenhouse gas” water vapor does cool rather than warm.
Can “climate researcher” give a source for this? It sounds like the Scafetta model which is, I think, a result of finding accidental correlations between things that should have no physical connection.
Mike for empirical data re the length of the Millennial cycle see Figs 5,6A,B ,7, and 9 at
http://climatesense-norpag.blogspot.com/2014/07/climate-forecasting-methods-and-cooling.html
The best number seems to me likely to be 960 – 80 – but it will fluctuate somewhat depending on the system as a whole.
The biggest uncertainty in my cooling estimates is in knowing exactly where we are relative to the current millennial peak. The solar data suggests we are past the driver ( Solar “activity”) peak. – 1991 or thereabouts. This corresponds to the RSS satellite global temperature peak at about 2003-5 – about a 12 year +/- lag.
The climate peak will lag the driver peak by various amounts ( 20 +/- 8 years ) in different geographical regions according to the climate metric used.
Why you think that there should be no connection between commensurable periodicities is beyond me .
Don’t join the establishment climate community whose ability to ignore the perfectly obvious is really astounding. I’m a great believer in Ockham.
These orbital periodicities tell the solar physicists where they can best focus their studies to elucidate the processes involved.
It is not necessary to understand the processes in order to make useful predictions. The Babylonians could predict eclipses without knowing Kepler’s or Newton’s laws.
The 60 year cycle is three times the Saturn Jupiter beat frequency (19.859) The 960 periodicity is 60 x 16 which is also close to 3 x the Uranus Saturn Jupiter lap (317.74) = 953.2
That these periodicities show up in the temperature records is unlikely to be merely coincidental.
Dr. Norman Page,
I will look at the source but I am skeptical.
“Why you think that there should be no connection between commensurable periodicities is beyond me … The 60 year cycle is three times the Saturn Jupiter beat frequency (19.859) The 960 periodicity is 60 x 16 which is also close to 3 x the Uranus Saturn Jupiter lap (317.74) = 953.2” Really? And that is supposed to affect climate on earth? I doubt it, since I am a great believer in physics.
Compare enough data sets, massaged in enough ways, to each other and you will find all sorts of coincidences. But without a physical link, coincidence is likely to be all they are.
M Check Fairbridge and Sanders The Suns orbit AD 750 – 2050…….. Chapter 26 p 446 in Climate – History Periodicity and Predictability Rampino et al eds Van Nostrand 1987. -see esp pp 452 -453.
Leave the minor orbital periodicity til the annual biggie is accounted for . Given that our aphelion % perihelion ratio is about 1.034; its square root about 1.017 , we should see , or in any case must account for , an approximately 4.7c annual variation in equilibrium temperature . That’s confounded with the North/South hemispheric difference , but should amount to more than a 0.64K perturbation .
My background is that of an APL programmer living in languages in which the definition of the “dot” product , the central computation , for example , in calculating energy flows between spectra is simply
dot : +/ * .. But that 4 token definition will not just compute the dot product of 2 spectra , it will do it for millions of pairs — which might be spectra for points in a 3 dimensional lattice over the sphere .Thus I see it as quite feasible to construct a planetary model in a few pages of equally succinct APL definitions just as nuanced as any million line FORTRAN program . But probably faster and certainly more understandable to anyone capable of understanding a physics textbook . To a large extent it doesn’t matter whether the code for a climate model is open if it takes poring thru file upon file of legacy code to get a glimmer of what it’s doing .
Wow, what a bunch of horse ….. Whats is more naive a model that uses linear math and does a reasonable job of prediction, or the alternative?
Schmidt and Sherwood reads:
We stress that adequacy or utility of climate models is best assessed via their skill against more naïve predictions.
My educated prediction model says; “We do not know. (Yet.)” It is perfect in predicting so far. Why is the ‘nul’ result so unacceptable?
run your linear model back to the LIA. run it back 1 million years.
run it out 10000 years.
linear model is non physical.
Not so, and that is a poorly defined test. Linear models typically arise as first order Taylor series expansions of more complicated functions. They typically have limited range for accuracy, but are essential for a wide range of applications.
But, that is missing the point entirely, anyway. If you think a linear approximation is bad, isn’t a more complicated expression, which requires vast resources to obtain yet performs no better, actually worse?
Try it with CAM5.1. Is it physical? Yes, but it is wrong. They use a dry water.
What a dopey remark. Is the purpose of a model to guide policy makers in the coming decades or is to inform policy makers of what will happen 10000 or 1 million years from now?
Considering life as we know lives in quite a narrow temp. band (compared to conditions in the rest of the U) you could run a linear trend back a couple billion with some success. 😉
They should have titled this, A Practical Joke of Climate Modeling,
Ha ha what excrement from “Nobel” Winners.
What caught my eye? All those angels dancing on the head of a pin.
It’s becoming apparent that Warmunists artificially overweight Arctic warming (just 6% of Earth’s total land area) in an effort to make CMIP5 models “work”—too bad Antarctic temps trends are being so uncooperative…..
It’s also becoming apparent that Arctic temps are closely correlated to 30-year AMO and PDO warm/cool cycles and, again, it’s too bad for the Warmunists that the PDO entered its 30-yr cool cycle in 2005 and the AMO’s current warm cycle is winding down, and will switch to a 30-yr cool cycle in the early 2020’s.
To complicate matters for the Warmunists, the sun is in its weakest solar cycle since 1906 with the next solar cycle (starting around 2020) expected by some astrophysicists to be the weakest since the Maunder Grand Solar Minimum ended in 1715…
Since various natural cycles are overwhelming CO2’s tiny forcing effect, it’s imperative for Warmunists to marginalized the importance of linear trends because their models and catastrophic predictions are now so wildly off the mark.
As the CAGW hypothesis crashes and burns, it’s funny watching the progression of their arguments: first they said “The Pause” wasn’t happening, then it was called “cherry picking” the data, and now they admit “The Pause” is real, but suddenly, linear trends have become completely irrelevant; how convenient….
SAMURAI,
lol, Antarctic temperature trends are being the most “cooperative” since The Hiatus got into full swing:
https://drive.google.com/file/d/0B1C2T0pQeiaSNDlDUTIxXzVsdlk
Remind me again what happens when warm stuff from one place mixes with cool stuff from somewhere else and vice versa?
Hey, don’t leave out ENSO!
https://drive.google.com/file/d/0B1C2T0pQeiaSbU9sdjVvYzlMb28
Though admittedly I left PDO out of that one. I suppose I should be happy that a Deniofascist at least comprehends that oceans do have the ability to cool things off from time to time.
Keep making our excuses for us and you might just get hired on.
The thing about 95% confidence intervals is that one expects predictions to fall outside the envelope 5% of the time. My second plot above shows actuals about 5 pixels away from tucking back inside the CMIP5 95% CI.
And we still are. Ocean heat content continues to accumulate unabated.
And it still is called cherry picking becuase that is exactly what it is. The last 20 years have at least two other precedents during the instrumental record:
https://drive.google.com/file/d/0B1C2T0pQeiaSbE1Rb2xobGlVdkU
No. Of limited use only, over short periods of time. Non-linear dynamics become too important to ignore over the long-term. None of this is a sea change in talking points, or any big news whatsoever to folk who understand the actual arguments.
Anthony
The term “Deniofascist” above deserves the same treatment you have meted out in the past for the use of the term “denier”.
Mr. Brandon Gates,
That is as ugly a term as I have seen used in this debate. Your comments until now have been thought provoking and often of value as without the other side of the debate being articulated, this becomes just an echo chamber. By using such language you reduce it to name calling and cast yourself as a purveyor of hate rather than science. I suggest you apologize and move on.
Brandon Gates: retract and apologize for the use of that term, or you’ll find your comments moderated.
“DenioFascists”…. Cute, Brandon, real cute.., but inaccurate.
In the spirit of the holiday season, I’d prefer to be called a LukeWarmoLibertarian…
BTW, contrary to conventional teachings, fascism is actually a leftist ideology, with: hindered private property rights, overwhelming state control via onerous tax codes, debilitating government rules, regulations, mandates and massive public works/military spending…. i.e the National Socialist Party–better known as the Nazi Party….
Regarding the “Inconvenient Truth” of Antarctic temp trends, I was referring to this rather embarrassing reality the Warmunists like to ignore:
ftp://ftp.ssmi.com/msu/graphics/tlt/plots/rss_ts_channel_tlt_southern%20polar_land_and_sea_v03_3.png
OHC trends are also below CAGW projections, so you’re really not helping “The Cause” by bringing it up. OHC for the top 2000 meters of oceans has only increased 0.09C since 1955 (Levitus et al 2012)….Oh, the humanity!!
I would also suggest not bring up ENSO to support “The Cause” as there were 6 El Niño events from 1983~98 (including the 97/98 Super El Niño) which accounts for a large portion of 1979~1998 warming spike. Since 1998, there has only been 2 El Niños plus the El Nada we’re currently in, which may well turn into an actual La Niña next year, which will put observed global temps outside the 95% confidence interval by the end of 2015….
Moreover, during 30-yr PDO cool cycles, El Ninos become weaker and less frequent, and La Niñas become colder and more frequent… Oh, my…
There is also a 100% direct correlation between PDO warm/cool cycles and global temps trends, i.e. during PDO warm cycles, global temp trends tend to increase and fall during PDO cool cycles– as we’re already seeing since the PDO entered its cool cycle in 2005.
CAGW has about 5 years of relevance, after which it will be snickered at and eye-rolled into oblivion..
Here B Gates manifests his preoccupation with junk science and shows frustration at the fact that no one here takes him seriously. Some people get hooked on junk food, some on junk science. Thus B. Gates.
Anthony, I apologize for my use of an offensive term and retract it. I would feel better about my retraction and apology if terms like “warmusnist” and “climastrologist” were met with the same level of warning to those who use it.
SAMURAI,
I like that, but as I appear to be on thin ice with the name calling I’ll stick with “climate contrarian” as a less loaded term when I feel the need for a convenient label.
Not the first time that particular comparision has been made in this forum.
A ten-degree latitude band does not cover the whole of Antarctica. 85S-60S is the coverage of the plot I provided to you, courtesy of UAH: http://vortex.nsstc.uah.edu/data/msu/t2lt/uahncdc_lt_5.6.txt
I suggest you don’t forget data covering 15 degrees of latitude, then bizarrely turn around and tell us “Warmunists” that we like to ignore inconvenient truths. That is a bit … what’s the word … ah: inconsistent.
If you say so. The key point being it doesn’t appear to be slowing down, which means absorbed energy isn’t leaving through the atmosphere. For some mysterious reason. It’s a puzzler.
Perchance you haven’t compared that to what the 0-100m layer has done? And you do realize sea water has 4x the heat capacity of air, do you not?
AMO explains a good portion of the runup from 1980-2000. I don’t bring these things up to support any cause but good science, which is interested in isolating and reporting as many known factors as possible. Very clearly not every wiggle, dip, or multi-decadal trend in surface temperatures are caused by GHGs.
It’s beginning to look like you ascribe all warming in the instrumental record to internal variability.
I consistently find the highest correlations between AMO and ENSO for multi-decadal and multi-annual variations respectively. That doesn’t mean PDO isn’t a player. I don’t have a precise comparison handy at the moment.
You’re behind the curve my new friend as (C)AGW/CC been snickered and eyerolled into oblivion in this forum for years. I do appreciate your thick skin, however. I’m glad to see someone here who is willing to take as good as they give, as I enjoy a spirited banter. Cheers and Happy Holidays.
davidmhoffer,
I agree.
I appreciate your recognition of the better aspects of most of my posting activity here. If I survive my gaffe, I will remember that at least some readers here recognize my attempts to stay on point. That fact alone reduces the angst I was feeling last night a great deal.
Just to be clear, I don’t hate anyone here or on the contrarian side of the debate. I read a lot of arguments from your side of the fence which I think are silly and nonsensical and am not shy about showing my derision for such, but that doesn’t qualify as hate in my book. Clearly I pushed it too far for your tastes, and as Mr. Watts agrees, I understand there’s a line not to be crossed, apologize for crossing it, and will endeavor to not push that button in the future.
Well I hunkered down and actually read the d*mn thing. OK, more than skimmed, but not quite “read”. Here are my quick notes:
1. This is a marketing document. Its clear purpose is to argue that climate models are “real science”.
2. This isn’t a science paper. It has no data, no tables, no charts, no comparison to observations, no quantifiable information what so ever.
3. The paper states that the models are wrong. Oh, not in so many words, but it goes to great lengths explaining how one of the big problems with the models is that any adjustment to make one part better, makes another part or parts worse. That is a certain sign that the model is wrong. Further, the inability to improve one part without making another part worse is a direct admission that they don’t know why the model is wrong (else they could avoid that).
4. Now the humdinger. I read this three times to see if it actually said what I thought it did on first read. I’m just going to quote it without further comment.
When comparing satellite records to simulations, it is often necessary to embed code to simulate what a satellite would directly measure according to the model… A similar situation holds for paleo-climate proxies
such as water isotopes
OK, I lied, I’m going to comment. Satellites don’t produce “records”. They produce observational data, as do proxies. So they are basically saying that not only are the models wrong, they require additional adjustments depending on which observational data they are being used for. One adjustment for satellites (which by their own admission must make other parts of the model worse) and a different adjustment for proxy data (which again, by their own admission must make other parts of the model worse).
This is a snow job in my opinion, its only purpose being to create a facade of credibility where none would otherwise exist. The failure of a paper of this nature to produce a single comparison to observational data says as much as one really needs to know.
Well noted. Straight to the heart of the issue..
Nick Stokes said
“Swedes taller than Greeks? Maybe. But no use checking one Swede and one Greek. Average 1000 heights of each and if there is a tallness signal there, you may be able to quantify it. Nothing new here.”
That will tell you the averages between the two groups but will tell you nothing about the height of and one random selected Greek against on randomly selected Swede, only what may be likely, not what is. The same is true 50 years out Greek could possible have caught up to the Swedes by then or there may be no Swedes or Greeks by then, you simple cannot model future events, the model will tell you nothing only what likely, not what will be.
I do not understand how intelligent people cannot understand this simple truth! It also begs the question why the human race at this point and time is wasting so much tax payer money of what if games, for that is all that models trying to predict the future are!
The real question is what does the average height of 2000 men (1000 Swedes and 1000 Greeks) actually tell you. Same withe the average temperature over the whole year – how can you use that to make any statement about climate. For instance, a Mediterranean Climate is characterized by hot dry summers and warm wet winters. A single temperature for the whole year will tell you nothing. Same with Antarctica. A single temperature will not tell you that you have a bi-modal distribution of temperatures, one for summer and one for winter.
In Statistics there is a concept of a sufficient statistic. It tells you when a single statistic gives you the same information as the individual values.
A multi model mean from 1880 !? The first computer, Eniac, wasn’t turned on until 1947 and the first climate model was in the 60’s. Anyone can hindcast by curve fitting.
So sorry, but ‘no’.
Check “Konrad Zuse”, e.g. here: http://en.wikipedia.org/wiki/Konrad_Zuse
Oh these FOOLS! Perpetuating the MYTH that “global” land or sea temperature records have ANY validity, prior to WWII or prior to Nibus I, or 1982 or the like.
Complete nonsense. These “averages” and numbers are complete HOGWASH and any decent ENGINEER can go through the history of the measurements, the stations, the stupidity of “average temperatures” and make MINCEMEAT of it.
Of course decent engineers are oft times in the food line, or retiring to get out of the rat race. While the boys with the grants keep spewing GARBAGE and no one has the courage to call them on it. BOB those charts are worthless. Those alledged “global temps” have no meaning.
Aside from the “hoist on the petard” if they DID! WHAT WOULD THAT HOIST ON THEIR OWN PETARD BE???
I’ll let the active mind figure that one out.
“Lottery managers make very sure that there is no signal there”, Nick Stokes at 4:36. Are you implying the lotteries are manipulated? Just like the UN is manipulating info? Tell me it isn’t so.
The linear term “explains” the lion’s share of the little variance seen over the industrial age : http://cosy.com/Science/CO2vTkelvin.jpg .
To paraphrase Howard Hayden : If it were science , there would be 1 model instead of N .
What the hell does skill mean anyway ? Reduced unexplained variance ?
“Climate Science” seems to come up with terms I’ve never seen in any other quantitative field . I have yet to see a definition of a “forcing” in any fundamental physical terms . It seems to be some sort of derivative guesstimated from data , not defined in terms of spectra or other observables .
“Climate Science” seems to come up with terms I’ve never seen in any other quantitative field .
= = = = = = = = =
A strong iceberg forcing made the Titanic downwell to the bottom of the sea–like a photon falling down a well in the sky.
You probably thought it sunk! ☺
That must be what they mean by a ‘tipping’ point. 😉
🙂 I guess the iceberg had more skill than Captain Smith .
I think the concept “mean of the models” is rather meaningless.
The fact is that there exist many models; some of them perform badly, and some of them perform better when compared to reality. The way to deal with that is to reject the bad model and use the good ones.
We can learn something from analyzing both the bad models and the good models and then try to improve the good ones further.
The means of a heap of different models does not teach us much.
/Jan
In investment, there is the same concept – a fund of funds – a mutual fund where the portfolio manager constructs a portfolio from other mutual funds. The idea is that a fund of funds is less volatile than the individual funds. However, if each fund under-performs relative to the S&P 500, the fund of funds also under performs.
The fundamental error in the mean of models is the assumption that what you are looking at is signal plus noise and that the noise is drawn from a distribution that has a zero mean. There is no a priori reason why the noise in the different processes should even come from identical distributions or that the noise in a single process should even come from a single distribution, let alone that all these distributions should have a zero mean or the sum of the means should be zero.
“Once put together, a climate model typically has a handful of loosely-constrained parameters that can in practice be used to calibrate a few key emergent properties of the resulting simulations.”
Gavin Schmidt/ Steven Sherwood
It’s laughable that the Chief Scientist of the UK Met Office can say about their computer models:
“So they are not in a sense tuned to give the right answer, what they are representing is how weather, winds blow, rain forms and so forth, absolutely freely based on the fundamental laws of physics.”
The parameterisations are essentially simple empirical formulas trying to characterise aspects that are not understood well enough to model properly. So claiming that models incorporating parameterisations are ‘based on the laws of physics’ is being economical with the truth.
Tuning a model based on partial understanding can improve its ability to reproduce past history but without necessarily any benefit to its accuracy as a model of the physics of the situation. My spreadsheet table can reproduce past history with complete accuracy but its ability to predict future data is zero.
Big trouble in a perfect “modeled”
world.
trafamadore
December 29, 2014 at 3:04 pm
My second comment, is: using GISTEMP Global at Wood for Trees, linear trends from 1970-2000, 1980-2000, 1970-2010, and 1980-2010 hit the middle of the temperature bracket from the last 3 months.
Interesting. What happened to the great pause?
= = = = = = = = = =
You sound just like Leif Savalgaard, celebrating the restoration of “global warming” on the basis of one maladjusted data set:
http://wattsupwiththat.com/2014/11/14/claim-warmest-oceans-ever-recorded/#comment-1788597
The kind of questions you would be asking as a skeptic are…
“What happened to Snowfalls Are Just A Thing of The Past?”
or
“Why have predictions of milder winters been replaced with predictions of colder winters?”
or
“Why, in an allegedly warming world, is Antarctic ice at record extent?”
or
“Why, in an allegedly warming world, is snowfall in the northern hemisphere breaking new records”?
or
“Why, given the claims of “Hottest Year Evah,” did ice on the Great Lakes break records for extent and duration”?
or
“Why did Niagara falls freeze during the warmest year on the continuously revised GIS books?”
or
“Why does the Ministry of Climate Truth continuously adjust the records of the past?”
But since you are evidently a true believer, you will just have to accept whatever garbage the authorities serve up today. It will be a different today that you have to contend with tomorrow, so don’t forget to update your beliefs on a regular basis:
http://wattsupwiththat.com/2014/06/29/noaas-temperature-control-knob-for-the-past-the-present-and-maybe-the-future-july-1936-now-hottest-month-again/
That’s what Schmidt and Sherwood said:
>>We stress that adequacy or utility of climate models is best assessed via their skill against more naïve predictions.<<
Common sense stresses that adequacy or utility of climate models is best assessed via comparison with reality.
+10
The recent release of CO2 data from the satellite must have come as a rude shock.
Are they running their business from the ER, from underneath the oxygen tent, now?
So, how many of the climate “models” predicted the ‘pause’?
Oh, that’s right, NONE OF THEM.
And how many of these climate models have successfully “back predicted” the climate from , say, 1400 to 1800 in just , say, Europe?
Oh, that’s right, NONE OF THEM.
Well then , that being the case, why don’t we just take the average of these WRONG climate models, and presto!!!! we arrive at the correct results!
If a physical model is wrong, there is no statistical massaging one can employ that will tease out the “correct” result.
As I have maintained and will continue to maintain unless PROVEN wrong the climate system has a tremendous amount of noise in it, it is non linear and subject to thresholds. These factors make it next to impossible to get a strong correlation with factors that influence the climate despite the fact that they do
influence the climate.
This is why thus far not one climate forecast for future conditions has been correct on a consistent basis. I take that back not even one seasonal forecast in advance for climate conditions has been correct on a consistent basis much less the climate.
What I have come across in this field are people that try to justify what they say and using any means to show they are right while everyone else is wrong. The truth is they are also wrong and have yet to show otherwise. It is getting old and most of the material is the same arguments with just a different spin.
My argument is if solar parameters reach extreme enough values and stay at those values for a sufficient amount of time they will over come the noise in the climate system and exert an influence on the climate in general terms.
I am also of the opinion that given solar changes will never result in the same climatic out come due to the beginning initial state of the earth in regards to present climate, land /ocean arrangements ,random terrestrial or extra terrestrial events and so on. The best that can be done is to forecast a general climatic trend.
This is why when I hear the climate will do this or that because of this or that to a point of exactness I just shake my head. Another annoying point is so many try to relate the climate to one particular item which will rule the vast climatic system which is ridiculous with the exception of the sun. Which we know that if it is variable enough it will exert an influence on the climate, The argument here however is, is it variable enough. I SAY YES.
In conclusion I think this field is in a state of complete disarray and needs to be approached in an entirely different manner. A more humble approach for lack of a better word.
About 15 years ago Munk argued that global sea level data over-stated rising sea level because the gauges happened to be located where response to warming oceans was largest. In other words, this global data set unwittingly contained a systematic bias. This led me to speculate in a book I was writing that many global data sets, despite their size and care in preparation, may contain unknown biases. I had in mind the uneven distribution of surface recording stations and what effect it might have on surface temperatures.
Now, in this paper we get a hint that the bias in climate model predictions is a “bandwagon” effect, the same one Fischoff showed to be present in many series of measurements of universal constants. The bandwagon is a serious systematic bias in that it prevents truly independent thinking. If anyone has failed to notice, a powerful bandwagon drives climate science. So in the presence of a powerful enough bandwagon effect, is a “97% consensus” on any topic unexpected? If a bandwagon effect produces a bias in climate models, might it not also produce a bias in surface temperature compilations, through subjective decisions about which data to include, and which corrections to apply?
About 15 years ago Munk wrote in Science Magazine that global sea level rise, as measured with hydrographs, appeared an over-estimate because hydrographs happened to be located where temperature would most affect sea level. I was writing a book at the time and this prompted me to speculate that other global data sets may contain unrecognized biases. I was thinking specifically of the hodge-podge of data that goes into estimating surface temperatures.
In this paper we see the possibility of a bias in climate modeling which is none other than the “bandwagon effect” that Fischoff identified at work in series of precision measurements of physical constants. The bandwagon is a serious bias in science because it prevents truly independent thinking. In the presence of a powerful bandwagon effect is a “97% consensus” unexpected? More to the point, if a bandwagon effect influences modeling, should we not also think a similar effect influences the collection and processing of surface temperature records, or any other data offered as proof of catastrophic warming?
When you think about it,people tend not to live in places where it is undesirable to live. The “undesirability is usually some aspect of weather”. So, collecting temperatures at places where people live creates a strong geographic oversampling.
I agree, it may be time to get rid of the current climate modeling efforts as being unproductive. A wholesale cleanout of those that cannot be open and honest, those that obscure rather then enlighten, those that hide behind semantics and ignore reality. Climate science is currently a “self-licking” ice cream cone.
Climate science is currently administered by humans. As long as that be the case I don’t see a lot of overall change. When change occurs it will not be because of a moral overhaul of the system. It will be because someone was right and their model has predictive power. Real science trumps all. Climate science is in such rough shape simply because we don’t understand the climate, so anything goes. Any field with such a lack of fundamental understanding and over the top funding is going to be in similar shape.
Thanks, Bob.
My attention was also caught by:
“One plausible explanation suggests this bias originates in the desirable goal to more accurately capture the most spectacular observed manifestation of recent warming, namely the ongoing Arctic amplification of warming and accompanying collapse in Arctic sea ice.”
The “ongoing Arctic amplification of warming” is theory, at best.
The “accompanying collapse in Arctic sea ice” is science-fiction, at its worst.
Re Figure 1. You don’t need to look at the differences, just calculate the R^2 = goodness of fit. Against Hadcrut4.3 with the simplest of regressions (lineair on 1861-2013, annual)
R^2(line) = 0.6904
R^2(CMIP5) = 0.835
R^2(perfect) = 1
Sorry to spoil your conclusion – it’s wrong. The projection is clearly better. The log(co2) is also pretty good, it has an R^2 of 0.7917.
The authors: “Here we suggest the possibility that a selection bias based upon warming rate is emerging in the enterprise of large-scale climate change simulation. Instead of involving a choice of whether to keep or discard an observation based upon a prior expectation, we hypothesize that this selection bias involves the ‘survival’ of climate models from generation to generation, based upon their warming rate.”
However ANY research chooses to “keep or discard” “an observation” “based upon” any reason whatsoever other than that each data point EXISTS through observation/measurement – this is simply preposterous. They are now arguing with themselves over how best to cherry pick the observations – which to include and which to exclude.
I am sorry, but if the use ANY expectations to pre-judge the INDIVIDUAL data points with the intention of selecting some IN and some OUT – holy mother of god and they call themselves objective scientists…
WTFF? “We will only let in the data that, one way or another is within what WE expect to see.” Nothing but cherry picking and trying to justify one cherry picking filter versus another.
The single observations ARE the observations. They must become the data values. Excluding some is not science but office politics… They wouldn’t want to actually let in any values that make them appear to not be part of the team, or that might weaken the message.
Why are model results reported as temperature anomalies and not absolute temperature? How would the comparison change if absolute temperatures were used?
Seems like many of the important thermodynamic parameters cannot be accurately represented by anomalies – vapor pressure of water, for example.
I just read the article here. I did not go read the original paper.
What caught MY eye was this sentence quoted from the original paper:
“One plausible explanation suggests this bias originates in the desirable goal to more accurately capture the most spectacular observed manifestation of recent warming, namely the ongoing Arctic amplification of warming and accompanying collapse in Arctic sea ice.”
Hmmmm…..
‘desirable goal to capture the most spectacular manifestation of recent warming’ ….
To me, they are saying ….. ‘in other words, misuse the science to advance the political agenda, and get more grant money from the political masters who are working to impose world-wide taxes and regulations, ultimately leading to one-world government.’
Follow the Money.
It’s not about Science. Never was.
Corrupted science is only a fig-leaf to impose more taxes and more control.
Any thoughts?
Of course the cult needs $ to flourish as it has. Arctic sea ice decline looks like it could be over. Since2007, season end ice extent has been fluctuating, and now has increased considerably since 2012.The cultists are running out of alarms. Note the use of the pejorative term”collapse” to refer to sea ice melt.This is climate science in a nutshell.
My New Years Prediction. AGW will be obsolete before this decade ends.
I will go so far to say year 2015 will be the start of a definitive lower trend in global temperatures in contrast to the pause that has taken place for some 18 years.
This will be tied to weak solar conditions which should come into play during year 2015 following 10 years of sub-solar activity which started in earnest in late 2005.
You don’t get it, do you?
It makes no difference at all what global temperatures will be because it will all be blamed on human activity.
Climate-Gate definitively demonstrated that there is simply no doubt that the entire AGW thesis is and has always been a political movement. Further, there have been ample instances of scientists skeptical of the AGW thesis that have been personally attacked, vilified and ostracized . Also, read up on the comments of Patrick Moore, one of the founders of Green Peace.
Many of the articles on WUWT point out how data has been massaged, omitted or otherwise “tampered” with and how the models are designed to produce or show warming; and how temperature measuring devices are “strategically” located so as to record elevated temperatures relative to its surroundings.
This cannot be an accident.
It is intentional and purposeful.
But when vast sums of money are tossed at , let’s face it, crooked and dishonest “scientists,” by those with political agendas who also finance politicians (via campaign contributions) and backed up by the media, a tidal wave is generated that will be very difficult to overcome.
Massive ice sheets can begin descending from the Arctic and rest assured, it will be blamed on excessive human generation of carbon.
First it was global warming, now it is climate change. Next it will be ????
I believe I have a reasonably good handle on the concept of noise in measurements, and at least a simple minded insight as to how some of that noise can sometimes be cancelled out by summing related signals, but the definition of noise in the output of a calculation process (other than as rounding errors in intermediate calculations, where the products, dividends, etc. exceed the number of digits available in the variables) is somewhat hazy in my mind. Is the “random noise” in the climate models, to be cancelled out by averaging model runs, the variance of each model’s projection from physical reality?
Those of us who are competent scientists are forced by relativity theory to admit that this “signal” (the “anthropogenic signal”) does not exist!