“…startling data omission that he told me: “eclipses even the so-called climategate event.””
Willis Eschenbach tips me to a story by Marita Noon, titled:
What if Obama’s climate change policies are based on pHraud?
I’ve reproduced portions of it here, with a link to the full article. The graph with ALL the data is compelling.
“Ocean acidification” (OA) is receiving growing attention. While someone who doesn’t follow climate change science might think OA is a stomach condition resulting from eating bad seafood, OA is claimed to be a phenomenon that will destroy ocean life—all due to mankind’s use of fossil fuels. It is a foundational theory upon which the global warming/climate change narrative is built.
The science and engineering website Quest, recently posted: “Since the Industrial Revolution in the late 1700s, we have been mining and burning coal, oil and natural gas for energy and transportation. These processes release carbon dioxide (CO2) into the atmosphere. It is well established that the rising level of CO2 in our atmosphere is a major cause of global warming. However, the increase in CO2 is also causing changes to the chemistry of the ocean. The ocean absorbs some of the excess atmospheric CO2, which causes what scientists call ocean acidification. And ocean acidification could have major impacts on marine life.”
Within the Quest text is a link to a chart by Dr. Richard A. Feely, who is a senior scientist with the Pacific Marine Environmental Laboratory (PMEL)—which is part of the National Oceanic and Atmospheric Administration (NOAA). Feely’s climate-crisis views are widely used to support the narrative.

Feely’s four-page report: Carbon Dioxide and Our Ocean Legacy, offered on the NOAA website, contains a similar chart. This chart, titled “Historical & Projected pH & Dissolved Co2,” begins at 1850. Feely testified before Congress in 2010—using the same data that shows a decline in seawater pH (making it more acidic) that appears to coincide with increasing atmospheric carbon dioxide.
…
The December edition of the scientific journal Nature Climate Change features commentary titled: “Lessons learned from ocean acidification research.”
However, an inquisitive graduate student presented me with a very different “lesson” on OA research.
Mike Wallace is a hydrologist with nearly 30 years’ experience, who is now working on his Ph.D. in nanogeosciences at the University of New Mexico. In the course of his studies, he uncovered a startling data omission that he told me: “eclipses even the so-called climategate event.” Feely’s work is based on computer models that don’t line up with real-world data—which Feely acknowledged in email communications with Wallace (which I have read). And, as Wallace determined, there is real world data. Feely, and his coauthor Dr. Christopher L. Sabine, PMEL Director, omitted 80 years of data, which incorporate more than 2 million records of ocean pH levels.
Feely’s chart, first mentioned, begins in 1988—which is surprising as instrumental ocean pH data has been measured for more than 100 years since the invention of the glass electrode pH (GEPH) meter. As a hydrologist, Wallace was aware of GEPH’s history and found it odd that the Feely/Sabine work omitted it. He went to the source. The NOAA paper with the chart beginning in 1850 lists Dave Bard, with Pew Charitable Trust, as the contact.
Wallace sent Bard an email: “I’m looking in fact for the source references for the red curve in their plot which was labeled ‘Historical & Projected pH & Dissolved Co2.’ This plot is at the top of the second page. It covers the period of my interest.” Bard responded and suggested that Wallace communicate with Feely and Sabine—which he did over a period of several months. Wallace asked again for the “time series data (NOT MODELING) of ocean pH for 20th century.” Sabine responded by saying that it was inappropriate for Wallace to question their “motives or quality of our science,” adding that if he continued in this manner, “you will not last long in your career.” He then included a few links to websites that Wallace, after spending hours reviewing them, called “blind alleys.” Sabine concludes the email with: “I hope you will refrain from contacting me again.” But communications did continue for several more exchanges.
In an effort to obtain access to the records Feely/Sabine didn’t want to provide, Wallace filed a Freedom of Information Act (FOIA) request.
In a May 25, 2013 email, Wallace offers some statements, which he asks Feely/Sabine to confirm:
“…it is possible that Dr. Sabine WAS partially responsive to my request. That could only be possible however, if only data from 1989 and later was used to develop the 20th century portion of the subject curve.”
“…it’s possible that Dr. Feely also WAS partially responsive to my request. Yet again, this could not be possible unless the measurement data used to define 20th century ocean pH for their curve, came exclusively from 1989 and later (thereby omitting 80 previous years of ocean pH 20th century measurement data, which is the very data I’m hoping to find).”
Sabine writes: “Your statements in italics are essentially correct.” He adds: “The rest of the curve you are trying to reproduce is from a modeling study that Dr. Feely has already provided and referenced in the publication.”
In his last email exchange, Wallace offers to close out the FOIA because the email string “clarified that your subject paper (and especially the ‘History’ segment of the associated time series pH curve) did not rely upon either data or other contemporary representations for global ocean pH over the period of time between the first decade of 1900 (when the pH metric was first devised, and ocean pH values likely were first instrumentally measured and recorded) through and up to just before 1988.” Wallace received no reply, but the FOIA was closed in July 2013 with a “no document found” response.
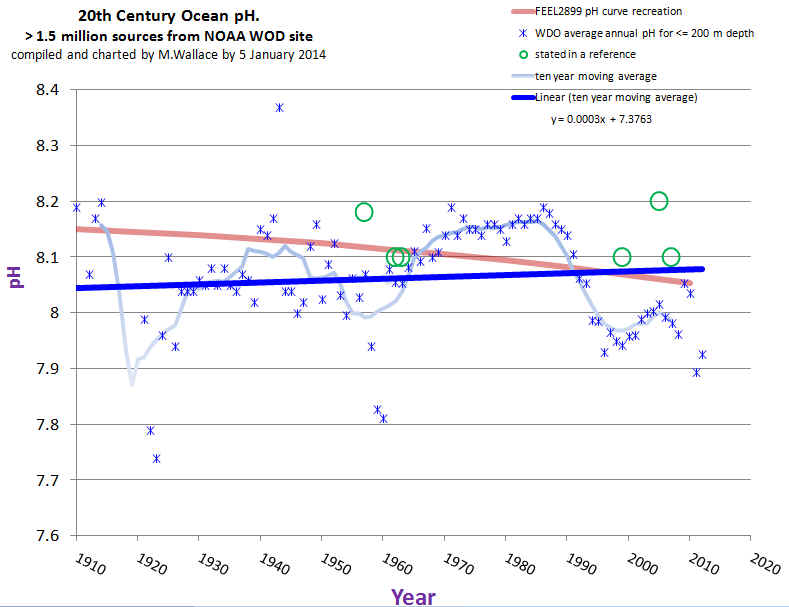
Interestingly, in this same general timeframe, NOAA reissued its World Ocean Database. Wallace was then able to extract the instrumental records he sought and turned the GEPH data into a meaningful time series chart, which reveals that the oceans are not acidifying. (For another day, Wallace found that the levels coincide with the Pacific Decadal Oscillation.) As Wallace emphasized: “there is no global acidification trend.”

Regarding the chart in question, Wallace concludes: “Ocean acidification may seem like a minor issue to some, but besides being wrong, it is a crucial leg to the entire narrative of ‘human-influenced climate change.’ By urging our leaders in science and policy to finally disclose and correct these omissions, you will be helping to bring honesty, transparency, and accountability back where it is most sorely needed.”
“In whose professional world,” Wallace asks, “is it acceptable to omit the majority of the data and also to not disclose the omission to any other soul or Congressional body?”
Full story here: http://www.cfact.org/2014/12/22/what-if-obamas-climate-change-policies-are-based-on-phraud/
There’s a petition: http://www.ipetitions.com/petition/restore-the-worlds-ocean-ph-measurements
I had long wondered why previous geological instances of much higher atmospheric CO2 concentrations had not extinguished all sea life, as the present AGW meme would suggest should happen.
Ding!
They treat the oceans as if they were a beaker in a laboratory with their “modeled” pH change. There is essentially a limitless amount of salts to resist pH change from a minor increase in dissolved CO2. Now there is evidence that the claim is entirely fraudulent and I’m not surprised.
Those of you who have not read the original article might find it interesting that Feely was awarded $100,000 from the Heinz Foundation (Founded by John Kerry’s wife) for the research in question. Things that make you go hmmm.
For more graphs and gridded confirmation see:
ferdberple January 2, 2015 at 8:44 am (near end)
Because it was the wrong type of CO2, obviously…
Pointing out the obvious here, only man made CO2 emissions will cause unspeakable climate rapture sometime in the near, never approaching future …
Well yes now there is good CO2 and bad CO2. Climate science has gone biblical.
There are differences of course and the increase in one over the other as measured is a keystone of the AGW issue. Although there is now some doubt as to the original basis for this claim.
Because it’s Rotten CO2, just like there’s Rotten Snow.
Because CO2-god, him not plenty-plenty angry.
Like cholesterol, there is good CO2 and bad CO2?
Ball Bounces – apparently: C14/O16; C14/O18; C15/O16;C15O18 …. 15 isotopes of C, three main isotopes of O, variations in fractionation, plant type preferences, more O18 at the equator, less at the poles …
The more we know, the more we know we don’t know.
There is natural CO2 which is optical left turning and anthropogene CO2 optical right turning, hahahaha
Actually, there is no bad cholesterol.
See “the oiling of america” on utube
It’s mind blowing
Actually, there is no bad cholesterol.
See “the oiling of america” on utube.
It’s mind blowing
How can these farauds live with themselves? Astounding revelation.
Man, I hate typing on an iPad!
Counting the grant cheque dollars keeps their minds of it.
@ pesadia
Wow, thanks. 49 minutes in and the Cholesterol Consensus Conference sounds a lot like the Climate Consensus Crap.
Well Admad, maybe study some basic chemistry — for instance fluid temp vs dissolved gas equilibrium with gas above? Perhaps the far higher Devonian CO2 content of air without far lower ocean pH can be explained by study, of water temperature? Whddya think, Admad?
;]
By now I guess that everyone knows that there was no phraud, just a misinterpretation of the data. This is all clarified on Skeptical Science. This is why real scientists look at peer reviewed studies, not work by graduate students that is unreviewed and also outside of the student’s field of expertise. Did someone already point out that the original publication and testimony is still correct? I did not go through the 400+ comments.
“In whose professional world,” Wallace asks, “is it acceptable to omit the majority of the data and also to not disclose the omission to any other soul or Congressional body?”
err?
pharma GMO and climate pseudo sciences for a start,I’m sure theres more.
Nutrition is hugely corrupt.
Polar bear science, as recently as last month (Southern Beaufort Sea population estimates, which simply left off two-three years of available date to generate an anomalously low population estimate and an exaggerated declining trend – discussed here http://polarbearscience.com/2014/12/17/recent-s-beaufort-polar-bear-count-was-a-cherry-picked-result-new-evidence/ )
and here:
http://wattsupwiththat.com/2014/11/18/study-beaufort-sea-polar-bears-largely-recovered-from-a-2004-2006-decline/
Thanks, Dr. Susan. and Merry Christmas
Yes, John – the link I provided is an update to that WUWT story. It shows that the study was not just terminated prematurely, as first appeared to be the case, but rather, the authors left out the data for 2011 and 2012 which was available to them. Mark-recapture data collection continued until 2013 in the Southern Beaufort – they reported data up to 2010 only. That makes it relevant to this “acidification” story.
And Merry Christmas to you all.
Susan
I really enjoyed and was saddened by your recent post:
http://polarbearscience.com/2014/12/18/polar-bear-biologists-miss-the-mark-in-new-study-on-invasive-mark-recapture-effects/
Sad photo but unsurprising result, frequently seen in collared animals. One of those unmentioned side effects. Some studies actually document mortality caused by collaring (wolf studies in particular). Of course that would not look good in Polar Bear studies.
Which prompts me to ask how this picture even was released and by whom?
Keep up the good work.
Have a Merry Christmas and all the best for 2015.
“Wallace was then able to extract the instrumental records he sought and turned the GEPH data into a meaningful time series chart, which reveals that the oceans are not acidifying.”
There must be something wrong with that data. Otherwise, it is not just omission, but deliberate misrepresentation’ proclaiming the opposite of what the data shows.
Better adjust the data as soon as possible.
And you guys haven’t yet gotten around to our cosmologists who have built numerous bunny trails (dark matter, dark energy, dark flow, etc. etc.) all baseless, in their attempt to keep their “big bang” alive. They refuse to acknowledge the electric universe. Redshift measurements across our universe donot imply the same as from the local cop’s radar detector. (Some of those far out galaxies are now moving faster than the speed of light. Any real scientists would consider that sufficient to begin re-examining the basic premises.)
Bwahahaha.
There are three kinds of lies: lies, damn lies and climate science
What would these people do without their games (ops sorry models)
At least they didn’t “adjust” the data.. hehe
I don’t know if anyone else caught it, but a certain blogger-dude who goes by the “anonymous-coward” (a term once applied to me by one of ATTP’s regular denizens (but on another blog, I note)) pseudonym, “ATTP” (aka “wotts”, aka “Anders”, aka “Mr Wishy-Washy, Passive-Agressive, Milquetoast, Milk-sop, Hamlet-Wannabe, To-Blog-Or-Not-To-Blog?-That-Is-The-Question, Oh-Please-Do-Keep-On-Blogging-Anders-Cuz-We-All-Just-Luv-U-and-Need-U!, Pardonnez-Moi-While-I-BARF!!!, A-Worse-Fusspot-Than-HotWhopper Mouth-Off”), has “dissed” this blog (see ATTP’s “AWOL” post) by calling WUWT “an anti-science, hate site”! . CAN YOU BELIEVE IT?!!!
Well, in the interest of “building bridges” , I would like to reach out to “Anders” (or “wotts” or “ATTP” or “MWWPAMMHWTBONTBTISQOPDKOBACWAJLUANUPMWIBAWFPTHMO” or whatever that needy, little drama-green has taken to calling himself, lately) with a settled-science, huggle-buggles, luvie-duvie comment, of my own (on-topic, I might add):.
Great post, above, but what does anyone expect (though it’s always fun catching the hive out doing violence to the norms (sentimental, bourgeois, defeatist-wrecker, class-enemy “norms”, to be sure) of the scientific method, if that’s, indeed, what we have here)? I mean, like, attempting to question the work of a “climate scientist” (a de-oxy oxymoron) is the equivalent of questioning the aeronautical engineering theories of some cargo-cult shaman makin’ a scare-booger cowrie-shell or two off the fortuitous flight-path of some DC-3. I mean, like, make any effort to inquire into the work of these tenured parasites and they will, of course, immediately understand that you’re potentially messin’ with their sell-out, Lysenkoist scams; hustles; rip-offs; flim-flam; “BIG LIES”; self-serving, brazen-hypocrite double-standards; “cull” immunities; and their dork-avenger (kids can be so cruel!), ivory-tower, snooty disdain for the contemptible, hoi-polloi philistines who think that goof-off, lazy-bum lefty-leeches should get their weenie-butts a real job, just like everyone else.
I mean, like, it’s all really just about these hive-bozo tools smoochin’ the “right rumps” and producing the “right answers”, which, in turn, scores them their slops-and-swill ration-cards–good for some one or another of the hive’s toady-grade, snout-ready troughs, generously provided by their careerist-hack, flunky-minder hive-betters. And that’s why they never reduce their own carbon foot-print by video-conferencing their obscene, CO2-spew, party-time eco-confabs–or to put it in other words, that’s why the ATTP creep-outs never SET THE INSPIRING PERSONAL EXAMPLE, THEMSELVES, AND NEVER EXERCISE LEADERSHIP FROM THE FRONT, WHEN IT COMES TO ZERO-TOLERANCE FOR CARBON-PIGGERY!!! AND THAT’S WHY THEY DON’T PRACTICE WHAT THEY PREACH!!!
I do hope ATTP gets a chance to read this comment (perhaps VV will re-produce it at his blog)–see, guy, this blog is not about “hate” at all. Rather, it’s really just all about callin’ out Gaia’s little-sneak agit-proppers and their fun-and-games B. S.
Could you condense all the horseshit. I have no idea what you were trying to say.
“I’m stoned”
” I’m” or is it “We’re” ??????????
I have entered the ranks of Ringo Starr and his ilk who got tired of having difficulty finding the door.
Mmmmm….didn’t they recently induct Ringo into the Hall of Fame?
tell us how you really feel.
well put.
Gobachev sings. Tractors! Turnips! Buttocks!
@eyesonu
Yr: “Could you condense all the horseshit…?”
Happy to oblige, eyesonu, ol’ buddy–“YO MOMMA!!!”
The oceans are buffered against ever becoming acidic.
CaCO3 (insoluble) + H2O + CO2 = Ca(HCO3)2 which is both soluble and alkaline.
The oceans below the surface layers are anyway always saturated with CO2. There is liquid CO2 lying in the deep ocean trenches. As Prof. Plimer so neatly expressed it: “The oceans can only become acidic if the earth runs out of rocks.”
Thanks. That explains why there is no acidification from acid rain in the ocean, but plenty of acidification in the Northern granite enclosed lakes.
Acid rain is the result of NO2, NO3, SO2 and SO3… as one learns in elementary chemistry … 🙂
Not quite, all rain has always been mildly acidic (pH 5.7-6.0) due to the presence of CO2 in the atmosphere.
Now, if Acid rain can have a ph of as low as 3.5, why is that not a source of ocean acidification?
There is no acidification problems from human activity in any freshwater lakes. thuis is more environmental pseudo science. Included in the acid rain scam was the forest dies offs which, again, time showed was nothing to do with industrial emissions. In actual fact, some studies even showed that the fertilization effect from the sulphur emissions was helping the forests. This is why we hear no more of the evil acid rain.
I do not know if our politicians are just gullible fools or whether they are just using these hysterical beat ups as deliberate excuses to increase their political power.
If my memory serves me right there was a significant trout dieoff in the Norwegian mountain lakes in the 60’s. It was caused by acid rain from England, Rhur and Saar. The same acid rain acted as a fertilizer for the lakes with limestone bottom. After scrubbers were installed, the problem went away. But- have you seen the brown cloud coming from China? It is not CO2 that makes it brown. China uses 45% of the world’s coal, much of it low grade lignite, and scrubbers cost money to operate so they are frequently down for “Maintenance’.
lenbilen
You provide an important warning from the past when you relate a popular but untrue myth saying
All rain is acidic and all rain contains sulphur without which all life on land would cease. The acidity of rain corrodes stones, notably limestone. And the acidity of rain can be increased by anthropogenic emissions (i.e. emissions from human activities) with resulting enhanced corrosion and harmful health effects near the emissions.
The Acid Rain scare in Europe was typical of ‘green’ scares in that it took some true facts and exaggerated those facts to create an untrue scare.
The Acid Rain scare said that emissions of the oxides of sulphur and nitrogen (SOx and NOx) from German and UK coal-fired power stations were enhancing the acidity of rain with resulting ‘waldsterben’ (i.e. forest death) of northern European forests. There was much activity to find “evidence” to support the scare, and changes to Scandinavian lakes were assumed to be such evidence.
This scare was promoted because France had adopted nuclear power for its electricity generation. Costs of German and UK electricity would increase if their coal-fired power stations had to remove SOx from flue gases by use of ‘scrubbers’ (i.e. flue gas desulphurisation; FGD). FGD adds ~20% to the capital cost and ~10% to the operating costs of a coal-fired power station. The increase to German and UK energy supplies would increase the economic competitiveness of France relative to its nearest economic competitors.
At the UK’s Coal Research Establishment (CRE) we conducted research on all matters pertaining to the Acid Rain scare, including trials of liming Scandinavian lakes to ‘correct’ their pH.
I observed that the spatial distribution of the acidity of rain over Northern Europe was not consistent with the scare.
SOx is very water soluble: indeed, ‘scrubbers’ wash SOx from flue gases by passing the gases through a water shower. And the highest concentrations of the emitted SOx were near to the power stations. So, severest effects of the enhanced acidity of rain should be near the power stations, but there were no such effects near the power stations. This was a puzzle.
The highest acidity of rain was measured to be over regions of the North Sea near to river estuaries. SOx and NOx from the German and UK power stations would need to cross regions of high rain acidity if the SOx and NOx were to reach Scandinavian forests said to be suffering ‘waldsterben’. This, too, was a puzzle.
I suggested that there was an alternative hypothesis to explain enhanced acidity of rain over Northern Europe. Phytoplankton emit DMS (dimethyl sulphide and related sulphur compounds) from the sea and this provides the sulphur required by living things on land. If the plankton had increased their activity then increased acidity of rain would result. And the plankton had increased their activity such that they were forming toxic algal blooms which were problematic at the time because they were washing up on North Sea shores. Also, I suggested the high acidity of rain near river estuaries could be an indication that the plankton were being fertilised by outputs from the rivers. Agriculture had increased use of fertilisers following WW2 and the plankton may be being fertilised by excess agricultural fertiliser running off the land and being transported to the North Sea by rivers.
Many investigations ensued and the suggestions turned out to be true.
This finding ended the Acid Rain scare. Agriculture was a major French industry and farmers had political clout in France so France stopped promoting the scare.
Subsequently, it was determined that there had been no ‘waldsterben’: on the contrary, forests in Northern Europe had grown throughout the period of the Acid Rain scare. Also, Scandinavian lakes had been affected by natural variability and by altered run-off from land resulting from changed forestry practices.
However, the Acid Rain scare had caused the European Union (EU) to create the Large Combustion Plant Directive (LCPD). The bureaucrats who operate the LCPD need to justify their jobs so they keep pointlessly tightening the SOx and NOx emission limits with a result that UK power stations are now being shut and this threatens UK power supplies.
I keep asserting that this is a warning from history. The global warming scare was killed in Copenhagen in December 2009 but – like the LCPD – effects of the scare are likely to be imposed by bureaucracies long after the scare is forgotten. Priority now needs to be constraint of the bureaucracies.
May the Peace of Christmas be with you and all those you love throughout Christmas.
Richard
Richardscourtney
Thanks for the essay on acid rain.
In this Christmas season you may enjoy my essay on the “sin of the world” and “the lie.”
Believe it or not it deals with phytoplankton
http://lenbilen.com/2014/12/22/on-the-sin-of-the-world-and-the-lie-what-does-that-mean/
Merry Christmas:
Liquid CO2 lying in the deep ocean trenches?
Really?
How do you know?
Exactly what I was going to ask. (-:
Maybe it’s not exactly lying about, but it’s there. It tends to stick to glass, as I recall.
http://www.sciencedaily.com/releases/2005/01/050104114942.htm
Liquid CO2 on the ocean floor, due to volcanic emissions. It’s a localized phenomenon, and is not due to any general saturation.
http://www.livescience.com/23387-mariana-trench.html
…last time I checked, CO2 does not exist in liquid form at deep ocean temperatures of 0 to 3 C….or any other temperature. The freezing temperature of pure carbon dioxide at one atmosphere of pressure is -78.5 C (-109.3 F), else it is a gas. 🙂 Cheers!
“…last time I checked, CO2 does not exist in liquid form at deep ocean temperatures of 0 to 3 C….or any other temperature.”
It most certainly does. At temperatures around 0-3 degrees Celsius, CO2 is a liquid at pressures above c 35 atmospheres (= 350 meter depth).
Highflight – it’s not liquified by temperature, but by pressure.
CO2 can be liquified at any temperature of 303K (30 deg C) or lower by applying enough pressure. At 31 deg the required pressure is about 74 Bar, which is roughly equivalent to a depth of 740 metres in seawater.
Explanation available here:
http://www1.chem.leeds.ac.uk//People/CMR/whatarescf.html
and a better labelled phase diagram here:
http://en.wikipedia.org/wiki/File:Carbon_dioxide_pressure-temperature_phase_diagram.svg
So, yes, CO2 can easily be liquid at the bottom of the ocean!
Liquid CO2 is denser than water, so it will head for the bottom, and since it’s a non-polar molecule it won’t mix with the seawater. So if you get enough of it together, it should indeed form puddles.
Joe, that is interesting about CO2. However, in the real world I am not to sure that there are any “pools” of CO2 that have been discovered. Soluble chemicals in solution tend to disperse evenly. Additionally, the oceans are well mixed due to tidal and Coriolis currents. The oceans at the poles absorb CO2 from the atmosphere where the water is cool enough for the CO2 to stay in solution, then the cool water returns the CO2 rising at the equatorial warmer waters where the CO2 is then released. Everybody know that. Cheers!
High flight
If you check around, you can find a video of blobs of liquid CO2; this taken from a deep submersible.
Oh Geez, I like that one: “The oceans can only become acidic if the earth runs out of rocks.”
Me, I take my rocks in the form of TUMS which reduces my stomach acidification after I gulp a CO2-laden Diet Coke (and a stomboli).
Prof. Plimer obviously didn’t understand the rates of change involved:
“The natural pH of the ocean is determined by a need to balance the deposition and burial of CaCO3 on the sea floor against the influx of Ca2+ and CO2−
3 into the ocean from dissolving rocks on land, called weathering. These processes stabilize the pH of the ocean, by a mechanism called CaCO3 compensation…The point of bringing it up again is to note that if the CO2 concentration of the atmosphere changes more slowly than this, as it always has throughout the Vostok record, the pH of the ocean will be relatively unaffected because CaCO3 compensation can keep up. The [present] fossil fuel acidification is much faster than natural changes, and so the acid spike will be more intense than the earth has seen in at least 800,000 years.”
http://en.wikipedia.org/wiki/Ocean_acidification
You forgot that its introduced as “A review by climate scientists at the RealClimate blog….”
How do you get an acid spike when there is literally an undetectable amount of carbonic acid in the oceans?
The equilibrium is such that there 1000 times more CO2 in pure water as carbonic acid (so about 0.3ppm if it weren’t neutralised straight away). The formation of the acid is very slow compared to the very rapid formation of hydrogen carbonate upon reaction with carbonate so there is no acid.
How can there be a spike?
‘The [present] fossil fuel acidification is much faster than natural changes, and so the acid spike will be more intense than the earth has seen in at least 800,000 years.”
Beyond the usual scary handwaving about ‘faster than natural’*, is there any evidence for this statement?
* – a pretty meaningless statement (aka ‘unprecedented’) trotted out when actual evidence is lacking.
Looks like one more reason not to believe everything you read in Wikipedia then, doesn’t it?
If Wallace is correct (and Sabine’s reaction that it was ‘inappropriate for Wallace to question their “motives or quality of our science,”’ — shades of Jones’s “Why should I give you my data … ” — gives rise at least to a prima facie case that he is), then Wiki is retailing rubbish, and not for the first time where climate is concerned.
The Climateers will, of course, do everything possible to keep their narrative on track. lying included should that prove necessary for “the cause”!
@barry
‘ The [present] fossil fuel acidification is much faster than natural changes, and so the acid spike will be more intense than the earth has seen in at least 800,000 years.”
The more I think about this the more ridiculous it is – but then, nobody at ‘Real Climate’ has ever been near an experimental science like chemistry for a long long time.
The rate of the reaction depends on the availability of both reagents – CaCO3 and CO2 (in the form of carbonic acid).
CaCO3 is abundantly in contact with seawater – chalk and limestone are the two major rocks composed of it – and they can be found in outcrops all over the world. For the purposes of the chemistry we can assume an infinite supply. The limiting factor has been the availability of CO2. More CO2 will cause more reaction. The chalk or limestone cliffs will dissolve a little more rapidly, but the overall pH of the seawater solution won’t change until all of the cliffs have gone.
This is not difficult to show experimentally with a piece of chalk and some acid.
Yet again the meme ‘faster than before’ or ‘unprecedented’ are shown to be scaremongering, not science. What a surprise (not).
Don’t give them any ideas. LOL
I can see it now, man made rock shortage will doom us all if we don’t stop whatever it is we are doing. And give trillions of dollars to third word countries through the U.N.
The I.P.R.S. — Intergovernmental Panel on Rock Shortage
Wow. I actually thought the oceans were acidifying a little.
This reminds me of when I asked the head of one of the world’s largest merchant fleets when he planned to start using the ice free NW passage.
He laughed and replied “I think I’ll leave that question for Al Gore to answer”
My point is, even what we think of as facts, often turn out to be insubstantial alarmist nonsense which has slipped below the radar of our skepticism.
“acidifying a little
terminology adjustment needed, perhaps
In my Chemistry course, acidifying meant reducing the PH of the solution – even if the solution remained alkaline at the end of that step.
My blueberries, respectfully, disagree.
Eric Worrall December 23, 2014 at 11:34 am
In my chem course, we used titration to determine the pH of a solution. Adding acid to an alkaline solution was called “neutralization”, and not ever “acidification”.
w.
I have been arguing this on forums for years. If you have a glass of water that is very salty, and you add a grain of sugar, you haven’t damn well sweetened it! It REALLY gets my goat.
Eric
i prefer “neutralising”
In my chemistry, we referred to it as neutralizing. Acid and bases have very different properties and neutralizing a base does not give it any more acidic properties than it had before.
pH 8 means about 100 times more caustic soda* than acid.
*Excuse the alarmist speak.
“Wow. I actually thought the oceans were acidifying a little.”
With data like that, how the heck could anyone tell? Maybe if we had five or ten centuries worth, a valid signal could be extracted.
“This reminds me of when I asked the head of one of the world’s largest merchant fleets when he planned to start using the ice free NW passage.”
Tangential, but I suspect that even if Arctic ice declines later in the century, the decision of running ships through the Arctic will be made by marine insurers, not shippers. And I expect they are going to want way less than 15% ice cover, reinforced hulls, and reduced speeds before they will offer acceptable rates.
As to your point, that remind me of something I saw on the History Channel (a few years ago) about the Bermuda Triangle. The hype presents it as a “dangerous area”. The fact I recalled is that Lloyds of London which insures much if not most ocean vessels does not charge a premium for sailing through the area. There is no increased risk. Only the impression of it.
I wonder if any of the American readers with professional qualifications would care to draw this to the attention of senator Inhofe so that he could hold another Senate enquiry into this sorrowful affair.
IMO our blog host is familiar with Sen. Inhofe.
I’m also certain that Sen. Inhofe is familiar with WUWT
There are very many with professional qualifications who are reading WUWT.
A few years back I, a very humble Australian, wrote to Senator Inhofe to thank him for his efforts to have the truth about the AGW scam publicised. He very generously and graciously wrote a lengthy and thought provoking reply. He is a real American hero and should be admired as such. You would be better off writing to some of those scientifically illiterate Democrats.
Lawrie Ayres,
Sen. Inhofe is a true gentleman; very different from the average senator. He knows his science, too. Other [liberal] senators do not dare to debate him on any science subject, including MMGW.
“Sen. Inhofe is a true gentleman;”
..
http://www.avweb.com/avwebflash/news/inhofe_senator_closed_runway_texas_faa_investigate_203537-1.html
…
And a very poor pilot
A “gentleman” would not vote against disaster relief for hurricane Sandy, and vote for disaster relief for Oklahoma tornado victims.
Sandy was not a hurricane when it made landfall, so voting against aid to fish is hardly comparable and your equivalency is proven false
Socks rats
You have a vertible arsenal of alarmist narrative and abuse. How many are there of you? How are you funded?
We need criminal negligence charges brought against these pHrauds. Is there any viable way to directly bring them directly to justice?
Sabine responded by saying that it was inappropriate for Wallace to question their “motives or quality of our science,” adding that if he continued in this manner, “you will not last long in your career.”
That is a rather big red flag they put up and right in line wuth Jones ‘why I should I send you the data you only want to find something wrong with”
Its amazing how mush this ‘settled ‘ science which reports to be the most important thing and where there is no time to lose , so easily resorts to apporachs which very much worked against theses claims given little trust is put in place of those that employ smoke and mirrors .
Right. Unless there are a few iterations in the dialog that are missing, that has mens rea written all over it.
Yes, that’s what I thought. If the pursuit of science is towards transparency and accuracy, then why the resistance from Sabine? That’s a moot question– we all know why he was so resistant: funding.
There is a certain President who claimed his administration would be “the most open and transparent” in history. We all know what that has gotten us. NOAA/NCDC and the rest of the CAGW cabal have learned at the foot of the master… or maybe he learned from them.
“you will not last long in your career.” This seems either a threat or a lament, or both! Either one speaks volumes of the still rancid climate research environment. Scientists the world over need hang their head in shame for allowing such an environment to exist. Silence is culpable. Culpable!
Respectfully, silence is an indictment….to fraud, misconduct, collusion, ignorance, and any other general act of deception designed to make a result.
Congratulations Mr Wallace on your development of a very nice litmus test for ocean acidification.
I see what you did there.
Mike –
Does that make Wallace’s work a litmus paper?
Just wonderin’.
If you are looking for a color change —
http://hydrangeashydrangeas.com/colorchange.html
+10
Feely of PMEL was also senior author on the Whiskey Creek oyster hatchery abomination, which constitutes ‘knew or should have known’ academic misconduct. See essay Shell Games in Blowing Smoke: essays on energy and climate. The oyster portion only was a guest post of the same title at Judith Curry’s. Not surprising he also violated FOI and hid the instrumental ocean pH record.
[Typos corrected. -w.]
10 bucks? :O
Dr. Dick Feely’s Oyster Crisis:
http://wattsupwiththat.com/2012/06/30/noaas-pacific-marine-environment-laboratory-carbon-program-goes-overboard-on-ocean-acidification/
Does anyone know if the oyster study also was funded by Heinz?
Why do a linear plot of the 10 year moving average? Why not just a linear plot of the annual values?
Frankly, the persistence of sub 8 pH values is eye catching. Is there meaning to this?
My impression is that Wallace lumped all known data together: measurements at very different (including coastal upwelling?) places during different seasons.
I would like to see the spread of the data within each year that was plotted. That will give some idea of the variability in measurements from instruments, place and seasonal variability over the years. I suspect that the spread is enormous compared to the 0.1 pH unit/century where we are looking for…
See my comment below, you can easily extract what you need and graph it.
The heavy dark blue straight line is incorrectly annotated in Wallace’s figure.
Probably a simple annotation error.
This dark blue line is clearly a linear curve fit to the entire data set since 1910.
It is also clear from the chart that the measured pH has been decreasing over the last 20+ years. (the light blue 10-year moving average).
It’s also somewhat clear that this is probably just measurement variability. If we had 1,000 years of data that issue would be oh so clear.
Ain’t it always the way?
I’d say that the heavy dark blue straight line is the linear trend of the ten-year moving average line. You’d have to ask the chart’s creator why they gave that linearization instead of the linear trend of the raw data…
Why use a linear trend as a function of time at all?
Maybe it has political meaning, but it is physical nonsense.
It has the meaning of a cartoon; entertainment disconnected from reality.
The chart’s creator is the author of this post
or, more correctly, the creator is Mr Wallace.
Since the chemistry of carbonate systems is well known, can anyone provide a physical explanation of why ocean pH would NOT be decreasing? Thanks.
Buffering. The White Cliffs of Dover are still there and still abutted by the ocean last time I looked.
Yes, that is using the well known chemistry of carbonate systems.
But it is more complicated than chemistry. There are biological systems that react to changes too.
Increased CO2 will aid photosynthesis by phytoplankton and so change ocean chemistry. Increased emissions of dimethylsulphate (DMS) caused by the beneficial effects of increasing CO2 levels may well cause some ocean acidification.
Apparently is doesn’t, but it always seemed reasonable to me.
Phytoplankton get their CO2 from seawater, not the air. There may be exceptions of course.
Ocean pH varies greatly day to day. Monterey Bay aquarium used to have a daily plot of pH on their water intake that showed daily and seasonal variations. Now they seem to have bought into “Acidification Alarmism” and the graph has disappeared from view. Maybe it is buried there somewhere still, but it used to be easy to find. No longer. All you get now is all their research on Ocean Acidification. What a change over a few short years.
Nevertheless, you can find a few morsels here and there. This is from Scripps:
“They found that in some places, such as Antarctica and the Line Islands of the south Pacific, the range of pH variance is much more limited than in areas of the California coast subject to large vertical movements of water known as upwellings. In some of their study areas, they found that the decrease in seawater pH being caused by greenhouse gas emissions is still within the bounds of natural pH fluctuation. Some areas already experience daily acidity levels that scientists had expected would only be reached at the end of the 21st Century.
Read more at: http://phys.org/news/2011-12-comprehensive-key-ocean-ph-variations.html#jCp
Oh yeah: CONCLUSION – more study is needed. 🙂
As a matter of fact practically all seabottom rocks are alkaline (limestone, basalt…). As an oceanographaer once said “the oceans consist of an alkaline liquid in an alkaline container”.
Latimer, there is buffering but the real issue is the rate of change:
“The natural pH of the ocean is determined by a need to balance the deposition and burial of CaCO
3 on the sea floor against the influx of Ca2+ and CO2−3 into the ocean from dissolving rocks on land, called weathering. These processes stabilize the pH of the ocean, by a mechanism called CaCO3 compensation…The point of bringing it up again is to note that if the CO2 concentration of the atmosphere changes more slowly than this, as it always has throughout the Vostok record, the pH of the ocean will be relatively unaffected because CaCO3 compensation can keep up. The [present] fossil fuel acidification is much faster than natural changes, and so the acid spike will be more intense than the earth has seen in at least 800,000 years.”
http://en.wikipedia.org/wiki/Ocean_acidification
Barry:
” the need to stabilize the pH of the ocean”
Barry, do not swallow the horsegrunt of the alarmists. Ocean pH varies from under 7.5 to over 8.1_naturally_, so stabilize where?
I suggest that you work on stabilizing your sphincters.
Have a read of the first chapters of Krauskopf’s “Introduction to Geochemistry”. You’ll need first year undergrad chemistry to follow it.
Dr Rodgers thanks for your several helpful comments on this thread. When I was looking at the carbon cycle in the oceans recently, I got the understanding that CO2 doesn’t exist as a pure gas in the oceans. It becomes a carbonate, but distinguishable from the other carbonates produced by the action of seawater on the rocky seabed. Can you straighten me out please?
And if warming oceans are supposed to be nett outgassing carbon dioxide, how do they absorb more and become less alkaline?
ocean pH varies by depth. change the vertical circulation via long term ocean oscillations and you change the pH. depending where you are in the ocean cycle, pH will either be increasing or decreasing.
Barry, the pH of the ocean surface is indeed decreasing over the past decades, as measured by a few longer time series like Hawaii (since 1989) and Bermuda (since 1985), buoys and regular research ship cruises. See:
http://www.epa.gov/climatechange/science/indicators/oceans/acidity.html
and http://hahana.soest.hawaii.edu/hot/trends/trends.html
The decrease of pH is accompanied with an increase in DIC (total inorganic carbon) and pCO2,
This shows that the CO2 is coming out of the atmosphere into the oceans, not the other way out.
I have the impression that this is the same kind of discussion as for the pre-Mauna Loa CO2 data compiled by the late Ernst Beck: non-accurate instruments (some were accurate to +/- 150 ppmv…), wrong places where was measured and data for the same year all over the scale…
Further the influence of CO2 on pH is very small: In Hawaii a drop of 0.05 pH unit with a (mainly seasonal) variability of 0.05 pH unit for an increase of 45 ppmv CO2 in the atmosphere (Bermuda has a double seasonal amplitude). That is about 40% of the total CO2 increase since the start of the industrial revolution.
The next problem I see is that the pH is variable from place to place, even in the open oceans far away from the coasts, depending of uptake and release of CO2, downwelling and upwelling, temperature and biolife…. There is a 0.5 pH unit difference (and more), depending where you measure and in what season.
Thus I don’t think that he historical data have much value, as one need a series of data with very high accuracy (better than 0.01 pH unit) at the same place at high (at least monthly) frequency over many years to have a clear picture of any pH trends…
I have never trusted the OA claims. Indeed as Wallace found changes in pH correlate with upwelling which increases during the negative Pacific Decadal Oscillation. The fact is pH changes rapidly with depth and there would be considerable uncertainty depending how a 200 meter average was derived. As the graphs in my presentation show pH varies dramatically depending on location, and on a a daily, seasonal and decadal basis starting around 2:50 https://www.youtube.com/watch?v=ooaZLoJXhu4
I have somewhat trusted the claims, they make ‘first glance’ logical sense. What never sat well with me is the absolutely minute changes we are dealing with causing any sort of issue. Nature just ain’t that sensitive.
‘ Nature just ain’t that sensitive.’
Sure. Any organism that was really badly affected by tiny changes in pH would not have survived long. We know that pH naturally varies a lot on daily, monthly annual and decadal tiimescales.
Nor any that found a less than 1 degree change in ‘average temperature’ (even if that is a meaningful calculation) beyond its capabilities.
Barry, the ocean has many other ions in it plus the insoluble forms with various counterions (rocks, crystals, etc.). Many of these ions are themselves weak acids and bases. So it is a complex equilibria with dozens of different species and buffers, not just carbonic acid (in case you are not a chemist this is CO2 + H2O). In addition, there are thousands (or millions?) of different species of coral and shellfish which use carbonate in its various forms to make their shells. Some may use carbonate, some bicarbonate, and some CO2 directly in their various membrane transporters so they can also affect the equilibria of the various forms of carbonate. In addition, the photosynthetic organisms will use the CO2 to fix carbon to make glucose. Some of them will use CO2 directly; others may pull in bicarbonate instead. So you have hundreds of different inter-related equilibria going on. So, just as with so many other issues in the climate area, it is enormously complicated. But these problems can be oversimplified down to just a few species or processes and politicized. Those that do this over-simplification are known as simpletons.
the most plentiful organizm on earth is algae. It consumes more CO2 than any other organism. algae produce about 330 billion tons of oxygen each year, which represents 500 billion tons of CO2. In comparison, humans produce 6 billion tons of CO2. but we rule the planet. just ask anyone.
The net result of all sea life is an estimated drop out of ~6 GtC/year form the ocean surface into the deep oceans. That is based on continuous sampling of dropping organics and inorganics at the same places as the continuous pH, DIC, etc. measurements. The difference in CO2 uptake is returned as CO2 in the same ocean surface layer by the whole chain of phytoplankton eaters and their predators…
Well, when I read the following, in the context of your “complicated processes”, I’m not convinced that all those other equilibria will compensate:
http://en.wikipedia.org/wiki/Ocean_acidification
You pay your money and you take your chances.
http://idioms.thefreedictionary.com/You+pays+your+money
Or “YMMV” – your mileage obviously varies!
The Ocean is actually quite alkaline not acidic. Our blood pH is 7.4 slightly alkaline. pH 7 = Neutral
I once thought ocean acidification was a problem just like I once thought CO2 was going to cause Earth to overheat. I’m so glad I read both sides and judge from that standpoint. This site is very good for getting the details out. These days the first question I ask is “Is that a model output or real world data?”.
Kudos to Wallace for not backing down in the face of threats. How completely dogmatic and unscientific their response to him was.
These shysters have a very slack attitude to the meaning of words, unlike real scientists. Something that becomes very slightly less alkaline does not mean it becomes very slightly more acidic. The 2 states are different. It’s like saying someone who becomes less obese becomes more anorexic, which is daft.
No, it’s exactly like saying someone who becomes less obese is slimming.
Obese, fat, slim are all relative terms, Acidic and alkaline are specific terms related to specific ranges. An alkaline solution can never become more acidic and an acidic solution can never become more alkaline. They can only be various levels of one or the other. That the term acidic is used so loosely by the media means they are ignorant, that the term is used so loosely by scientists means they are dishonest.
Yes, but less alkaline, or more neutral, isn’t very scary. Acid burns and is very scary. All those poor sea creatures swimming around in burning acid. What kind of monsters are we? Where can I buy my carbon credits?
How the heck do these type of folks get away with this type of fallacy. Where is the due dilligence and verification process in congress?
This type of garbage sets policy based upon fantasy. I mean really, if this was type of thing was done in any other facet of our lives, there would be jail time involved for the perpetrator.
To heck with the FOIA, there should be a class action law suit for damages rendered!
Let the discovery process commence!
“…if this was type of thing was done in any other facet of our lives, there would be jail time involved…”
Oh…you mean like all of those bankers that are in jail?
Oh…wait…
Great argument.
‘Look – other fraudsters over there! Leave OUR fraudsters alone.’
Unconvincing.
In fact Ammonia NH3 which exists at high pH values (alkaline) is very toxic to fish because it is lipid soluble, enters cells, and many basic enzymes don’t work anymore. NH3 is converted to NH4 in a more acidic environment and is NON-toxic because it is not lipid soluble.
Methinks that having a single trend line for PH of ALL the oceans is like having a single global temperature trend line. Physically meaningless.
Yup … even of one ocean.
Exactly. And pH is harder to actually measure . Like ‘warming’, there is a high probability of it being net beneficial (if anyone was ever able to measure that).
Alarmists like “acidification” because they think it is a nice simple way to scare the horses. They assume that most people’s understanding of chemistry is at least as bad as their own.
There is a perfectly good chemical term – neutralisation – that is both technically accurate for the processes involved and does not hold the connotations that ‘acidification’ does for the general public.
That supposed ‘scientists’ continue to use the latter, though aware of the possibility of general misunderstanding, suggests to me that their motives aren’t totally those of objectively seeking the truth. That they strenuously argue for its retention is further evidence of this
The pH range 7.9 to 8.2 is in the range of the bicarbonate buffer system. At this pH range the concentration of CO2 (as carbonic acid – H2CO3, or CO2 hydrate) is 1.5 to two orders of magnitude *lower* than the concentration of bicarbonate ion HCO3-. Bicarbonate is the form plankton, corals, and other shell-forming sea creatures need to use to make their shells, including coral reefs.
Several experimental data-sets do show (moderate) acidification over time – see e.g. figure 7 in this report:
http://tos.org/oceanography/archive/27-1_bates.html
Ruth – the time lines for the pH measurements in the paper you linked to are all in the 15 to 30 year length. They would take us back to the mid 80’s at best, or to the highest point on M Wallace’s graph.
Anytime you see a Climate Alarmist who thinks the world started sometime after 1972 then you can bet the measurements from before then will disprove their theory.
Thanks Ruth for the link! Mine of Bermuda was gone…
schitzree, the problem with many of the historical measurements are accuracy, place and time of measurement. Few series were repeated over time at the same places in the same seasons, which make it very difficult to know the overall trend of pH.
Can someone post a link to an article a couple years back that demonstrated the ocean around San Francisco fluxuated a full pH unit daily. Thanks
Rob there was a paper High-Frequency Dynamics of Ocean pH: A Multi-
Ecosystem Comparison http://www.plosone.org/article/info%3Adoi%2F10.1371%2Fjournal.pone.0028983
that has this graph http://landscapesandcycles.net/image/97416191.png
and discusses daily changes in Elkhorn Slough and Monterrey just south of SF, among other changes at other sites.
RobW December 23, 2014 at 8:09 am
In addition to Jim Steele’s excellent link, you might be referring to my post called “The Electric Oceanic Acid Test“, which contains the following graph:

w.
Warmer temps equal higher ph. So the answer to “ocean acidification” is global warming?
” Sabine responded by saying that it was inappropriate for Wallace to question their “motives or quality of our science,” adding that if he continued in this manner, “you will not last long in your career.”
A rather Gavinesque ‘how dare you accuse me of fraud’ response.
“you will not last long in your career.”
==========
clearly a threat .
I hate to be wet blanket, but these noaa directors are pretty skittish when dealing with the public. I’d like to see the actual email exchange before concluding that a threat was issued.
pHraud from Ph(D)rauds?
Like the narrative for “hottest year” (by 0.02 immeasurable degrees), there is something fundamentally hinky about 400 ppm CO₂ being capable of acidifying, in any measure, the volume of the oceans. And “oh, but it’s just surface acidification” doesn’t count. The oceans mix. Sorry. And for someone to fuel (and shield) the narrative by stonewalling a sceptical review of their work, is, in a word, corrupt. The mass balance, as mentioned at the outset, is insignificant. Only exists in a modelled state. These people just need to go away.
Mike, the few hundred meter surface layer of the oceans is in direct contact with the atmosphere. Exchanges with the atmosphere are very fast: 1-3 years half life time.
There is hardly any exchange between ocean surface and deep oceans, only via (polar) sinks and upwelling places. That gives an exchange of ~40 GtC/year as CO2 between the atmosphere and the deep oceans, or ~0.1% of total C in the deep oceans…
Just want to reemphasize that it is Richard A. Feeley and NOAA that is responsible for this intentionally misleading chart.
There will be an accounting someday and it is good to have a list of the perps.
I have added Feeley to my growing list of perps . Wallace asks “is it acceptable to omit the majority of the data ” But it seems to be a pervasive tactic accepted by peer reviewed climate “science”
http://landscapesandcycles.net/American_Meterological_Society_half-truth.html
If data begins at 1850, why has Wallace omitted the data from 1850-1910 in his chart?
Do keep up !!! The glass membrane pH electrode was not invented until 1909. Before that time , pH was measured by indirect means such as titration against an indicator. Any scientist knows you cannot reliably compare data sets obtained by such widely different methods unless you have a reliable means of validating them.
Yeah…just ask Mann!
/sarc off
The definition of pH does not depend on how it is measured.
..
I guess Wallace is just cherry picking the data.
socks: give your opinion, please, of scientists who behave in the manner documented in this post. Thanking you in advance.
To have some idea about the change in pH of the oceans, the accuracy of the measurements would need to be better than 0.01 pH unit. Someone who has an idea of the accuracy of the first glass electrodes of that time? My last pH titration was some 40 years ago…
The accuracy does depend on the measurement. What a fish!
OK mpainter.
…
Wallace should include the data from 1850, instead of dropping 60 years of it. He’s doing the same thing Feely is doing.
It seems that you are putting Wallace on the same level as Feeley, regarding their respective behavior in this affair.
Yup….seems like both of them qualify as “cherry pickers”
The pH scale wasn’t invented until 1909.
David Socrates reminds me of Dana Nuccitelli.
Hey, maybe he is Dana Nazicelli ☺
Lots of young folks here? Used to do pH titrations in the lab 50 years ago. OK, maybe not as “good” as the new electronic methods (calibration) but why not show the whole record with error bars?? Titration may be 0.05 to 0.2 units depending on procedures, high end spectrography may be 0.02, others less accurate.
http://news-oceanacidification-icc.org/2014/05/27/precision-and-accuracy-of-spectrophotometric-ph-measurements-at-environmental-conditions-in-the-baltic-sea/
So, why not show the whole record? Or does it show that there is nothing to see? Roy?
Thanks Wayne, I was looking for the accuracy of the early glass electrodes…
If we put the ancient electrodes and procedures at 0.1 units (best result) and the pH drop at a fixed place in the oceans with a growth of 40% CO2 is not more than 0.1 pH units over 100 years, what then is the value of the historical data, taken at a lot of different places in different seasons? Or shall we conclude that near all pre-1985 data are within the error band of the measurements?
Remember that no measurement is better than its calibration. Modern pH-meters certainly measures to bettter than 0.01 units, but they really can’t be calibrated to nearly that precision. pH is basically chemical, so ultimately all instruments must be calibrated against a standard solution with known pH. Those are not exact to 0.01.
Fortunately, one can (theoretically) calculate the pH from other observations in the oceans, as they have done for Bermuda and Hawaii, including some overlap of the two methods. If that is better than 0.01 pH unit still is questionable, but anyway easier to obtain than direct pH measurements. Although colorimetric analyses seems quite promising and not labor intensive, so that such automated equipment can be installed maintenance free in merchant ships. Automated pCO2 measurements are already installed in commercial ships…
Ferdinand
You never before admitted that the Bermuda and Hawaii pH figures were theoretically derived. These are your touchstons for ocean pH increase and now it comes out that these are not direct measurements, if I understand you correctly.
mpainter, they performed both direct pH measurements and calculated ones. The calculated ones are far easier to obtain and more reliable than the direct pH measurements, but both (partial) series overlap each other.
See: http://hahana.soest.hawaii.edu/hot/trends/trends.html and look at the pH comparison…
The one clear thing there is to see on the data presented is that choosing the downward slope of the trend curve obviously shows a decrease in pH. But that’s just a snapshot in time. If I quoted the trend for 1950 to say 1970 it would quite clearly show an increase in pH with time. Other points could/would indicate no change with time ( 1970 to 1990 ?). You pays your money you takes your choice.
The bottom line is anyone REALLY cherry picking data (say to fit a preconceived hypothesis-surely not !!) could easily do so with a naturally fluctuating system.
Does the pre-1910 data show any difference ? I don’t know but I might wager a small amount of pension that it would also show a natural cycle.
But hey, I’m just a newcomer on the comments here.
( ps. Wayne, I can only claim 43 years in the lab 😀 )
Roy, I doubt that the pre-1985 data have any value if they were taken with glass electrodes (+/-0.1 pH unit), different places and different seasons. We are searching for a (theoretical) trend of about -0.1 pH unit over the first 100 years of human emissions…
David Socrates, can you point us to the “omitted” data 1850-1910?
http://www.nodc.noaa.gov/cgi-bin/OC5/WOD/getyearlydata.pl?Go=TimeSorted
In the OSD file
As a chemistry illiterate, why are the annual amounts around 1920 and 1960 be so much below the general trend? If no error in capturing the data, what possible real life situation would cause what appears as a significant statistical outlier.
Those offsets are probably just due to regional outliers, sbdunes. None of the points in the trend line represent the global ocean. All of them are probably complied from regional maritime series where pH happened to be measured during some study. So, depending on what regional excursions enter into the record average, the supposed global pH average can wander about.
Sabine warns Wallace to not question their “motives or quality of our science”, I am sure Wallace did no such thing, but Sabine bringing it up means he is aware of his ulterior motives and it’s influence on his work.
It’s like when a cop asks the question, “Did you take John Smiths cash and checkbook from under his mattress?” and the suspect responds, “No I didn’t, John Smith is lying, there was no checkbook under the mattress.”
More like:
Cop: Can I see what’s in your glove compartment?
Perp: There’s no cocaine in there.
Except Wallace was no cop, but a colleague.
The original article also states:
That’s a significant motivation not to respond to inquiries like those of Mike Wallace.
I would be interested to hear the scientific justification for building a model to produce time series output and then not checking that against empirical data of the same type one already has. Really, I would.
Well mathematically $100,000 is more money than $0. Scientifically this leads to an irreversible upward trend in Mr. Feelys ability to buy more stuff. Morally and ethically totally bankrupt.
Wow, I just read this in the original article as well and can’t believe it was omitted here. How convenient for him that scientactivists are now being paid to manufacture results. I always had a feeling that finger pointing at skeptics claiming they were all being paid by the fossil fuel industry was simply a projection of guilt, not I’m quite certain. Feely’s connection to this foundation and award money need to be investigated.
Shorter answer: we need more $cience…
Now it will be all over the State Department how the wife of John Kerry, Sec. State, US, got took by a dubious scientist for $100 grand.
And next the world.
Pass the ketchup, please.
These frauds never believe that they will be sniffed out.
Dick Feely and seminal research. There’s a puerile joke in there, I’m sure.
Omitting data, thus lying to Congress is an is a criminal offense, is it not?
Contempt of congress or purgery is against the law. It is up to congress to enforce it however.
I believe that only applies if a witness is put under oath. Most people who appear before congressional committees are invited by whichever political faction believes the presentation will further their policy goals, and are not put under oath. Unlike some professions which require a professional license and civil liability insurance, climate scientists (and scientists in general) are not legally held to any specific standard of performance. So even if he did give testimony under oath, I really doubt Feely could be charged with perjury or held in contempt of Congress unless he were specifically asked whether the historical pH data were measured or modelled and gave a false answer. If you have access to a transcript of his testimony, it might be interesting to research, but I would not hold out much hope you would find anything incriminating.
Basically, if you are an impartial jurist, how can you hold it a crime to repeat before Congress what a witness has already published in a (drum roll, please) peer-reviewed journal? Thus the corruption of peer-review has ripple effects in other venues.
Eventually this will get sorted out as it has in other professions. We don’t allow bankers, stock brokers, or realtors to regulate themselves by their own standards (although they all claim the ability to do so). Eventually the body politic will figure out that as a group scientists have ceased to be disinterested seekers of truth and joined the throngs of other self-interested parties, and must be externally monitored and regulated as such. The more climate science tarnishes the common view of science, the sooner that reckoning will come.
Or possibly our civilization will collapse first from the cumulative corruption and stupidity of the people we have unwisely elevated to public office — it’s a tough call.
Unfortunately, I must agree with you.
So who was measuring the Ph of the oceans to a depth of 200 meters back in 1910? For that matter who was measuring it in the years since?
I’m seeing a large drop in pH since 1985 or so. This looks like the equivalent of arguing there is no pause in temperatures because the 30 year trend is one of increase.
Mike Wallace would do better publishing his findings than touting them on blogs.
You are unfamiliar with electronic publishing?
Hard to publish a study, when the authors of the study you are researching are running for the hills. I think you knew that or maybe not.
The moving 10 year trend does show a decline in PH. Am I missing something?
PS… I want to say thanks for exposing this (sadly unsurprising) cover up. A scientist, more than any other professional, should be most forthcoming with their information. They should be interested in the truth, and welcome critique.
The whole POINT of sharing data is so that other scientists can eliminate observer bias (motivation) as a source of error in the analysis.
I want you to question my motives. I need you to question my motives. I give you my data and and my code to aid you in the destruction of my claims. If I give you my data and I give you my code and you cannot find any effect due to choices I made in analyzing that data, then you are rationally obligated to accept my results.
Unfortunately The Team has made the whole POINT of sharing data selective and obstructionist to limit the ability of other scientists to eliminate observer bias (motivation) as a source of error in the analysis.
The Team has been hypersensitive and condemning of anyone who would seek to challenge their motives. When faced with opportunities to defend their motives by sharing their data and code they often refused in order to prevent any destruction of their claims.
Their lack of confidence in their own work prevented them from exposing their data & code to reviews which would critique their choices made in analyzing that data.
It’s not their lack of confidence, Steve. It’s that they know what isn’t tendentious (forced into predecided conclusions) is outright lies. To be charitable, a fair bit of the former rests on incompetence.
And if one does not provide their data and code to aid in the investigation of their claims, what are we then rationally obligated to accept?
Mosh makes an excellent point.
All too often we see studies in which the results only show up when the data is tortured via convoluted mathematics. Yet which analysed by more conventional mathematics, the results disappear.
If your results are robust, they should not depend on the choices you made in analysing the data. If the results change depending on your methods, then the first thing you should suspect are your methods.
Unfortunately, all too few scientists speak out because of the “you will not last long” problem.
Silence is Golden is the rule all too often, especially among the incompetent. Don’t question my results and I won’t question yours. In that way our faulty science will remain above reproach while we collect our government grants. Should anyone ask, the dog ate the data.
“Mosh makes an excellent point.
He also mentions code, meaning equations with operators, special symbols, and constants. Mistakes are easy to make and hard to find. Especially true if you have looked at many lines of code dozens of times.
Steven Mosher,
Wonderfully put.
That kind of Feynman-like view is wisdom. An intellect should, to be in objective mode, fully aid critics to find all possible issues with one’s work.
Steve, Happy Holiday Season to you.
John
I second John’s statements. Thank you.
Steven Mosher,
Excellent! Feynman couldn’t have said it better.
Now, if you can just get Michael Mann to go along…
Let’s see some breakpoint data for the BEST project Steven.
Having asked politely for this 9 times now, I’m assuming your comments above contain some qualifiers as in, some data can be released and some not.
The graph is lacking one important feature – error bars. I believe we can safely assume measurement error was pretty large prior to invention of modern pH measuring methods and taking that into account, all ups and downs prior to 1970 can likely safely hide into it. All that’s needed for the data to be compatible with the ocean acidification hypothesis is for any measurements prior to 1970 to have pH +/-0.1 stochastic and +0.1 systematic error. And something tells me people were not after pH 0.01 accuracy before 1970.
Now what I really want to say is that this definitely needs some attention. The data don’t say much, but the reluctance to provide them is suspicious.
anytime your trend depends on the choice of endpoints, you have no trend.
I believe we can safely assume measurement error was pretty large prior to invention of modern pH measuring methods
No we cannot assume that. Stoichiometry is capable of highly precise, repeatable, measurements.
It is however safe to assume that measurements of equal precision are likely cheaper today than 100 years ago.
On the other hand, systematic error might be more common today with overconfidence on a black box experiencing instrument drift.
Kasuha, I agree on that point: pH measurements with glass electrodes may have been accurate to 0.1 pH unit in the early days, while we are looking for a trend of 0.1 pH unit over (the first) 100 years of human emissions. Thus I fear that most of the 2 million historical data simply can’t show the real trend in pH of the oceans…
And they need to be adjusted for salinity…
There is a host of variables that need to be discounted before the panicists hypothesis crosses the credibility threshold.
Curiouser and curiouser. Craig Welch, lead reporter of The Seattle Times 2013 award winning “Sea Change” series on ocean acidification, refers to the research of Richard Feely and Christopher Sabine as sources for the content of the series.
And Welch never responded to my letter pointing out the scientific misconduct in both the corals and the oysters he used for Sea Change. No retraction, no correction, nothing. See esssay Shell Ganes for the details and references to both acidification scares. Prof. Cliff Mass in Seattle also bogged this and tried to get Seattle Times’s attention based on my guest post at Judiths. No luck either.
A correction or two would interfere with the steady stream of awards the OA series has accumulated, like the du Pont award last week. Craig Welch and the Times have been less enamored of Dr. Mass lately due to his criticism of it. Welch’s response to Dr. Mass has citations of Feely and Sabine papers.
Afaik, the global carbon inventories, in billions of tons, are roughly as follows:
Fossil fuels, 4000; atmospheric CO2, 700; vegetation and soil, 2000; oceans, 40,000.
So burning all the fossil fuel we can reach could increase the oceanic CO2 content by about 10%.
It is difficult to create a catastrophe from a 10% change.
That leaves the scientists working for the US in a dilemma.
Recognizing that oceanic buffering overwhelms any possible CO2 effect conflicts with their employers mandate, expressed by Interior Secretary Sally Jewell, who announced that ‘climate change deniers are not welcome in the Department of the Interior’, the umbrella agency that manages NOAA. So they either toe the official line or leave, with not many places to go.
Eisenhower, in his prescient farewell address, spoke of the dangers arising from a government monopoly on scientific research funding. Climate science today could be the poster child illustrating his fears.
Oceans do not magically suck CO2 out of the air…
…if it did, we wouldn’t have any
Present CO2 levels are not high enough to affect ocean pH
Biological processes produce so much acid….the buffer would have to run out first….the oceans would be acid without CO2
Sorry, but Henry’s law is well known. Higher CO2 concentrations in the air means more dissolved CO2 in the water, leading to lower pH. And while there is plenty of “buffer” in the ocean, it’s a rate constant problem — the ocean can’t keep up with the increase in dissolved CO2. This page explains the biological impacts: http://www.pmel.noaa.gov/co2/story/What+is+Ocean+Acidification%3F
Barry, you just said it’s impossible to have a fish aquarium in a closed building…
use your head and stop buying into this crap
The inability to buffer claim is based entirely on the flawed model in question.
Barry, see the graph from Evans 2011 below. It is not a simple rate problem as you suggest. The upper ocean can deal with 3 times the current CO2 in a matter of weeks.
Barry is right in this case: any change in CO2 of the atmosphere translates to a 10% change (due to the Revelle/buffer factor) in total CO2 and a drop in pH of the upper ocean layer within 1-3 years. That is what is measured in several places over the past decades.
If that will have any impact on sea life is doubtful as the main calcifying organisms evolved at much higher CO2 levels during the Cretaceous, witnessed by the white cliffs of Dover and many such places all over the world…
Ferd, Barry is not right…..Barry said: “Sorry, but Henry’s law is well known. Higher CO2 concentrations in the air means more dissolved CO2 in the water, leading to lower pH”
the ability of water to absord CO2 is buffer dependent…..a higher buffer can absorb more CO2 and have no change in pH
Barry said: “And while there is plenty of “buffer” in the ocean, it’s a rate constant problem”
No it is not…..since buffers can change
Latitude, seawater is a rather weak buffer: it is in equilibrium at about 10% of the change in the atmosphere. That gives that the 30% increase in the atmosphere only shows up as a 3% increase in DIC (CO2 + bicarbonate + carbonate) in the ocean surface layer, even if free CO2 in the surface layer also increased 30% per Henry’s law. But free CO2 is only 1% of total carbon in seawater…
Further the quantities are not that different in the ocean surface layer as in the atmosphere: ~1000 GtC in the “mixed” ocean layer, ~800 GtC in the atmosphere. The 30% increase in the atmosphere did increase the surface layer with only 30 GtC. Which makes that the surface layer is fast saturated (1-3 years behind the atmosphere).
Fred, northern latitudes hold more CO2 than southern…it’s because they are higher in buffer
Henry’s law assumes there are no chemical reactions taking place….
the more buffer…the more acid you can add without affecting the pH
+10 Barry.
Atmospheric CO2 not in equilibrium with the ocean.
Sources maybe removed by thousands of miles from sinks.
Sources may become sinks and vice versa, depending on season or time of day.
And the inter-conversion of free CO2 and bicarbonate is about ten million times slower than a diffusion limited reaction. That’s why every living organism utilises carbonic anhydrase to speed the reaction up.
It’s not just economists that made unworldly assumptions about equilibrium.
Henry’s Law looks pretty flaccid in face of those home truths.
Yep, we should be really reaalllyy reeeaaallllyyy worried! Look at how CO2 has been so deadly to planet #3:
http://wattsupwiththat.files.wordpress.com/2013/06/co2_temperature_historical.png
Latitude, CO2 in the polar seas is higher and pH lower, because the temperature is lower and therefore more CO2 is absorbed (and transported to the deep)…
Due to the ocean’s buffering capacity and the biological pump, as seen in the graph below, the upper ocean can experience upwelling that drives CO2 levels to 3 times higher than what would be expected from equilibrating with the atmosphere. Within a week, the concentration of CO2 and thus pH drops to levels that are 70% of what atmospheric equilibration would predict.
http://landscapesandcycles.net/image/98786989.png
Read Evans (2011) Seasonal cycle of surface ocean pCO2 on the Oregon shelf. JOURNAL OF GEOPHYSICAL RESEARCH, VOL. 116
The upper ocean can deal with 3 times the current CO2 in a matter of weeks……
It has to…..biological processes (acid) are magnitudes higher…and the carbonates are CO2
Jim, careful, pCO2 pressure is not the same as CO2 content… pCO2 is caused by the amount of free CO2, that is 1% of total inorganic carbon (CO2 + bicarbonate + carbonate) in seawater. If the pCO2 triples, free CO2 may have tripled, but the rest of the carbon may have changed just a few % to give a new equilibrium…
Very few have much of a clue regarding the oceans’ complex water chemistry – I don’t. However, we might be able to educate the public a little by comparing their water chemistry to a swimming pool, which may be more familiar to people. Of course a swimming pool is a closed system, but the idea and importance of buffering can be demonstrated in a properly balanced pool.
In a pool the main concern is to control the alkalinity. The ideal pH range in a pool is 7.4-7.8. (Note that the pH of the human tears is about 7.5, which is considerably more “acidic” (less alkaline) than the normal ocean alkalinity.) The chemicals added to a pool, for health reasons and prevention of algae, are typically quite acidic – in the pH of 3 range. This causes the water to become acidic and makes for uncomfortable swimming and a bunch of other problems, notably corrosion. To counter the acid, alkaline chemicals are added – typically in the forms of sodium carbonate (soda ash, pH = 11.4) and sodium bicarbonate (pH = 8.4). It takes a lot of the bicarb (pH = 8.4) to counter the low pH acids, so initially the bicarb is introduced in large quantities and this provides an alkaline base. The oceans have this same alkaline base in enormous quantities. In the pool, this alkaline base prevents large pH swings when the sanitizing acids are re-introduced/refreshed. The soda ash, with its high pH, is used in small quantities to make small adjustments to the alkalinity. If too much soda ash is used, the pH will rise to an uncomfortable level. In this case, an acid is introduced to lower the pH and what is funny is that CO2 gas is sometimes, not often, used to accomplish the desired drop in pH.
As a pool is used, there are over two hundred known chemical reactions occurring in it and quite likely twice that many unknown chemical reactions. These reactions constantly change the pool water chemistry, which requires constant oversight and testing. Lord knows how many chemical reactions are occurring in the oceans every second. The hubris of scientists, to think man is causing much to change ocean water chemistry, is astounding to me. When one considers all the effort we expend to control the water chemistry of a dinky water source like a pool, it is stupid to think we can influence and “control” the oceans’ water chemistry.
Oh yes, it’s so complicated that no one can know anything. Let’s just throw up our hands and keep polluting the planet. See previous comment explaining that it’s a rate constant problem, not an equilibrium one.
No one suggests we keep polluting the planet. That is a red herring. CO2 is not a pollutant but plant and plankton food.
Algae consume 500 billion tons of CO2 each year. The atmosphere holds 700 billion tons of CO2. We better hope something keeps eating the algae or we are in deep do-do.
Barry December 23, 2014 at 10:47 am Edit
Thanks, Barry, but I fear you have the problem backwards. It’s not that “no one can know anything”, nobody’s saying that but you.
The problem is that the natural world is indeed amazingly complicated, but despite that, people keep claiming that they know everything, and that “the science is settled”.
w.
Barry, I’m sorry…you don’t have a clue
Henry’s law assumes there are no other chemical reactions getting in the way….
…The higher the buffer, the more CO2 it can hold
That fact says it’s not a “rate constant problem”
Your PMEL link, says nothing about kinetics, Barry. It’s all about local equilibrium chemistry. Your kinetics argument is your own, and it’s merely an implicit proposition that not enough carbonate or oxide solids can dissolve fast enough to buffer surface waters to an invariant pH 8.1-8.2 as atmospheric CO2 increases. But you provide no evidence that this is important, and you show no evidence of understanding that the response of organisms is driven by metabolic energy, rather than chemical equilibration.
Your PMEL link gives a good example of this lack of understanding. It shows an empty pteropod shell dissolving over 45 days in water purportedly as it would be in the year 2100; presumably pH 7.9 bicarbonate (they don’t say). This shell is supposed to represent the fate of living pteropods. But an empty shell has no biological response.
Why didn’t they try the experiment with a living pteropod? Could it be because living pteropods can adapt to environmental pH? Especially interesting in that linked study, was that the researchers added HCl to make their pH adjustments, rather than bubble excess CO2 into the water. That means the pteropods did not have the benefit of higher pCO2 when they faced the challenge of lower pH. And yet, they were able to adapt anyway.
Pteropods produce a proteinaceous coat that covers the outside of their shell. It prevents direct contact between shell carbonate and sea water. Guess what that means as regards susceptibility to a small decrease in alkalinity. But, of course, the PMEL’s empty shell can’t maintain a protein coat, if it had one at all (they don’t say).
Here is a link to ocean acidification literature collected at CO2 Science. Go ahead and read through it. You’ll discover that the future is much more interesting than you expect. Biology is clever, adaptable, and has a large evolutionary bequest. Chemistry is only a small part of that, and equilibrium chemistry an even smaller part.
Calling CO2 “pollution” as you do is just language touted by green NGOs in order to channel your thinking. If you start out believing CO2 is a pollutant, you’re immediately susceptible to accepting specious proofs that it’s a pollutant.
So, what’s it going to be, Barry? Critical thought or normative moralization?
Your PMEL link, says…………”In areas where most life now congregates in the ocean, the seawater is supersaturated with respect to calcium carbonate minerals.”
and if someone doesn’t understand the processes that led to supersaturation….they would believe it can run out
Barry: my comment above is an attempt to educate the non-chemists who visit this site as to the importance of a buffered system by using an example with which they might be familiar. There are those who are taking advantage of the populace’s lack of chemistry knowledge and only education will combat their nefarious purposes. Ocean chemistry IS very complicated and wonderfully we are slowly learning more each day. To my last CO2 laden breath I will support further research. However, the reality is that we know very little at this point and have a very long ways to go. Hubris: the tendency to think we are gods. We are not.
Willis & Pat Frank: spot on.
”In areas where most life now congregates in the ocean, the seawater is supersaturated with respect to calcium carbonate minerals.”
Doesn’t a solution need to be cooled to become “supersaturated”? Just askin’
Rh, no
OK, so I will spell this out:
“The natural pH of the ocean is determined by a need to balance the deposition and burial of CaCO3 on the sea floor against the influx of Ca2+ and CO2−3 into the ocean from dissolving rocks on land, called weathering. These processes stabilize the pH of the ocean, by a mechanism called CaCO3 compensation…The point of bringing it up again is to note that if the CO2 concentration of the atmosphere changes more slowly than this, as it always has throughout the Vostok record, the pH of the ocean will be relatively unaffected because CaCO3 compensation can keep up. The [present] fossil fuel acidification is much faster than natural changes, and so the acid spike will be more intense than the earth has seen in at least 800,000 years.”
More here:
http://en.wikipedia.org/wiki/Ocean_acidification
It’s not “an acid spike,” Barry. If anything, it’s an alkalinity decline. The Wiki description is itself couched in specious language.
Second, the claim that it’s the largest descent in 800,000 years is based on the assumption that ice-core CO2 accurately follows atmospheric concentrations. But the record of fossil plant stomata refutes the ice-core record, at least over the last 13,000 years.
Further, the resolution of ice-cores is determined by the time of closure of the firn (solidification time of snow into ice). That time is typically 80-120 years. During closure of the firn, ice CO2 equilibrates with atmospheric CO2, and the record smears out. That means no one knows from the ice-core record whether CO2 spiked up for several decades, or not. From the stomata record, it may have done. Notice that the stomata record is invariably higher than the ice core record, where both sets of data exist.
Your worries are misplaced, Barry. You’re not thinking critically.
Pat Frank,
Second, the claim that it’s the largest descent in 800,000 years is based on the assumption that ice-core CO2 accurately follows atmospheric concentrations.
Ice core CO2 accurately follows the CO2 in the atmosphere, be it averaged over 10 to 600 years, depending of the snow accumulation. 10 years of resolution is over the past 150 years, ~20 years over the past 1,000 years, 40 years over the past 10,000 years and 560 years over the past 800,000 years.
The current 110 ppmv spike in CO2 over the past 160 years would be detected in all ice cores, including the least resolution cores as the repeatability of CO2 measurements in ice cores is 1.2 ppmv (1 sigma), thus a spike of 100 ppmv, sustained over 10 years, would be noticed in the Dome C 800 kyear record. Or a sustained change of 2 ppmv over 560 years.
In contrast, stomata (index) data are proxies, with all the problems involved. They show the local CO2 variability of where the plants grow, where CO2 levels are changing with the CO2 uptake/release in the main wind direction. That includes huge land use changes over the centuries even changes in the main wind direction in certain periods (MWP-LIA-current).
The local bias in CO2 levels can be compensated for by calibrating the stomata data to direct measurements, firn and… ice cores over the past century. But there is no knowledge how the local bias changed over the centuries… Thus while the stomata data give a good idea of the local CO2 variability, their absolute CO2 levels should be taken with a lot of salt.
Anyway, even if there is some migration (not even measurable) in ice cores, that doesn’t change the average of the CO2 levels over the period of resolution. If the stomata data show a different CO2 level over the same period, the stomata data are certainly wrong…
Ferdinand, the average firn closure time at Law Dome, Antarctica, is about 50 years. See Etheridge, et al., (1996) JGR 101, 4115-4128. Law Dome was chosen for its almost ideal characteristics. The exchange time before closing is about 10 years at depth, so that the averaging with atmospheric gases is reasonably complete over the firn closure time.
Even at Law Dome, then, “accurately” following atmospheric CO2, as you have it, does not mean accurately reproducing the absolute values of CO2. ‘Accurately following’ means no more than statistically correlated. The 110 ppmv increase in CO2 since 1850 that you mention would show up in well-behaved annually resolved ice cores, but not as a 110 ppmv rise. The apparent maximum would be reduced and the trend would be flattened.
It is true that stomata are proxies for CO2. But their population is strongly determined by ambient CO2 levels. While there are other determinants stomata are only weakly affected (pdf) by water stress or typical variations of irradiance, and so they do not suffer “all the problems” of such proxies as tree rings, corals, or spleothems.
Local winds that might change ambient CO2 levels on a daily basis will not affect stomata number, which cannot vary day-to-day, but will effect the diffusion of CO2 through a firn layer. So, the wind variable you mention will more affect ice core CO2 than it will stomata count.
The idea, in any case, that CO2 is globally well-mixed seems to have become suspect. It now seems possible that Antarctic and Arctic ice cores may under-reflect the global average atmospheric CO2, apart from the averaging effect of the firn.
Recent use of fossil stomatal index has shown large swings in CO2 concentrations during the Miocene. Your dismissal of stomata is too casual, Ferdinand. In my view, where stomatal index indicates a disparately higher level of CO2 than the contemporaneous ice core data, it’s more likely the ice core is wrong, shown here, for example in a comparison for the 13th century.
Pat Frank,
Have you read the full work of Etheridge e.a. of 1996, he explicitly refutes several of your objections. There is no influence of wind on the CO2 levels in the firn near the atmosphere: they are exactly the same as above the surface. The Law Dome ice cores have an overlap of ~20 years with the atmosphere and reflect the atmospheric CO2 levels within +/- 1.2 ppmv for the same average gas age:
http://www.ferdinand-engelbeen.be/klimaat/klim_img/law_dome_sp_co2.jpg
The averaging makes that the ice core record lags the changes in the atmosphere and that fast peaks are suppressed, but for the Law Dome ice cores, any peak of 20 ppmv happening over only one year should be just detected or a 10-year sustained 2 ppmv increase…
The 110 ppmv increase in CO2 since 1850 that you mention would show up in well-behaved annually resolved ice cores, but not as a 110 ppmv rise.
Depends of the resolution of the ice core and the length of the maximum. If the rise has a maximum longer than the resolution, the full ppmv rise will be detectable, as is the case for the -relative- slow increases and decreases of CO2 over the past 800,000 years. But for the current rise, where the end is not in sight, the ice cores only follow the increase with a lag which depends of the resolution.
It is true that stomata are proxies for CO2. But their population is strongly determined by ambient CO2 levels.
The problems are mainly in the ambient CO2 levels. Not the daily wind variations, but the level of CO2 over months, years and centuries imported by the prevailing winds. The tall tower in Cabauw, Netherlands can detect that corn is grown in the main (SW) wind direction…
One of the best stomata data in The Netherland is a thousands of years natural oak forest in the SE. In the main wind directions: SW to NW (of today!) sea was converted to land and agriculture, heather fields to forests and since 1.5 century industrialization, increased population and transport… The local offset (~40 ppmv in Giessen, SW Germany) can be calibrated away by comparing the stomata data to direct measurements and ice cores in the previous century, but nobody knows the influence of land use changes in the main wind directions and of changes in the main wind directions themselves (MWP-LIA) in the course of the centuries.
That makes that while stomata data have a better resolution than ice cores, their variability is mainly local and their averaged CO2 levels, if they differ from the ice core data over the resolution period of the ice core, are certainly wrong. Averaging does remove peaks, but doesn’t change the average over the resolution period… See:
http://www.sciencemag.org/content/286/5446/1815.full
Pat Frank, I have looked deeper into the stomata data as proxy.
First the error estimate of stomata data even over the previous two centuries is large (+/- 67 ppmv!):
http://hol.sagepub.com/content/19/5/757.abstract
Then the problem of huge CO2 changes in short time over the past:
from http://www.sciencemag.org/content/286/5446/1815.full
the trend can be enlarged:
http://www.sciencemag.org/content/286/5446/1815/F1.expansion.html
The resolution of the Taylor Dome ice core over the Holocene is ~40 years. At 11,300 years BP (1950), the stomata data and ice core data are equal. During the period 11,250-10,600 years BP, stomata data are average 330 ppmv, ice core data at 265 ppmv. A difference of 65 ppmv sustained over 650 years (borderline the above accuracy of stomata data). The change is long enough to be fully visible in every Antarctic ice core drilled until now. But is not measured in any ice core…
The difference in CO2 levels between all ice cores drilled in Antarctica with the most extreme differences in snow accumulation and temperature is not more than 5 ppmv for the same average gas age…
Thus sorry, while stomata data give a rough idea of (local!) variability and CO2 levels, their use for absolute CO2 levels in the bulk of the atmosphere is very limited and they certainly don’t refute the ice core data for average CO2 level over the period of resolution of the ice cores…
Ferdinand, regrets for the delayed response — holiday distractions and all that. . . 🙂
I have read Etheridge 1996, and understand your point about Figure 3. However, I believe you have overlooked that the points represent the very top of the compacted ice region, where correspondence to atmospheric composition is bound to be greatest.
As a smaller point, though, Etheridge, et al., corrected their empirical CO2 measurements for gravitational diffusion. They used their empirical 15-N measurement to estimate the gravitational diffusion rate, rather than the value from the barometric equation. Reliance on the empirical value automatically corrects the 15-N for any convective mixing due to wind shear.
This means their CO2 measurements were empirically corrected both for gravitational diffusion and for convection in the firn. So, it’s not too surprising that their corrected firn and upper ice CO2 values were so close to the atmospheric measurements.
Convective mixing due to wind shear does happen in firn, see here, where this is mentioned. According to J. Turner, et al., (2001) JGR 106, 7291-7311, strong high-wind storms were recorded near Law Dome about 10 times per year between 1969-1996.
Convective mixing due to wind mixes the atmospheric gas between 2-10 meters into the firn, amounting to 2-20 years of averaging, depending on snow accumulation rates.
However, the issue about accuracy concerns the extended record, not just the most immediate compaction zone.
The major problem affecting correspondence with contemporaneous gas mixing ratios is the diffusion of gas vertically through the ice over time. Gas dissolved in ice is in equilibrium with gas in bubbles above about 500 m, and with gas in the clathrates that appear below that level.
The empirical diffusion coefficients for N2, O2, and CO2 in ice cores was reported by Bereiter, et al. (2009) GRL 36 L05703. At 220 K, a typical deep core temperature, the diffusion coefficient for CO2 is 3.1×10^-11 m^2/sec. From this, one can estimate that CO2 can diffuse at the rate of 0.076 cm per year through the ice, in each direction. Of course, only vertical diffusion, (+/-)z, is important for coherence of ice core layers.
Equilibration with bubbles and clathrates means net migration of CO2 in ice across concentration gradients. This exchange would continue until a new equilibrium is attained across the diffusion zone.
That diffusion rate means ice-core CO2 in a given layer can migrate 76 cm per 1000 years. If we assume 1 cm per year of ice, 1000 years produces approximately a 152-year average. Over a few thousand years, the bulk ice CO2 may migrate across more than a meter. The result is to smear out excursions, as ice core CO2 slowly equilibrates to produce a mean of CO2 averaged over centuries, and then millennia.
If atmospheric CO2 were varying across 250(+/-)50 ppmv over several thousand years, it would seem this variation may be quite smoothed out by diffusion, and any short-term spike would be greatly attenuated. Mostly one would see an artifactual average that would make [CO2]atm seem quite constant over intermediate-length times, apart from large ice-age shifts.
In fact, one sees this effect in Lüthi, et al, (2010), EPSL 297, 226-233. They report larger variations in measured CO2 with per-cm vertical distance in younger ice earlier in an ice core clathrate zone, and smaller variations in older ice at deeper core, consistent with increasing homogeneity with time. They ascribe this aging effect to diffusion within the ice.
Likewise, B. Stauffer, et al. (2003) (pdf) (Mem. Natl Inst. Polar Res., Spec. Issue, 57, 139–152) reported multiple CO2 measurements every ~1-cm in two Antarctic ice cores (Khonen Station and Concordia Dome). The scatter among measurements decreased with the age of the ice; (+/-)3.8 ppmv at 147.4 m (930 year ice), (+/-)2.8 ppmv at 219 m (4270 year ice) and (+/-)2 ppmv at 521.7 m (16500 year ice). This trend was apparently surprising to them. Most likely these show the smoothing out of concentration differences in ice CO2 because of diffusion.
Lüthi, et al, (2010) proposed that after long times, the mean atmospheric CO2 concentration is regained, but only if one samples >10 cm of ice. This seems to be putting a favorable light on the problem.
All of this implies that the early Law Dome results of Etheridge are uncharacteristic of CO2 behavior over long times in ice cores, and should not be relied upon to indicate long term accuracy. Also, that after ~10 thousand years, ice core CO2 will no longer show perhaps even century-scale variations, but can t best only represent a long-term mean atmospheric concentration.
Ferdinand, I’ve looked at the stomata references you cited. First, Finsinger, et al., 2009 compared the stomata of plants grown in herbariums in Denmark, with the ice core CO2 index of Mauna Loa and Law Dome. That is very localized sets of plants are compared with global averages. This is a bit of apples and oranges.
It is significant that the stomatal reconstructions matched the modern Mauna Loa direct measurements but departed from the century-old Law Dome reconstructions.
As the (+/-)68 ppmv error you quoted was derived by the assumption that the Law Dome reconstructions were completely accurate representations of atmospheric CO2, one cannot use this disparity to discredit the stomata reconstruction relative to the Law Dome reconstruction. I.e., such a critical analysis is circular.
A better indication of intrinsic error in stomatal reconstructions is the (+/-)18 ppmv Finsinger, et al., give for the training period, where modern stomatal density or stomatal index is regressed against modern CO2 measurements. Likewise, Stults, et al., 2011 found a stomatal density error of (+/-)22 ppmv.
Your Science references, both of them to Indermühle, et al., 1999 merely dismisses the stomatal index CO2 reconstruction by Wagner, et al., because it disagrees from the Law Dome reconstruction. Such a dismissal is tendentious and is not a legitimate disproof of the stomatal reconstruction.
Perhaps you didn’t notice, but below Indermühle, et al., 1999, on the same page in Science, was a written rebuttal by Wagner, et al., that points out that Indermühle, et al., rested their critique on stomata measurements from “altitudinally and latitudinally contrasting growth areas,” and on stomatal density measurements rather than the more reliable normalized stomatal index.
Notice also the ice core reconstructions of Indermühle, et al., concern the Holocene centered around 11000 years BP. We know from the diffusion rate of CO2 in ice, which I noted above, that smearing is possible across (+/-)8.4 meters of core, which approximately averages 840 years of CO2 deposition.
In general, the gas inside ice core bubbles is in equilibrium with the gas dissolved in the ice. The gas dissolved in the ice diffuses about 1 mm/yr along (+/-)z. So, after every 1000 years, the ice core resolution of CO2 flux is reduced by about (+/-)100 years because of averaging.
I also looked at the four references Indermühle, et al. gave for what they call, “direct measurements on air that has been enclosed in bubbles” (Refs. 3,4,7,8). In fact, they did not measure CO2 directly in gas samples taken from inside bubbles (quite possible with modern analytical methods), but rather CO2 released from bubbly ice using a dry cold needle ice crusher. Needle crushers reduce ice core samples to mm-size bits. The gases released from the core are therefore from broken bubbles and from the ice itself, not from the interior of the bubbles alone.
Finally, in stomatal reconstructions, among other variables, one must be careful to choose plants that are known to respond well to changing [CO2]atm. D. L. Royer’s 2001 review of stomata as an indicator of atmospheric CO2 discusses this in detail, with long appendixes listing the traits of various candidate species. Some of the variability of stomatal results may be due to using poorly sensitive plant species. I haven’t looked into that aspect.
However, from all this, I remain of the conclusion that stomatal reconstructions provide a better record of paleo-excursions in atmospheric CO2 than do ice core records, including back in the Holocene, and that ice core CO2 declines in resolution with greater age.
It turns out, at Law Dome, the average core length per year is ~40 cm. So, my estimate of CO2 averaging by diffusion needs to be revised.
Taking 40 cm per year of core ice as typical, two years of trapped CO2 are averaged every 400 years with a standard CO2 diffusion rate of 1 mm per year. That means the resolution per ice-core year-point is 50 years of atmospheric CO2 averaged after 10,000 years, 500 years averaged after 100,000 years, and 1000 years averaged after 400,000 years — the time-length of the Vostok core.
So, for the mid-Holocene, 5000 years before the present, each ice-core year will represent a 25-year running average of atmospheric CO2. That’s from diffusion-averaging alone.
From the orginal publication of Petit, et al., 1999, it seems the Vostok glacial ice core record consists of 420,000 years recorded in 3350 meters of ice. That averages 1 year per 0.8 cm of ice.
Assuming diffusion is the rate limiting step in CO2 migration, the 1 mm per year rate implies a 2-year averaging every 8 years. So, the estimates above for 1 cm progressive loss of resolution of atmospheric CO2 are relevant to the Vostok core.
The Concordia Dome ice core turns out to average about 0.43 cm of ice per year, so the loss of resolution of atmospheric CO2 by diffusion averaging is about twice the rate of Vostok.
Is there anything left in the climate alarmist armoury of scary stories/pseudo-science that has not now been totally debunked?
I found this post very disquieting as it is yet another major abuse of the scientific method by those who we should be able to trust in the ‘climate science’ fraternity.
I find this more than disquieting – and I think we all need to sign the petition – how can we allow the data record to be censored? or tolerate cherry picked model output presented to Congress?
Look at Feely’s CV. Nobel Peace Prize (co-shared with Al Gore and other members of IPCC) – 2007. Yet another one.
It’s a license to kill science.
Another Hide The Decline, this time about ocean acidification.
So, the general rule now is that when scientists start making threats, you just know there is something being hidden.
The general rules are found in the Baloney Detector. Alarmists have trouble validating most of their assumptions when those rules are enforced.
PhGate?
AcidGate?
In private industry hiding data that disproves a hypothesis would be grounds for firing.
There is case after case where there is strong evidence that a cabal of climate change ‘scientists’ are working to push an agenda, rather than to solve scientific problems.
http://link.springer.com/article/10.1007%2Fs11191-013-9647-9
Climate Consensus and ‘Misinformation’: A Rejoinder to Agnotology, Scientific Consensus, and the Teaching and Learning of Climate Change
As soon as I saw the blue squiggle, I knew models were involved.
I never understood how they could sell the idea that oceans, that are supposed to be warming, would absorp CO2, which they don’t. Warming oceans release CO2, cooling oceans absorp CO2.
Manmade acidification is a h-o-a-x, as we now know for sure. It’s based on a Phraud.
I can’t wait to see these climate clowns doing a lot of time for their crimes.
The warming increases the pCO2 of the oceans with not more than ~8 μatm/K that is about 6 ppmv since the LIA. The increase is currently ~110 μatm (~ppmv) above equilibrium for the current average ocean surface temperature. Per Henry’s law the ocean surface is a net sink for atmospheric CO2…
…and during glaciation as the poles ice extends over more ocean area, resulting in a decrease in cold water to absorb atmospheric CO2. Probably explains the yo-yo of CO2 following the glaciation periods. Everyone knows that. 🙂
I don’t quite understand. Warming increases the pCO2 of the oceans? Could you please explain this?
And correct me if I’m wrong about warming/release and cooling/absorp?
highflight56433, the sink rate is higher in winter than in summer, as the ocean sinks are at the edge of the freezing ice. Ice formation expels most of its salts and makes the also cold waters heavier than the deep ocean waters. In summer when the ice melts there is less sink capacity…
cosmicclimate, it is as follows: warmer (ocean) water builds up CO2 pressure to escape from the solution. If the pCO2 (partial pressure of CO2) of the ocean is lower than the pCO2 from the atmosphere (~ppmv), then the direction is into the oceans, no matter its temperature. The reverse pressure difference gives a flux from the oceans into the atmosphere. If both pressures are the same, nothing happens, whatever the temperature of the oceans or atmosphere.
The pCO2 in the atmosphere is given by its volumetric CO2 content (ppmv) minus water vapor which is maximum a few % near sea level. pCO2 in water is a mix of temperature, pH, bio life and total carbon (DIC) content… In general measured by mixing seawater with air till equilibrium and measuring the CO2 level in the air.
Thank you. It gets more and more complex, the more you learn and try to understand.
Rain, is often slightly acidic
Rivers are often quite acidic (below pH6)
Over millions of years rain and rivers have flowed into the ocean,
Yet the ocean is still around pH8.
That pH8 is the balanced value with the rocks that surround and are below the oceans (limestone, basalt) and the huge deposits of carbonates. This balance would have to be overcome for any pH change to take place..
and no tiny change in atmospheric CO2 is going to do that.
The oceans already contain 98% of the world’s CO2. You could put all the atmospheric CO2 into the ocean, and the pH would not move one iota.
Hardly in the deep oceans, but the surface layer is only ~1000 GtC, while the atmosphere is ~800 GtC. Both do exchange CO2 at a very high rate. The exchange with the deep oceans is much slower…
Rain is always acidic, and always has been (pH c. 5.7-6.0) since there is CO2 in the atmosphere which is dissolved in the (unbuffered) rainwater. And, yes, freshwater lakes and rivers are naturally usually somewhat acidic. Salt lakes on the other hand are alkaline, sometimes violently so, since they contain salts in different proportions to the sea (Mono Lake has pH = 10, i. e. equivalent to fairly strong lye).
Well, not always. I have measured (with my trusty Hatch) 7.2 before. It was the first rain of the start of the SW Monsoon in 1988. I was in Mesa Arizona. The rain had started just after a major dust storm. Later that night, it was at a normal 6.5.
Reblogged this on the WeatherAction News Blog and commented:
Fishy
‘Sabine responded by saying that it was inappropriate for Wallace to question their “motives or quality of our science,” adding that if he continued in this manner, “you will not last long in your career.”’
Well, yeah, Wallace pursues scientific method all the way.
Nice little career you got there, be a shame if anything happened to it…..
The oceans are not acidic. Their pH is about 8.
Water with pH below 7.0 is termed “acidic” and water with pH above 7.0 is termed “basic” or “alkaline”; pH 7.0 is “neutral”. pH measures the concentration of H+ and hydroxide (OH-) ions which make up water.
The U.S. E.P.A. considers lakes with pH less than 5 “acidified.” Tomato juice (pH 4) is ten times more acidic than black coffee (pH 5).
The pH scale is logarithmic and as a result, each whole pH value below 7 is ten times more acidic than the next higher value. The same holds true for pH values above 7, each of which is ten times more alkaline (another way to say basic) than the next lower whole value.
From Wiki: Ocean acidification is the ongoing decrease in the pH of the Earth’s oceans, caused by the uptake of carbon dioxide (CO2) from the atmosphere.
So get current.
trafamadore,
Ocean ‘acidification’ is not the ongoing decrease in ocean pH. At most, you [and Wiki] can only say honestly that a decrease in ocean pH is approaching neutral — but it will never get to 7.0.
Both you and Wiki are deliberately misrepresenting the situation, for your own political agenda.
So get current.
You forgot most of the world’s scientists. But why don’t you come up with your own word for an adjective that explains becoming less alkali. Neutralification? Not so catchy.
Cite the publications where “most of the world’s scientists” echoed Wiki or you.
Until then, false claims of authority are merely embellished fabrications.
Not so “catchy”??
It’s far more honest than your misinformation.
But then, if you had to be honest the debate would have been over years ago.
And BTW, you don’t speak for all scientists, most scientists, or even a few scientists. You speak only for yourself, and I for one would appreciate some honesty for a change. The ocenas are not ‘acidifying’. In fact, within error bars there is no change in pH at all.
When you lower the pH of any solution you have “acidified” it
…
The process is then refereed to as “acidification”
..
So, Mr dbstealey, you need to learn the use of English words.
It works just like the term “alkalinisation”
False. You do not make some less dead if you remove the bullet from the corpse.
YOu are nuccitelli.
Socrates, get with the program. db doesn’t warm up his coffee in the morning, he makes it less cool. So as not to panic himself, you see. Plus, coffee isn’t hot until it’s hot. Don’t you know nuffin’?
I’m a professional chemist, David. Lowering solution pH from 8.2 to 8.0 is not an acidification.
Pat….if you acidify a solution, are you not lowering it’s pH?
YOu are taking it from pH 7 to a lower number. However if you are NOT at 7, then all you can (at best) claim is you are neutralizing it.
Again, science 101.
David, if you lower the pH of a solution below 7, you’re acidifying it. But even pH 6 is near neutral. I wouldn’t really consider a solution functionally acidic unless it was below pH 5. Atmospheric CO2 produces rain with a pH of about 5.6. That’s considered mildly acidic.
Part of my professional research is on the blood cells of northern hemisphere sea squirts. Certain of these cells (signet ring cells) include a large vacuole with an acidic interior — pH 0 to pH 3. Now that’s acidic.
There really is no common usage term for reducing pH from, e.g., 8.2 to 8.0, or from pH 10 to pH 9. De-alkalinizing describes the process, or more conventionally, reducing pH or reducing alkalinity. But acidification? Nope.
Oops! sorry for not reading your response before posting mine. Yous is an excellent one, BTW
Pat….if you use the term “De-alkalinizing” what would you think “De-acidifying” is?
De-acidifying means to remove acid, David. In an aqueous solution process, that would mean raising the pH from below 7 to above 7.
What’s your point?
The prior point remains — the one you haven’t admitted — that “ocean acidification” is a specious label for the process of reducing pH 8.2 alkalinity by a couple of tenths of a pH unit.
SocksrAts argues pH with a chemist. Oh boy.
Get a reliable source first. Wiki is not one, and even grade school kids can tell you that.
Terminology.
Reducing the alkalinity of a basic (alkaline) solution of a basic and making it nearer pure (neutral, pH=7) water = neutralisation.
Similarly reducing the acidity of an acid solution and making it nearer pure (neutral, pH=7) water = neutralisation.
This entirely accurate and satisfactory term has been in use for a very long time.
I will leave it to others to speculate as to why the proponents of ‘OA’ didn’t choose to use the term ‘ocean neutralisation’ to describe their activities. Perhaps they felt ‘acidification’ – though technically incorrect – would get more traction among the chemically naive? Perish the thought!
“Wallace found that the levels coincide with the Pacific Decadal Oscillation”…of course it does
On the one hand they are trying claim that deep upwellings are killing oysters…
…but La Ninas do not effect pH
http://cses.washington.edu/cig/figures/pdoindex_big.gif
Thanks for providing plots with this story that make sense. CFACT reported this story along with a plot that made no sense to me at all.
Nick Stokes is a well-known apologist/defender/outright liar in the defence of AGW.
Ignore everything this jizzweasel says.
Nick is a well known apologist/defender of the AGW story, but I haven’t seen one lie of him. Do you have an example?
Ferdinand:
See exchanges at Climate Audit where Stokes is perpetually fabricating and being accused of such by many, including the blog host.
[facepalm]
Any who are interested in an meticulous analysis of paleoclimate proxies and reconstructions should see the archives at climate Audit.The work done there is of the highest quality.
The blog host, Steve McIntyre, is a recognized authority on such proxy reconstructions (tree ring, varves, corals, alkenones, etc.)
He has also thoroughly documented the fabrications in this field and the dishonesty of Michael Mann, Phil Jones, Keith Briffa, and many more such types. The archives are a “must reaf” for any who would wish to educate themselves in this field. McIntyre is one who has made a difference.
In a liberal professional world, liberal prioritizes professional. Every Time.
I’m wary of rushing to judgment here.
As Ferdinand Engelbeen points out, it matters a lot to have a consistent dataset, using the same methods at the same place for a long period. We’re used to this in evaluating atmospheric CO2 measurements. We know that they vary by place and by season, and we also know that some historical measurements of atmospheric CO2 gave absurd (and clearly wrong) results, which could even be misused to suggest that atmospheric CO2 fell sharply at times. We’re glad to have the gold-standard Mauna Loa estimates.
Perhaps Mike Wallace or someone can bring some order to the broader historical data, to demonstrate (if possible) that some subset of these data are sufficiently comparable in measurement methodology and circumstances to be suitable as a long time series. Until and unless someone actually does the legwork on this, I think we would be naive to treat the data as comparable.
I have to wonder whether Professor Feely may have had proper concerns like this in mind when he warned Wallace not to discount his own research or rush to make use of the broader data. I obviously don’t know one way or the other, but I can’t accept Wallace’s characterization of the communication between them without knowing more. Nullius in verba!
As we learned from Feynman, the easiest person to fool is yourself. We too are subject to confirmation bias. Wouldn’t we love to see another Climategate that destroys a pillar of the catastrophist narrative?
I don’t assume away the possibility of bad behavior here, but I don’t think we’ve seen enough information to conclude that it happened — or that it matters.
“I’m wary of rushing to judgment here.”
Indeed so. Wallace has some hangup on GEPH measurement. That was long known to be less reliable for measuring seawater pH. Most reliable historic data is of Total Alkalinity and Dissolved Inorganic Carbon. These are stable measurands, far more abundant than H+, and the equilibria connecting them to pH is well established. Feely is certainly not the first to prefer them.
That doesn’t explain the mafia-style utterances of Feely. Are warmist scientist all unhinged psychopaths?
If so, should we trust them with anything? Rethorical question.
DirkH, I haven’t seen the full correspondence between Wallace and Feely/Sabine. In many cases it depends of how you ask for data that triggers how the answer is formulated…
Anyway, it looks like very premature to accuse them of hiding the data, if the error bars of the historical measurements are larger than the trend you are looking for…
Repeat after me: Less alkaline, less alkaline, less alkaline.
No.. repeat after me..
no measureable change, no measurable change. !!
Just saw this on Google News:
http://www.capitalotc.com/global-warming-may-trigger-the-worst-coral-bleaching-in-16-years/26861/
“NOAA scientists suggested that global warming and increased acidity of oceanic water could put in great danger coral reefs across the planet.” Got both bad guys in the same sentence.
I guess I can imagine why people choose to read the fear, why it is “newsworthy” = reason to pour some of the good stuff. But, how do they make sense of – “Marine experts say that corals can survive several bleaching events, but they often die in the process.”?? Pour some more. Are we going to die or survive, or both? Need ice with that?
I’m encouraged that all the comments, so far, are thoroughly skeptical.
Sabine saying, in response to questioning of their “motives or quality of our science,” and adding that if he continued in this manner, “you will not last long in your career.” is a clear act of intimidation, argumentum ad hominem, and factual evasion of the question. This sort of thing is common in all science which has been reduced to the mere servant of political motives. Consensus science, argumentum ad hominem, projection of guilty motives and sponsorship, fraudulent data, models as data, and hiding of facts are all cornerstones of CAGW propaganda practice.
Freshman geology teaches students that CO2 solubility in water to create carbonic acid, a major process in dissolution of calcareous material, is strongly tied to temperature. At lower temperatures, typically during the winter months, more CO2 is dissolved in water thus raising it;s acidity. During warmer summer months, CO2 exssolves from water because higher CO2 is less stable in warmer water, and goes back into the atmosphere.
I wonder is such a process also relates to warming and cooling oceans?
A truth about oceanic geology is that in very deep water (along the oceanic floor) at cooler temperatures (~4 deg C) CaCO3 is not stable due to the higher acidity and higher concentrations of CO2. Whereas, in shallower-warmer water CO2 concentrations are less, the acidity is less, and carbonates are more stable.
I suspect that the higher concentrations of CO2 in the oceans (higher acidity) is more a a function of water temperature than atmospheric CO2 concentration.
Upwelling of deep oceanic waters along continental margins release large concentrations of CO2, as the rising water warms and CO2 stability in water diminishes releasing the gas back into the atmosphere.
Upwelling waters are also rich in phosphates, which along with the available CO2, causes large algal blooms to form along these margins. (see: the anchovy industry in Peru)
From the sun’s pov it’s always summer.
And 12 noon.
If one ocean is outgassing the other should be absorbing, eh?
No net seasonal change in CO2 or ocean ph.
“Exsolves.” One thing about WUWT, you are constantly coming across new words.
“Exsolve” is a mineralogic term having to do with the behavior of ions in the crystal lattice.
“In who’s professional world…”
Money, money, money.
Remember reading a paper about the chemistry of a river flowing out out of the Alps. The diurnal temperature changes led to changes in CO2 and therefore pH. Temperature increase and lower atmospheric pressure will lead to lower CO2 concentrations and hence pH. Acid rainfall on Calcium feldspars will lead to Ca2+ ions entering the oceans. Any increase the acid of rainfall is only likely to increase dissolution of salts from the land surface. In may parts of the tropics the seas are supersaturated with calcium carbonate leading to whitings. Any increase in acid entering the oceans is likely to lead to an increase in dissolution of calcium carbonate from the sea floor.
Any measurement of pH of the oceans to a greater accuracy of 0.1 before electric methods appears wishful thinking. Bearing mind that during the Cretaceous when vast amounts of calcium carbonate was deposited in the oceans and CO2 concentrations in the atmosphere were in the high 100s/1000s ppm , i have serious doubts about the data and the risk of any problems.
Reblogged this on Public Secrets and commented:
If true, this could be the “Climategate” moment for ocean acidification. The level of “noble cause corruption” in the climate alarmist camp is scary.
For 100’s of million years, atmospheric CO2 levels ranged between 2.000~8,000ppm and oceans were not “acidic” (average of around 7.6 pH) and teamed with life– including shellfish.
There are currently about 38,500 gigatons of carbon dissolved in the oceans as carbonic acid and about 770 gigatons of carbon as CO2 in the air. Given Henry’s gas law (50:1 ratio of ocean/air CO2 concentrations), when atmospheric CO2 levels were 2,000ppm, there were roughly 192,500 gigatons of CO2 dissolved in the oceans or 154,000 GTs more than now and the oceans were still alkaline (around 7.6 pH) and teaming with life.
Since 1750, man has emitted roughly 1,500 gigatons of carbon, which is more than 100 times less than the 154,000 GT dissolved in ancient oceans, and they were still alkaline…
It’s absurd to think man’s insignificant 1,500 GT of added carbon to the oceans since 1750 can significantly change ocean pH and make oceans uninhabitable for sea life….
Sabine is an early 21st century scientist currently officially associated with an official US government scientific organization ***. As a member of an official government scientific organization, Sabine is threatening someone outside of his organization to not look at the quality of his and his coauthor’s scientific work (paper). That is an unveiled threat to freedom and science. Where the multiple outcries of the climate focused scientific community against that behavior by Sabine and by implication the behavior of his coauthor Wallace? Shameful.
*** specifically [per Marita Noon’s articale] Dr. Christopher L. Sabine is a Director at the Pacific Marine Environmental Laboratory (PMEL)—which is part of the National Oceanic and Atmospheric Administration (NOAA). Sabine’s coauther Feely is a senior scientist with the same organization.
John
Premature termination, eh? The Nobel Prize for this should go to Al Gore’s 2006 film showing Michael Mann’s graph – which ends just short of AD2000, as global temperatures started to plateau.
“Plateau?” Then why are they saying 2014 is on track to be the warmest on record?
Who are “they”? The same “they” as in “they say”?
Yes. Must be, because you’re quoting them.
Quote someone who’s not promoting the alarmist Narrative, and you will get a different answer — an honest answer: 2014 is far from being the warmest year on record.
Good luck trying to combat reality
Yea, you do not seem to be a doing a very good job of it.
PS…..Mr dbstealey
…
Read this
http://link.springer.com/article/10.1007%2Fs00382-013-1958-7
…
Then explain to all of us why UAH and RSS don’t agree.
What record is that? The Earth is billions of years old. We have global (satellite) temperature data only since 1979. Before that there is no global temperature data.
To answer your question:”They” say that to incite fear from low information (Gruber) voters and push their political propaganda to forward their agenda.
Even if what they say is true, so what. What harm did this cause? What damage was done? 2014 saw record crop yields. How is that a bad thing?
The instrumental record.
…
But then, if you want to include proxy data, that’s another story……
SO tell us DS, where is the anus that the thermometer was inserted into the planet to take its temperature?
Or are you referring to a bunch of homogenized, averaged, and excluded readings used to create the “instrumental record”? Really? What instrument does the homogenization. Which ones does the averaging? And what instrument excludes readings?
“The instrumental record.”
Ah , that little pinprick of time.
Seriously ?
And as for the “warmest ever.” LOL..give Gavin et al enough matches, they will manage anything !!
The “pin prick” of time is enough to compare to the past 10,000 years via proxy.
…
I’m sure you can tell us all when in the past 10,000 years there has been a 0.7 degree rise in a 100 year interval.
Ah so! It is NOT the instrumental record, but an extended hokey stick that does not exist? So what other fabrications are you trying to pass off as actual data?
Socrates says 2014 is the ‘hottest year evah!!’
No, it isn’t. Far from it. Not even close. And note that I just posted a link to UAH, which also shows that 2014 is far from being the warmest year.
Therefore, reality trumps Socrates’ delusion. As usual.
OK, so you trust RSS and UAH. ???
Both use the same source data
Neither agree with one another.
..
Did you know they take the raw data from the satellite and process it using a model?
…
You trust their models?
..
Tell us why you trust atmospheric models from RSS and UAH better than thermometer data?
The instrumental record.
…
But then, if you want to include proxy data, that’s another story……
——
What global instrumental record are you referring to? And what time period?
And all of the published land surface temperature include not only proxy data, but also homogenization, TOA and various other adjustments that are basically done arbitrarily, on a whim, and without justification and proper documentation.
” that are basically done arbitrarily,”
…
Not really, they usually have a good reason for any change they make, and they publish it too
@socrates:
Satellite data is not a computer model output. It is a measurement, and it is by far the most accurate global temperature measurement.
Next, you say:
I’m sure you can tell us all when in the past 10,000 years there has been a 0.7 degree rise in a 100 year interval.
Aside from your cherry-picking of ‘10,000’ years, here is just one example of abrupt climate change, in which temperatures fluctuated by TENS of degrees, within only a decade or two.
Aside from the fact that that completely destroys your cAGW scare… how was the play, Mrs Lincoln?
dbstealey
…
The data that RSS and UAH use are from the AMSU’s on board several different satellites.
…
They measure microwave energy, not temperature.
Both RSS and UAH use atmospheric models to convert the microwave brightness readings into temperature data.
“One of our greatest assets is Remote Sensing Systems’ atmospheric radiative transfer model (RTM) for the ocean surface and intervening atmosphere.”
…
reference: http://www.remss.com/about/who-we-are
Ah! So you merely fabricated again. They are not from the same “source”. One has to wonder if you are capable of discerning reality.
It is bad when you call yourself a liar.
dbstealey
..
Your “abrupt change” is for a measurement on the Greenland ice sheet.
..
There is no corresponding change in the ice core record for Antarctica, therefore that “abrupt change” was not global
@d. socrates:
By your failed argument we can discount GRACE, and plenty of other satellite measurements — not to mention the wildly inaccurate ocean pH measurements that the lunatics are now trying to hang their collective hats on.
And I notice you never respond when your very weak arguments are thoroughly annihilated, which happens regularly. In fact, that just happened again, with your bogus, cherry-picked claim that the extremely *tiny* 0.7ºC fluctuation in global T over the past 150 years is, like, scary. That claim has been completely debunked by the real world. Score another win for skeptics. One of these years the alarmist cult might win an argument. But they haven’t yet.
Only in the crazed mind of a climate alarmist is a 0.7º blip over a century and a half something to be scared of. Rational folks larf at claims like that. But since you want to believe that tiny fluctuation is a problem, have at it. That’s just your confirmation bias at work. The rest of us know better.
socrates says:
“abrupt change” was not global
And how would you know that??
You wouldn’t, and you don’t. You have zero understanding of thermodynamics, if you believe that a giant-sized part of the planet changed T by twenty degrees centigrade (20ºC), but the rest of the planet remained unchanged at the same T.
Better go back to school, ‘socrates’. Start at the 5th grade. They already know more than you.
” that are basically done arbitrarily,”
…
Not really, they usually have a good reason for any change they make, and they publish it too.
————
Really? That’s news to me.
Please provide links to the original (unaltered) HadCRUT and GISS data and the documentation for all of the revisions that have been done over the years?
You can’t, because this information does not exist. Phil Jones publicly admitted this.
GRACE isn’t measuring microwave emissions.
There is no current satellite measurement of pH of the oceans.
…
If you think that 0.7 degrees is an “extremely *tiny* ” ” fluctuation ….I would ask you to show us when in the past 10,000 years we have had a 0.7 degree global temperature change. I will emphasize “global” because your single point data of the Greenland ice cap doesn’t represent global temperature.
…
Please note that 100 years for a 0.7 degree change over the course of 10,000 years represents a time interval of 1% meaning the other 99% didn’t have a change…..or in other words withing about 3-sigma variance.
.7 degrees in a year is not “tiny”. .7 degrees in 150 years is as it is below the accuracy of the current instruments to measure on an annual basis.
Science 101
Reg….. using the word “arbitrary” is your call, I don’t need to provide you with any evidence, you need to do so if you wish to use that word.
socrates says:
If you think that 0.7 degrees is an “extremely *tiny* ” ” fluctuation… &etc.
It is extremely tiny, and you are just deflecting again. I have easily destroyed every argument you’ve made here. All you do is deflect with something different. Face reality: the planet itself is busy debunking your nonsense.
Look at this chart, and you will see plenty of times within the past 10K years that global T has changed by far more than 0.7º.
It is just amazing how completely deluded you are. Are you posting from an asylum somewhere?
Again Mr dbstealey…..
…
You continue to use the ice cap on Greenland as a proxy for the entire global temperature.
…
That’s not too smart.
..
Besides, the Antarctic ice cores don’t correlate.
Tell us why you trust atmospheric models from RSS and UAH better than thermometer data?
___________
Surface temperature data has never been global. Land comprises about a third of the Earth’s surface, and the distribution of surface stations is not uniform, accurate, pristine or comprehensive — even today.
If you distrust satellite data, you are basically admitting we have no global temperature data of any worth, and you may be right. But If that’s the case, AGW, Climate Change, Extreme Weather, Climate Disruption, or however you want to brand it, has no basis in reality or science.
Reg….there are a lot of buoys out there measuring temperature…so, your “one third” argument doesn’t hold
The buoys have been in place for less than 10 years. So now you are reducing the age of the planet to less than 10 years. I guess once you restrict the age down to a year, you can honestly claim that year is the hottest on record! Amazing how Alarmism work. They are more fundamental than the fundamentalists claiming the earth is only 6000 years old!
Reg Nelson,
Trying to explain this subject to ‘socrates’ is like trying to teach a dog algebra. It just doesn’t work.
Socks says:
You continue to use the ice cap on Greenland as a proxy for the entire global temperature.
See what I mean? If thermodynamics worked like ‘socrates’ believes, we could keep a bowl of ice cubes on the kitchen table and they would never melt.
Socrates asked for an example of global change in T that was larger than the current *very* mild 0.7ºC. I provided it. But as usual, he nitpicks everything because his Belief requires him to.
Really, socrates’ lack of understanding is epic. If one very large part of the globe [Greenland] is twenty degrees centigrade colder or warmer than the rest of the globe, temperatures will even out over time. The laws of thermodynamics require it. You cannot have one continent-sized area be 20ºC warmer than another, and remain that way.
David, the accuracy of the instrumental record almost certainly isn’t better than (+/-)0.5 C (869 kb pdf). The entire field systematically neglects systematic measurement error. They assume it’s random. It’s a huge mistake, and that’s being charitable.
With that level of uncertainty, how is it possible to assign hotter or cooler years?
Reg….. using the word “arbitrary” is your call, I don’t need to provide you with any evidence, you need to do so if you wish to use that word.
—-
You claimed the adjustments were well documented. I know for a fact they are not. I challenged you to provide proof of this, which you haven’t, and cannot.
Many, if not most, of these adjustments were done by computer algorithms, which are by design, are arbitrary.
“See what I mean? ”
…
All you need to do Mr dbstealey is show the correlation between the Greenland ice core data with the Antarctic ice core data.
..
The problem is that the drastic changes you point to in Greenland did not happen in Antarctica.
..
Therefore, your single geographic point data does not represent global phenomena
Pat…. ” were done by computer algorithms, which are by design, are arbitrary..”
…
Citation?
David Socrates December 23, 2014 at 8:28 pm
Reg….there are a lot of buoys out there measuring temperature…so, your “one third” argument doesn’t hold.
——-
ARGO has only been around since 2005, and only includes 3,750 floats, which are not fixed in position, which means comparative data doesn’t exist.
Not talking about ARGO
…
Buoys
…
http://www.ndbc.noaa.gov/
David Socrates December 23, 2014 at 8:41 pm
” were done by computer algorithms, which are by design, are arbitrary..”
…
Citation?
From the NASA GISS site: http://data.giss.nasa.gov/gistemp/FAQ.html
Here you go:
“Originally, only documented cases were adjusted, however the current procedure used by NOAA/NCDC applies an automated system that uses systematic comparisons with neighboring stations to deal with undocumented instances of artificial changes.”
Automated systems = computer algorithms = arbitrary adjustments.
You seem very uninformed or misinformed. Stick around, you might learn something.
D. Socrates says:
All you need to do Mr dbstealey is show the correlation between the Greenland ice core data with the Antarctic ice core data.
And if I do, will you finally go away?
You are cluttering up this thread with your lack of knowledge. I would not bother trying to educate you, because it would be like trying to teach a dog trigonometry. But for new readers who might be misdirected by your SkS talking points, I feel I must correct your misinformation — which I have done constantly, and so have several others here.
So, if I post solid evidence showing the temperature corellation between hemispheres, including Greenland and the poles, will you finally get lost? Because I can do it, no problem. You’re not the first to ask, and I have a folder of charts showing a conclusive corellation.
Deal?
David, “were done by computer algorithms, which are by design, are arbitrary,” not my comment.
Sock rat is not here to learn. It is doubtful that he can. Instead, he comes to cut and paste from SKS, HotWhoppers, etc. That is his notion of science.
D. Socrates asks:
‘I would ask you to show us when in the past 10,000 years we have had a 0.7 degree global temperature change’
Maybe never. So what? It is still a tiny change, Unusual does not necessarily mean significant.
And a change from 287.1K to 287.8K over a century is pretty insignificant, even if unusual.
IN which satellite record?
The oceans have immense buffering capability. Imagine what it would actually take to demonstrably lower the pH.
Pipette soda water (know CO2 concentration) into a container of a known specific volume of sea water until the pH meter falls. Try various temperatures from sea to shining sea. Good high school quantitative chemistry lab project. (add some qualitative rules) Cheers!
Right, you are talking a 500ml beaker, I am talking about something a bit more voluminous.
…simple algebra. Cheers!
The ocean stores 50 times more carbon dioxide than contained in the present atmosphere. So, increase the concentration of H2CO3 into your beaker of fresh sea water by 1/50th using a graduated pipette . Keep doing that until the pH decreases outside the current fluctuations or variations of sea water pH. That will indicate how many total atmospheres of CO2 (~3 x 10^12 tons) the oceans could absorb without affecting the pH. Every one knows that … 🙂 Cheers!
You need to make a differentiation between the ocean surface layer and the deep oceans. The surface layer is only ~1000 GtC, the atmosphere ~800 GtC. Exchanges are fast (1-3 years half life) and the surface layer follows the changes in the atmosphere at 10% of the change (Revelle or buffer factor).
Exchanges with the deep oceans are much slower (…
Readers who are not quite experienced in the measurement of pH should be very careful about commenting here.
There are many issues with measurement of pH in ocean waters, some physical, like depth and area coverage, some chemical like what pH is, some a mixture like whether dead/live biota should be considered, or filtered out with how fine a filter.
Briefly, there are so many known unknowns on the measurement of ocean pH, especially those from years ago, that the error limits are quite wide. They are much wider than the alleged change of pH due to CO2 dissolution.
Those who has extensive experience with glass electrodes in solutions of high ionic strength will know that reproducibility of readings from day to day was poor. It was hard to get a tenth of a pH unit to reproduce, let alone to know if it was free from bias. Therefore, there is a good argument to discard all glass electrode ocean measurements when used to show change in time series.
Many current authors do not even describe the proper definition of pH. It is not related in the first instance to the concentration of hydrogen ions (as is commonly stated) but to the activity of the hydrogen ions. The activity is related to the concentration through quite difficult relationships such as the Debye-Huckel equations (Google it). If activity is not used, there is a bias.
These days there is a tendency to estimate pH through models related to the abundance of other dissolved species, measured chemically. This also has large error margins,
In the present context of this blog, one might simply say that if we cannot understand how to sense pH adequately – and we can not – then neither can the organisms that are alleged to be threatened with the apocalypse.
@GS
I agree that in a chemically complex solution like sea water, measuring pH activity is difficult and even depends on the concentration of other ions.
How shelled marine organisms adapt to changing pH is a current topic of study. The explanation may include greater use of the bicarbonate ion or controlling pH at the organism surface.
Really excellent points, Geoff.
Right on.
There is more danger in the American diet toward self inflicted low pH (acidosis) than so called danger of anthropogenic ocean pH apocalypse. The junk medications CAGW crowd are hooked on are predominantly HCl. I suppose the act of ” dropping acid” has it’s consequence : junk science + junk chemistry. Cheers!
I would never claim to know the PH of any of my Aquarii to within 0.05 accuracy and I have spent most of the 30 years of my professional life in one area or another of Test and Measurement. I am such a test instrument geek that my step dad ( a hydrologist) bought me a Hatch PH meter for Christmas one year.
BTW, there are those who are successfully breeding Angelfish and Discus, without getting all elaborate with RO systems in the Phoenix metro area. Phoenix water has a natural PH around 8.0 to 8.5. Good management, without RO can result in an aquarium with 6.8, but 7.5 is more likely. This is far higher then the waters Discus come from! So much for organisms being particularly sensitive to minor changes in PH.
thx mod. No offent ment.
I know mine’s on the brink:
a lot of ways when compared to mainstream.
But then – truth is truth AND no one guaranties truth’s niceness’.
better with uncomfortable, shabby truth.
then with sweet, prolonged lasting lies.
Thanks WUWT, an unsinkable platform of freedom of speech + freedom of listening / learning.
Hans
Geoff Sherrington,
Thank you. They cannot measure pH accurately enough to know if there has been any long term change. All they are doing is speculating.
Geoff , you have given all of us wise advice. I often wonder what scientists in 2200 will think about the inadequacies in the current understanding of mother earth. Until they pass judgment, the sound advice for this generation is to tread lightly and accept we probably know a lot less than we think we know.
A very detailed review paper on ocean acidification over the past 300 million years as obtained from proxy data was recently published . The reference is:
The Geological Record of Ocean Acidification, B. Hönisch & many others, SCIENCE 335, p. 1058 (March 2, 2012).
Over this period, atmospheric CO2 was commonly above 500 ppm and often as high as 1500 ppm.
Ocean pH varied between 7.5 and 8.1, but was never more basic than recently. The most acidic times were ~110 and ~190 million years ago.
Although there was a general relation between pH and atmospheric CO2, the data do not permit more details.
Carbonate-shelled organisms flourished during this time. Those die-offs that occurred were usually associated with extreme events, e.g. the PETM, the KT asteroid impact, the end Triassic and end Permian mass extinctions.
The Anthropogenic Center Of The Universe IS the LAW OF THE USA.
IRS feverishly spinning the TAX wheel for 2014.
Mr. Obama calls Dr. Lizardo, “Dr. Lirzardo, Please connect the dots!”
Ha ha
I should mention, the pH of surface ocean water today exhibits a range over about 7.5 to 8.4, with an average of about 8.1.
The Anthropocene HERE, NOW, FOREVER, Real SOON.
Reblogged this on Green Jihad and commented:
A scientist named Richard Feely ignored 85 years of existing data on ocean acidification.
[snip – Epiphron Elpis is yet another David Appell sockpuppet.]
This is Obvious:
AcidGate
Far from being inappropriate to question their motives or quality of their science, it seems to be entirely appropriate. On what planet is it ok to publish modelling results without even a passing attempt to determine how these correlate with measured results!
What makes you think they made no attempt to see how their models correlated with actual data. If history tells us anything they probably did and chose to ignore it when they didn’t get the results they wanted.
The 800-yr Temp→CO2 lag tells the story. As oceans warm, an outgassing process begins. Current CO2 levels are a response to SST at the onset of the Medieval Warm Period. The oceans have about 50X the CO2 in solution that the atmosphere contains. The ocean dog wags the atmospheric tail. Human emissions are irrelevant.
Sorry Brian: wrong story. As oceans warm, there is an increase of 8 ppmv/K in the atmosphere and then it ends, no matter how much CO2 is in the oceans. It is a matter of pressure difference, not of quantities.
The 800 years is for the reaction of the deep oceans on glacial-interglacial transitions, but the reverse reaction needs several thousands of years, while small changes (< 1 K) like the MWP-LIA transition have only a lag of ~50 years and some 6 ppmv CO2 drop after the temperature drop:
http://www.ferdinand-engelbeen.be/klimaat/klim_img/law_dome_1000yr.jpg
The current 110 ppmv increase needs a 12°C ocean surface temperature increase if temperature was responsible.
Ferdinand,
I’m aware of your position and see the logic but remain sure that we don’t yet have enough information about the carbon cycle to prove that your logic is correct.
In the meantime have you considered the effect of sunlight into the top few metres of water?
Sunlight warms individual molecules and groups of molecules and so could drive off CO2 more than would be the case from a warming of the whole body of water would it not?
We see that most CO2 in the atmosphere is found above or downwind of sunny oceanic regions beneath the subtropical high pressure cells and those regions migrate latitudinally to and fro with the seasons.
Maybe you are applying Henry’s Law too simplistically?
Winds quickly drive CO2 away from the sunny regions where it is being released so it is easy to envisage Henry’s Law applying in a particular location but if the CO2 rich air is being constantly removed then more outgassing can then occur in the same region and it is not hard to envisage an accumulation of CO2 downwind or over land masses where the wind flow slows down.
I
And I don’t agree that the oice cores properly reflect past atmospheric CO2 variations so yoiur Fig 4 may well be seriously misleading.
Whenever I read alarmist nonsense on ocean acidification, I always ask the same question: “Why don’t they look at the numbers?”
If you take the current rate of CO2 absorbtion into the oceans, you will find that after a century, this will represent about one part CO2 to one million parts ocean. In other words, not a lot!!!
So let’s cut the c**p and summarise:
Feely makes a computer model of declining ocean pH in contradiction of the real data, which he with the NOAA behind him tries to suppress.
For this he gets to testify before Congress and receives a 100,000 dollar prize.
Wallace asks for the actual data and in return is given a thuggish mafia style threat from the US government.
Most posters seem surprisingly relaxed about this.
I’m not at all relaxed about this. I feel a complete sense of outrage.
This appears to be a perfect example straight out of the cherry-picker’s climate guide.
The data from 1988 onwards is an environmental extremist’s dream: it’s completely scary.
But all the data from 1900 shows there’s no overall trend. How many times have we seen this before?
And this cherry-picked data was shown to Congress?
What is particularly sickening is that this scientific fraud actually threatened Wallace.
We can only hope that this industrial scale corruption of science will eventually end and scientists will return to the task of finding the truth, rather than trying to scare us into submission. Now that really would be a great Christmas present! But I’m not holding my breath.
Chris
thanks, Chris.
Feely may be an aberration . There is a lot of Govt funding in just the UK. A large numbers of papers , presentations , etc has already appeared , and can be seen on the organisation website ;
http://www.oceanacidification.org.uk/Home
Some of it is quite sobering.
Looks to me like the rely heavily on Feely for their claims. Without his truncated data their research is meaningless. It’s the corner stone of this fraud.
Mike Waite says it’s quite “sobering”?
“Already ocean pH has decreased by about 30% and if we continue emitting CO2 at the same rate by 2100 ocean acidity will increase by about 150%, a rate that has not been experienced for at least 400,000 years”
That is cold blooded fraud.
Like this.
http://www.scilogs.de/wblogs/gallery/16/AR5_acidification.png
http://blogs.seattletimes.com/seachange/2013/09/27/ipcc-high-confidence-that-oceans-are-souring/
Fortunatley there are top notch people refuting it.
http://cliffmass.blogspot.com/2013/10/ocean-acidification-and-northwest.html
http://cliffmass.blogspot.com/2013/11/coastal-ocean-acidification-answering.html
A year-end message to the commenters here at WUWT.
Consider the exchange between dbstealey and D. Socrates. At one point dbstealey says to Socrates,
There is always talk of “trolls” and so forth, but I think that open debate is always good. As long as both sides are being honest (even if one is delusional) then there is value in the discussion. I saw nothing new in what dbstealey wrote in his several posts, but was glad to be reminded of some things and to read different ways of expressing facts to one who is laboring under the delusion of massive propaganda by the alarmist side. (has no one ever heard of Chicken Little these days?)
We will certainly never see a long written (or otherwise) debate between an alarmist like "Dr." Mann and a realist like Steve McIntyre over the issues, and I disrepair of ever seeing even lesser lights on each side squaring off in a real debate. And yet "science" is debate. When a theory is put out there, there has to be continual attempts to discredit the theory by facts, observations, logic, other theories, and all the rest. The "man in the street" does not really get to see much in the way of debate and so exchanges like the one between dbstealey and D. Socrates had value here — even if we have seen similar on other occasions.
I would like to see more freedom here to mention unpopular ideas. I am not calling for a "troll fest", but rather for everyone to attempt to engage others with facts, observations, and logic. Even if you do not change the person's mind (at least publicly) you hopefully exhibit good arguments that the rest of us might use in our own dealings with the deluded alarmists.
And finally, we all need to remember that this CAGW scare is mostly political and that our rhetoric is therefore as important as our facts — and we can all learn better debate skills.
[Formatting fixed. -w.]
… and I end the year with an unclosed tag … damn, damn, damn.
[Merry Xmas … -w.]
Unresolved tags are better than unresolved resolutions.
Merry Xmas to all the mods as well! And thank you for your year long efforts.
Seconded! Here at WUWT too, there is too much jumping to conclusions, even in this article, while nobody knows (maybe the writer knows?) the real accuracy of the historical data, which may have been too variable because of place, time and method and too inaccurate to conclude anything about a (theoretical, but based on ocean chemistry) trend of 0.1 pH unit over a century…
It is entirely possible that this is the reason that Feely e.a. only used the most recent data where fixed station data were sampled with better equipment and more frequently over a much longer period…
Anyway, a nice Christmas Eve to everybody…
Ferdinand evidently wins the prize for the right answer–see commentary at Skeptical Science!
Willis Eschenbach December 23, 2014 at 12:54 pm
Eric Worrall December 23, 2014 at 11:34 am
In my Chemistry course, acidifying meant reducing the PH of the solution – even if the solution remained alkaline at the end of that step.
In my chem course, we used titration to determine the pH of a solution. Adding acid to an alkaline solution was called “neutralization”, and not ever “acidification”.
Willis an acid-base titration is indeed neutralization because sufficient acid is added to exactly neutralize the base, chemists term acidification as the addition of acid to a solution.
My general challenge to anyone who insists that lowering the PH towards 7 is called acidification in the common lexicon is to find examples outside of “ocean acidification”. You will be hard pressed there are very few.
“in the common lexicon is to find examples outside of “ocean acidification”. You will be hard pressed there are very few.”
Blood pH is normally around 7.4. pH 7 is not viable. In between, the condition is called acidosis. And yes, if you deviate on the other side, it’s alkalosis.
That is why this pH 7 argument is so silly. pH 7 is the neutral point of a particular buffer system – H+/OH-. It’s relevant to titrating HCl with NaOH. It’s not relevant when other buffer systems dominate, as in blood or seawater. Then what counts is what side of the neutral point of that buffer you are. Carbonic acid is diprotic, which complicates. But lowering pH is always acidifying.
Wrong again. 7 is the neutral point chemically. Blood is not neutral. No one claimed it is. And assigning blood chemistry to an absolute (chemically) is like saying that you must be 5% aluminum if you are “terrestrial”.
I would say you can do better, but given your past performance I guess that is not true either.
Thanks, Phil. So your claim is that if we add a small amount of acid to an alkaline solution it’s called “acidification”, if we add a larger amount it’s called “neutralization”, and if we add even more it’s once again called “acidification”? Makes no sense.
And it didn’t work that way in my chem class. If we only added half the amount of acid needed, we wouldn’t call that “insufficient acidification”. We’d say we had done an incomplete neutralization.
It’s simple, or at least it was in 1964. Moving towards a pH of 7.0 is neutralization. Moving away from 7.0 is either acidification or akalinization.
This is also the common usage. For example, you don’t add baking soda to the top of your car battery to “alkalinize” a battery acid spill. You add it to neutralize the acid.
So on the day that people start calling that action “alkalinizing the battery acid” I’ll believe your claims. Until then … not so much …
Best regards,
w.
Good point.
One doesn’t akalinize an acid solution.
Likewise one doesn’t acidify an alkaline solution, unless one likes the emotive aspect. Some do.
Willis et al.
Meanings of some of these terms overlap. Neutralization generally means that we add acid to a base (or base to an acid) in order to produce a “neutral” solution of pH 7.0. The term acidification often means that we are moving the pH down, whatever its current value. That from a PhD chemist.
Willis,
“And it didn’t work that way in my chem class. If we only added half the amount of acid needed, we wouldn’t call that “insufficient acidification”.”
In class, you only deal with strong acids. Try titrating 1 l of 1M NaOH with acetic acid. When you’ve added a mole of HAc, the pH is about 9.4. After that, you’re adding excess acid. By any definition, that is acidifying. pH 7 is just a point along the way.
And if you move pH up, what do you call that? De-acidification? Alkalinization?
Perhaps Feely should give back his Heinz award (see link).
http://content.usatoday.com/communities/sciencefair/post/2010/09/2010-heinz-awards-announced/1#.VJSpM90MA
“For his extraordinary efforts in identifying ocean acidity as global warming’s “evil twin.””
Extraordinary indeed.
This is what appears to happen:
i) Warmer oceans drive CO2 out of the water which becomes less acidic (more alkaline) as during the 1930’s and late 20th century warmimg spells.
ii) Cooler oceans allow more CO2 to be retained by the oceans which then become more acidic (less alakaline) as during the colder spells in the early 20th century and the middle 20th century.
That is the precise opposite of the established theory of CO2 driven PH.
Such a scenario supports the Salby proposition that changes in atmospheric CO2 follow the ocean temperatures and not human emissions.
It also fits my New Climate Model which states that solar variations influence global cloudiness so as to change the proportion of solar energy that gets into the oceans to drive the climate system.
High solar activity reduces global cloudiness resulting in more solar energy entering the oceans for ocean warming and more CO2 driven out of the oceans into the atmosphere.
Low solar activity increases global cloudiness resulting in less solar energy entering the oceans for ocean cooling and more CO2 retained by the oceans and denied to the atmosphere.
The above time series chart appears to substantiate that proposition.
Stomata evidence, being a more direct proxy for atmospheric CO2 than ice cores, shows substantial atmospheric variations in CO2 and therefore supports the proposition that atmospheric CO2 amounts are actually controlled by sunlight on oceans and that the amount of sunlight varies with the level of solar activity which in turn controls global cloudiness.
How does your model account for the declining C-13/C-12 ratios over the past 150 or so years?
How can you be sure that the declinng ratio is not caused naturally ?
My Model seeks to join the dots between a plethora of observations and so far has been successful to an extent that I am driven to doubt that we are the real cause of that declining ratio.
There seems to be a dearth of information about the precise interaction between the many variables involved in the carbon cycle and the isotope effect of each component.
The proposal that the declining ratio is caused only by our emissions remains speculative and we have seen that the models based on our emissions driving CO2 and that CO2 driving temperatures are failing. That failure also casts doubt on the isotope assumption.
You have put the cart before the horse.
Observations show the C-13/C-12 ratios are in decline.
I only asked you how your model accounts for that decline. I have not made any statement as to attribute it to our emission.
..
Your model needs to account for the observations.
And note that although my Model is consistent with an oceanic cause of increased atmospheric CO2 from sunlight variations it is not dependent on such a cause.
Even if our emissions were the cause of increased atmospheric CO2 my Model still works because it reduces the effect of our CO2 to an infinitesinal circulation change compared to the much larger circulation changes induced by the variable sun and ocean cycles.
Our emissions would still only make a difference equivalent to a decade or so of natural climate change within a 1000 year natural cycle.
So, what you are saying is that the decline in the isotope ratio is cause by humans?
“I only asked you how your model accounts for that decline. I have not made any statement as to attribute it to our emission.
Your model needs to account for the observations.”
It doesn’t need to for the reason given. Most likely there is some currently unknown aspect of the carbon cycle that accounts for it.
Oh no, you are so wrong there. You have to explain what is causing the decline in the isotope ratio. It’s an observation that is not explained if the source of the increase of atmospheric CO2 comes from the oceans.
The alternative explanation that the cause of the decline is attributable to humans makes the anthropomorphic origin of the CO2 much more plausible.
David,
How do you account for increased ocean acidity (more CO2 retained) during cooling periods and decreasing acidity (less CO2 retained) during warming periods as shown in the above chart?
Whatever happens to the isotope ratio the fact is that warmer oceans hold less CO2 and colder oceans hold more CO2.
Can you explain a decrease in the C13/C12 ratio when the oceans are warming and holding less CO2?
Can you say what the ratios were at the peak of the MWP or the coldest period of the LIA?
OK… I get it…your model can’t explain the decline, and you resort to asking questions to deflect.
“Oh no, you are so wrong there. You have to explain what is causing the decline in the isotope ratio. It’s an observation that is not explained if the source of the increase of atmospheric CO2 comes from the oceans. ”
My Model is neutral as to where the CO2 comes from provided that any effect from CO2 is too small to measure.
You have raised a straw man.
No stram man raised.
…
I just pointed out to you that your model is incapable of explaining a measured observation.
“OK… I get it…your model can’t explain the decline, and you resort to asking questions to deflect.”
I don’t need to explain it for my Model to remain valid.The concept of ocean outgassing in response to more sunlight is a useful add on but not an integral component because I do not ascribe significant climate forcing to that CO2.
You need to prove the cause as anthropogenic if you wish to rebut the oceanic role. Until you know a lot more about the carbon cycle you cannot do it.
“I don’t need to explain it for my Model to remain valid.”
…
Yes, you are correct. Your model may be “valid”……but as Newton’s laws of gravitation are “valid”……as compared to Einstein’s General Relativity which are also “valid” But GR is a better model because it explains things Newton’s model can’t (i.e. Mercury’s precession)
…
The better “model” wins, and your model’s inability to explain the declining carbon isotope ratio does not invalidate it, but your model is supplanted by one that provides a better explanation of the observables.
“your model is supplanted by one that provides a better explanation of the observables.”
I’ve not seen it 🙂
There is no such thing as “ocean acidification”. The oceans have never been acid on this planet; not in 4.5 billion years.
The pH has always been present day levels, even during the K when CO2 levels were 600-1200 ppm.
The reason is simple: phytoplankton.
The limiting factor for the growth and proliferation of phytoplankton is CO2.
This is especially true for coccoliths because these have tests of calcium carbonate. Add CO2 to the atmosphere, the phytoplankton proliferate and a new equilibrium is achieved. The CO2 is simply converted at a higher rate into calcium carbonate and organic matter.
We have the Cretaceous period to demonstrate this principle for us (Cretaceous) is Latin for chalk.
Stephen, it is very simple: if your model is right, the bulk of the extra CO2 is coming from the oceans.
The 13C/12C ratio of the ocean surface is at +1 to +5 per mil δ13C, the atmosphere currently is at -8 per mil δ13C.
If you add CO2 from the oceans to the atmosphere, including the isotopic shift at the sea-air border, the per mil δ13C of the atmosphere would go up. But we see a firm decline of the 13C/12C ratio in the atmosphere, in lockstep with human use of fossil fuels…
Thus your model doesn’t fit one of the basic observations of what happens in the atmosphere and ocean surface layer (which also shows a similar decline).
The nicest theory on earth is destroyed by one simple fact…
Ferdinand,
My model is neutral as regards the actual source of the extra CO2 but would be consistent with ocean outgassing. It is also consistent with an anthropogenic cause provided the climate impact of CO2 is negligible.
I reserve my position on the issue of the isotope ratio on the basis that we do not know enough about the carbon cycle to be sure.
I find the oceanic effect persuasive enough to doubt the validity the assumption that the decline in the ratio is a result of human emissions.
Note that sunlight penetrates the ocean surface by many metres so it isn’t just the air/sea interface that one must consider.
Stephen Wilde, whatever the cause of the increase, any theory explaining a non-human cause must match all observations, not only the increase in the atmosphere…
Human emissions increased a 4-5 fold in the past 55 years. So did the sink rate in nature (wherever that might be) and so did the rise in the atmosphere. If the oceans would be the cause, they need to have increased a 4-5 fold over the past 55 years too, or they can’t dwarf the human emissions to a secondary cause of the increase in the atmosphere. But that implies a huge increase in throughput (in/out) of the atmosphere, for which is not the slightest sign. To the contrary, the residence time of any CO2 molecule slightly increased over time as result of little change in throughput in an increasing CO2 content of the atmosphere.
See what happens with the 13C/12C ratio of the atmosphere if the cause of the CO2 increase was mainly from the deep oceans, human additions and exchanges with the ocean surface and the biosphere unchanged (the orange line in the graph):
http://www.ferdinand-engelbeen.be/klimaat/klim_img/deep_ocean_air_increase_290.jpg
Stephen Wilde,
Stomata data are in no way “better” than ice core CO2 data, they are proxy’s of local CO2 levels, not like ice cores which are direct measurements of CO2 in the ancient bulk (95%) of the atmosphere, be it averaged over several years to several centuries, depending of the snow accumulation rate of the ice core.
Further, the equilibrium pCO2 between ocean surface and atmosphere shifts with 8 μatm/K that is all. Literature shows values between 4 and 17 μatm/K. Anyway, the ocean surfaces didn’t heat up with 12 K to reach the 110 ppmv extra.
Stomata are a direct reflection of CO2 in the air at the time of their growth in the region of highest CO2 namely near the ground and where it is warm enough for plant life.
Ice cores acquire CO2 from the air in regions too cold for plant life and higher up where the snow flakes form. They are then subjected to multiple melt and freeze cycles, constant changes in pressure and lateral movement. CO2 can move around within the body of the ice They are far less reliable indicators.
I don’t agree that the entire body of the oceans needs to heat up by 12C to increase CO2 by 110ppm extra.
Sunlight driving off the CO2 in a constant stream in favoured locations whilst winds remove it will cause a backlog in the CO2 cycle elsewhere and cause an accumulation in the atmosphere without a 12C rise.
Stephen, I don’t know where your (des)information about ice cores originates: the air inside snow flakes has exactly the same composition as the air surrounding it. The air in the pores of the snow in the top layer has exactly the same composition as in the atmosphere above it. At 72 meter depth (for the Law Dome ice cores) the CO2 level in average still is only 7 years older than the air at the surface. Once the pores are fully closed at that depth, there is no, none measurable migration of air/CO2 in ice cores.
That can be found in the work of Etheridge e.a. from 1996:
http://onlinelibrary.wiley.com/doi/10.1029/95JD03410/abstract
There is a theoretical migration in “warm” coastal cores, which makes that at middle depth the CO2 levels in the Siple Dome ice core are a mix over 22 years instead of 20 years. Big deal…
The difference is that local CO2 levels over land are extremely variable. Here the monthly averages for Giessen (SW Germany, semi-rural):
http://www.ferdinand-engelbeen.be/klimaat/klim_img/giessen_mlo_monthly.jpg
The red points, averaged over 1 to a few years is what the stomata data reflect.
The blue line, averaged over 10 to 560 years is what the ice core data reflect.
The red points is what is measured at one point on earth, somewhere in the 5% highly variable atmosphere, influenced by the direct neighborhood and what happened in the main wind direction of the measurement (or tree(s) in the case of stomata data)
The blue line is what is measured in 95% of the atmosphere +/- 8 pmv (seasonal), +/- 2 ppmv (yearly averages).
Given this points, in my informed opinion, the ice core data are by far superior to the stomata data, be it averaged over longer periods…
BTW, only the temperature of the ocean surface layer is important for the CO2 fluxes in and out. Any temperature change of the surface layer doesn’t give more than 8 ppmv/K change in the atmosphere. The 110 ppmv extra in the atmosphere just push more CO2 into the oceans. not reverse…
Ferdinand, the Etheridge article you cite shows the firn closure averages about 50 years at Law Dome, while the exchange rate at depth is about 10 years. That implies a 5x average. Also, I don’t see how you can pass over the fact that, 1) the atmosphere in any ice core is locally derived, not global, and 2) the ice-bubble gas is a proxy for the originating atmosphere, not a direct measurement of that atmosphere.
Further, below a certain depth, the gas bubbles disappear because of over-pressure. Unless the ice is truly a glass, rather than crystalline, the CO2 will be forced out of the ice-lattice and into the interstices. That puts CO2 into linear defects within the glacier, where salts, acids, H2O2, and organics collect. Over long times, that exposes CO2 concentrations to reaction chemistry, not to mention migration, that is generally unaccounted in ice core CO2 reconstructions. Ice core gas concentrations, including CO2, are subject to opportunistic bacterial processing, that may go undetected.
You seem to regard ice core gases as having the same stability as gas bubbles trapped in lava. They do not. Some of the difficulties and confounding factors are discussed here and here (pdfs).
I’ll add that the calibrations of near depth ice cores, reflecting recent firn closure, with measured atmospheric gases are likely to be the least affected by chemo-physical reprocessing within the glacier, and so will not give a true measure of the reliability of more ancient gases recovered at depth.
Pat Frank,
The time that the pores are open at the Law Dome is ~40 years (40 layers of summer/winter snow) until where the closing of the air bubbles start. At that moment, the average air composition is 7 years younger than the composition of the air in the atmosphere, not 20 years if it was a simple average. That is because most of the time, the pores were open enough to allow exchange of air in both directions. Migration over 40 years is more than enough to have a lot of exchange and near zero difference between atmosphere and air composition near the bottom. Except when the pores are becoming smaller and reduce the exchange rate. The pore diameter is a reverse function of the firn/ice density.
Etheridge e.a. used a firn densification model to calculate the distribution of CO2 over the total firn/ice column. He confirmed the results of that model (used for all ice cores) by measuring CO2 in the firn top down until full closing of all air bubbles.
That makes that the distribution of the gas age is much smaller than you expect from the ice age. For the two summit Law Dome ice cores about a decade, for the more downslope Law Dome ice core ~20 years (but the full period for the first two is ~150 years before rock bottom was reached, ~1000 years for the third one).
Further, the “local” CO2 at the South Pole is in the bulk of the atmosphere, which is within a few ppmv from Mauna Loa or Barrow near the North Pole, that shows the same trend and near the same levels for 95% of the atmosphere:
http://www.ferdinand-engelbeen.be/klimaat/klim_img/co2_trends_1995_2004.jpg
In contrast, look at the real local data like in Giessen above where the leave knobs base their stomata index for the next growing season on the average local CO2 levels of the current/past season.
CO2 levels in ice cores are no “proxy’s”, they are direct measurements of CO2 in ancient air, be it averaged over a period of 10 to 600 years.
Further, below a certain depth, the gas bubbles disappear because of over-pressure. Unless the ice is truly a glass, rather than crystalline, the CO2 will be forced out of the ice-lattice and into the interstices.
CO2 and air do form clathrates, but these decompose during relaxation (minimum one year conservation at -20°C after drilling). The remaining clathrates decompose under vacuum at measurement time, or surely decompose with the sublimation technique, which is used in case of isotope measurements.
Antarctic ice cores have no to little problems from (sea salt) dust, Greenland ice cores are unreliable for CO2 due to frequent acidic dust from Icelandic volcanoes which react in situ (and during abandoned wet measurement methods) with carbonates from sea salts. That makes that Greenland ice cores show frequent peaks of high (not low!) CO2.
Bacteria are detected in all ice cores, mainly where dust deposits are encountered. At an average -40°C in the Vostok ice core, they just survive, where they use an alternative carbon source: CO2 to repair any DNA damages. That is reflected in the N2O increase in the air bubbles. If all measured N2O was caused by bacterial DNA repair, then the CO2 level dropped with 0.5 ppmv over 400,000 years…
The link you provided was for the bottom layer of the Greenland ice core, where temperatures increase to near melting.
There is no measurable CO2 migration in ice cores. There is some theoretical migration in relative warm coastal ice cores, but negligible in the cold inland ice cores. If there was any appreciable CO2 migration, the eight CO2 peaks during interglacial periods should fade for each period 100,000 years back in time.
The link you give (the second link doesn’t work) shows the caveats mainly for the Greenland ice cores. For the Antarctic ice cores they explicitly say that all ice cores are within 5 ppmv of each other, despite all possible errors in the ice cores drilling, storage and measurements… Not bad compared to stomata data with their 63 ppmv range (in one core…).
My head is spinning, but I learned a lot from this thread. Thanks to all.
The peak of sunshine induced ocean alkalinity appears at around 1988 and it then began a decline.
However, the strongest El Nino was some 10 years later in 1998. The delay would be due to ocean thermal inertia.
From 1988 to 1998 there would have been a complex interaction between the ENSO cycle and the amount of sunshine entering the oceans from changes in global cloudiness.
The Earthshine project shows that the solar induced reduction in global cloudiness did not reverse until about 2000 but we see that the highest level of ocean alkalinity was around 1988.
I propose that from 1988 to 1998 the run of stronger El Nino events during that period allowed more energy out of the oceans into the atmosphere than was being injected by sunshine and so the oceans became increasingly less alkaline from 1988 to 1998.
Less strong El Ninos since 1998 have helped to flatten the decline in alkalinity but we can see that the decline remains in progress due to increased global cloudiness at a time of a less active sun and less sunshine into the oceans.
AGW proponents have mistakenly taken a natural solar/ENSO induced reduction in alkalinity between 1988 and 1998 as as an indication that increasing atmospheric CO2 was causing the reduction in alkalinity.
I suspect that it will eventually be found that ocean alkalinity follows global cloudiness which in turn follows the level of solar activity but with a delay of ten years or so due to the thermal inertia of the oceans in conjunction with the ENSO cycle.
Changes in ocean aliklinity will then influence atmospheric CO2 and plant stomata.
The ice cores being hopelessy corrupted by pressure and migration effects so that they fail to reflect the high variability of solar/ocean induced levels of atmospheric CO2.
If the sun stays quiet we should soon see the level of atmospheric CO2 stabilise and then begin a slow decline but since there is a long term lag of some 800 years shown in the historical record between temperature and CO2 amounts we may still be seeing CO2 consequences from the Mediaeval Warm Period which could skew the figures away from those expected from current solar variations.
In any event our emissions count for little or nothing and are most likely absorbed locally or regionally by the nearby biosphere which has been seen to show enhanced activity near CO2 sources (hence the use of CO2 in greenhouses).
Merry Christmas, all.
Strange,
I have communicated with a David Socrates in the past and he was nothing like this one. That one supported my basic propositions.
Is there impersonation going on?
What constitutes failure?
You’re going on holiday, the travel agent says” Hawai’s nice, Warm sunny lots to see and do. You board the plane enjoy the trip, they look after you very well. Arriving at your destination you step outside the plane but something’s not quite right. It’s freezing blowing a gale, in fact it’s a blizzard. Success? Hmmm.
As for Climate Change where are we?
The Temperature hasn’t risen, nor has the sea. Storms no more frequent or catastrophic, it snows it rains, our dams are not only full Tim but Brisbane City has been under water twice.
How on earth can anyone believe what these morons say?
It’s been a lousy trip Tim and I want my money back! Tim you convinced the pollies to spend 20 billion of our money on desalination plants in Australia that are now all mothballed. I feel a public hanging coming on.
This is what I had written on12/12/2012 2:43 PM about this scam: Why should anyone bring up sea water acidification when it isn’t happening?
It would be simple and probably nice if the earth’s climate and ocean actions could be explained with something as simple as a trace gas, carbon dioxide, that makes up .035-8% of the atmosphere and 15.1% of the ocean’s makeup but only simple people could believe such a thing. They should know just how dynamic and complex the climate is and all of the factors that affect it before making such a flawed judgment. Here are some sites to look into, if you care to. The biggest flows out of the atmosphere are photosynthesis on land and CO2 uptake by cold ocean water. These are about 30 times and 40 times respectively the flow of carbon into the atmosphere from fossil fuel burning. What follows also addresses the utterly insane allegation that CO2 is increasing the acidity of the oceans.
“The pycnocline (meaning rapid change of density) separates the surface layer of the ocean from the deep ocean. Deep ocean water has a temperature of about 3 degrees Celsius and a salinity measuring about 34-35 psu.” (What does all of this do to the ocean’s pH? Where and what depth are your pH observations taken from?)
http://www.windows2universe.org/earth/Water/deep_ocean.html
“As water travels through the water cycle, some water will become part of The Global Conveyer Belt and can take up to 1,000 years to complete this global circuit. It represents in a simple way how ocean currents carry warm surface waters from the equator toward the poles and moderate global climate.” [The Global Conveyer Belt has suddenly stopped for several speculated reason in the past and caused dramatic and rapid climate changes always to the cold side; therefore, warm is preferable to cold any day]
http://science.nasa.gov/earth-science/oceanography/ocean-earth-system/ocean-water-cycle/
“As water temperature increases, the increased mobility of gas molecules make them escape from the water, thereby reducing the amount of gas dissolved. [Could this be why warming forces the amount of CO2 in the atmosphere by hundreds years & not what the alarmist want one to believe that it is the CO2 that is causing the warming?]
http://www.seafriends.org.nz/oceano/seawater.htm
“It is thought that the carbon dioxide in the sea exists in equilibrium with that of exposed rock and bottom sediment containing limestone CaCO3 (or sea shells for that matter). In other words, that the element calcium exists in equilibrium with CO3. But the concentration of Ca (411ppm) is 10.4 mmol/l and that of all CO2 species (90ppm) 2.05 mmol/l, of which CO3 is about 6%, thus 0.12 mmol/l. Thus the sea has a vast oversupply of calcium. It is difficult therefore to accept that decalcification could be a problem as CO3 increases. To the contrary, it should be of benefit to calcifying organisms. Thus the more CO2, the more limestone is deposited. This has also been borne out by measurements (Budyko 1977).” [maybe, just maybe as with so many things in nature, this is a self-regulating factor that has been taking care of the ocean’s pH without humans having one thing to do with it]
http://www.seafriends.org.nz/issues/global/acid.htm
It would appear that the alarmist worries about acidic oceans is pointless since where is the base line since the pH scale didn’t exist before the concept of p[H] was first introduced by Danish chemist Søren Peder Lauritz Sørensen at the Carlsberg Laboratory in 1909?
I made a calculation on a previous thread that if ALL the CO2 in the atmosphere immediately dissolved in the ocean, it would increase the amount of CO2 in the ocean by one ppm. Now the chemists among us can say how much of that would go to changing pH. But there simply is not enough CO2 in the atmosphere to significantly affect the amount in the ocean which is much larger.
Oh, no! It’s worse than we thought! It’s not ocean acidification, but ocean alkalization! Since ocean water is already quite alkaline, it’s way, way worse than acidification! Oceans will turn very corrosive in a decade! Many people will die! 98% of oceanic species will disappear! I need funding to research the process! /sarc
Sabine responded by saying (…) adding that if he continued in this manner, “you will not last long in your career.”
The quotation marks imply that those were Sabine’s actual words – not just an inference that could be read into what he had said
On the face of it, it is a scandal. The complete email sequence must be made public.
Reblogged this on Centinel2012 and commented:
There is still hope as we still have a few “real” scientists left in the world that look at data for the truth and don’t make the data fit an agenda not related to scienece!
it’s amazing how few people know where the C in carbonates and bicarbonates comes from…
…chemical biology is hard
Anthony writes “Interestingly, in this same general timeframe, NOAA reissued its World Ocean Database. Wallace was then able to extract the instrumental records he sought and turned the GEPH data into a meaningful time series chart, which reveals that the oceans are not acidifying.”
Ouch, so the model didn’t even try to pHit to the data.
It doesn’t have to be a “conspiracy” if every scientist is simply acting for their own benefit.
Yes, but Wallace didn’t publish the error bars of the GEpH data… If you are looking for a trend of -0.1 pH unit over a period of 100 years and your instrument is accurate to 0.1 pH unit and ocean pH can vary 0.5 pH unit (and more) at different parts of the oceans and in different seasons, any such compilation of pH data taken at different places and seasons has no meaning at all.
The Sabine/Feely series are based on better instrument data at fixed places over all seasons in the past few decades…
It is exactly the same problem as with the pre-Mauna Loa historical CO2 data: scattered all over the scale, unreliable due to accuracy of the instruments, personal skill, calibration, time and place of sampling…
Does anyone know of ANY papers that document the observed historical changes in ph before 1980?..cliff mass
It should also be known that the neutral pH point of water is not per definition 7. It’s temperature dependent. The warmer it gets the more water molecules join the ion game:
H2O OH- + H+
As the total amount of ions increase and pH is inverse logaritm, the neutral point pH value decreases. See here:
http://chemwiki.ucdavis.edu/Physical_Chemistry/Acids_and_Bases/Aqueous_Solutions/The_pH_Scale/Temperature_Dependent_of_the_pH_of_pure_Water
It’s not much, but as the oceans have warmed slightly, the pH dropped slightly without changing the acidity/alkalinity.
Happy belated Merry Christmas
So how, over the course of a few decades did “Science” decide that Carbonates now the dominating buffer system in the oceans? I know it’s been a lot of years since I studied Aquatic Chemistry, but I suspect that Silicates are still the dominating oceanic buffer system and Carbonates have only minor effects. Freshwater is entirely a different story.
I’ve got to agree that historical measurements of various ionic species are probably a better record than that of GEpH. Still, if all the records were pulled together, it ought to be possible to assess the likely pH error of those old measurements. That is, if you know the seawater composition (chlorides, silicates, carbonates, etc) you should have a very good way of estimating the “real” pH vs the measured value.
Finally, a quibble about the graph that started this entire argument. So many years ago, when I was studying aquatic chemistry, the convention was always that the small “p” was used to indicate the negative log of concentration. If we were talking about something like dissolved CO2 in terms of partial atmospheric pressure, the convention was a large “P” followed by the dissolved gas as a subscript. I got raked over the coals by my graduate advisor for making that mistake, and didn’t do it again. Equilibrium values of Pco2 and pCO2 look completely different when plotted against system pH.
1. The ten-year moving average line in the second (Wallace) chart is clearly wrong or seriously misleading. How can the average value of the last ten years exceed the highest value measured during that ten-year span?
2. Why do extremist right wingers always view scientific disputes as political or theological issues (at least since forcing Galileo to recant his position that the earth revolves around the sun)? There’s a respectable point in the underlying article, but drawing the conclusion that Obama’s climate policy might be based on fraud is as ludicrous as claiming that the Bush Administration’s failure to prevent 9/11 proves it might have conspired to cause it.
Joe,
There is a lefty commentator here [joeldshore], who constantly accuses the science-oriented readers here of being “ideologues” because he doesn’t agree with them.
That’s what your point #2 sounds like.
If you don’t think the Administration’s policy is fraud-based, then do a search for ‘John Holdren’ and ‘climate’. When you’re done reading, tell us they aren’t perpetrating fraud on the public, for their own partisan reasons.
Why do extremist left wing fanatics create religions out of bad science?
http://www.pmel.noaa.gov/scientist/dr-christopher-sabine
Note – looks like he got “special recognition” from the IPCC for the Nobel Prize. Just missed the Nobel by this 9.) much
I tried to reproduce the graph from Wallace.
Made this document to explain the process: https://docs.google.com/document/d/1ijyZwW2e_OJEwJiimgnO-UF9WF_1k_2GWfnhYThq2O0/edit?usp=sharing
Full data set from NOAA in useable format: https://drive.google.com/file/d/0B7_OTN2MylIEazY3Yzc0UHRLeXM/view?usp=sharing
I came close to it, but not quite. I am using more data, 2.43 million vs 1.5 million. Did not find information on how he cleaned and extracted the data from NOAA web site.
Comments are open on my files and here.
Thanks,
Simon
Simon, you da MAN. I can’t tell you how happy I am to see someone do what I do, that is to say, run the numbers myself. It’s the only way to truly understand what’s been done.
Your results are most interesting, keep up the good work,
w.
The name of this site has always suggested Fraud, in the sense of being junk science.
;]
Gotta love the heavy blue regression curve, where the lefthand data is much sparser than the intensive measurements at the right. So the Wassup gang seems capable of pHraud as well as anyone — but what do I know as a statistician & engineer, eh?
It’d be good to see where Wassup gets it $ too.
But, in any case, regions around the world with natural, volcanically-influenced pH around 7.8 have no sea life with shells/skeletons, so look forward to your sea slug & jellyfish servings. Your descendants might appreciate that, or they might not.
;]
Maybe Fox News would make a feed for Wassup fluff?
“Shells and skeletons” at a pH of 7.8???
Sorry to give you the good news, Doc, but the waters around Alaska are teeming with sea life and the pH there is about 7.5 … don’t know what your doctorate is in, but it’s sure not oceanic pH. There may be a Fraud here … but so far you’re the most likely contestant.
See here for details.
w.
Can anyone answer this?
I’ve ‘understood’ for a few years now that the average pH of the oceans has changed from 8.2 to 8.1 over several decades. This is where the ‘30% more acidic’ claim comes from. ie, a pH decrease of 0.1 equates to a 30% increase in H+ ion activitiy.
Surely the Feely paper is not the only source of this ‘understanding’. But is it? Is the 8.2 to 8.1 change based on other studies as well?
Hey what are you gents using to view and graph this massive data file. My Excel 2010 chokes at 1.04M lines of data and says “entire file not loaded”
Also the charts here are top notch, would like to get as good as you guys….what the hell, I am just a solar engineer.
I am using R… Start here http://www.datasciencecentral.com/profiles/blogs/r-tutorial-for-beginners-a-quick-start-up-kit
Then read my document, I give example how to load the dataset, extract info and graph.
Simon, looks like R requires a fairly steep learning curve. What do you think of the comment by DrZ….and what the heck is and IDO
The R GUI is quite unappealing. To facilitate working with R and learning its various functions I’d strongly recommend RStudio as an IDO. It’s free and quite robust as a GUI, not to mention as a way to keep your projects organized and efficient. You can learn in about a week (tops).
Yes RStudio is a must! it’s a graphical interface on top of R : http://www.rstudio.com/products/rstudio/download/
Here are some graphs from the full dataset, depth = 0, with minor corrections for the outliers.
http://oi60.tinypic.com/21do9qd.jpg
http://oi60.tinypic.com/9s7xvo.jpg
http://oi59.tinypic.com/95u0ip.jpg
The results match with the gridded result:
Berényi Péter
December 31, 2014 at 8:58 am
A preliminary look at the data shows beyond doubt, that ocean pH is decreasing indeed, at a rate of -0.002±0.038/decade. In other words, it is absolutely stable.
(5×5 deg grid boxes, monthly averages, trends computed for grid box/month combinations with at least 15 years of data – 382 such boxes were found)
If only grid boxes with at least 20 years of data are considered (204 items), ocean pH trend is -0.002±0.031/decade, therefore the null result is reasonably robust.
Berényi Péter
December 31, 2014 at 9:29 am
I have given a try to grid box / month combinations with at least 30 years of data (81 items). The result is +0.003±0.026/decade, therefore the null result is incontrovertible.
Here is the sql code for the last graph, showing the cleanup filters and calculations. Variance and deviation were calculated on the underlying data, not the average. no adjustments we made to the data.
SELECT OSD_All.Year, Avg(OSD_All.pH) AS AvgOfpH, Var(OSD_All.pH) AS VarOfpH, StDev(OSD_All.pH) AS StDevOfpH
FROM OSD_All
WHERE (((OSD_All.Year) Not In (1958,1959,1960)) AND ((([OSD_All].[pH])) GE 6 And (([OSD_All].[pH])) LE 10) AND ((OSD_All.Depth)=0)) OR (((OSD_All.Year) In (1958,1959,1960)) AND ((([OSD_All].[pH])) GE 7 And (([OSD_All].[pH])) LE 9) AND ((OSD_All.Depth)=0))
GROUP BY OSD_All.Year
ORDER BY OSD_All.Year;
My pH has been going up for a few decades now.
This shabby analysis has been debunked by Richard Telford http://quantpalaeo.wordpress.com/2014/12/26/not-phraud-but-phoolishness/
His conclusion:
“The changing geographic and seasonal patterns in data availability means that simply calculating the mean pH for each year will give all sorts of spurious trends in the analysis. Even gridding the pH data would be difficult. They are probably best used to validate model output.
Certainly, Wallace’s “compelling” analysis is junk. I hope the rest of his PhD is better than this pHoolishess.”
LOL validate model output…….WOW as if we dont already know that 97 % of all the expert climate models have failed massively…..and now they want to tweak them to show “huge increases in sea ice are predicted by man mad CO2 theories….”
my oh my
Luke,
You’re arguing that omitting data is good science…
…oh, I see. You’re quoting Richard Telford (*SNORK*).
Surely you can do better than that?