By Paul Homewood
The sharp rise in UK temperatures, which effectively began in the 1980’s, is widely known about, but, (and I may be wrong here), has never been satisfactorily explained. Indeed, I am not sure anybody from the Met Office, Hadley Centre, etc has ever seriously attempted to explain it.
Usually, whenever it is mentioned, it is brushed aside as “climate change”. I have always thought this to be nonsense, as, whatever our views of global warming theory, CO2 does not possess the magical properties that enable it to suddenly raise temperatures in such a way, thereafter followed by a decade long pause. Theory tells us that, as CO2 increases in the atmosphere, temperatures should rise gradually and steadily.

http://www.metoffice.gov.uk/climate/uk/summaries/actualmonthly
A few weeks ago, whilst checking something else, I became aware that around the same time that UK temperatures began to rise, sunshine hours also increased sharply, as the Met Office below shows. Indeed, not only did it rise, but it increased to levels well above anything seen since records start in 1929.

http://www.metoffice.gov.uk/climate/uk/summaries/actualmonthly
I naturally wondered whether there was a connection here, but was initially thrown as the largest increase in sunshine hours was during winter and spring, with little change in summer. This seemed counterintuitive, since we would normally associate bright, sunny winters with cold weather. At that stage, I filed it all away in my memory and went off to beat the wife instead.
However, in last week’s Sunday Telegraph, I came across this piece on December climate from Philip Eden, (as always, not available on line).

Now the jigsaw began to fit into place. The increase in sunshine hours, particularly during winter, was not caused by changing weather patterns but a reduction in air pollution. It is not unreasonable, then, to surmise that this increase in sunshine was, at least in part, responsible for the increase in temperatures we have seen.
As the graph below shows, there is pretty good correlation between sunshine and temperature.

http://www.metoffice.gov.uk/climate/uk/summaries/datasets
There is nothing very new in this argument, as air pollution has often been quoted as the reason for the decline in northern hemisphere temperatures during the 1960’s and 70’s. However, that logic misses the point that pollution has been a major factor since the mid 19thC. If it is true that a polluted atmosphere can depress temperatures, then these temperatures have been lower as a result for a century or more.
With a cleaner atmosphere now, temperatures have simply returned to the level they would have been at in the past.
This phenomenon of a sharp rise in late 20thC temperatures is not limited to Britain. We see the same effect across much of NW Europe, for instance France and Germany, as GISS show:


http://data.giss.nasa.gov/gistemp/station_data/
Combined with the recovery of the Atlantic Multidecadal Oscillation, from its low point in the late 1970’s, how much has reduced air pollution, and therefore more sunshine, contributed to UK and European warming in the late 20thC?
I doubt the pollution theory. For most of Europe, the change seems to be a step change in 1988. For Norway, the step change is seen most clearly as an increase in precipitation:
http://eklima.met.no/metno/trend/RRA_G0_0_1000_NO.jpg
(There’s been a jump in temperature as well, but the temperature has been more variable with the globally well-known warm period in the 30s clearly visible: http://eklima.met.no/metno/trend/TAMA_G0_0_1000_NO.jpg)
Something changed abruptly around 1988 in Europe, and I bet it had more to do with large scale weather patterns than with either CO2 or real pollution.
Yes a strong positive shift in the AO/NAO.
Large scale weather patterns (whatever you are alluding to) also have a cause!! They are not the cause itself.
Most definitely do they have a cause, Gary.
And step by step science is piercing the ignorance and misinformation that surrounds this study of climate but without, however, the help of RealClimate™ scientists.
lets see, what changed in Europe around 1988?
November 9, 1989
The Berlin Wall: The Fall of the Wall. On November 9, 1989, as the Cold War began to thaw across Eastern Europe, the spokesman for East Berlin’s Communist Party announced a change in his city’s relations with the West.
Yes, Ferd.B.,
almost immediatly followed by radical dismantling the inefficient industries in the former DDR;
accompanied / following GB’s deindustrializion by M.Thatcher. Thus
sharp reducing cloud seeding aerosols + dust particles in the midst of central europe.
____
changing patterns of precipitation:
bigger cloud formations lasting till met by masses of ‘pollutants’ / disturbances –
dust from the sahara, vegetabil pollen in spring, high traffic pollutants during vacations in summer, atmospheric disturbances in autumn, temperature drops in winter, div. volcanic activities ….
____
tilting heavy rains, flood events, even landslides.
____
contributions to the folclory of ‘heavy wether events du to climate change’.
Regards – Hans
Read
cloud / condensation
seeding aerosols + dust
particles
Thanks – Hans
something else changed. there was a drastic reduction in the number of weather stations reporting after 1985.
http://climateaudit.files.wordpress.com/2008/02/sc1985.gif
http://climateaudit.files.wordpress.com/2008/02/sc2005.gif
http://climateaudit.org/2008/02/10/historical-station-distribution/
…could be the only meaningful climate change is at UBIs…eliminate readings from “outlying” areas that argue the UBI effect is only the urban growth effect where the only warming that is significant occurs.
(meant to type UHI, not UBI….oops)
What changes abruptly around 1988 was the widespread introduction of catalytic converters to Western Europe. They had been mandated on all new vehicles in the USA 10 years earlier and warming there started about 10 years earlier. The CCs reduced cloud seeding aerosols and hence sunshine increased.
And with the catalytic converter, guess what. No more pollution from carbon monoxide, everything to CO2.
There is always something!
Surely coincidental, but high temperatures seem to be reported now in places where OCO2 measured the lowest CO2.
I wonder if there are figures like those above for somewhere such as Ireland?
It is located in a similar part of the globe and lies to the west, the predominant winds would blow British pollution away from Ireland, to leave a relatively unspoilt, if not very sunny Ireland.
Would this increase in sunshine never happen, since it never went away in the first place?
Have you ever been to Ireland? There are two types of weather; 1) its raining and 2) its gonna rain soon. I know I have a house in County Mayo…but the weather is usually fast moving alright as the Atlantic systems flash past us heading toward (mostly) the UK.. Admittedly the east of Ireland requires slightly less employment of windscreen wipers….
An amusing sidebar to your Irish weather story. IN many places (this is one) the complaint is “If You do not like the weather, wait 10 minutes and it will change”. Yet where it does not, they seem to carp about it as well.
The old adage is true! Regardless of the weather.
Both countries are surrounded by water and recently surface waters have warmed, despite deeper waters cooling, so warmer sea temperatures could be to blame.
Did UHI and bad station siting been considered? Garbage in/out? How does this trend look if looking at “Good” stations only.
If I were a climate scientist I would surely not consider an increase in sunshine having any regional affect on temperature. It would obviously be the lack of cloudy weather (which we know cloudy weather is something everyone wants) due to global warming.
Yes that is correct, before there were less clouds there was more warming causing less clouds causing the original warming and the snake ate it’s tail and that is why I am glad I am not a climate scientist.
I remember the air pollution in Northern towns in the middle 50s. On some days it was unbreathable, I felt like I was choking. Places like Bolton and Bury, and of course Manchester were awful, even at 3pm in spring or autumn, it was like night. The problem was that all house heating was through coal fires, while all factories, and there were many of them, were driven by coal fired steam engines. All those chimneys belched out huge amounts of smoke. The towns were in narrow valleys, in the Pennines, which tended to trap the smoke, while the houses were small and closely packed in. Thrifty households, and factory managers, used the cheapest, high polluting coal; the better stuff went for export or for ships boilers. We (the U.K.) had a balance of payments surplus; but at what cost to the health of the working population? Most men did not reach pension age (65) while many women lived barely beyond it.
I remember that well as I lived in ‘The smoke’ – the slang name for London. Fogs were actually yellow smogs and often 10 ft or less visibility. The the stone of major monuments and buildings in London was eaten away by suphurous smokes. This acid eroson is sitll visible in the stone of old buildings in London.
But of course this was called ‘Global Dimming’ and as caused by apitalist burning of fossil fuels and the only way to prevent a new ice age was to heavily tax use of coal and oil reducing carbon particulates in the air, and acid rain. Strange that the same cure now is recommended for prevention of global warming 😉
My mother in law tells of Glasgow smog in the late 50s, early 60s. On one day in the late 50s it was so thick and impermeable all transport stopped. They walked home several miles from the city centre in zero visibility in groups. On arriving home they discovered the dirt of the smog had penetrated right through to their underwear, which was almost black.
Paul
The Met office is well aware of the increased sunshine and the possible effects on climate. I’ve discussed this in the past with David Parker
The number of hours of sunshine in winter is very small. Also, its noticeable how often that sunny winter days are the coldest days, not the warmest. Again, if a day is sunny the night will also likely be clear and cold.
Our warm winter days tend to come with the warm wet westerly winds we all learnt about in Geography at school. These conditions can persist for some time, including at night, and push up the temperatures due to cloud cover.
However, it is clear that wind direction changes over the years, with some decades having winds predominantly coming from other directions which might warm or cool our climate. The 1730’s are a case in point when the UK noticeably warmed up.
So climatic conditions-rather than co2- could definitely have something to do with our warmer weather. Whether it is winds, sun or cloud cover however remains to be seen.It would be interesting to see if those increased sunshine hours you mention led to clear cold nights or if the clouds rolled in and warmed the nights up.
tonyb
Also, its noticeable how often that sunny winter days are the coldest days, not the warmest.
==============
that is because clear skies are normally caused by cold, dry continental air, while cloudy skies are caused by warm, moist marine air.
pollution is different. it would mostly affect the continental, reducing sunlight reaching the ground, making cold temps even colder.
That’s what puzzled me, Tony.
Sunnier days in winter should be associated with colder weather, yet the opposite has occurred.
Paul
I think it just illustrates that we still haven’t got a handle on weather, despite the millions spent on it.
Personally, I think the jet stream plays a very big part in our climate but as our knowledge of it only dates to 1945 it’s influence on our evolving climate may remain sketchy.
Tonyb
Interesting- since the mid 19th century. Yet that was then the LIA ended. The more data we get, the more questions it poses.
And as far as “went off to beat the wife instead”, I bet she took you 2 out of 3.! LOL
Yet that was then the LIA ended.
=============
since we don’t know what caused the LIA, how can we say when/if it ended? For all we know the current temps are simply a continuation of the same process that gave rise to the LIA. We simply do not know and so far climate models and climate science have not addressed the problem.
Saying the LIA ended on such and such date doesn’t make it true, no matter how many people might believe it to be true. When did the LIA start and what caused it?
I was not trying to define an end date for the LIA, only repeating the generally accepted understanding of it. I have no data to show when it started or when it ended, just historical reports of when the temperatures started a general upward trend.
“went off to beat the wife instead” Given Mr. Homewoods track record of informative and well written posts I assume this phrase has a non-literal meaning. I may be the only one (40-ish male from Canada) but a little explanation would be appreciated.
British humor.
Or even British humour 🙂
Yea, their incessant use of useless ewes is the funniest.
j/k for you Brits.
‘Fraid not. The ‘ewes’ are essential. Otherwise it would be ‘hu-more’ (without the ‘u’) rather than the (correct!) ‘hu-mur’. Same applies to ‘colour’.
Mais bien sûr! Et le plus drôle est la façon dont ils pensent que ce est à eux, mais est strictement français
[But of course ! And the funny thing is the way they think it is theirs, but is strictly French .mod]
My money’s on ‘beat’ being synonymous with ‘pester’.
Perhaps a humourous allusion to the fallicious, “Have you stopped beating your wife yet?”
At chess.
Humour as in, “when did you stop beating your wife?”
Makes me think of the GISS chart (reproduced in Michael Crichton’s novel State of Fear) showing temperatures in Punta Arenas, Chile, where air pollution presumably isn’t a large factor:
http://postimg.org/image/phn7jq10d/
The chart re rain and temp is far less of a surprise than one might think. There is very strong evidence to show there has been a significant thinning of the Atlantic ITCZ our mass, thus increased SSTs due to increased insolation. Looking at the N Atlantic SST data (as opposed to some body else’s refinement) should show the NW Atlantic current being consistent with your rendition.
Worked in the geology department at Bedford College, London as lab tech in the early sixties and the smog could darken the day like an eclipse. Your nostrils were full of black snot and your white shirt collar, inside on your neck was black (I assure you I had a [cold] shower everyday!). Much of life in London was like living inside a frosted lightbulb. Traffic had its lights on in the day and still you couldn’t see vehicles until they were a few tens of yards away. Cycling in London was probably not very popular. I like Paul’s theory. Re timing, the air began to clear up with the growing availability of natural gas for heating (coal was used when I was there) and the real enviromental consciousness began at that time during the 70s and 80s. After mid 1970s, the platinum auto catalyst reduced CO2 emissions 90% and particulate matter reduction followed.
Yeah the timing is perfect for the rise, probably even the step change. Those above who argue weather patterns are the cause of cloudiness might rethink – pollution causes cloudiness, too, as well as reducing the optical depth of the atmosphere. Of course sunshine hours are a function of weather patterns, but, it seems to me that the unexplained change in weather patterns may also be partly a function of the very thick pollution of the times and their alleviation. Paul, do the correlations for other countries that (hopefully) have sunshine hour plots of long enough duration and put a paper together. I think there will be a dramatic fit in North America. Inco’s Sudbury smelter in the 70s was, IIRC, the single largest polluter in North America (at least). It was ordered to clean up and the company by the late 70s had reduced the sulphur, etc by 98%. The moonscape around Sudbury, which was thought to be an early training ground for future Moon landings, became green again. This probably changed the local climate and weather patterns noticeably.
For detractors, think about this: it is a heck of a better fit than CO2.
The foggy days ended around 1978. I remember it very well. We had incredibly thick fog in those days where you literally couldn’t see for more than a few metres (or yards, as it was then). My mates and I nearly drove into the back of a parked lorry (truck!) on a village road late at night. I also remember driving incredibly slow up a hill one evening. That was the thickest fog I had ever seen. Then they petered out! I haven’t seen a thick fog day since then in England. So something certainly changed around 1980. I have heard that fog in London (proper) is completely unknown now.
There can vast areas of fog around Montana, Dakotas, California valleys, Central Washington/Oregon Example: http://www.krtv.com/news/freezing-fog-advisory-extended-for-parts-of-north-central-montana/
In the late 1970s, one evening after work I was driving to home through SE London to Kent. Fog was so dense I could not see more than 5-6 yards ahead. For about a mile or so along the Old Kent Rd, my then girlfriend (now wife) had to walk few yards in front of the car.
Ditto from Oxford in 1964.
“After mid 1970s, the platinum auto catalyst reduced CO2 emissions 90%…”
Close. The catalytic converter reduced CO and increased CO2 emissions.
Cheers!
I have it for you re training moon astronauts – yes they did go to Sudbury but it was largely for the widely exposed geology of the ecological wasteland as a field course.
http://www.straightdope.com/columns/read/2876/did-astronauts-train-in-ecological-wastelands-on-earth-to-get-used-to-the-barren-moon
I don’t think a 5-year running average of sunshine hours has any meaning. It warms up on a sunny day at a specific location, and the next day is a new day. Curious spurious correlation, however.
Not spurious, Barry, but actual. This is your global warming and the data is real. Nothing like it can be presented for CO2. In fact, nothing at all can presented for CO2.
Sunshine hours are part and parcel of internal feedbacks in the same (or rather opposite) manner as the cloudiness is, and it is not an easy task to disentangle what drives all the feedbacks. What we know for certain, is that most if not all of the CET warming since mid 17th century is due to the rising winter temperatures.
http://www.vukcevic.talktalk.net/MidSummer-MidWinter.htm
CET well correlates with the N. Hemispheres (R2=0.737) and the Global temperatures (R2=0.712), thus it is not (since 1880) exceptional.
I have made careful measurements in the Tropic and Subtropical Oceans and more sunshine warms the ocean and less sunshine cools the ocean. Who would have thought it?
It is always interesting how everyone jumps on a new suggestion and knocks it down in favor of their own pet theories. The truth is, that it probably is no one thing that has caused the “climate change” that we hear so much about, but a whole host of interacting actions that have created it. It’s not just CO2, it’s not just water vapor, it’s not just sunshine, it’s not just sunspots, it’s not just the Coriolis effect of thousands and thousands more toilets being flushed in the northern hemisphere, but every one of these actions MAY be part of the influences that has given rise to the warming – okay, probably not the toilet flushing. But it is sad that the first thing we see when someone suggest something different is that everyone jumps in and puts it down because it’s not what they believe. The truth is probably that there is NO ONE thing that defines climate change, but there are thousands of them instead, of which some may well be influenced by man, probably are. But to try to say it is CAUSED by any one of them is worse than stupid since there is just too much variability to hang on one element. Too bad “science” died, along with “common sense.”
Tom: Thanks for that. Could not have said it better myself. And that is the very reason the GCM’s don’t do well. Last night the weather forecast showed the jet stream over North America running south from Alaska, over the Rockies and across northern Florida before heading north again. We are getting good at seeing things as they are. Not so much as how they are going to be 10 days from now. The “Butterfly Effect” is real, but try to quantify it.
Well, off to go skiing with my kids and grand kids on the snow that my great grandchildren won’t know … 😉 ./sarc
The increase in sunlight is coincident with the introduction of compulsory smokeless fuels for domestic use, and the de-industrialisation of Britain in the 1980s onwards. Frankly, I am not surprised there has been an increase in sunlight.
However, it would be somewhat hypocritical for any Green lobby to complain about this. They were the ones campaigning for the closure of our polluting heavy industry (and sending it to China), so they can hardly complain if they have succeeded.
But on a global scale, the Green lobby has actually increased emissions. There were at least a few controls on emissions in the UK, but now these industries have relocated to China they can emit whatever they like. As usual, a Green fantasy policy has led to an increase in the destruction of the environment.
Ralph
Smokeless coal was introduced in the UK in the 1950s and mandated in the early 1960s. Too early to be the cause of the warming in the 1980s.
I think climate change has to approached on a global basis not regional.
From TOM below remark which is so correct.
The truth is, that it probably is no one thing that has caused the “climate change” that we hear so much about, but a whole host of interacting actions that have created it. It’s not just CO2, it’s not just water vapor, it’s not just sunshine, it’s not just sunspots, it’s not just the Coriolis
I would not claim to begin to really understand most of the principles governing our weather, but would not a reduction of particulates generated in (upwind) North America reduce the condensing of water vapour to form clouds crossing the Atlantic? Does vapour require a ‘nucleus’ particle to condense onto?
From a long past posting on soot levels in Greenland, I found some testing done by the Navy Weather Service. (sorry link now requres subscription)
I asked if reducing the soot levels could also lead to drought?
The problem was how to heat the droplets differentially. Dr. van Straten solved it with carbon black, which is a fluffy kind of soot whose intensely black particles, about 500.00 in diameter, accumulate radiant heat just like a blacktop road. When these particles are released in a cloud, she reasoned, the water droplets that capture one or more of them should grow warmer by absorbing sunlight, and should lose their moisture by evaporation to droplets that have stayed comparatively cool because they have captured no particles. Then the cool, fattened-up droplets should fall slowly through the cloud, growing gradually bigger by jostling small droplets and combining with them. Eventually they should grow big enough to fall from the cloud.
This system, worked out theoretically, worked like a charm in actual fact, the Navy announced last week. It was tested last July over the coast of Georgia. The usual tactic was to attach a package of 1-2 Ibs. of carbon black to a static line and toss it out of an airplane flying through the top of a cloud. When the slack snapped out of the line, the package broke open, releasing the carbon black. Seven clouds out of seven tested dissipated entirely in 2½ to 20 minutes.
When carbon black is released in moist, cloudless air the effect is opposite but no less magical. Its black particles catch sunlight and heat the air between them. The heated air rises, expands and grows colder. Some of its moisture condenses, and a new, white cloud appears in the sky. This system will not form clouds in dry air, but when the air is moist enough, it works almost every time. The official Navy attitude is that the action of carbon black is “an interesting effect” that will have to be studied a great deal more before it can be rated as a promising rainmaking agent.
http://www.time.com/time/magazine/article/0,9171,825527,00.html
Thanks for that DD.
So MAYBE we have the Yanks to thank for spreading a little sunshine over these gloomy islands.
About time we got some payback for giving them their independance! :-))
Paul,
This is a well known and researched fact, my memory is Reading University produced a paper on this a few years ago which basically concluded that some (30%) of the warming was due to increased sunshine hours, probably due to less pollution.
It also follows that looking at Met Office Climate Memorandum No 21(a spatial analysis of trends in the UK climate since 1914 using gridded datasets the record since 1910) that sunshine hours and max temperature correlate to a very high degree, (not surprising!) and that there are definite matching oscilliations.
However I did investigate further and as always the sunshine hours record is not homogeneous, different instruments and methods have been used to measure sunshine hours over the record period, so as always uncertainty intervenes.
In my view the statement made in Climate Memorandum No 21 that there is not an increasing Trend in the Temperature record till the 1980’s, indicates to me that perhaps the increasing temperature trend was only found when Scientific Consensus told us that such a trend must exist.
Studies have also shown that cloud albedo was reduced during this same interval, worldwide, resulting in more insolation. The cloud data sources show this reduced cloudiness quite clearly. Thus there are two independent processes which have increased insolation: reduced cloudiness worldwide, and reduced anthropogenic aerosols in the NH. CO2 based AGW is unsustainable and there was never any evidence for such, only _MODELS_.
Hello? Are you there?
If somebody wanted to investigate the situation in Ireland, Armagh has one of the longest weather records anywhere, going back to 1790, while the small town on Armagh has not changed to any great extent since that period.
Seemingly the data you seek on sunshine is available in Vol 10:
http://catalogue.ceda.ac.uk/uuid/2bca5457886c9352197c0fe9b7122418
You might also like the short blogspot below, which ‘hits the nail on the head’:
http://irishenergyblog.blogspot.ie/2014/12/james-joyce-and-climate-change.html
The Armagh Observatory is downwind of Armagh Town. Up until the 1990s, coal and peat were the main domestic fuels there. Peat is even smokier than coal. N Ireland was only connected to the UK gas network in 1996.
Armagh shows the same 1980s warming as elsewhere in Europe. Indicating reductions in smoke from domestic fuel consumption wasn’t the cause of the 1980s warming at Armagh.
Always keep in mind the drastic changes wrought by the introduction of computer-controlled fuel injection into automobiles, which drastically reduced emissions, and which started large scale during the 1980s and was more or less complete for most of the vehicles on the road by 2000.
I remember the early eighties in the UK and I remember (and my wife agrees) that while walking in the sunshine in the summer then, that the sun felt hotter than back in the seventies. That memory was one of the things that made me challenge the anthropogenic CO2 argument and led me to a suspicion that the clean air acts had contributed to warming in the west. Yes we actually discussed it back then. It also led me to consider how the pollution has moved to the east (China/India) since then. That is bound to have caused a perturbation in the global climate system. China is certainly smoggier than it used to be and the UK is much less smoggier (smogless).
Are the warmist powers that be honestly able to discount this type of recollection and hypothesis as a contributor to how climatehas changed, say here and in China? I very much doubt it but would love someone to provide a logical, scientifically rigorous counter argument with a corresponding empirical experience.
Thanks to John Cooknell, who has referenced the Met Office’s Climate Memorandum No21, which looked at sunshine hours, amongst other things in 2006.
On page 15, they state:
Table 12 shows the percentage change in sunshine, based on a linear trend starting from 1929. It shows that the greatest and most significant changes occurred in the winter season, when there has been an ncrease in sunshine of about 20% for central and northern England.
Sunshine has also increased in these areas by about 10% in autumn, and by 8% over the year as a whole for eastern and NE England. These increases could be a result of the Clean Air Acts of 1956 onwards, which has led to a decrease in air pollution.
http://www.metoffice.gov.uk/media/pdf/q/h/UK_climate_trends.pdf
Whether increased sunshine hours have had an effect on temperatures is a moot point. But it does seem that the phenomenon is tied in with pollution.
An anecdote from my mother. In one of the (in)famous London smogs of the 1950s, she attempted to cross the street and failed. Visibility was so poor that she was unable to find the other side of the street.
Another anecdote: I drove into Manchester in 1978. The fog was so thick that you couldn’t see the traffic lights at intersections, They had put burning oil pots in the middle of intersections so drivers knew the intersection was there.
Yes, global brightening, or surface incident solar radiation (SSR), can explain most of the warming in Europe, and across the globe, during the 1980s to 2000s period. The below papers (17) explain that there was +2 to +7 W/m-2 per decade of radiative forcing exerted on the planet mostly due to less cloud cover during that period, allowing more solar radiation to reach the surface (oceans). In contrast, the IPCC states that anthropogenic CO2 only exerted 0.3 W/m-2 per decade of radiative forcing during the 1951-2011 period. Thus, it can be said that solar forcing had 10 times more of an influence on the warming that took place in the 1980s to 2000s than anthropogenic factors did.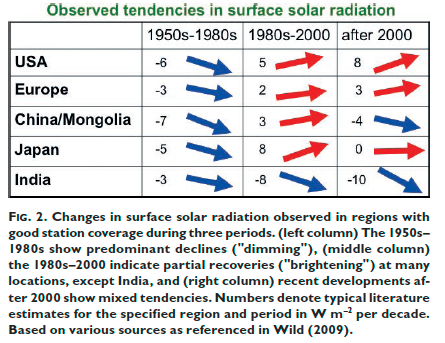
—————–
“Over the period 1951–2011 the trend in anthropogenic forcing is almost 0.3 W m–2 per decade and thus anthropogenic forcing over this period is more than 1.5 W m–2.” IPCC AR5 Chapter 8, page 699
——————
http://journals.ametsoc.org/doi/abs/10.1175/JCLI-D-12-00040.1
A pronounced summer warming is observed in Europe since the 1980s that has been accompanied by an increase in the occurrence of heat waves. The authors show that the variance of European summer temperature is partly explained by changes in summer cloudiness. Using observation-based products of climate variables, satellite-derived cloud cover, and radiation products, the authors show that, during the 1984–2007 period, Europe has become less cloudy (except northeastern Europe) and the regions east of Europe have become cloudier in summer daytime. In response, the summer temperatures increased in the areas of total cloud cover decrease and stalled or declined in the areas of cloud cover increase. Trends in the surface shortwave radiation are generally positive (negative) in the regions with summer warming (cooling or stalled warming), whereas the signs of trends in top-of-atmosphere (TOA) reflected shortwave radiation are reversed. The authors’ results suggest that total cloud cover is either the important local factor influencing the summer temperature changes in Europe or a major indicator of these changes.
—————–
ftp://bbso.njit.edu/pub/staff/pgoode/website/publications/Palle_etal_2005a_GRL.pdf
Traditionally the Earth’s reflectance has been assumed to be roughly constant, but large decadal variability, not reproduced by current climate models, has been reported lately from a variety of sources. There is a consistent picture among all data sets by which the Earth’s albedo has decreased over the 1985-2000 interval. The amplitude of this decrease ranges from 2-3 W/m2 to 6-7 W/m2 but any value inside these ranges is highly climatologically significant and implies major changes in the Earth’s radiation budget.
—————
http://www.atmos-chem-phys.net/13/8505/2013/acp-13-8505-2013.html
[T]here has been a global net decrease [of 3.6%] in 340 nm cloud plus aerosol reflectivity [which has led to] an increase of 2.7 W m−2 of solar energy reaching the Earth’s surface and an increase of 1.4% or 2.3 W m−2 absorbed by the surface [between 1979 and 2011].
—————-
http://onlinelibrary.wiley.com/doi/10.1029/2010JD015396/abstract
We find distinct patterns of dimming and brightening in the aerosol optical depth and thus clear-sky downward surface shortwave radiation (SSR) in all analyzed subregions.The strongest brightening between 1973 and 1998 under clear-sky conditions is found in mid-Europe (+3.4 W m−2 per decade [8.5 W m−2 total], in line with observations).
——————
http://onlinelibrary.wiley.com/doi/10.1002/2013JD021322/abstract
Trends in downwelling global solar irradiance were evaluated at high elevation sites on the island of Maui, Hawai‘i. Departures from monthly means were assessed for the 6-month Hawaiian wet and dry seasons over the period 1988 to 2012. Linear regression analysis was used to characterize trends in each season. For the dry season (May-October), statistically significant (p ≤0.05) positive trends of 9–18 W m-2 (3–6%) per decade were found at all four high elevation stations tested. Wet season trends were not significant, except at the highest elevation station, which had a significant negative trend. No consistent trends in aerosol concentrations have been observed at high elevations in Hawai‘i, therefore, the observed dry-season brightening is most likely the result of decreasing cloud cover. Supporting this hypothesis, analysis of 15 years (1997-2012) of high temporal resolution Geostationary Operational Environmental Satellite (GOES) imagery over the Hawaiian Islands showed a statistically significant decrease in leeward cloud cover amounting to 5–11% per decade over the stations. In addition, analysis of Moderate Resolution Imaging Spectroradiometer (MODIS) data were in general agreement with the GOES trends, although statistically significant dry-season trends were found at only one of the four stations.
——————-
http://www.sciencemag.org/content/308/5723/850.abstract
Long-term variations in solar radiation at Earth’s surface (S) can affect our climate, the hydrological cycle, plant photosynthesis, and solar power. We observed an overall increase in S [solar radiation] from 1983 to 2001 at a rate of 0.16 watts per square meter (0.10%) per year [3.04 W/m-2 total]
——————-
http://onlinelibrary.wiley.com/doi/10.1002/joc.4107/abstract
The annual sunshine duration mean time series shows a decrease from the early 1960s to the late 1970s [in Iran], in line with the widespread dimming of surface solar radiation observed during this period. By the early 1980s, there is an increase in sunshine through the end of the 20th century, aligning with a well-known and well-documented brightening period.
——————-
http://onlinelibrary.wiley.com/doi/10.1029/2008JD011290/abstract
http://ir.hfcas.ac.cn/bitstream/334002/5066/3/Observed%20decadal%20variations%20in%20surface%20solar%20radiation%20and%20their%20causes.pdf.txt
The decadal trend shown in the 5-year running mean indicates a period of rapid increase [solar radiation reaching the surface/brightening] starting in late 1930s and continuing to early 1950s with a change of 10 W m2. The dimming trend from the early 1950s to the late 1980s shows a decrease of 13 W m2. The subsequent increase starting in late 1980s is about 10 W m2 by 2005. These changes are not confined to a small number of stations in western Europe, but shared by more than 400 other sites where global irradiance has been continuously observed for more than 40 years.
——————-
http://www.sciencedirect.com/science/article/pii/S1352231014007456
Total global solar shortwave (G) irradiation and sunshine duration were recorded at nine Spanish stations located in the Iberian Peninsula. Averaged series (using the nine locations) showed a statistically significant decrease in annual G [global dimming] from 1950 to the mid 1980s (−1.7%dc−1) [-8.5 W/m2] together with a significant increase [global brightening] from the mid 1980s to 2011 (1.6%dc−1) [+8 W/m2].
——————-
http://www.atmos-chem-phys.net/14/12251/2014/acp-14-12251-2014.html
Concerning the global solar radiation, many publications agree on the existence of a solar dimming period between 1970 and 1985 and a subsequent solar brightening period (Norris and Wild, 2007; Solomon et al., 2007; Makowski et al., 2009; Stjern et al., 2009; Wild et al., 2009; Sanchez-Lorenzo and Wild, 2012). Different studies have calculated the trend in Sg after 1985. The trend in Sg [global solar radiation] from GEBA (Global Energy Balance Archive; between 1987 and 2002 is equal to +1.4 ( 3.4)Wm-2 per decade according to Norris and Wild (2007). Stjern et al. (2009) found a total change in the mean surface solar radiation trend over 11 stations in northern Europe of +4.4% between 1983 and 2003. In the Fourth Assessment Report of the IPCC (Solomon et al., 2007), 421 sites were analyzed; between 1992 and 2002, the change of all-sky surface solar radiation was equal to 0.66Wm-2 per year. Wild et al. (2009) investigated the global solar radiation from 133 stations from GEBA/World Radiation Data Centre belonging to different regions in Europe. All series showed an increase over the entire period, with a pronounced upward tendency since 2000. For the Benelux region, the linear change between 1985 and 2005 is equal to +0.42Wm-2 per year, compared to the pan-European average trend of +0.33Wm-2 per year (or +0.24Wm-2 if the anomaly of the 2003 heat wave is excluded) (Wild et al. 2009). Our trend at Uccle of +0.5 ( 0.2)Wm-2 per year (or +4% per decade) agrees within the error bars with the results from Wild et al. (2009).
——————
http://nml.yonsei.ac.kr/front/bbs/paper/rad/RAD_2005-3_Wild_et_al.pdf
A similar reversal to brightening in the 1990s has been found on a global scale in a recent study that estimates surface solar radiation from satellite data. This indicates that the surface measurements may indeed pick up a largescale signal. The changes in both satellite derived and measured surface insolation data are also in line with changes in global cloudiness provided by the International Satellite Cloud Climatology Project (ISCCP), which show an increase until the late 1980s and a decrease thereafter, on the order of 5% from the late 1980s to 2002. A recent reconstruction of planetary albedo based on the earthshine method, which also depends on ISCCP cloud data, reports a similar decrease during the 1990s. Over the period covered so far by BSRN (1992 to 2001), the decrease in earth reflectance corresponds to an increase of 6 W m-2 in absorbed solar radiation by the globe. The overall change observed at the BSRN sites, estimated as an average of the slopes at the sites in Fig. 2A, is 0.66 W m-2 per year (6.6 W m-2 over the entire BSRN period).
——————
http://onlinelibrary.wiley.com/doi/10.1002/2014JD021877/abstract
Radiative forcing in both the short and long-wave lengths reaching the Earth’s surface accounted for more than 80% of the inter-annual variations in the mean yearly temperatures measured at Potsdam, Germany during the last 120 years [1893-2012]. Three-quarters [75%] of the increase in the long-wave flux was due to changes in the water content of the lower atmosphere; the remainder [25%] was attributed to increases in CO2 and other anthropogenic, radiatively active gases. Over the period radiative forcing in the short-wave flux [solar forcing] slightly exceeded [0.76 W/m2 per decade] that in the long wave [0.64 W/m2 per decade].
——————
http://onlinelibrary.wiley.com/doi/10.1029/2008GL034842/full
The surface net radiation (surface radiation balance) is the key driver behind the global hydrological cycle. Here we present a first-order trend estimate for the 15-year period 1986–2000, which suggests that surface net radiation over land has rapidly increased by about 2 Wm−2 per decade, after several decades with no evidence for an increase. This recent increase is caused by increases in both downward solar radiation (due to a more transparent atmosphere) and downward thermal radiation (due to enhanced concentrations of atmospheric greenhouse-gases). The positive trend in surface net radiation is consistent with the observed increase in land precipitation (3.5 mmy−1 per decade between 1986 and 2000) and the associated intensification of the land-based hydrological cycle.
—————–
http://onlinelibrary.wiley.com/doi/10.1029/2008GL034228/full
SDR [shortwave downward radiation] annual mean time series [was] averaged over the eight German and the 25 Swiss sites for all-sky (all measured situations), cloud-free and cloudy periods. All-sky solar irradiance (SDR) shows positive trends from 1981 to 2005 at the German and the Swiss sites. The average increase in SDR at all stations is +2.99 [+0.52 to +5.46] W/m-2 per decade. All-sky radiation trends are largely affected by the year 2003, with strongly reduced cloudiness and hence increased shortwave radiation during the extreme summer.
——————
http://file.scirp.org/Html/22-4700327_50837.htm
The reduction in total cloud cover of 6.8% [between 1984 – 2009] means that 5.4 Wm−2 (6.8% of 79) is no longer being reflected but acts instead as an extra forcing into the atmosphere… To put this [5.4 Wm-2 of solar radiative forcing via cloud cover reduction between 1984-2009] into context, the IPCC Fifth Assessment Report…states that the total anthropogenic radiative forcing for 2011 relative to 1750 is 2.29 Wm−2 for all greenhouse gases and for carbon dioxide alone is 1.68 Wm−2. The increase in radiative forcing caused by the reduction in total cloud cover over 10 years is therefore more than double the IPCC’s estimated radiative forcing for all greenhouse gases and more than three times greater than the forcing by carbon dioxide alone [from 1750 to present].
——————-
http://journals.ametsoc.org/doi/abs/10.1175/JCLI-D-12-00482.1?journalCode=clim
Surface incident solar radiation G determines our climate and environment…Data from this summation method suggest that surface incident solar radiation increased at a rate of 6.6 W m−2/decade−1 (3.6%/ decade) from 1992 to 2002 (brightening) at selected sites.
——————-
http://journals.ametsoc.org/doi/pdf/10.1175/BAMS-D-11-00074.1
Literature estimates for the overall SSR [surface solar radiation] decline during dimming (1950s to 1980] range from 3 to 9 W m−2, and from 1 to 4 W m−2 for the partial recovery during subsequent brightening [1980s to 2000] (Stanhill and Moreshet 1992; Liepert et al. 1994; Abakumova et al. 1996; Gilgen et al. 1998; Stanhill and Cohen 2001; Alpert et al. 2005; Kvalevag and Myhre 2007; Kim and Ramanathan 2008; Wild 2009).
Paul, I believe that I have already pointed out to you that in September 1987 a drastic step change in European surface temperatures occurred. The data sets that you reference (Berlin Dahlem and Bourges have virtually identical temperature patterns, both showing a step change of about 0.7 C becoming obvious at September 1987. De Bilt, many Swiss sites, the UK, Dublin, and other places in Europe and beyond demonstrate the same thing. Since that date the site temperatures have been effectively constant. Prior to that date there is usually a slight increase, over the previous 50 or so years, but everywhere has the step change, occasionally a year later than Sept1987. I have had some correspondence with KNMI – not releasing the name yet, since I’ve not had time to write to him since he provided me with his (their) explanation for the De Bilt step that I demonstrated to him. The explanations are complex, detailed and erudite, but until I’ve had time to read the papers he sent properly I cannot possibly comment. Nevertheless, I feel it somewhat unlikely that this complex climatological stuff, directed I believe at the De Bilt discontinuity, can provide a feasible/plausible explanations for the widespread and remarkably simultaneous occurrence of steps at places hundreds of kilometers apart, and in some cases at well over 1000m altitude. However, I shall tread a bit carefully.
I like Espen’s contribution at the start of this thread, and hope to find a bit of time to look at precipitation data. It will all have to wait for two or three weeks, though.
If I knew how to post some graphics I would!
Having visited the UK many times since the 1960s until 2005, I can attest to the appalling air pollution back in the 1960s. But it has long been my contention that British weather improved immensely in the years after 1973 when Britain joined the (then) EEC. I have always surmised that it was something to do bringing british weather into line with EEC standards dictated from Brussels.
I think that as the arctic sea ice extent started to decline in september we had milder winters in the UK and Europe but if the arctic sea ice extent increases in September(I know we are told this cannot happen) then the UK and Europe will have harsher winters as we did in 60s and 70s.I was at school in the sixties and I remember the cold winters we had then.
Just wait for the AMO to turn, Don, and that’s exactly what we’ll get
Sunshine hours is usually the variable that is the most strongly coherent with station temperatures throughout the entire spectral range of frequencies. That said, however, it remains to be seen whether air pollution is the governing factor here. It’s hard to imagine it realistically exceeding natural cloudiness varaitions in the strength of its effects
You are probably right but it’s a little more complicated than that. The pollution in the atmosphere got to such a degree that once a temperature inversion had formed it would prevent penetration of sunlight for a considerable time. Hence not only did it act as a sunshine filter but it ” locked in” a temperature inversion for much longer than it should have lasted. I think this would have driven down the surface temperature average even more. Incidentally I was monitoring air quality in London in the late eighties and early nineties. I completely agree that by that time the air quality had improved to the extent that inversions broke up as soon as the meteorology allowed.
Up until the late seventies most automotive , industrial pollution and electricity generation was from soot carbon monoxide Co and sulphur The steal industry add carbon to the mix to create CO2 to stop oxygen bubbles forming. By putting catalytic converters on cars (not diesels) and precipitators on coal fired power stations , the insulating cloud has been lifted from above countries that have tried to address the problem and result more sunlight .
https://tallbloke.files.wordpress.com/2012/02/maxtempvssunshineukstudy1220112.pdf
I looked at the CET bright sunshine/max temperature for 1930 – 2010 at the above. I found a very clear relationship of cloud cover to maximum temperatures (we all know that the less clouds, the warmer the day is), with a oceanic release/absorption cycle of the AMO-PDO laid on top. Besides the conclusions (below, from the abstract) I saw that 2010 was at the end of the current cycle of warming, with a prediction of cooling in the works for Central England.
There was also a linear increase with time that could be CO2 related, but it was minimal All parameterrs were sufficiently well behaved to produce a graphically-displayed set of predictions.
Have a look:
Three factors were found to be associated with all temperature changes:
1. The duration of bright sunshine, such that C = 9.27E-3C X Sunshine hour – 0.10C. This factor was constant with time, but the changes in bright sunshine hours followed (with time) a quasi- sinusoidal pattern with indeterminate amplitude, but a peak-to-peak cycle of 62 years.
2. A quasi-sinusoidal (with time) Pacific Decadal Oscillation-Atlantic Multidecadal Occillation-like variation, with a cycle length of 56 years and amplitude of 0.31C.
3. A linear (with time), consistent increase of temperature, such that C = 9.53E-4 (Yr-1873) – 0.1425 C.
Did you consider minimum temperatures as well, Doug?
Hi, Paul,
I didn’t consider minimum temperatures because those would occur at night (unless a cold front moved in). Certainly temperatures drop with clear skies, but you would first have to break out other factors. Any weather that has clear skies will have a maximum temperature higher than one that has cloudy skies, however. Windy or calm, any of the four seasons, humidity high or low, will have warmer air on cloudless skies.
Bright sunshine I considered more reliable than sunshine hours, also, as bright sunshine has a thermal threshold (burn marks on paper, I understand), though now it may well be a digital reading. Regardless, the top end of the series is more reliably identified as the signal-to-noise ratio is much higher.
The really interesting connection I made was that deviations from the mean of bright sunshine plotted against maximum temperature readings had a discernible 3rd dimension – time. I’m sure someone could plot the thing 3-dimensionally; I had to identify each data point by hand. But the cycles became clear.
I would have liked to do something similar for an American geographic area, but did not know where the data was. I think it works for Central England because the area is small enough and the weather patterns large enough to reduce the noise portion. I expect it would work for Germany or France, but for the United States it would not in general. It might work, however, for inland Californian, Nevada and Arizona as a dry group, and the New England states as a wet group. It wouldn’t work for Rocky Mountain states or Alberta because, I expect, the natural variability is too high.
“Global” is, IMHO, a collection of regionals, the changes in which may be mathematically significant without representing more than redistribution of energy effects. I call this “computational reality” vs “representational reality”, like saying the average height of the family has risen whereas we just added a son-in-law who is a basketball player: the numbers crunch, but the “group” really isn’t any taller.
Something changed in the late 1980s?
Note that Clean Air legislation rarely states that, the minute such legislation is passed, people should cease all pollution.
More usually it mandates cleaner standards for new equipment, and then relies on natural replacement. Or alternatively it defines a date in the future when cleaner standards must be complied with. It is worth looking to see if legislation passed in the 1970s would only have had an impact some 15 years later…
“As the graph below shows, there is pretty good correlation between sunshine and temperature.”
Gasp! Who’d have thought it?
But if the reduced pollution theory is correct, then the warming is indeed man made, since it results from the Clean Air Acts passed by Parliament.
Pollution doesn’t explain the warming during Winter in the UK, but the North Atlantic Oscillation (NAO) does. During recent years since the increased sunshine hours, December has actually got slightly colder on average, one of the only month to do so.
http://www.climatedata.info/resources/Forcing/Oscillations/04-Pacific-Decadal-Oscillation-index.gif
The UK warmed during the time where the NAO become increasingly positive. Soon as this changed and the NAO become increasingly more negative, the UK temperatures failed to warm and in fact generally cooled since. This year though has been a big exception to this recent pattern.
http://www.whoi.edu/cms/images/nao_n_213433.jpeg
During the cool phase before the warming began, the above scenario occurred fairly regularly with the NAO mainly negative. In this situation the weak Atlantic storm track enables colder air to filter from the North and East often across Europe and UK. That’s why despite cloudier conditions at the time during Winter had no warming affect on winter seasons due to much colder air source from the North and East.
http://www.whoi.edu/cms/images/dfino/2006/1/scmitt_colder_n_19470.jpg
During the period when NAO become increasingly positive, the other type of scenario occurred. In this situation the strong Atlantic storm track penetrates into Europe and the UK, with frequent mixture of sunshine and showers, bands of rain, between temporary ridges of high pressure keeping it dry.The Atlantic ocean is relatively mild so these storm tracks bring the much milder temperatures with them.
I would think the likely biggest difference to increased sunshine levels on temperatures would be during Spring/Summer with warmer sun affecting temperatures much greater. Warmed seas/oceans tend to cause more cloud cover during Autumn with similar strength of sunshine to spring.
I have linked the PDO before with similar pattern towards the NAO now shown below.
http://www.climatedata.info/resources/Forcing/Oscillations/05-North-Atlantic-Oscillation.gif
Minimum temperatures don’t (usually) occur at night. They generally occur shortly after dawn when warming from solar radiation at the surface equals cooling from outgoing long wave radiation.
Which explains how increased solar radiation at the surface has a substantial effect on winter minimum temperatures, especially at higher latitudes like the UK.
Just after dawn, solar radiation travels at a low angle through the atmosphere, and for a longer period in winter, and is most affected by interference (blocking) by aerosol and particulate pollution and aerosol seeded clouds which are mainly close to the ground.
Decrease the (low level) pollution (and seeded clouds), and more early morning solar radiation reaches the ground, causing earlier and higher minimum temperatures.
I still wonder how climate scientists have managed to stay in the dark ages enough to make linear projections of future trends. I really do think that a superior method invented in 1750 has had enough time to be accepted by even them with their very conservative thinking.
The most likely trend is the continuation of the best fit curve. Using this the whole business is irrelevant and climate scientists are all in the job centre queue.
In the sixties engineers told the scientists the precise figure for the temperature increase from clean air quality and also from the imperfections of the Stevenson screen in very clean air and sunshine. We were told in no uncertain terms to go back and fix our washing machines.
It’s interesting that the greatest increase was for winter sunshine. This correlates well with our experience. The nineties were noticeably warmer. But it wasn’t so much a matter of warmer summers, it was milder winters.
There’s another correlation. The sunshine peaked at around 2000, or just before, and then fell somewhat. CET shows Central England peaking at 2000, and then rapidly cooling, although the last two years have been milder.
Global temperatures also seem to correlate well with global sunshine amounts, for example both show the same pause for roughly the last two decades.
It does seem possible that the 20th century global warming may well have been caused by increased sushine/decreased clouds. The question is, what drives changes in sunshine? Of course, Svensmark believes he has the answer.
I’m not convinced that it’s strongly linked to pollution. But wouldn’t it be a wonderful irony if it turned out that the dreaded global warming was caused by environmentalism.
Happy Christmas to everyone at WUWT!
Chris
Sunshine hours is what is being measured and the instruments used to record this have changed completely over the term of the record.
At the start of the record It was quite a simple device but in recent decades a much more complex instrument is used, corrections and adjustments have had to be made to the record to ensure comparability. My understanding is that the adjustments are made to the recent record, but I could be wrong.
There is a high correlation between sunshine hours and max temperature, i.e. the warmest years on record are the sunniest years on record, the warmest month on record (July 2006) is the sunniest on record, the sunniest April on record is also the warmest April on record etc etc.
The Met Office paper you referenced to, John, shows a strong correlation between sunshine and both max and min temps for both spring and autumn, the very seasons which show the majority of Uk warming in the last 30 yrs, and also when sunshine hours have increased considerably.
I have done some analysis here which confirms this.
http://notalotofpeopleknowthat.wordpress.com/2014/12/24/increase-in-uk-temperatures-largely-due-to-increase-in-sunshine-hours-caused-by-reduced-pollution/#more-12049
“Theory tells us that, as CO2 increases in the atmosphere, temperatures should rise gradually and steadily.”
NO it doesnt tell you that at ALL.
Theory says.
1. IF you hold all other variables constant, then adding C02 to the atmosphere will eventually lead
to a warmer planet.
It doesnt tell you how much warmer
It doesnt tell you how this evolves over time
it doesnt tell you how the warming is distributed globally.
it doesnt tell what happens when other variables are not held constant.
None of which has the slightest relevance to the post.
Interesting that someone else has spotted something strange happening in the late 80’s. I have all relevant U.K. weather reporting stations data as supplied by the Met Office, and I am diligently working through each weather stations reports. I am graphing the Max and Minimum temps recorded for each year dating back to 1965. I am also graphing the number of air frost days for the same period. I also have the sunshine hour and total rainfall for each reporting station. From the stations plotted so far, each shows a cooling of the maximum recorded temperature and a lowering of the minimum temperatures. The graphs are also showing an increase in Air Frost from the mid 1980’s. As yet, I have not found ONE reporting station showing a trend in increasing of max temperature since the mid 1980’s, the trend is for cooling. Likewise, the trend for cooling is increasing which is matched by the increase in Air Frost days. I will work through sunshine hours and rainfall in due course.
That’s just crazy to think temperatures are related to the sun…lol!
For years I’ve thought that the clean air legislation in the 80s eventually resulted in such clear skies as, for example, to cause plants to flower earlier (more light exposure) and surface temperatures to rise.
The “Clean Air Act” came into force during 1950’s and was aimed at cleaning up the air pollution in cities and industrial areas. Any clean air legislation since then was basically tinkering with what had gone before. Certainly the “Act2 of the 1950’s worked as I lived through the significant changes to air quality in one city at least Birmingham. I’m sub plotting data from the 1950’s through to 1965, interesting to see these plots compared to the 1965 to 2014 plots.
Has increased sunshine caused UK warming in the late 20th Century? I do not see how, but what we certainly do know is that carbon dioxide has not been responsible, and we know this with certainty because carbon dioxide played no role in the Roman Warm Period or the Medieval Warm Period.
The sun shines 24 hours a day, 7 days a week, and 52 weeks a year. It has done so for 4.5 billion years. Warming in the UK has happened in the past, and it will happen in the future, just as cooling will also happen in the future just as it has in the past. Such events as as certain as death.
Stop worrying about things we should not be worrying about.
t h e
d i f f e r e n c e i s :
mild, but steady ‘pollution’: mild, time spread precipitations
v e r s u s
rare, heavy weather events:
/ catastrophic outbursts /
Regards – Hans
So to EPA/PM.
As in the EU, As in the USA.
But that gets DonQuichotesque – fighting against WINDMILLS:
for people’s rights,
against the Peer’s Monopol on grinding corn, wheat.
B.Clinton:
It’s the economy, stupid!
Qui bono / follow the money /
same as it ever was. Hans
broken english. I know.
Happy New Year Anthony Watts and ALL WUWT Contributors!
Happy New Year 2015 to ALL Contributers AND Commenters!
Hans
The UK has not had a gloomy year since 1993, so thanks to carbon dioxide
– It’s sunshine from now on 🙂
The Norwegians have not been so lucky:
http://www.tellusb.net/index.php/tellusb/article/view/25897#F0005_25897
[Decadal variability of clouds, solar radiation and temperature at a high-latitude coastal site in Norway]
Matt G has it right – In the winter months the NAO dominates:
For Heathrow Decembers; the average temperature doesn’t change with the sunshine hours (slope 0.007 degrees C/Hr r2=0.001) However it increases with Hurrel’s DJFM NAO Index (slope 0.62C/Index r2=0.35) Such that the outer swing in the Index, from -5 to +5 added 6C to the temperature.