Guest Post by Bob Tisdale
From the ENSO-can-contribute-to-global-warming department, we have a new paper from the National Center for Atmospheric Research (NCAR) and the University of Arizona (UA). It’s Thompson et al. (2014) Early twentieth-century warming linked to tropical Pacific wind strength. The abstract reads:
Of the rise in global atmospheric temperature over the past century, nearly 30% occurred between 1910 and 1940 when anthropogenic forcings were relatively weak1. This early warming has been attributed to internal factors, such as natural climate variability in the Atlantic region, and external factors, such as solar variability and greenhouse gas emissions. However, the warming is too large to be explained by external factors alone and it precedes Atlantic warming by over a decade. For the late twentieth century, observations and climate model simulations suggest that Pacific trade winds can modulate global temperatures2, 3, 4, 5, 6, 7, but instrumental data are scarce in the early twentieth century. Here we present a westerly wind reconstruction (1894–1982) from seasonally resolved measurements of Mn/Ca ratios in a western Pacific coral that tracks interannual to multidecadal Pacific climate variability. We then reconstruct central Pacific temperatures using Sr/Ca ratios in a coral from Jarvis Island, and find that weak trade winds and warm temperatures coincide with rapid global warming from 1910 to 1940. In contrast, winds are stronger and temperatures cooler between 1940 and 1970, when global temperature rise slowed down. We suggest that variations in Pacific wind strength at decadal timescales significantly influence the rate of surface air temperature change.
Thompson et al. (2014) failed to mention a number of things in the abstract. (1) The multidecadal variations in trade wind strength are a result of the multidecadal variations in the dominance of El Niños versus La Niñas in the tropical Pacific (ENSO). The trade winds are weaker during multidecadal periods when El Niños dominate and they’re stronger during periods of La Niña dominance. We can see these decadal and multidecadal variations in El Niño and La Niña dominance by smoothing a sea surface temperature-based ENSO index (NINO3.4 region SST anomalies based on HADISST data) with a 121-month running-average filter.
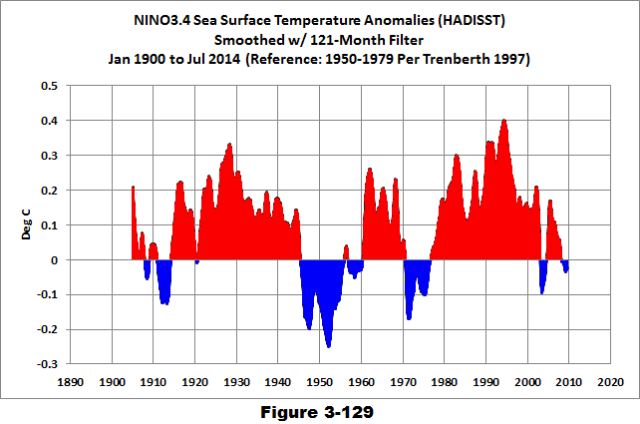
Figure 3-129 is from my upcoming book.
(2) The trade winds were once again weaker during the late 20th Century warming period, a period when El Niño events were stronger, lasted longer, and occurred more frequently than La Niña events. So, if weaker trade winds contributed to global warming during the early 20th century warming period, they also contributed to the warming since the mid-1970s.
(3) Because climate models used to hindcast surface temperatures during the 20th Century do not properly simulate the coupled ocean-atmosphere processes associated ENSO (El Niño and La Niña), and because those models do not properly simulate the “skewness” of ENSO, those climate models cannot be used for global warming attribution studies. And if they can’t be used for attribution, they have no value when projecting climate into the future.
(4) ENSO is fueled by sunlight.
The NCAR press release for Thompson et al. (2014) is Coral Reveals Long-Term Link Between Pacific Winds, Global Climate.
In the Introduction to my book Who Turned on the Heat? – The Unsuspected Global Warming Culprit, El Niño-Southern Oscillation, I wrote:
Climate models used by the Intergovernmental Panel on Climate Change (IPCC) cannot match the sea surface temperature records that show how often and how strongly ENSO events have occurred since 1900. Climate models can’t even simulate the ENSO events since the start of the recent warming period in the mid-1970s. However, the models need to be able to mimic the historical instrument-based ENSO records. In fact it’s critical that they do, and it’s easy to understand why. The strength of ENSO phases, along with how often they happen and how long they persist, determine how much heat is released by the tropical Pacific into the atmosphere and how much warm water is transported by ocean currents from the tropics toward the poles. During a multidecadal period when El Niño events dominate (a period when El Niño events are stronger, when they occur more often and when they last longer than La Niña events), more heat than normal is released from the tropical Pacific and more warm water than normal is transported by ocean currents toward the poles—with that warm water releasing heat to the atmosphere along the way. As a result, global sea surface and land surface temperatures warm during multidecadal periods when El Niño events dominate. They have to. There’s no way they cannot warm. Conversely, global temperatures cool during multidecadal periods when La Niña events are stronger, last longer and occur more often than El Niño events. That makes sense too because the tropical Pacific is releasing less heat and redistributing less warm water than normal then.
Nice to see the climate science community supporting that.
The Introduction to Who Turned on the Heat? is included in the free preview here, and the book is on sale only in pdf format here for U.S.$5.00.
[Thanks to blogger Andrew for the heads-up at WUWT here.]
Atmospheric CO2 levels, by hindward projection, are put at around 300 ppm during the lower troposphere warming trend of circa 1918-45. most AGW proponents recognize, and agree, that this level was to low for Co2 to be the cause of that warming.
The incontrovertible conclusion is that the warming during that episode is not attributable to AGW and climate sensitivity derivations that include that warming trend are fallacious.
I come to WUWT with ideas which often get me into a lot of trouble.
In the past I have number of times commented that the Enso is driven by the Pacific tectonics.
Some time ago I also published an article showing direct link between change of Earth’s rotation, known as LOD (Length of Day) and the solar magnetic activity which was vehemently attacked by Dr. Svalgaard.
Now I am just about to complete and submit another article which will not be Mr. Tisdale’s favourite. Short synopsis:
Global temperature follows the solar (magnetic) activity driven LOD. As the rate of rotation changes this induces strain between Eart’s liquid outer core and the mantle (as an experiment try to spin and compare two eggs one fresh and one boiled). Driving force manifests itself initially along the North Atlantic Ridge (directly modulating the N. Atlantic currents – AMO and and the global temperature with about 10 year dealy). The tension forces slowly drifts around the globe (see Dr. Judith Curry’s Stadium hypothesis) reaching the Pacific Ocean about 20 years later (this is positively verified by the secular changes in the Earth’s magnetic field).Lithosphere strains are reflected in the highly volatile sub-equatorial Pacific tectonics which in turn correlates well with the ENSO.
Ergo: NINO is not responsible for the global warming; it is a delayed consequence of the forces driving global warming, also reflected in the Earth’s rotation rate.
http://www.vukcevic.talktalk.net/SSN-LOD-Nino.gif
I just had debate of sorts with a Warmist over the MWP. those SUV’s must have a hidden ability to do time travel,,,,
So they must have hidden among the Model T’s, etc.
I have no doubt that ENSO (and PDO, “skewness”, whatever you want to call it) contributed to warming in both the early and late 20th century, but the real question is why were temperatures so much higher in the late than early 20th century, and why have they remained at or near record highs in the early 21st century? Are you claiming that ENSO/PDO has some kind of “additive” effect?
Barry says, “I have no doubt that ENSO (and PDO, ‘skewness’, whatever you want to call it) contributed to warming in both the early and late 20th century…”
This is a discussion of ENSO, not the PDO…if you’re referring to the classic definition of the PDO as represented by the JISAO PDO index.
Barry asked, “…why were temperatures so much higher in the late than early 20th century…”
Obviously, because there was no comparable cooling period between the early and late warming periods.
Barry asked, “…and why have they remained at or near record highs in the early 21st century?”
The better question is what mechanism would cause a decrease in surface temperatures since the early 21st century?
Barry asked, “Are you claiming that ENSO/PDO has some kind of “additive” effect?”
The effects of ENSO can be cumulative. You noted that in your opening sentence when you wrote “I have no doubt that ENSO (and PDO, ‘skewness’, whatever you want to call it) contributed to warming in both the early and late 20th century…”
The 1960-70 spell always leaves me curious. Any thoughts on it?
Second any idea why the 1945-77 cooling was less intense than the preceding 3 negative phases of the PDO?
What part of a fraction of a degree makes “temperatures so much higher”?
I don’t think that temperatures were higher in the late 20th century. 1934 was the hottest year in the 20th century, in the US.
The US is not the world, nor does it cover Nino3.4.
Whenever I see graphs coloured as in Fig 3-129, I think someone is trying to ‘fool me’, it shows 20th century all ‘flaming red’, CAGW no doubt one might say.
Choosing anomaly reference is akin to setting end points for the trend line. Moving reference to some other years band, say 1920s to 1960s lifts dividing line by 0.1C, we get more balanced image, where subjectively one could be more concerned about 1950s cooling than 1990s warming.
http://www.vukcevic.talktalk.net/Nino3-4SST.gif
vukcevic says: “Whenever I see graphs coloured as in Fig 3-129, I think someone is trying to ‘fool me’, it shows 20th century all ‘flaming red’, CAGW no doubt one might say.”
It referenced the period of 1950 to 1979, because that 30-year period was ENSO neutral…not skewed to El Nino or La Nina. And the graph was colored by me, so your assumption that is was intended to represent CAGW is obviously wrong.
The period you selected, on the other hand, is skewed to El Niño dominance.
Mr. Tisdale, thanks for taking trouble to comment.
Most of your graphs have your name below right hand corner, so I assumed it is from the Trenberth. As you can see your graph (y axes -0.3 to +0.5 C) is non-symmetrical about x –axes, so to my mind rightly or wrongly, the symmetrical graphs for anomalies make far more sense. Personally, I would referenced it to whole period under consideration, but here intention was to use the graph and scale as in the article.
Per your chart of “Long-Term ONI-Like Table Of El Niño and La Niña Events” you highlighted in a question I had on lengths of past “LaNada’s” (and thanks for the reply), I am not sure there is much difference. My count for 1919 to 1962 is 8 EN / 10 LN and 1950 to 1979 is 9 EN / 8 LN.
https://bobtisdale.wordpress.com/2010/11/30/long-term-oni-like-table-of-el-nino-and-la-nina-events/
To reinforce your low trade winds for El Nino, isn’t the trade wind pause which stops pushing the water up in the West Pacific Tropical Pool, then gravity (the water is over a meter higher) lets the water flow downhill to the East. It is the LaNada periods, when the water naturally flows north and south which heats up the higher latitude Pacific areas. Then when the El Nino comes and spreads the heat across the equatorial Pacific, the entire Pacific is warmer.
DD More, counting El Ninos and La Ninas does not take into consideration the strengths or durations of the events, which is why I smoothed the data with the 121-month filters.
Cheers.
Thoughts: All these types of things are good for doing better weather forecasting, even for general trends years in advance (call it climate forecasting if you prefer), but knowing how the energy output cycles of the sun interact with the energy receiving cycles of the earth must be seen as the basis for all forecasting.
ENSO is not a heat source but it is a way to release vast amounts of stored energy into space. It necessarily warms the atmosphere briefly as the energy released by the ocean heads for the stars and dark voids of the cosmos. Why is it (El Niño phase of ENSO) not discussed as what it is – a cooling event? ENSO overall should be energy-neutral over time for the reason mentioned; It is not a heat (energy) source.
dp says: “ENSO is not a heat source but it is a way to release vast amounts of stored energy into space.”
The energy has to come from somewhere, dp, and according to Trenberth, it comes from the sun.
dp says: “It necessarily warms the atmosphere briefly as the energy released by the ocean heads for the stars and dark voids of the cosmos.”
Your description only includes the heat released from the ocean to atmosphere during an El Nino. It overlooks the redistribution of warm water from the tropical Pacific to adjoining ocean basins, it overlooks the warming created by additional sunlight in the Atlantic and Indian Oceans during an El Nino (the results of teleconnections), and it overlooks the recharge phase of ENSO, which takes place during the La Nina phase.
dp says: “Why is it (El Niño phase of ENSO) not discussed as what it is – a cooling event?”
Because an El Nino is only a cooling event in the tropical Pacific. All of that warm water released from below the surface of the tropical Pacific by an El Nino is not consumed by the El Nino. It has to go somewhere. (That’s what Trenberth was discussing in his “travesty” email.) And then you have to factor in the heat gains in other ocean basins caused by teleconnections during El Ninos.
dp says: “ENSO overall should be energy-neutral over time for the reason mentioned…”
Your reasons were incomplete, because of your expressed misunderstandings. The instrument temperature records–sea surface temperature record and ocean heat content–disagree with you.
dp says: “…It is not a heat (energy) source.”
The sun is the ultimate heat source. La Ninas acts as the recharge phase of ENSO in the tropical Pacific, through a decrease in cloud cover there.
Yup, it is energy neutral over the long term. Adds no trend, look at the paleo data for ENSO.
cwon, paleo data are not comparable to observations-based data.
Bob says The sun is the ultimate heat source .
So you have no belief in this process Bob ? http://physicsworld.com/cws/article/news/2011/jul/19/radioactive-decay-accounts-for-half-of-earths-heat
The average depth of the ocean is about 4.5 km. and never see sunlight so why are they not frozen solid if my above link were not true ???
jmorpuss: because water reaches maximum density at 4°C/
Akatsukami:
Not sea water. Ions play a role.
Mpainter Would that be the positive sodium ion and the negative chlorine ion ? , combine these you get salt .
If you make a brine of half sea water and the other half ice it will freeze a bottle of fresh water or you soft drinks and beer. Salt water because of it’s conductivity moves electric potential around the oceans .Temperature = electric potential at work .The universe is swimming in a sea of electric potential .We use electric potential as heat to create fission While ever the electron is above absolute zero its doing work as a force carrier . .Without electric potential creating separation the universe would fall in on itself (implode) ??????
I kept my perspective on the Pacific because that is consistent with the topic (see the title). If ENSO with all its knock-on effects is to produce a change in the climate then characteristics of ENSO itself have to change over time to produce a trend. If the trend is cyclic and symmetric then ENSO and all its impacts are energy neutral. I’ve not seen anything that suggests ENSO is anything but cyclic and trendless. If that is true for everyone then ENSO affects weather but not climate.
ENSO itself is a consequence of and a dependent effect of forces acting to create it and quite likely many other effects. If those forces are changing over time in such a way to present a trend then it should be a simple thing to identify those forces and and the mechanisms by which they convert energy to force.
An energy cache is not an energy source. This is true even for very large caches. They always reach a point of balance between incoming and outgoing energy. If a cache allowed stored energy to reach the atmosphere then a great deal of that energy will leave the system. If one of the knock-on effects is to create clouds then the albedo of the system goes up.
Teleconnections to other ocean caches creates greater opportunity for the cached energy to reach the atmosphere and these teleconnections increase the effective surface area available to a pool of cached energy, it does. If this were not so the oceans would show an increasing rate of warming and expansion. That of course would suggest the rate of heat loss to the atmosphere would go up and the top of atmosphere would show increased warming on an accelerating trend. If this is so then the alarmists are right and we’re all in deep doo doo.
I’m pretty sure Trenberth is not alone in his knowledge that energy comes from the sun. There is also geothermal, of course and even energy from the entirety of our galaxy. Not much, of course, but it’s there.
dp says: “I’ve not seen anything that suggests ENSO is anything but cyclic and trendless.”
Then you haven’t looked at the ocean heat content data for the tropical Pacific.
Cheers
Considering changes in the amounts of wind, humidity, precipitation, soil moisture, ocean currents, and clouds, in addition to considering temperature, is fundamental in establishing whether energy has entered or left the ocean-atmosphere system, in the aggregate, over any length of time, very much including the past century and a half.
Ask your favorite AGW proponent what the changes in all of these rubrics have been over this period, and then when they shrug, ask them how they “know” that there has been a net increase in energy in the entire system. And then watch the hand-waving commence.
This is crucially important, and needs to be driven home again and again.
Simply put: we have not measured anywhere enough things anywhere near often enough over anywhere near a sufficient period of time to establish anything like AGW. Sorry, we haven’t.
dp says: “ENSO overall should be energy-neutral over time for the reason mentioned…”
Your reasons were incomplete, because of your expressed misunderstandings. The instrument temperature records–sea surface temperature record and ocean heat content–disagree with you.
—
Bob, could you carry this a little further? If ENSO is not energy-neutral over time, that would lead me to believe that each ENSO cycle makes the world irreversibly warmer, and therefore, it should have become much warmer than it is by now. There must be something from time to time that counters this warming or keeps it from becoming irreversible. What do you attribute that to? Is it related to whatever triggers a new ice age to occur?
Louis says: “If ENSO is not energy-neutral over time, that would lead me to believe that each ENSO cycle makes the world irreversibly warmer, and therefore, it should have become much warmer than it is by now. There must be something from time to time that counters this warming or keeps it from becoming irreversible.”
Unfortunately, we do not have reasonable sea surface temperature and ocean heat content data during periods of ocean cooling. It is therefore impossible to tell how ENSO might be different during those times.
Saying Trade winds are responsible also just makes one ask the question “what causes the trade winds to change strength?” In short, even if it is true, it doesn’t ultimately answer anything!
“The climate models used by the IPCC for attribution studies and projections of future climate cannot simulate the basic coupled ocean-atmosphere feedback in the tropical Pacific that underlies ENSO. It’s called Bjerknes feedback. It’s the positive feedback relationship between the strength of the trade winds and the surface temperature gradient (cooler in the east, warmer in the west) of the tropical Pacific. Stronger trade winds yield a larger temperature gradient. And a larger temperature gradient yields stronger trade winds. The two are interdependent, providing positive feedback to one another.”
“Bjerknes feedback”, very basically, means how the tropical Pacific and the atmosphere above it are coupled; i.e., they are interdependent, a change in one causes a change in the other and they provide positive feedback to one another. The existence of this positive “Bjerknes feedback” suggests that El Niño and La Niña events will remain locked in one mode until something interrupts the positive feedback.
From Mixed Signals from the NOAA ENSO Blog about Climate Models (Bob Tisdale, Climate Observations. December 11, 2014).
https://bobtisdale.wordpress.com/2014/12/11/mixed-signals-from-the-noaa-enso-blog-about-climate-models/
Okay, I ‘ll probably look like a dummy for asking (flashbacks of college), but what are the “something(s)” that interrupt the positive feedback? Does this share causality with the PDO?
Dawtgtomis, westerly wind bursts interrupt the positive Bjernes feedback, and initiate El Nino events. See:
https://bobtisdale.wordpress.com/2013/10/22/enso-basics-westerly-wind-bursts-initiate-an-el-nino/
And:
https://bobtisdale.wordpress.com/2014/04/07/the-201415-el-nino-part-1-the-initial-processes-of-the-el-nino/
Regards
If you came looking for the ultimate answer, about anything……
You probably won’t find it here.
You are right; there are no ultimate answers, about anything in science.
wickedwenchfan, as far as I can tell from the abstract, the premise of the paper is very basic. There is prior research that says the slowdown in global warming was caused by stronger-than-normal trade winds in the Pacific. Thompson et al. have simply turned that around and said, if strong Pacific trade winds can stop global surface warming, then weak trade winds can contribute to it.
It was what skeptics had said when the papers were published a few years ago that said that the slowdown in global warming was caused by stronger-than-normal trade winds.
wickedwenchfan December 23, 2014 at 2:39 pm said:
“Saying Trade winds are responsible also just makes one ask the question “what causes the trade winds to change strength?” In short, even if it is true, it doesn’t ultimately answer anything!”
Your right! I propose one possible answer to the question here:
http://astroclimateconnection.blogspot.com.au/2014/11/evidence-that-strong-el-nino-events-are_13.html
Although everyone knows that seawater is salty, few know that even small variations in ocean surface salinity (i.e., concentration of dissolved salts) can have dramatic effects on the water cycle and ocean circulation
http://science1.nasa.gov/earth-science/oceanography/physical-ocean/salinity/
Salt increases waters conductivity. So as simple as it seems, is this how the oceans evaporate ?.
https://www.youtube.com/watch?v=xyDdEuQafn4 by turning water back into hydrogen and oxygen.
Yep, LOD is a peculiar beast …
http://s8.postimg.org/4qvfwz677/Lod_Accel.png
… things were a little more spread out in the sixties and therefore phase changes better defined.
It is odd, but it appears that the annual geomagnetic East component changes along the N. Atlantic Ridge (as measured by number of stations in West Europe) anticipate the LOD change about 5 years ahead. The oddity is that the daily excursions of the same east component are assumed to be linked to solar activity via UV and ionosphere, currently proposed (by Dr. Svalgaard’s group and SIDC) as the most reliable metric for recalibrating historic sunspot records.
http://www.vukcevic.talktalk.net/EGMC.gif
Very speculative stuff here.
Rob, the underlying premise of the Thompson et al paper is very basic, but without access to the entire paper, I can’t say whether they propose any mechanism for slower trade winds to cause global warming.
Attention Global leaders and UNFCCC: To conserve about 40% of fuel & thereby reduce carbon emissions, to control climate change and global warming, to prevent road crash deaths and save millions of people from pollution related diseases and to reduce 80% of traffic jams, to uplift the downtrodden and reduce economic inequalities etc. for the first time in the world, I possess a WIPO approved miracle invention. So, is there anybody in the world who can help me to dedicate this PANACEA to humankind?
This is fairly terrifying. If strong trade winds have in some measure suppressed AGW for the last 15 years or so, then when the winds inevitably weaken again, the AGW effect will be amplified.
Only terrifying if you’re fairly partial to fear, uncertainty and doubt. By all means check the green man hasn’t turned red and started beeping profusely but look right, left and right again anyway. Life could ultimately depend on a bunch of old cobblers and quality shoe leather. Take life as it comes, one chunk of chaos at a time.
I don’t know if I understand precisely what you mean but I think I agree with you.
Nothing to fear except fear itself . Fears a process we use to protect us from danger. Governments use fear to change polices. When was the last time governments created change because something good happened.
Bob Tisdale in accordance with the solar activity can be seen another wave in the stratosphere.
http://cosmicrays.oulu.fi/webform/query.cgi?startday=01&startmonth=09&startyear=2014&starttime=00%3A00&endday=25&endmonth=12&endyear=2014&endtime=00%3A00&resolution=Automatic+choice&picture=on
http://www.cpc.ncep.noaa.gov/products/stratosphere/strat-trop/gif_files/time_pres_WAVE1_MEAN_OND_NH_2014.gif
When one considers what we are talking about, i.e. variations of a few tenths of a degree, it reminds me of those infamous words by Dr Richard Lindzen that will forever live on in the history books on climate change:-
“Future generations will wonder in bemused amazement that the early twenty-first century’s developed world went into hysterical panic over a globally averaged temperature increase of a few tenths of a degree, and, on the basis of gross exaggerations of highly uncertain computer projections combined into implausible chains of inference, proceeded to contemplate a roll-back of the industrial age.”