Guest Post by Bob Tisdale
Many of the visitors here at ClimateObservations and at WattsUpWithThat also spend time arguing with climate alarmists at other websites around the blogosphere. With global sea surface temperatures at record high levels in 2014, the true-blue believers in the hypothesis of human-induced global warming are out in force. This post will present data and other information to counter their claims.
INTRODUCTION
We first discussed the possibility of record high sea surface temperatures back in the June sea surface temperature update. Since then, we discussed the basic reasons for the warm global sea surfaces in many posts and, more recently, confirmed that sea surface temperatures in 2014 will likely be higher than the previous high in 1998. Examples:
- On The Recent Record-High Global Sea Surface Temperatures – The Wheres and Whys
- California Drought – A Novel Statistical Analysis of Unrealistic Climate Models and of a Reanalysis That Should Not Be Equated with Reality
- Axel Timmermann and Kevin Trenberth Highlight the Importance of Natural Variability in Global Warming…
- Meteorological Annual Mean (Dec-Nov) Global Sea Surface Temperatures Set a Record High in 2014 By a Whopping…
As discussed, the record high global sea surface temperatures in 2014 are primarily a response to a prolonged weather event in the North Pacific, like a blocking high.
JUST WHAT AGW PREDICTS
A well-known alarmist chose to leave a comment on my blog here, in which he stated:
Global SSTs at record highs… Just what AGW predicts.
I not only responded to that comment on that thread, I’ve also elected to add a model-data comparison of sea surface temperatures to the start of my monthly sea surface temperature updates, starting with the most recent one for November 2014. It reads:
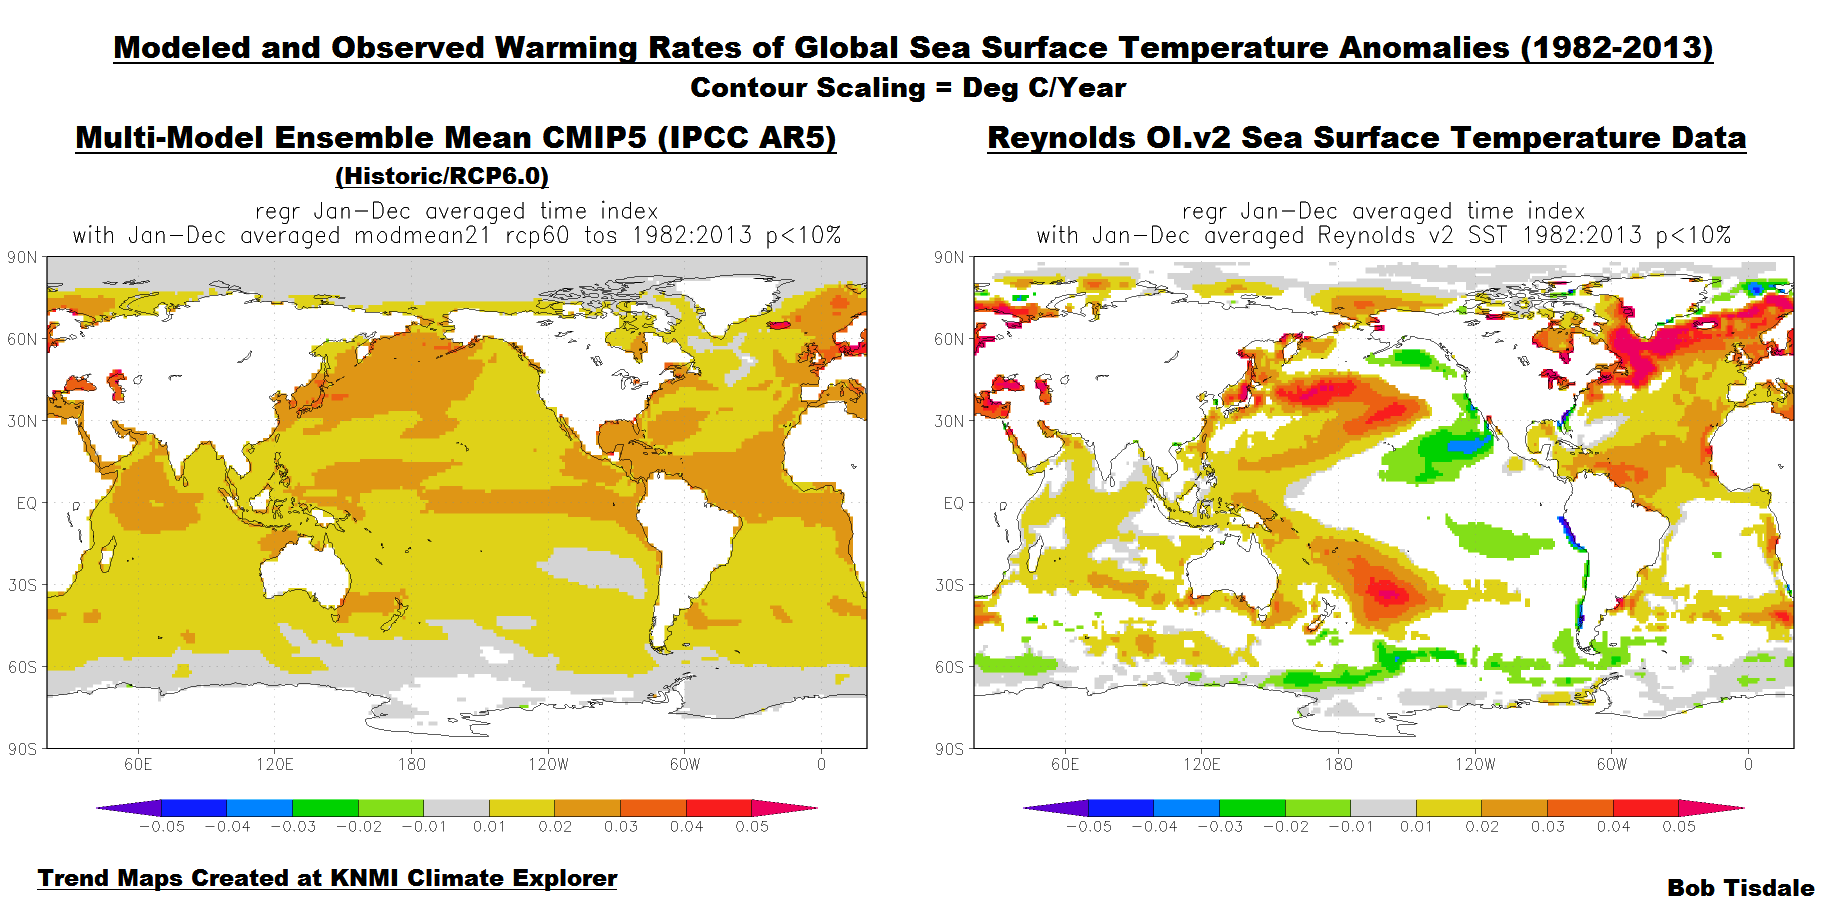
To counter the nonsensical “Just what AGW predicts” rantings of alarmists about the “record-high” global sea surface temperatures in 2014, I’m adding a model-data comparison of satellite-era global sea surface temperatures to the opening of these monthly updates. See the example below. The models are represented the multi-model ensemble-member mean of the climate models stored in the CMIP5 archive, which was used by the IPCC for their 5th Assessment Report. For further information on the use of the model mean, see the post here. For most models, historic forcings run through 2005 (2012 for others) and the middle-of-the-road RCP6.0 forcings are used after those years in this comparison. The data are represented by NOAA’s Optimum Interpolation Sea Surface Temperature data, version 2—a.k.a. Reynolds OI.v2—which is NOAA’s best. The model outputs and data have been shifted so that their trend lines begin at “zero” anomaly for the (November, 1981) start month of this dataset. That “zeroing” helps to highlight how poorly the models simulate the warming of the ocean surfaces…almost doubling the observed warming rate. Both the Reynolds OI.v2 data and the model outputs of their simulations of sea surface temperature (TOS) are available to the public at the KNMI Climate Explorer.
000 – Model-Data Comparison
Linked here is an illustration that compares maps of the simulated and observed warming rates of the global oceans from 1982 to 2013. It is from the post Maybe the IPCC’s Modelers Should Try to Simulate Earth’s Oceans. As soon as the December 2014 data are available, I will update that full-blown model-data comparison post.
[End blog reprint]
The illustration linked in the above paragraph is presented in Figure 1. As shown, the climate models used by the IPCC do not come close to replicating the observed spatial patterns of ocean warming.
Figure 1
Now, every time someone visits my website via a search engine to confirm the record high sea surface temperatures in 2014, they are first going to see that model-data comparison graph, with the pathetic model performance.
THE MODELS FAIL TO SIMULATE THE OBSERVED WARMING SPATIAL PATTERNS – WHY THAT IS IMPORTANT
The spatial patterns of ocean surface warming are one of the primary influences of climate (temperature and precipitation) on land. See the TAMU webpage The Ocean’s Influence on North American Drought.
Also see Ruiz-Barradas, et al. (2013) “The Atlantic Multidecadal Oscillation in Twentieth Century Climate Simulations: Uneven Progress from CMIP3 to CMIP5.” The full paper is here. At the beginning of their “Concluding Remarks” they explain why it’s important for climate models to be able to accurately simulate the Atlantic Multidecadal Oscillation (my boldface):
Decadal variability in the climate system from the AMO is one of the major sources of variability at this temporal scale that climate models must aim to properly incorporate because its surface climate impact on the neighboring continents. This issue has particular relevance for the current effort on decadal climate prediction experiments been analyzed for the IPCC in preparation for the fifth assessment report. The current analysis does not pretend to investigate into the mechanisms behind the generation of the AMO in model simulations, but to provide evidence of improvements, or lack of them, in the portrayal of spatiotemporal features of the AMO from the previous to the current models participating in the IPCC. If climate models do not incorporate the mechanisms associated to the generation of the AMO (or any other source of decadal variability like the PDO) and in turn incorporate or enhance variability at other frequencies, then the models ability to simulate and predict at decadal time scales will be compromised and so the way they transmit this variability to the surface climate affecting human societies.
The only way they could have been clearer would have been to state point blank that climate models will have value only if they are ever able to simulate the decadal and multidecadal characteristics of natural ocean processes. Ruiz-Barradas, et al. (2013) then describe the many problems with climate model simulations of the Atlantic Multidecadal Oscillation. The paper ends with:
The current analysis does not provide evidence on why the models perform in the way they do but suggests that that the spurious increase in high 10–20 year variability from CMIP3 to CMIP5 models may be behind the unsatisfying progress in depicting the spatiotemporal features of the AMO. This problem, coupled with the inability of the models to perturb the regional low-level circulation, the driver of moisture fluxes, seem to be at the center of the poor representation of the hydroclimate impact of the AMO.
In Ruiz-Barradas, et al. (2013), “hydroclimate” appears to mean the variations in precipitation as they relate to drought. They write:
Decadal control of hydroclimate from the AMO over North America and Africa is one of the main reasons to worry about having this phenomenon properly incorporated in climate models. Multi-year, summer and fall droughts over North America and Africa have been observationally linked to decadal SST variability in the Atlantic (e.g., Enfield et al. 2001; Ruiz-Barradas and Nigam 2005; Wang et al. 2006; Zhang and Delworth 2006; McCabe et al. 2008; Shanahan et al. 2009; Kushnir 2010; Nigam et al. 2011).
Some of you may recognize that discussion of Ruiz-Barradas, et al. (2013). It’s from my ebook Climate Models Fail.
Bottom line: Until climate models can simulate the observed warming spatial patterns, and the observed multidecadal variations in sea surface temperatures, they have no hope of being able to simulate climate on continental land masses.
THE WARMING IN THE NORTH PACIFIC IS NOT THE “MISSING HEAT” COMING BACK TO HAUNT US
We’ve already seen comments around the blogosphere to the effect of “high sea surface temperatures in the North Pacific indicate the increase in ocean heat is coming back to haunt us”.
That nonsense is contradicted by data. We only have reasonably complete and reasonably realistic measurements of subsurface ocean temperatures for the past decade or so, all thanks to the ARGO program. The vertically averaged subsurface temperature data from the NODC, Figure 2, for the extratropical North Pacific (20N-65N, 100E-90W), for the depths of 0-700 meters and 0-2000 meters, both show a negative trend, and that means the extratropical North Pacific from the surface to depths of about 1.25 miles have cooled slightly, not warmed, since the ARGO floats have been in place.
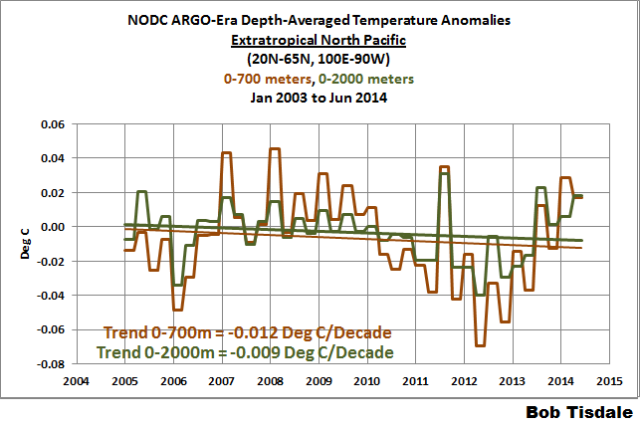
Figure 2
Figure 2 is from the “Timmermann and Trenberth” post.
BUT WE HAVE RECORD-HIGH SEA SURFACE TEMPERATURES AND THIS IS NOT AN EL NIÑO YEAR
The recently released El Niño Outlook at JMA contradicts the idea that 2014 is not an El Niño year. The bullet-pointed summary there reads (my boldface):
- El Niño conditions are present in the equatorial Pacific, although the atmospheric conditions does not indicate clear features of El Niño events.
- It is likely that El Niño conditions will continue through winter.
- A weak El Niño event is considered to have persisted since the Northern Hemisphere summer.
Unlike NOAA, JMA uses the NINO3 region (5S-5N, 150W-90W) as their indicator for El Niño conditions this year. They write:
Five-month running mean of the NINO.3 SST deviation was +0.5C or above for four consecutive months from June to September, which means a weak El Niño event has persisted since the Northern Hemisphere summer.
Also, the December 10, 2014 update from JMA comes 6 days after the blog post Did ENSO and the “Monster” Kelvin Wave Contribute to the Record High Global Sea Surface Temperatures in 2014? In that blog post, we illustrated a basic reality this year. While the El Niño conditions barely surfaced until recently in the NOAA-preferred NINO3.4 region (5S-5N, 170W-120W), the sea surface temperatures of the tropical Pacific as a whole indicate a moderate El Niño has been taking place this year.
BUT CLIMATE SCIENTISTS HAVE FOUND THE MISSING HEAT IN THE SOUTHERN HEMISPHERE OCEANS
I added a caption to the model-data comparison that is sure to get responses from some people. It reads:
Climate models almost double the observed warming rate of the global ocean surfaces. Climate scientists are still looking for about 50% of the heat that is supposed to be stored in the oceans. The “missing heat” and the doubling of ocean-surface warming suggest the model sensitivities are at least two-times too high.
I expect that the true-blue believers in human-induced global warming will, in response, cite the recent paper Durack et al (2014) Quantifying Underestimates of Long-Term Upper-Ocean Warming. A preprint copy of the full paper is here, and the supporting online material is here. That paper was discussed at WUWT here. And the lead author’s webpage here includes some pretty graphics.
The abstract of Durack et al (2014) begins (my boldface):
The global ocean stores more than 90% of the heat associated with observed greenhouse‐gas‐attributed global warming (Levitus et al., 2005; Church et al., 2011; Otto et al., 2013; Rhein et al., 2013). Using satellite altimetry observations and a large suite of climate models, we conclude that observed estimates of 0‐700 dbar global ocean warming since 1970 are likely biased low. This underestimation is attributed to poor sampling of the Southern Hemisphere, and limitations of the analysis methods that conservatively estimate temperature changes in data‐sparse regions (Gregory et al., 2004; Gouretski & Koltermann, 2007; Gille, 2008).
The statement “observed greenhouse‐gas‐attributed global warming” is nothing more than a clever regurgitation of climate science fallacy. Warming of the oceans to depth has been observed, but climate models are used to attribute the warming to greenhouse gases. Unfortunately for the climate-science community, it is well known that climate models cannot simulate naturally occurring coupled ocean-atmosphere processes that can cause ocean heat uptake over multiyear and multidecadal periods. We’ve been presenting and discussing that for many years. Most recently, see the discussion under the heading of “There Are Naturally Occurring Processes That Can Cause the Long-Term Warming of the Oceans to Depth” in the recent post Arguments For and Against Human-Induced Ocean Warming.
The next bold-face portion of the abstract is “Using satellite altimetry observations and a large suite of climate models…”. We only have to look at the model-data comparison graph of global sea surface temperatures and the maps of observed and modeled warming rates from 1982 to 2013 presented early in this post to know that climate model simulations of ocean processes are fatally flawed.
The final bold-faced portion reads “This underestimation is attributed to poor sampling of the Southern Hemisphere…”. There should be no doubt the temperatures and salinity of the Southern Hemisphere oceans to depth are poorly sampled. Even the IPCC is very clear about this. (See the post AMAZING: The IPCC May Have Provided Realistic Presentations of Ocean Heat Content Source Data.) But the authors of Durack et al (2014) are conveniently overlooking a few other things.
First, climate models are biased toward the Northern Hemisphere in an attempt to have them better simulate the loss of sea ice in the Arctic (See Swanson (2013) “Emerging Selection Bias in Large-scale Climate Change Simulations.”), but climate models still do a poor job of simulating the loss of Arctic sea ice (See Stroeve, et al. (2012) “Trends in Arctic sea ice extent from CMIP5, CMIP3 and Observations” [paywalled]).
Second, because of the models are biased toward the Northern Hemisphere in an attempt to recreate the higher warming rates there, the climate models almost triple the observed warming rate of the surfaces of the Southern Hemisphere oceans. See Figure 3.
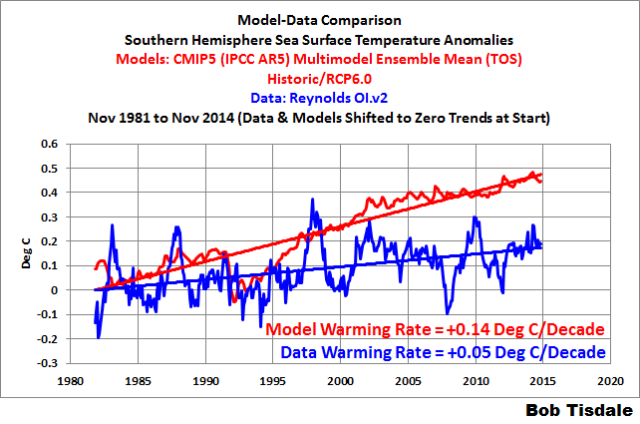
Figure 3
If climate models can’t come close to simulating the observed warming rates and patterns of the ocean surfaces, where the ocean-atmosphere processes are better understood, then climate models lack any credible foundation in their attempts to simulate the ocean heat uptake to ocean depths. In terms that are more basic, if the models cannot properly simulate the processes that cause the warming of ocean surfaces, it is extremely naive to assume the models would then be able to simulate ocean warming to depth.
CLOSING
For nearly six years, we’ve discussed how weather events can lead to long-term warming of the oceans—at the surface and at depth. The unusual warming in the extratropical North Pacific is just another example.
Hopefully, the above will provide you with enough basic support material to help you counter the alarmist nonsense that is sure to come in the near future.
Hasn’t Willis recently shown that there is no evidence that the amount of DWLWIR has increased over the recent years. If that is so, then the increase in SST, or OHC if OHC has really increased (and I am very sceptical that this can be accurately measured), is the result of natural processes (natural variation), not the consequence of rising manmade emissions of CO2 leading to an increase in DWLWIR.;
Richard, are you referring to the discussion under the heading of “There Are Naturally Occurring Processes That Can Cause the Long-Term Warming of the Oceans to Depth” in the following post?
https://bobtisdale.wordpress.com/2014/12/09/arguments-for-and-against-human-induced-ocean-warming/
That was my post.
Bob
I was not referring to your recent article, although that recent article is relevant. Anyone reading the present article needs to have a look at your previous article.
Of course each ocean basin has slight variations in the circulatory currents, but leaving that issue aside (which could be important, particularly at some depths), if CO2 is a well mixed gas, one would expect in broad terms that CO2 induced DWLWIR would have increased in similar fashion accross the same latitude bands.
Your article shows (claimed) differing icreases in OHC/warming in the various ocean basins even though some of these basins are in broadly similar latitudes.
Given the very large differences (large in relevant terms), the increase in temperature in these basins is difficult to reconcile with a claim that it is the consequence of increase in CO2 atmospheric concentration leading to an increase in DWLWIR which in turn has caused the ‘claimed’ ‘observed’ warming.
But of course, there are data issues. Namely lack of length, sparse spatial coverage, no test to see whether there is an inbuild bias caused by the free floating nature of the ARGO buoys which get swept along with prevailing currents, no realistic assessment of errors and uncertainties etc.
You would really need to sub divide the ocean basins in to very small latitude bands, and making a proper comparison on a similar latitude band by similar latitude band basis to see what is going on.
Unfortunately, this site does not keep an up to date index of articles written by the main contributors. It really ought to do that.
There is one or more article written by Willis this year, probably in the last 4 or 5 months that looks at CEREs data, and also at DWLWIR data measured from one or more specific ground based location.
Both these articles suggest that there is no eveidence that DWLWIR has increased these past 20 or so years. But like everything in Climate Science, there are data issues, so one never knows what is really happening.
“Just as AGW predicts: The warmes year (GISS) ever!! Including the latest data from November we expect 0.67 K above normal.”. This is the claim of a meteorologist, not a climateer because as a climate scientist we have to look at 30 years trends at least. And what do we see in this case: The linear trendslope from 1984 to 2014 is lower thans this from 1983 to 2013. Just as AGW predicts?
GISS is out with November data and no, there is no record. However, just give them a couple of months to adjust data, messing around with the past, and you will have it. And if you wait longer, say 5 years, it will be a clear record by a wide margin.
Actually, as it stands, a December anomaly of 0.56 or greater will make 2014 the warmest year in NASA GISTEMP. It could be close.
If 2014 was measured in the exact same matter as the 1940, would there be a record?
2014 has, global Sea Ice above average, record NH snow fall, RSS and UAH do not look nearly as warm as 1998, and of course those did not exist in 1940s. What does land only look like1998 vs 2014?
• Missing hotspot…..Just what AGW DOES NOT predict.
• No surface warming for over 18 years……Just what AGW DOES NOT predict.
• Increasing Antarctic sea ice extent……Just what AGW DOES NOT predict.
More failures….. and even more failures
If temps head down they will say “Just what AGW predicts” so I wouldn’t take their predictions too seriously.
As usual AGW alarmists are dreaming!
In UK they got UKIP that are sceptical to AGW. Also in Norway sceptics are beginning to organize, latest attempt is called Liberale i Norge (LiN).
https://sites.google.com/site/liberaleinorge/ (temporary)
You’re correct we did get UKIP and very well they did too in the elections for MEP’s. Sadly their message on useless wind and solar energy projects is lost in the noise made by the media (The BBC mainly) about their policies on immigration. UKIP need to start banging the drum about the AGW scam a lot louder.
You are right, but i live in Norway and do know about them. That means they do get heard, but are focusing on the wrong issues. They do not set the agenda in UK. They need to!
The position of the stratospheric polar vortex in the winter is very durable. This allows permanent circulation. Very long period of high pressure and sunlight in the Eastern Pacific during the last winter led to an increase in temperature.
Still visible is asymmetric position of the polar vortex.
http://www.cpc.ncep.noaa.gov/products/stratosphere/strat_a_f/gif_files/gfs_z30_nh_f00.gif
http://polar.ncep.noaa.gov/sst/rtg_high_res/color_newdisp_sst_160W_95W_15N_65N_ophi0.png
The decrease in solar activity causes an increase in pressure above the polar circle and meridional circulation.
Because now solar activity falls again, circulation again on meridian change.
http://www.cpc.ncep.noaa.gov/products/precip/CWlink/daily_ao_index/hgt.ao.cdas.gif
http://cosmicrays.oulu.fi/webform/query.cgi?startday=01&startmonth=09&startyear=2014&starttime=00%3A00&endday=14&endmonth=12&endyear=2014&endtime=00%3A00&resolution=Automatic+choice&picture=on
There are fewer and fewer vociferous warmists every year.
When will the alarmists show some respect for their own learning-curve? They cling to their silly mono-variable (co2) explanations to describe a complex world that involves multiple variables interacting in dynamic and perhaps chaotic relationships. It reminds me of Wiley Coyote’s “95% confidence” as he madly saws through the tree branch he’s standing on, only to discover that he’s standing on the wrong side of his cut when he’s in FREE FALL. How can we learn from our mistakes if we can never admit that we make them? “Look out below!” to all the arrogant, name-calling, pseudo-scientists who have made the learning process their enemy. Thanks to Bob for yet another informative post and a great example of what to do with new information.
Next year should there be no ‘record ‘ the alarmist can revert back to ‘one year means nothing ‘ , the heads you lose tails you I win approch, although scientifically worthless, sure does make life a lot easier for those that wish to be be always ‘right’ no matter what the reality.
Meanwhile the problem remains that the amount of data with have on ocean temperatures is tiny compared to the vast range of the ocean , so once again we revert to claiming that one star can tell us about all the billions of others stars ‘because ‘
Hear is a question, in an ideal world how many actual valid measurements of temperature would be required both land and sea to produce an actually average temperature that has real honest value , and how many do we actual have compared to that ?
The oceans are the difficult bit since they cover 7/8 of the planet and yet how many measuring points are there? But I would suggest that even if it were possible to create a reliable network, you would need to know what is going on below the surface at the ocean floor to put your readings in context. If an area sees warming, could it be from subsea volcanic action? Note that the melting of the antarctic peninsula ice has been attributed to warm water below not warm air above and that the heat source is volcanic.
7/10 of the planet, you mean
Gerry, England, over the last 33 years, sea surface temperatures are well monitored with satellites:
http://www.emc.ncep.noaa.gov/research/cmb/sst_analysis/images/satcol.png
And with buoys and ship inlets:
http://www.emc.ncep.noaa.gov/research/cmb/sst_analysis/images/inscol.png
(I assume many of the “drifter” buoys are ARGO floats, though I don’t know for sure. If they are ARGO floats, it means those observations increased drastically about 10 years ago.)
The maps are from the NOAA webpage here:
http://www.emc.ncep.noaa.gov/research/cmb/sst_analysis/
Cheers.
KNR
You ask
In the real world the answer is NONE because temperature is an intrinsic property so there is no valid way to average measurements of temperature.
In other words, in the real world it is a physical impossibility to “produce an actually average temperature that has real honest value”.
Richard
Fair enough , but has near you could get , how many would it need to actual do the job?
Far to often we see great claims made on what is in practice very little or very poor data , given the scale of the ocean and its vast coverage normal practice would suggest we would need a large number of measurements to actual come up with any meaningful value , while at the moment what we have could be called ‘tiny ‘
The ‘better than nothing ‘ approch seems to run right through climate ‘science’ and you have to ask given the demands made and their implications along with the claims there is not time to lose and this is the most important thing ever , is ‘better then nothing ‘ anywhere near good enough ?
KNR
You ask me
That would depend on what “the job” is, and nobody has defined that.
Please note that this answer is not an evasion.
If you really want to understand my answer then read Appendix B of this. I suspect you may also want to read every other part of the item at the link.
Richard
much of the problem in climate science revolves the mistaken idea that the earth has an average temperature and from this one can statistically analyze anomalies.
this leads to mistaken estimates of “normal” and “extreme” weather, because statistically climate does not follow the central limit theorem, the underlying premise of sampling theory.
look back through millions of years of earth’s paleo data. what temperature is the earths surface trying to converge to? is earth’s true average temperature ice age temperatures, or interglacial temperatures, or something else?
since the earth does not have a physically meaningful average temperature, it is statistically incorrect to analyze earths climate in terms of averages. it is unscientific.
the definition of climate, as temperature averaged of 30 years is a meaningless, arbitrary number. it has no physical basis. as such, the statistical results derived from this measure are equally meaningless.
this is the mathematical mistake of climate science. they have failed to prove their underlying assumptions. they have failed to establish that the definition of climate as the average of temperature over 30 years is indeed physically correct.
Richard is exactly right. Average temperature is meaningless because all of the processes that move heat from one place to another depend on the temperature difference between the two places. For heat, air needs only ~1 joule/gram to change temperature by 1degK. Water needs ~4.2 Joules/gram. This fact has a tremendous impact on how heat flows in the climate behave.
Regarding the number of points required to model the climate, vortices in water(the main way energy is transferred in water) disappear when they are about 1mm. in diameter. That means that modeling the behavior of water has to be modeled down to 1mm or less, over the whole earth. Vortices in air disappear at about 2mm. or so, depending very strongly on the temperature and Reynolds number of the flow. Right now a limited number of climate models are scaled to a 2.5km grid- that is about 10^12 times too large to model the fluid flows in the air and ocean, which are mostly what climate is.
So multiply the number of weather stations by 10^12- in other words, it is physically impossible to measure climate variables at a small enough scale.
And often dismissed fact concerning the meaning of the measure of average, Richard.
Brute
I am sorry but I fail to understand your post addressed at me.
If you want a response to it then you need to reword it so it makes sense.
Richard
The multi-model mean eliminates natural variability, so of course the multi-model mean doesn’t match the recent period dominated by the negative phase of the Interdecadal Pacific Oscillation (IPO) – the largest source of natural variability in the climate system over multi-decadal timeframes. It’s a strawman argument to make such a comparison.
The record sea surface temperatures are suggestive of the IPO moving into its warm (positive) phase. The weaker winds mean the export of warm surface water out of the tropics is slowing down, and the mixing of heat down into the subtropical gyres is weakening. The outcome of all the changes in ocean circulation should see sea surface temperatures increasing dramatically over the coming years. The sluggish transport of warm surface water out of the tropics will be very problematic for coal reefs. We will see a swarm of bleaching events during the positive phase of the IPO.
So if we eliminate the wheels from a wagon, can I call it my aunt?
Think about what you said for a moment. The multi-model mean doesn’t “eliminate” natural variation: it can;t simulate it. Natural variation doesn’t show up because the models are universally terrible at simulating the observed climate, and the ensemble mean is used to hide that fact on the assumption that an average of a number of inputs is more reflective of reality than any one input alone – an assumption that only makes sense in a situation where the inputs approximate reality as well, which almost none of the models can reliably do.
It’s really not that difficult to understand. Run a whole bunch of model simulations and natural variability occurs at different times because the models are individual possible realisations of Earth’s climate. Average them all together, which is what the multi-model mean is, and you remove all the wiggles representing these natural climate variations from the individual simulations.
Rob Painting
You are plain wrong and archonix is right.
You assert
NO! The models are NOT individual possible realisations of Earth’s climate: they each simulate a different climate system.
None of the models – not one of them – could match the change in mean global temperature over the past century if it did not utilise a unique value of assumed cooling from aerosols. So, inputting actual values of the cooling effect (such as the determination by Penner et al.
http://www.pnas.org/content/early/2011/07/25/1018526108.full.pdf?with-ds=yes )
would make every climate model provide a mismatch of the global warming it hindcasts and the observed global warming for the twentieth century.
This mismatch would occur because all the global climate models and energy balance models are known to provide indications which are based on
1.
the assumed degree of forcings resulting from human activity that produce warming
and
2.
the assumed degree of anthropogenic aerosol cooling input to each model as a ‘fiddle factor’ to obtain agreement between past average global temperature and the model’s indications of average global temperature.
More than a decade ago I published a peer-reviewed paper that showed the UK’s Hadley Centre general circulation model (GCM) could not model climate and only obtained agreement between past average global temperature and the model’s indications of average global temperature by forcing the agreement with an input of assumed anthropogenic aerosol cooling.
The input of assumed anthropogenic aerosol cooling is needed because the model ‘ran hot’; i.e. it showed an amount and a rate of global warming which was greater than was observed over the twentieth century. This failure of the model was compensated by the input of assumed anthropogenic aerosol cooling.
And my paper demonstrated that the assumption of aerosol effects being responsible for the model’s failure was incorrect.
(ref. Courtney RS An assessment of validation experiments conducted on computer models of global climate using the general circulation model of the UK’s Hadley Centre Energy & Environment, Volume 10, Number 5, pp. 491-502, September 1999).
More recently, in 2007, Kiehle published a paper that assessed 9 GCMs and two energy balance models.
(ref. Kiehl JT,Twentieth century climate model response and climate sensitivity. GRL vol.. 34, L22710, doi:10.1029/2007GL031383, 2007).
Kiehl found the same as my paper except that each model he assessed used a different aerosol ‘fix’ from every other model. This is because they all ‘run hot’ but they each ‘run hot’ to a different degree.
He says in his paper:
And, importantly, Kiehl’s paper says:
And the “magnitude of applied anthropogenic total forcing” is fixed in each model by the input value of aerosol forcing.
Kiehl’s Figure 2 can be seen here.
Please note that the Figure is for 9 GCMs and 2 energy balance models, and its title is:
It shows that
(a) each model uses a different value for “Total anthropogenic forcing” that is in the range 0.80 W/m^2 to 2.02 W/m^2
but
(b) each model is forced to agree with the rate of past warming by using a different value for “Aerosol forcing” that is in the range -1.42 W/m^2 to -0.60 W/m^2.
In other words the models use values of “Total anthropogenic forcing” that differ by a factor of more than 2.5 and they are ‘adjusted’ by using values of assumed “Aerosol forcing” that differ by a factor of 2.4.
So, each climate model emulates a different climate system. Hence, at most only one of them emulates the climate system of the real Earth because there is only one Earth. And the fact that they each ‘run hot’ unless fiddled by use of a completely arbitrary ‘aerosol cooling’ strongly suggests that none of them emulates the climate system of the real Earth.
Richard
Rob Painting
archonix is right asnd you are plain wrong.
You assert
NO! The models are NOT “individual possible realisations of Earth’s climate”: each model is of a different climate system
None of the models – not one of them – could match the change in mean global temperature over the past century if it did not utilise a unique value of assumed cooling from aerosols. So, inputting actual values of the cooling effect (such as the determination by Penner et al.
http://www.pnas.org/content/early/2011/07/25/1018526108.full.pdf?with-ds=yes )
would make every climate model provide a mismatch of the global warming it hindcasts and the observed global warming for the twentieth century.
This mismatch would occur because all the global climate models and energy balance models are known to provide indications which are based on
1.
the assumed degree of forcings resulting from human activity that produce warming
and
2.
the assumed degree of anthropogenic aerosol cooling input to each model as a ‘fiddle factor’ to obtain agreement between past average global temperature and the model’s indications of average global temperature.
More than a decade ago I published a peer-reviewed paper that showed the UK’s Hadley Centre general circulation model (GCM) could not model climate and only obtained agreement between past average global temperature and the model’s indications of average global temperature by forcing the agreement with an input of assumed anthropogenic aerosol cooling.
The input of assumed anthropogenic aerosol cooling is needed because the model ‘ran hot’; i.e. it showed an amount and a rate of global warming which was greater than was observed over the twentieth century. This failure of the model was compensated by the input of assumed anthropogenic aerosol cooling.
And my paper demonstrated that the assumption of aerosol effects being responsible for the model’s failure was incorrect.
(ref. Courtney RS An assessment of validation experiments conducted on computer models of global climate using the general circulation model of the UK’s Hadley Centre Energy & Environment, Volume 10, Number 5, pp. 491-502, September 1999).
More recently, in 2007, Kiehle published a paper that assessed 9 GCMs and two energy balance models.
(ref. Kiehl JT,Twentieth century climate model response and climate sensitivity. GRL vol.. 34, L22710, doi:10.1029/2007GL031383, 2007).
Kiehl found the same as my paper except that each model he assessed used a different aerosol ‘fix’ from every other model. This is because they all ‘run hot’ but they each ‘run hot’ to a different degree.
He says in his paper:
And, importantly, Kiehl’s paper says:
And the “magnitude of applied anthropogenic total forcing” is fixed in each model by the input value of aerosol forcing.
Kiehl’s Figure 2 can be seen here.
Please note that the Figure is for 9 GCMs and 2 energy balance models, and its title is:
It shows that
(a) each model uses a different value for “Total anthropogenic forcing” that is in the range 0.80 W/m^2 to 2.02 W/m^2
but
(b) each model is forced to agree with the rate of past warming by using a different value for “Aerosol forcing” that is in the range -1.42 W/m^2 to -0.60 W/m^2.
In other words the models use values of “Total anthropogenic forcing” that differ by a factor of more than 2.5 and they are ‘adjusted’ by using values of assumed “Aerosol forcing” that differ by a factor of 2.4.
So, each climate model emulates a different climate system. Hence, at most only one of them emulates the climate system of the real Earth because there is only one Earth. And the fact that they each ‘run hot’ unless fiddled by use of a completely arbitrary ‘aerosol cooling’ strongly suggests that none of them emulates the climate system of the real Earth.
Richard
Mods:
I have twice attempted to provide a post in reply to Rob Painting but each attempt has vanished: n.b. there is no indication that it is in moderation.
Please try to find one of them in the ‘bin’ and post it.
Richard
Rob, please don’t talk down to me. I understand the process perfectly fine.
You, however, seem to miss the central problem, as Old’un pointed out below: the models produce garbage. If they were simulating an approximation of reality, then the ensemble mean would produce something that also resembled reality, including the natural variation. Right now you’re attempting to argue that the ensemble mean removes natural variation to expose the human signature in climate change, which – and I would rather use much stronger words here – is also garbage.
The simple fact is, the models do not model reality. If they can’t model reality then no amount of averaging will extract useful information from them. Why you persist in labouring under this belief that averaging garbage will produce gold, frankly it’s beyond me.
It’s really not that difficult to debunk as well.
Claiming natural variation is reflected in the models because they produce random results is not a convincing argument. More unfounded is claiming that the natural variation factor happens to be the mean.
So do the models provide a range (like when weathermen forecast snowfall of 4 to 8 inches)? Not really, weathermen do not run multiple different models and then take the low and the high model runs. They certainly do not report the mean.
So do the models forecast? Not really, since they do not follow best practices of forecasting. In local weather, a snow storm forecast 3 days could change from a 1-2 inches to 10-12 inches as the forecast day approaches or could be both depending on how the storm lines break out. In terms of forecasting, climate is not different, it just occurs on a different time scale and area with additional or different factors. Weathermen give low confidence in forecasts the further out and increase in confidence as the actual weather event approaches, climate models do the opposite, having more confidence the further out the forecast and waning confidence as actual predicted climate events approach.
So maybe they identify trends and then extrapolate into the future. Unfortunately unlike the stock market that over time has continually increased in value since it’s inception, global temperature does not behave that way, it cannot not be extrapolated unless you are willing to predict the end of the current trend and the start of the new one. Put simply a warming trend cannot be extrapolated without concluding eventually the earth becomes hot enough for the oceans to boil.
Lets forget the averaging nonsense and call it what it is, “We are far from understanding what is going on.”
The mean of garbage is still garbage, but it is all that ‘climate science’ is able provide for Bob to compare with reality. It certainly doesn’t lead to a strawman argument, much loved as they are by alarmists in dismissing arguments that challenge the orthodoxy.
Rob Painting, welcome. I didn’t expect to see you today. I’m always surprised by who comes to comment here at WUWT.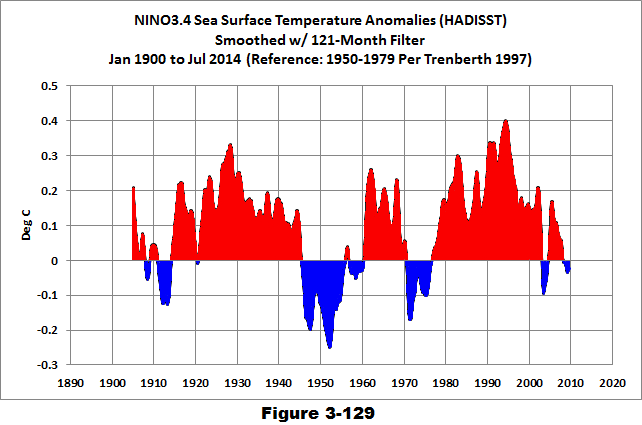
I’ve been waiting for your post at SkepticalScience about the warming in the North Pacific…now about a possible climate shift in the North Pacific. What happened to it? You guys have been promising it for over a month.
You wrote, “The multi-model mean eliminates natural variability, so of course the multi-model mean doesn’t match the recent period dominated by the negative phase of the Interdecadal Pacific Oscillation (IPO) – the largest source of natural variability in the climate system over multi-decadal timeframes.”
Rob, I presented model-data comparisons starting in 1981. Are you aware the IPO was positive for most of that time. But that’s neither here nor there.
Second, you’re wrong about the IPO about being the largest source of natural variability over any timeframe. ENSO dominates the Pacific and the globe. Are you aware there are multidecadal variations in the strength, frequency and duration of El Niño and La Niña events, so that El Niños dominate during some periods and La Niñas in others? It’s easy to see when you smooth HADISST-based NINO3.4 SST anomalies with a 121-month filter.
More about the IPO: The IPO represents spatial patterns of the sea surface temperature anomalies in the Pacific (warm in some areas and cool in others). It does not represent the sea surface temperatures there…only the spatial pattern. It, therefore, can have no impact on the warming or cooling in the Pacific or globally. The IPO is an aftereffect of ENSO…that’s altered by the wind patterns in the Pacific. The IPO index is simply a numerical representation of how closely the spatial pattern of the sea surface temperature anomalies in the Pacific matches the spatial pattern created by ENSO. The closer the spatial pattern resembles the one created by an El Niño, the higher (more positive) the IPO value. Conversely, the closer the spatial pattern resembles the one created by a La Niña, the lower (more negative) the IPO value. The reason the IPO index does not track an ENSO index is simple. The spatial pattern of SST anomalies in the Pacific is altered by the wind patterns in the Pacific that aren’t related to ENSO.
Additionally, climate models don’t simulate natural variability–aka coupled ocean-atmosphere processes like ENSO, the PDO, the IPO, and the AMO. How do we know? Trenberth told us back in 2007. Remember his blog post at Nature.com?
For ENSO, we also have Guilyardi et al (2009) and Bellenger et al. (2012) as references, which both indicate there few if any parts of ENSO processes that are simulated correctly by CMIP3 and CMIP5 climate models. And if the models can’t simulate ENSO, they logically can’t simulate the PDO and the IPO.
Now for the model mean:
One of the reasons we present the model mean: because it represents the forced component of the models, according to Gavin Schmidt. I linked that discussion in the post, you may have missed it, so here it is again.
https://bobtisdale.wordpress.com/2013/10/06/on-the-use-of-the-multi-model-mean/
The second reason we use the model mean, of course, is that it represents the consensus of the modelers with respect to how they believe sea surface temperatures should have warmed, if they were warmed by manmade greenhouse gases. You understand consensus, Rob, you’re from SkepticalScience. Consensus to us here means groupthink, and groupthink has negative connotations.
Rob, you’re more than welcome to continue to comment, but you’re exposing your misunderstandings about ENSO, about the IPO and about the use of the model mean. And I don’t think you want to continue to do that.
I hope you don’t mind, but this is the last reply you’re likely to see from me today. I have better things to do than to expose your misunderstandings or misrepresentations.
Regards.
PS: I’m still looking forward to your upcoming post, especially if you’re gonna be using the IPO as a reference. Expect a response here at WUWT shortly after you publish it.
Above I wrote: “the largest source of natural variability in the climate system over multi-decadal timeframes”
You haven’t provided any evidence that disputes that.
The IPO is a useful measure of the state of the Earth’s wind-driven ocean circulation. The spatial patterns themselves tell us something about the physics involved. If the subtropical ocean cell and the gyre circulation spin-down, then global sea surface temperatures will continue to be broken over the coming years. So it will be interesting to see who is right, the mainstream oceanographic community, or random dudes on the internet.
Rob Painting
You say to Bob Tisdale
That is a very modest point from you; i.e. a “random dude on the internet”.
However, despite your modesty, at this stage the argument from Bob Tisdale is more cogent because it is your responsibility to justify your assertion that the IPO is “the largest source of natural variability in the climate system over multi-decadal timeframes” and Tisdale only has a responsibility to demand your justification. He has fulfilled his responsibility by explaining why he does not agree your assertion.
It would be helpful to observers such as myself if you were to provide some evidence and/or argument to support your assertion that the subtropical ocean cell and the gyre circulation are likely to “spin-down” with the resulting effects you assume. Please note that appeals to authority are not evidence and not argument.
Richard
Rob Painting says: “”Above I wrote: “the largest source of natural variability in the climate system over multi-decadal timeframes’ You haven’t provided any evidence that disputes that.”
I provided evidence that you haven’t the slightest idea what the IPO is, or what it represents, and I wrote:
The IPO represents spatial patterns of the sea surface temperature anomalies in the Pacific (warm in some areas and cool in others). It does not represent the sea surface temperatures there…only the spatial pattern. It, therefore, can have no impact on the warming or cooling in the Pacific or globally.
Did you miss that, Rob? Obviously.
Are you aware that the IPO is standardized…that it’s divided by its standard deviation? That standardizing the IPO increases its apparent significance?
Rob Painting errs. To compare the values of an observed global temperature time series to the multi-model mean only eliminates variability about the multi-model mean. To equate this variability to natural variability is to be guilty of reifying an abstract object, an application of the fallacy that is also called “misplaced concreteness.”
Bob Tisdale – “The IPO represents spatial patterns of the sea surface temperature anomalies in the Pacific (warm in some areas and cool in others)”
Yep, cool somewhere, warm elsewhere. That’s a very illuminating description of the IPO right there.
“Just as AGW predicts”. Oh really? How does AGW predict which parts of which oceans will warm, which will cool and which will stay the same?
Earlier in the year, Trenberth said an El Nino, if it occurred, had to overcome conditions that were “below normal, even quite cold–and they’re still cold–in the southern hemisphere.”
“Especially,” he added for clarity, “south of the equator“. (start at 9min):
Just a few months later we allegedly have “record high temperatures” in a year with record snow cover in the northern hemisphere, record Antarctic ice extent, Arctic ice growth and record Great Lakes ice cover and duration. That’s a very different kind of heat to what we saw in 1998.
The bigger problem with the AGW mentality is that it confuses the GW (what we call global warming) with AGW.
In that mentality Gw is by default an AGW.
While NO ONE REALLY CONTENDS OR DISPUTES THE ~0.8C warming of the last ~150 years(actually what we call a GW) they keep claiming and interpreting any sign or effect of it as a certain AGW.
As far as I can tell, the problem of the oceans heat content in the past, previous to the hiatus, has actually been ignored by the AGW croud simply because it’s patern of variation did confuse the AGW.
The signal in that variation does not seem to have lagged behind and following the atmospheric warming as it should have been expected in the case of a GW caused by CO2 emissions or in the case of an AGW.
It’s pattern actually makes the oceans heat content to be considered more significant as a probable cause of the GW of the last 150 years. It seems like the GW has followed the oceans warming pattern actually, especially in the first part of the warming period.
Is ridiculous to think, claim and pretend that the 0.8C warming will not show any signs in the pattern of the oceans heat or warming.
Is even more ridiculous under the cicumstances to blindly and without any care at all consider the latest observed warming of oceans surface as a clear sign of AGW.
In the hiatus or a no atmospheric warming period while we still technically in a Gw period it is expected to have a such observation simply due to the oceans inertia in comparision to the atmosphere.
The only thing that observation shows is that there is a kinda of influence or effect of the CO2 emissions in that 0.8C warming, but also it shows that the CO2 is not the cause of it.
The oceanic warming pattern alone can not prove or support the AGW, but in the other hand can create conditions of doubt towards it.
Clinging to that latest observation as to support AGW is merely a sign of desperation from the AGWers.
I always in other blogs at the Guardian have highlighted and showed that if oceans and their warming pattern considered, actually the AGW is very much in doubt, it creates more problems for the AGW than it possibly offers any support.
But when there not much, one must cling to any straw possible, regardless.
While somehow the 0.8C warming in the last century and a half could be considered as unprecedented the latest oceans warming observed does not make it even beyond the normal expectations, if one fair enough while considering the matter in hand.
As Bob has clearly explained, that warming is far too less than what expected in an AGW scenario.
One way to see this is that the oceans are lagging behind the atmosphere in the hiatus, meaning that if the hiatus keep continuing, in not a long future there is expected another hiatus, that of the oceans.
You see before this considered atmospheric hiatus we observed a strong warming signal (1998-2000), maybe same could be with oceans, before the next hiatus (that of the oceans)….. but whatever the case, while actually the atmospheric-ocean coupling is very significant, AGW STANDS FOR CLIMATIC WARMING DUE TO HUMAN CO2 emissions and the oceans in their own alone can not support it or prove it, whatever the case.
cheers
‘As far as I can tell, the problem of the oceans heat content in the past, previous to the hiatus, has actually been ignored by the AGW croud simply because it’s patern of variation did confuse the AGW.’
Ironically it is the total failure of models to function in the manner ‘settled science’ claimed they would that meant they had to go looking for missing heat in the first place . And oceans being big, mostly empty and with very little coverage compared to their vast size was a good place to claim to have ‘found it ‘ After all as its climate ‘science’ we are talking about the normal process of the person making the claim having to prove it is reversed so by making the claiming its already been proved and its for other to disprove it and there big, mostly empty and with very little coverage that was near impossible to do.
Turning to the ocean came after the claims and the ‘science’ failed until then ‘settled science’ claimed to have it all shorted out and the oceans had no interest for them.
Hello KNR.
As the clever climatologists claim, all climatic variations, the extents, are known….so is in outset the variation due to oceanic response…..I think they have had it included in their simulations (GCMs)…but in overal oceans can not sink that much and so fast, especially the claimed extent of an AGW….that is why been ignored in the past. Estimated as it’s sinking potential no good, fast and strong enough to prevent AGW.
That is the main reason now for it to be considered as not the mechanism or the main reason of the hiatus or the temporarely block of AGW, contrary to the AGWers claims.
It was not considered then as such, it must not be considered now.
Already it shows, as Bob has clarified in this blog, that it counts for only 50% OF MISSING HEAT, and that at the moment…..in a no long to come future it may consist as no more than 33%, if the atmospheric hiatus continues and a no further warming of oceans observed.
The main problem with the orthodox climatology and the clever climatologists is that indirectly they claim and know that none of known natural mechanisms behind climatic variations is responsible for the already experienced GW (and also that seems to hold true for hiatus), that’s the very basic claim of them supporting AGW.
That is one of the main paradoxes of climatology.
Nothing natural caused the AGW, and nothing natural can stop it, the AGWers belief……but wait now they say that something natural can, at least for a while can stop the AGW.
If the missing heat is attributed to the oceans warming, then the potential of the oceans to effect climatic variations is increased by default to at least a factor of 2 which will make the oceans as the primary candidate of the GW, the 0.8C warming of the last century about, putting and creating more doubt about AGW actually.
Am not sure if I was clear enough…..my point is that the estimate of the oceanic potential to effect climatic variation has been already considered in the past by climatologists, but estimated as not able to sink as much heat as the amount of the missing heat we consider now.
And that is the main paradox, if they claim now that oceans actually could do that, and they claim an increase of the estimated impact and effect of the oceans to the atmosphere then they lose the CO2 as the cause of GW because the oceans become the main and the primary candidate by default.
They end up with a natural mechanism that can cause a GW and an hiatus. No AGW there at that point needed to explain the condition……
.
cheers
Bob,
Would a comparison of the “Argo Decade”:
1. Confirm the .09 / .17 degree differential?
2. Show correlation or counter correlation in and amongst the ocean basins?
Recognizing, that a decade is too short to be categorized as anything but hypothetical, it was an interesting and diverse decade.
Thanks for all you do. Also, keep the boilerplate. An old guy is learning here!
Regards,
Robert Doyle, you need to clarify your request. You’ve lost me.
Bob,
My thought is:
If the Argo period is now the most accurate technical measurement source, then you could “zoom” into the decade and compare that decade to the models; you would have a confirming ratio to your original post. Second, you have in prior posts shown me the variability across the earth’s ocean basins. So, I wondered if the Argo data shows consistent or inconsistent agreement / disagreement with the global view. Last, I’m wondering if Argo, as the years progress will provide a glimpse as to possible correlations amongst the several oceanic oscillations
I hope that is clearer. If it makes the thought more complex, I’ll get back to the cheap seats again.
Again, thank you for your work.
Regards,.
Robert Doyle says, “If the Argo period is now the most accurate technical measurement source…”
ARGO is used primarily for ocean subsurface temperatures and salinity, not sea surface [temperatures]. We’ve had very good quality sea surface temperature observations during the satellite era, staring about 1981. The satellite portion of the Reynolds OI.v2 data is corrected against the buoy and ship inlet measurements to account for the satellite biases.
To be fair, everything is just what AGW predicts. There are more papers out there than I can count that “prove” that every weather event is consistent with the AGW theory. Sure they may contradict each other. But that is not the point. No matter what happens, someone will write a paper that proves it is related to AGW and if it passes the rigorous pal-review then it becomes accepted into the Gospel of AGW. It is not too hard to find some paper that says something is consistent with AGW theory therefore everything is just AGW predicts.
Rob Painting on December 14, 2014 at 4:10 am says,
It’s really not that difficult to understand. Run a whole bunch of model simulations,… Average them all together, and you remove all the wiggles…from the individual simulations.
(Then compare that trend line with the actual data trend line….hmmmm, by gum yer rite!)
“No matter what happens, someone will write a paper that proves it is related to AGW…”
//////////////////
Should read “No matter what happens, someone will write a paper that CLAIMS prove THAT it is related to AGW….”
The papers written do not prove that whatever happend is truly caused by AGW, they merly claim to prove it and PAL review accepts this and thereafter the IPCC accepts this as proven fact.
Very interesting, Bob.
By extrapolation, we seem to be on an increasing trend line for ocean temps as opposed to global temps that are stalled or very slightly falling. So, may we expect continuing “highest ever” ocean temps every year from now?
Apologies for the difficult question! Oh and keep up the good work.
Why would you assume that, Mardler, when sea surface temperatures have multidecadal components that can contribute to global warming or stop it?
http://stevengoddard.wordpress.com/2014/12/14/sea-level-plummeting-at-fastest-rising-location-on-earth/
Yeah, almost like the tropical trade winds, which have been piling up anomalous water mass in the western equatorial Pacific during the negative phase of the IPO, are weakening……………or something.
Severe frosts will be more frequent due to man-made greenhouse gas: scientists
ABC Rural [Australia]
Steven Schubert
Updated 15 Oct 2014, 3:13pm
Frosts like the ones that caused so much damage to crops this season could be more common for the next 20 years, according to scientists
http://lh4.googleusercontent.com/-sIaHkRvwGYY/VI2HpoiU4mI/AAAAAAAAAkk/WDba-hHREcg/s800/keep-winter-cool.jpg
Cold winters have been caused by global warming: new research
Climate sceptics often claim that recent icy winters show that global warming is not happening. New research suggests the opposite is true.
Telegraph UK, October 27, 2014
http://lh4.googleusercontent.com/-sIaHkRvwGYY/VI2HpoiU4mI/AAAAAAAAAkk/WDba-hHREcg/s800/keep-winter-cool.jpg
Fall snow cover in Northern Hemisphere was most extensive on record, even with temperatures at high mark
Washington Post, December 4, 2014
I just put some water in the oven to make ice, because I believe,
I wish I had a job where whether I provided result X or the opposite of result X, I would be rewarded the same. Actually, that sounds like a government job.
It’s just more AGW unfalsifiable spin so they can keep the money rolling in.
There are unknown unknowns in global weather. There are known unknowns. AMO, IPO, and ENSO are known, but their drivers are unknown, at least to the extent of when they will occur. They can’t predict an El Niño on any time frame. I consider this a prima facie case that climate models are bogus, AND THEY KNOW IT.
What truly scares me about all the discussion over the “high” sea surface temp is that the resulting temperature increase is WITHIN THE DEGRADE ERROR MARGIN of the sensors used to produce it.
That’s right, I said it. 100% of the thermistors and IR equipment used for the reading can easily be wrong by a larger amount than the supposed increase in temp.
True and its a classic error to suggest that you can measure to greater degree of accuracy , then the means you use to measure can give. Science 101 tells you its method used to measure which limits you as much as the thing you are measuring . The one of the issues with models is they create the idea that this can be overcome by throwing enough computing power at it.
In the past if you had to prepare and analysis the data by hand ,which was a long process , you would put far more work into ensuring its quality before crunching the numbers. Now its almost push the button and watch it go , and if it falls over , just push the button again.
So its easy to just keep going through the process until you get the ‘right results ‘ rather than the correct one.
.
Actually, you can, but only under very specific circumstances. The law of large numbers and, correspondingly, the central limit theorem, are two of the most misunderstood and mis-applied statistical concepts ever.
Mark
I thought it might be fun to predict (as far as I can) what the Central England Temperature (CET) average reading for December 2014 will be. No computer models, no fancy statistics, just a plain inspection of the record’s figures and a bit of simple arithmetic.
From January to November inclusive, the monthly averages in degrees Centigrade for 2014 are 5.7, 6.2, 7.6, 10.2, 12.2, 15.1, 17.7, 14.9, 15.1, 12.5 and 8.6.
The hottest average for a year was 2006, showing 10.82⁰C.
So, assuming that we hit this figure again, let’s have a look at what December may bring.
My calculation comes to 4.04⁰C, but I’m going to round off this figure (four hundredths of a degree means nothing) – so, I suggest that December’s CET temperature will be 4⁰C at the most, but in all likelihood less than that, since I doubt we’re going to see the record average of 2006 again this year.
Four degrees Centigrade for December? Not at all an unusual figure, and that’s going right back to the 1600s.
The coldest December ever was -0.8⁰C in 1890, and the warmest was 8.1⁰C in 1934.
So, there it is. My non-IPCC approved temperature prediction, and no climatic Armageddon in sight.
Yeah but what are we going to do with all those super computers then?
I guess they can be sold to Hollywood for all their CGI special effects extravaganzas.
One can always find an infinite number of examples to support just about any theory. The only number that has any meaning is how many examples contradict the theory. If the number of contradictions is greater than zero, the theory is wrong.
In science, it is as simple as that. If there is a single single contradiction to your theory, the theory is wrong. where is the atmospheric hot spot predicted by ALL climate models. This hot spot must exist for AGW to be correct.
Since the hot spot has not appeared as predicted (not projected) by the climate models, the mechanism by which CO2 is though to warm the surface cannot be correct.
The late 20th century warming cannot have been caused by CO2 as proposed, which explains why the rate of warming has slowed down in spite of record CO2 emissions. Something as yet unknown must have caused the late 20th century warming.
“Something as yet unknown must have caused the late 20th century warming.”
The solar Modern Maximum from 1936-2003, where solar activity as measured by SIDC and rGSN sunspot number, was 31% higher during those 68 years than the preceding 68 years, was the cause of the late 20th century warming.
My solar model predicts higher temps this year due to the fact that we are still in this solar cycle maximum period, although that will change long before this time next year, as we will see a downturn in temps thereafter as a result of upcoming lower solar activity, like we experienced during the last solar downturn, especially 2007-09.
SSTs and OHC are tied directly to variable solar flux, as I show in my upcoming paper. Natural variability includes solar variability – foolishly ignored and dismissed by too many.
The rate of warming has slowed because the overall activity level of the sun has dropped since the solar maximum of SC23 in 2002/03.
Global dimming is hiding the effect of greenhouse gases, was a statement before the global brightening took place in North. Now we can see the effect as more sunlight hours. In Denmark some 16% more the last decade compared to 1961-1990. The models have missed this effect gravely. Shown in this paper.
http://journals.ametsoc.org/doi/pdf/10.1175/BAMS-D-11-00074.1
Bob, your concluding statement is nonsensical. You state “For nearly six years, we’ve discussed how weather events can lead to long-term warming of the oceans—at the surface and at depth.” If the coupled atmosphere/ocean system is not gaining heat, how can you have long-term warming of the oceans without a large decline in atmospheric temperatures? The answer, of course, is that the overall heat content is increasing tremendously- the latest estimate is about 250 trillion Joules per second.
Luke, you have got something backwards there…….in a GW or any climatic warming period generally both atmosphere and oceans warm……you can have a long-term warming of oceans without a detectable decline of atmospheric temperatures.
Generally at the end of such periods significant decline of atmospheric temperatures would be expected while oceans still warming due to the inertia they have, which compared to the atmospheric one is more extended in time and streangth……
To me that seems a much simpler explanation and a reasonable one compared to your trivial acrobatics, and also is supported in the paleo climate and basic understanding of climatic periods.
Technically speaking we are in a GW still, so the condition you refer to may just be pointing out that we are at the very end of it..
Simple as that
cheers
Empirical measurements indicate that heat is still accumulating so I doubt your contention that we are at the end of it.
From Levitus et al. 2012
We provide updated estimates of the change of ocean heat content and the thermosteric component of sea level change of the 0–700 and 0–2000 m layers of the World Ocean for 1955–2010. Our estimates are based on historical data not previously available, additional modern data, and bathythermograph data corrected for instrumental biases. We have also used Argo data corrected by the Argo DAC if available and used uncorrected Argo data if no corrections were available at the time we downloaded the Argo data. The heat content of the World Ocean for the 0–2000 m layer increased by 24.0 ± 1.9 × 10²² J (±2S.E.) corresponding to a rate of 0.39 W m−2 (per unit area of the World Ocean) and a volume mean warming of 0.09°C. This warming corresponds to a rate of 0.27 W m−2 per unit area of earth’s surface. The heat content of the World Ocean for the 0–700 m layer increased by 16.7 ± 1.6 × 10²² J corresponding to a rate of 0.27 W m−2(per unit area of the World Ocean) and a volume mean warming of 0.18°C. The World Ocean accounts for approximately 93% of the warming of the earth system that has occurred since 1955. The 700–2000 m ocean layer accounted for approximately one-third of the warming of the 0–2000 m layer of the World Ocean. The thermosteric component of sea level trend was 0.54 ± .05 mm yr−1 for the 0–2000 m layer and 0.41 ± .04 mm yr−1 for the 0–700 m layer of the World Ocean for 1955–2010.
http://onlinelibrary.wiley.com/doi/10.1029/2012GL051106/abstract
Luke
December 14, 2014 at 8:26 am
Hi again Luke.
Luke, sorry but you lost me there with all this numbers.
Do you really understand my reply to you?
I don’t think you did or wanted to understand.
Let me state it again simply, perhaps I have misunderstood you, let see.
Somehow, at some point in your reply to Bob you claimed that there could not be a long term warming of oceans without a large decline of atmospheric temperatures.
And you even had a “clear” explanation for such as….the overall tremendous increase of heat content.
My reply to you was simply a very simple way to debunk your confused and backward assumptions.
I don’t see you to find me wrong with that.
Sorry for the harsh, but you seem not to understand how empty actually that claim of yours is.
As far as I can tell, what you got backwards still remains that way to you……and your empirical measurements do not make it any better.
Considering Levitus at al. 2012 (you refer to) in comparision to my previous reply to you, I see no problem there as pointing out any error or wrong in what I said to you, actually it contradicts your assumtions.
It shows a warming of oceans during the same time of the GW (atmosphere WARMING) for most of the period in question, technically still so as I said(a GW period), ………but with empirical measurements that show no warming of the atmosphere for at least the last decade.
If you read your last reply to me and all your numbers and read also my previous comments in this blog post(2 above ones) you may have (find there) an answer from me to your empirical measurements if you interested.
For reference at what and where this argument of ours started:
Your say:
” If the coupled atmosphere/ocean system is not gaining heat, how can you have long-term warming of the oceans without a large decline in atmospheric temperatures? The answer, of course, is that the overall heat content is increasing tremendously- the latest estimate is about 250 trillion Joules per second.”
cheers
What I was saying is that if you are arguing that the overall heat content of the oceans and atmosphere is not changing (i.e. global warming is not occurring) then an increase in temperature of one of them must lead to a decline in the other. You seem to be acknowledging that GW is occurring in which case you are right, both the temperature of the oceans and the atmosphere can occur at the same time. I suggest that there is abundant empirical evidence that the cause of the warming is an increase in GHGs from the burning of fossil fuels (hence my reference to the Nature article).
Luke
December 14, 2014 at 10:43 am
” What I was saying is that if you are arguing that the overall heat content of the oceans and atmosphere is not changing (i.e. global warming is not occurring) then an increase in temperature of one of them must lead to a decline in the other. You seem to be acknowledging that GW is occurring in which case you are right, both the temperature of the oceans and the atmosphere can occur at the same time. I suggest that there is abundant empirical evidence that the cause of the warming is an increase in GHGs from the burning of fossil fuels (hence my reference to the Nature article).”
————————————————
The above is your reply to me.
Thank you.
Now we are talking, hopefully, and I have the oportunity to explain better your backwards assumption.
As I said in another previous comment of mine in this blog post, the bigger problem with AGWers is their mentality which most of the time confuses GW with AGW.
What we call GW (the 0.8C warming of the last 150 years) is not really disputable but what it is disputable and in question is the AGW, which stands basically of climate change or global warming caused by CO2 emissions (as most of being anthropogenic, for the period in question)
The overall heat content of the oceans and atmosphere does and have changed always, and is not necesarely true that increase of one of them leads or must lead to the decline of the other (if no warming there due to GHGs, or due to increased RF, that is what you mean, and what I consider as backwards)
That is why in paleo climate or natural climate,GHGs, CO2 emissions and RF are not considered as cause of climate change but more like amplifying of the warming.
The oceans have a much bigger role and impact in climate change, prior to the assumed AGW.
Paleoclimate data show very clearly that ocean heat content has increased in the past significantly without causing decrease of atmosphere heat or cooling, but incontrary have contributed towards its warming without any CO2 emissions or GHG increment, or a GW.
That alone debunks your claim, and puts a bigger question mark on the AGW, considering the condition you refer to and tried to explain the way you did.
You take for granted the 0.8C warming,aka the GW as caused due to GHGs, and that is what every body else here (almost) disputes, and that is what leads you to the backward explanation..
The backward explanation of yours is an attempt to use a very easy to explain natural pattern in an AGW manner, if you get my point, and if you consider carefully all we have argued you will find that you have made a mess of the reasoning. 🙂
In one hand, if I am not wrong, you claim that what is happening could be explained only if no GW, and in the other hand you claim that because the GW is a certanty then AGW must be a certainty and ….”the overall heat content is (or must be) increasing tremendously”.
You fail to consider, even in your approach, that the condition is possible to explain in a case of GW not caused due to GHGs, WHICH NATURALLY IS VERY POSSIBLE. 🙂
In a GW, natural, not AGW, what you refered to can still fit, but is not possible to have an AGW and only warming of oceans and a significant hiatus of atmospheric temps.
That pattern shows that oceans have still a bigger role or at very least equal to the GHGs, something that will put AGW further out of the realm of possibilities.
Consider that basically in Climatology GHGs for paleo or natural climate do not mean cause of climate change,…….. the GHG and RF do mean cause of climate change only for the last 150 years as due to the so claimed unprecedented anthropogenic CO2 emissions during that period. Are considered only as causing climate change in this period and in the future to come.
And that is what in question and doubted, by likes of me. 🙂
I hope you get my point.
Thanks again.
cheers
I can’t reply to your most recent post so I will reply to this one. You are right that the fact that temperatures are rising doesn’t imply that it is due to human activities and I never said that. It is my assertion that the weight of the evidence suggests that the warming we have observed over the past 150 is due to increases in GHGs from the burning of fossil fuels and human caused land use changes. Thousands of climate scientist, paleoecologists, and physicists find the evidence to be extremely strong. Their assertion is supported by tens of thousands of peer-reviewed scientific papers in many different disciplines. You cannot simply duck the issue and say it is due to natural variability. Changes of the magnitude we have seen must have a cause. What is your explanation for the increase in temperature we have seen over the last 159 years?
Luke:
The reason for the rise in temperature between 1650 and 2000 is the same reason that temperature STOPPED DECREASING between 1250 and 1650 and began increasing towards today’s Modern Warming Period.
The same reason it decreased from 200 BC towards a minimum in 650.
And the same reason it increased between 650 and 1250.
And the same reason it is now approaching a modern Warming maximum between 2000 and 2050.
Oh. And those “thousands of research papers”? They do NOT assign reasons for the increase. They project the recent increase into an exaggerated +4, +6, +8 or +10 degree increase, then predict what a possible effect on xyz may be IF the increase of 1/5 of one degree continued into a +10 degree increase.
@Luke’s latest reply to me.
Luke we actually were not basically arguing about if the GW is or not caused due to the GHGs.
That happens to be only a consequence of what we argued. That generally is unavoidable when arguing climate and climate change with AGWers, as that happens to be the center of the universe for the AGW mentality and the source and direction of any reasoning of that mentality.
My reference to the GHGs was after you mentioned it, as actually expected.
You see, you actually did imply (contrary to what you seem to claim) that the GW is anthropogenic by claiming the certainty that the atmosphere/ocean coupling is gaining heat (due to GHGs, greenhouse effect) because otherwise we would not have observed a long-term ocean warming without a large decline in atmospheric temperatures.
And that very claim of yours is false, as I tried to explain to you with my replies to you.
You did state and claimed that in your reply to Bob.
Actually the tone of that reply to Bob was like “how dare you suggest that the atmospheric/ocean coupling is not gaining any heat”
Dismissing so blatantly in a trivial way and through a backwards reasoning with an undisputable certainty the possibility that the atmosphere/ocean coupling is not gaining anymore any heat is what I argued against,…. the very possibility that actually seems to be the case in reality.
If that happens to threaten your convictions and belief in the AGW so be it, but what actually you claimed as to be clearly and certainly impossible is actually very possible.
Actually whether you were intending or not with clear intention and purpose to support the AGW through something that actually supports the opposite and threatens the AGW is not very relevant,…………what is relevant is that you did try regardless anyway.
And that was the arguing point, not your or my belief regarding the GHGs, or the empirical evidence that supposedly supports the AGW.
Luke, I am not ducking anything here, you are.
Let me say it again I was arguing against your false claim and statement in your reply to Bob, and there is no need to brink up the entire AGW argument in to the debate.
You were wrong, plain and simple.
Cheers
Luke, my statement is not nonsensical. I did not say the coupled atmosphere/ocean system is not gaining heat. Read what I wrote. It’s real easy to understand. Here it is again:
For nearly six years, we’ve discussed how weather events can lead to long-term warming of the oceans—at the surface and at depth.
You even quoted it, so I’m really surprised you misunderstood it. Then again, you may have been trying to misrepresent what I wrote. Now, that would not surprise me.
Have good day, Luke.
Luke – “the overall heat content is increasing tremendously-”
So do you think Nagasaki bombs have been added to Hiroshima bombs ??
Calm yourself, Luke. Say “I will not let the alarmists make me wet my britches”.
Say this to yourself several times a day, with conviction.
Soon you will start to feel better.
How do we know the warming of the extra-tropical Pacific is “unusual”. I’ll bet its happened before we just haven’t been watching. The weather in Vancouver has been warm and wet – go figure. Oh yeah except for when its been dry and cold that was unusual. Oh and cold and wet and windy and dry and………..
I think I understand:
Every year the observations show record high global temperature it is a weather phenomenon.
Every year that does not show new records are counter evidence of AGW.
/sarc
Is that what you are telling us Bob?
/Jan
Jan-As a Dane You can enjoy 16% more sunshine hours. And some 1 degree higher temperature. Global brightening in stead of dimming.
AGW perhaps but not the usual component.
Thanks oppti
I’m Norwegian not Dane, but that is close.
The article you show to about brightening caused by less aerosol polluting is very interesting, and good news for us living up North. I hope we can get even more brightening.
/Jan
Looking at your CMIP5 v measurements graph, I was wondering when the CMIP5 data was generated. Is a new CMIP model and data generated every few years? If so, how do the CAGW supporters justify their position from years ago that their models are reliable with the fact they have to constantly modify them? This seems inconsistent from a scientific approach view; if you create a model and then real data forces you to modify the model, as a scientist you admit the original model was wrong. It would also make you more hesitant to claim the new model is correct. Or am I missing something?
Patrick B, it appears the CMIP archives are updated for the IPCC reports. The criteria for the CMIP6 archive was recently established:
http://www.wcrp-climate.org/wgcm-cmip/wgcm-cmip6
Bob, please riddle me this?
When I see alarmists talk about the warming oceans they always spew forth as if the entirety of the oceans have been measured to have temperatures increasing.
Yet in reality the sea surface temperature data shows ocean warming to be regional at best.
Which raises another alarmist’s purposeful misrepresentation in asserting the MWP was a regional event.
Doesn’t our current and recent sea surface temperature data provide more evidence that our Modern Warm Period is in fact regional?
Isn’t their more overall evidence for a regional MWP than there is for our Modern period?
‘Yet in reality the sea surface temperature data shows ocean warming to be regional at best.’
But you see this is special ‘science’ that cannot be judge by normal standards, so regional is good enough to cover the whole planet when it comes to supporting AGW , but no where there enough when it comes to refuting AGW.
For example Mann’s ‘stick’ is very regional , while the evidenced for a MWP as a far wider geographical spread . But its the ‘stick’ which the alarmist claim is good enough to cover the world.
Steve Oregon, it has always been my view that sea surface temperature warming is regional, a result of coupled ocean-atmosphere processes.
I think Willis’ article on buoy temperature data is a microcosm of what has/is being done to buoy data worldwide.
Call it homogenization or just plain adjustments, how can you trust the government data?
Bob, how much faith do you have in the data you use for your graphs? They got rid of the MWP and the record heat in the 30’s. How can you trust the ocean buoy data as being accurate?
Forgot to link to Willis’ article:
http://wattsupwiththat.com/2014/11/28/buoy-temperatures-first-cut/
The models smear out temperatures, as you would expect a more generalized expectation. However, what I see of importance is that the actual world holds cooling as well as more contrast. The strong regionality is clear. A globally equal forcing somehow is being negated in some areas while being focused in others. This is what I would expect with redistribution, i.e. changes in how the world is taking energy from certain places and putting it elsewhere. If the planet were simply passive, you would expect a strengthening of the existing systems.
Of course, this is the problem with arguing with warmists. For them, today is “special”. All history is irrelevant. Planetary physics in the “anthropocene” is special, also. Everything that happens HAS to be viewed as an exception to experience by definition. Which is why you cannot win by reference to basic knowledge or historical records.
the difference between the MEAN of the models and observations is a wrong headed comparison.
Models need to face the observation Mano v Mano. Lumping models together as the IPCC does just
creates a model of models. That’s wrong headed if what you want to do is evaluate a model.
Further the difference between the mean of the models and the observations DOES NOT mean that the
models are twice as sensitive as they need to be. Models range in sensitivity from about 2.1 to 4.4 ECS
So, its silly for the IPCC to combine models into a model of models. And you cant reject a GIVEN model by looking at the difference between the mean of all models and observations.
Put another way, All you’ve done is reject the model of models.. which we know was silly to begin with.
Yes I know they did it first, but grow up.
Comparing the mean of models to observations, doesnt tell you WHICH models are better and which are worse.. iit just tells you that averaging models give you the wrong answer
Hello Steven I think I understand what you are saying. First by “Lumping the models together” you also average problems with each model. This clouds the issue of determining the most accurate model. I am not one who is against models by temperment. As a machinist I have programed and run CNC machining centers, (mostly I rely on “professional programers) A CNC program is similiar to a model in a simple fashion. I would not toss a CNC program because it needs to be tweaked. You have asked for constructive suggestions. At this point I can only offer encouragement. irreguardless of who is right or who is wrong it really would be nice to have climate models that we can use. I can tell you now if the planet really is cooling (I think it is) we will need them.
michael
Three Loonies in an asylum:
Loony A says, “I’m a hat stand,”.
Loony B says, “I’m a hat stand and so am I,”.
Loony C says, “I’m six hat stands,”
So how many hat stands do we have?
Climatologist answer: 1 + 2 + 6… all divided by 3 = We have 3 hat stands.
Correct answer = Don’t be a loony.
(GIGO)
I have 6 car factories;
1 makes cars without wheels
1 makes cars without motors
1 makes cars without interiors
1 makes cars without gearboxes
1 makes cars without glasswork
1 makes cars without doors, bonnets and boot lids
But on average, they make good cars.
Well said. Also, as the models make projections rather than predictions and as it is predictions that are required for the control of a system, global warming is not controllable on the basis of these models. These models are, however, the basis for governmental attempts at controlling global warming.
Terry, if you step on the brake pedal in your car, is what happens next at all contingent on whether you project or predict the car will slow down?
Mosher said…”Comparing the mean of models to observations, doesnt tell you WHICH models are better and which are worse.. iit just tells you that averaging models give you the wrong answer”
==============================================================
Gads Mosher! It tells you far more then that! The IPCC climate models are VERY informative because they all run wrong in the SAME direction, to warm. And that my friend does indicate that they over estimate the climate sensitivity to CO2.
Taking the modeled mean of a bunch of predictions which all run wrong in the same direction, is a blunder of the highest order if [your] objective is to improve your models to reality. On the other hand, if [your] objective is to write as many papers as possible depicting catastrophic harm from warming, then you will produce an over sensitive modeled mean and expect government funded scientist to attribute terrible harm based on the failed multi model mean.
The energy radiated by the earth to match energy received from the sun is emitted at about 5km altitude and has a blackbody temperature of -18 degrees centigrade. Assuming a lapse rate of 6.4 degrees/km this corresponds to a surface temperature of 15 degrees centigrade.
What is the problem and who needs a greenhouse effect?
You have to watch the pea and the thimble with climate science. Every description of the GHE implies that the black body temperature and the earth surface temperature should be the same. Then the rabbit from the hat is the back radiation which explains why they are different. This back radiation is then the basis of the GH effect and the 33 degrees or whatever becomes the magnitude of the warming ability of the GHE.
When you realise that the black body radiation actually occurs high in the atmosphere, then the two different temperatures are what you would expect. They are a consequence of the lapse rate. The need for back radiation as an explanation disappears and with it the climate controlling nature of the GHG effect.
Rob Painting – ” So it will be interesting to see who is right, the mainstream oceanographic community, or random dudes on the internet.” Ah – the ‘appeal to authority’ get out of jail card. Rob, for this card to work your ‘authorities’ have to actually have a record of getting it right and the ‘Random dudes’ it wrong. Let’s see who the actual authority is on historical form of getting it right. Shall we start at the top with Prof. Peter Wadhams perhaps? Oh. The ice free arctic prediction seems to have failed. He’s trying for a postponement. ;-/. We can go on… for a long time. Jimbo could provide a very long list. Let’s face it, on present form you’re better off with using Paris Hilton as your ‘authority’, let alone ‘random dudes’ like Bob Tisdale who seems to get a lot closer to right. I’d avoid appealing to that set of authorities until they improve their record a lot, to at least the same as the ‘random dudes’.
Dave – focus on the topic at hand. You can chant slogans about Wadhams later. This is about the ocean circulation and the way it affects ocean heat uptake and sea surface temperatures.
Bob doesn’t have any idea why the sea surface is warming so rapidly. Bob had no idea why the deep ocean warmed so much in the period since around 2000 – a period in which the IPO was in a negative phase. The scientific community, on the other hand, has researched the underlying mechanisms of this wind-driven ocean circulation for over a century now – see Ekman (1905) for example. The spatial patterns in sea surface temperature and sea surface height, characteristic of the positive and negative phases of the IPO, are simply the outcome of underlying physical phenomena.
For example; when the trade winds strengthen they drag more water mass westward across the Pacific Ocean because the Coriolis force is zero at the equator and negligible just either side of it. Rather than the net transport of water being deflected at right angles to the wind, as elsewhere on Earth, the friction of the wind on the surface layers drags water parallel to the equator – where it piles up against the ‘maritime continent’. So we get this build-up of warm water in the western tropical Pacific which raises sea level anomalously there. It also results in a stronger flow through the Indonesian Archipelago and along the western boundary currents.
Once the trade winds and midlatitude westerlies undergo weakening heading into the positive phase of the IPO that water mass in the western tropical Pacific will be siphoned away as it falls under the influence of gravity. So what we’d expect to see is a fall in rates of sea level rise in the western tropical pacific, Indonesian Throughflow, and along the western boundary currents. Conversely, the small rates of sea level rise along the eastern Pacific will increase as the weaker trade winds allow the water mass, siphoned away from the west, to build up there. The post by ‘Steve Goddard’ about falling sea level near the Philippines would be consistent with this. It would be worthwhile checking recent sea level trends in adjacent areas of the western Pacific basin, to see how widespread this is.
As for Bob’s theory, well near as I can make out, it doesn’t provide any insight as to why the sea surface temperatures are warming so much, nor all the spatial changes in sea surface temperature and sea surface height. It’s more than a bit problematic. So it’s not an appeal to authority, but an appeal to evidence.
Rob Painting, I didn’t realize you were still hanging around, spreading misinformation and exposing your misunderstandings. .
You wrote: “Bob doesn’t have any idea why the sea surface is warming so rapidly.”
Actually, my post that follows is quite comprehensive, Rob. Most people here understood it. Why can’t you? I’ve also discussed it on numerous threads, Rob.
https://bobtisdale.wordpress.com/2014/08/16/on-the-recent-record-high-global-sea-surface-temperatures-the-wheres-and-whys/
Rob Painting says, “Bob had no idea why the deep ocean warmed so much in the period since around 2000 – a period in which the IPO was in a negative phase…”
Have you seen this graph, Rob? It’s data direct from the NODC website:
According to the studies you’re thinking about, the Pacific should be warming in response to the negative IPO. Guess what? No warming in the Pacific to depths of 2000 meters in the ARGO era.
You have a nice day, now, Rob.
Rob Painting – My bet is on the random dudes. If climate sensitivity terms used in the IPCC models were cut by half, the climate science and mainstream oceanographic communities might be able to compete. The over-estimate of climate sensitivity (effectively lumping all the forcing estimates, known and unknown) is the root cause of the increasing discrepancy between the widely touted model projections/predictions/forecasts and observed reality. Of course, if they do this, the case for the anthropogenic source of global warming vanishes (as does their funding).
Either way, time is making the dissonance between alarmism and reality more obvious, even to laymen. Interestingly, the rhetoric from the CAGW community is becoming more hysterical on a daily basis, suggesting they sense the rapid loss of credibility. Hopefully, this will accelerate the demise of their agenda. The sooner the better, so the world can get back to common sense and economic growth again.
Is climate sensitivity overestimated? I don’t know about that. Climate models are able to simulate hiatus decades and the climate sensitivity emergent in those models is around 3 degrees. I expect the positive phase of the IPO, whenever it arrives, will be a stern test of recent energy balance-type estimates.
Rob says…”I expect the positive phase of the IPO, whenever it arrives, will be a stern test of recent energy balance-type estimates”
========================================
Well Rob, for most of the time since the cool late 1970s time frame, (.post the ice age scare) we were in positive ESNO conditions. Therefore the models are still out of sync with the natural system. By out of sync, I mean the negative phase of the PDO and the AMO have considerable time left to balance out the warm phase.
Natural variability has dominated on the warm side still, with more potential in the next two decades for cooling. All of the time when ocean cycles enhanced warming, you (alarmist in general) igored them for the most part, and ALWAYS in public press releases. Now that warming has at least paused, you run to natural causes.
So along about 2035 we will have one reasonably complete cycle of positive and negative ocean cycles. In the mean time climate sensitivity looks to be far less then the modeled mean indicates, and the benefits of CO2 are ever manifesting in producing more food on less water and land requirements, and the projected harms are failing to materialize, like the predicted warming, like the hot spot. The theory of CAGW is simply wrong according to the observations.
Rob Painting – I am going to cheat and respond with a succinct statement (with which I agree) made in the comments on Bob Irvine’s Guest Post of April 5, 2013 “A Comparison Of The Earth’s Climate Sensitivity To Changes In The Nature Of The Initial Forcing” with all due credit to Bill Illis:
Bill Illis April 6, 2013 at 5:49 am
“The whole 3.0C per doubling proposition is based on the feedbacks (and if fact, how they multiply out and produce feedbacks on the initial feedbacks and then accumulate).
The values that are used for the feedbacks are carefully tuned to arrive at the 3.0C per doubling proposition (and to remain at the 3.0C which was guessed at in the beginning of the science before the feedback values and the forcing calculations for GHGs were finally sorted out – the science was not even sorted out before 3.0C per doubling was decided on).
For example, here are the IPCC feedback values:
Initial Doubled GHGs – +4.2 W/m2 –> +1.12C
Water Vapor Feedback -> +1.75 W/m2/K
Cloud Albedo Feedback -> +0.75 W/m2/K
Other Feedbacks -> -0.05W/m2/K
Total increase from Feedbacks (and feedbacks on feedbacks) -> +7.46 W/m2 –> +1.98C
Total Increase –> +3.05C per doubling
———————————————–
Let’s double the feedback values to:
Water Vapor Feedback -> +3.5 W/m2/K
Cloud Albedo Feedback -> +1.5 W/m2/K
Total increase from Feedbacks (and feedbacks on feedbacks) -> +242.1 W/m2 –> +48.1C
Total Increase –> +49.2C per doubling
———————————————–
Let’s cut the feedback values in half:
Water Vapor Feedback -> +0.875 W/m2/K
Cloud Albedo Feedback -> +0.375 W/m2/K
Total increase from Feedbacks (and feedbacks on feedbacks) -> +1.94 W/m2 –> +0.50C
Total Increase –> +1.6C per doubling
———————————————
Let’s just reverse the sign of the cloud feedback:
Water Vapor Feedback -> +1.75 W/m2/K
Clouds Albedo Feedback -> -0.75 W/m2/K
Total increase from Feedbacks (and feedbacks on feedbacks) -> +1.40 W/m2 –> +0.37C
Total Increase –> +1.48C per doubling
———————————————
The cloud feedback value is a make or break for this theory. We have no idea what it really is or whether it really has a positive sign or a negative sign. And even more so, the water vapor feedback is a make or break. At least it is based on another theory Classius Clapeyron, but so far this value looks to overstated by almost double.
There is room within this theory to examine at least the feedbacks (if not the temperature change from doubled CO2 itself). As this post does, we need to use empiricial data to see what is really correct.”
Luke December 14, 2014 at 10:43 am
I suggest that there is abundant empirical evidence that the cause of the warming is an increase in GHGs from the burning of fossil fuels.
—————————————-
Luke, if there is abundant empirical evidence as you “suggest” for the cause of the warming being an increase in GHGs from the burning of fossil fuels, why don’t you just post it?
Could you please post it – top two or three bullet points, or more detail. Whichever you prefer ?
I just wander why they don’t use the big headlines when it sometimes is a bit colder than the year before.
We are told it should constantly be warmer, so that is in a way “normal”, and then a cold year should really be alarming.
The article’s phrase “AGW PREDICTS” draws a conclusion from an equivocation on the polysemic term “predict.” To draw such a conclusion is an equivocation fallacy (http://wmbriggs.com/blog/?p=7923),
What people like Rob Painting forget is that it was those “random guys” who gave us things like aeroplanes, electricity, computers, submarines, jet engines, etc, etc.
Can someone explain how monthly adjustments that go back many years are justified? Remember how NOAA as recently as September said that 2010 was the record hot year? Well, it no longer is – it has been adjusted down and now equals 2005. Here are the 2014 monthly anomaly series I downloaded from NOAA: in September and November:
Sep – 0.64,0.68,0.79,0.77,0.71,0.68,0.67,0.60,0.52,0.58,0.74,0.44
Nov – 0.60,0.60,0.77,0.76,0.69,0.68,0.66,0.60,0.50,0.54,0.69,0.37
What could have possibly happened during two months of 2014 to make 2010 so much colder than before?
Reblogged this on Centinel2012 and commented:
NASA and NOAA have no creditability when it comes to publishing data and studies the data is compromised and so any results that this data shows has no meaning.
The ONLY reason CAGW alarmists keep high-end model projections (ECS greater than 4C) in the model ensemble is to keep the ECS mean well above 2C.
If business as usual (BAU) ECS model mean projections are even close to 2C, political hacks have a very difficult task convincing taxpayers to waste $10’s of trillions on CO2 sequestration measures to keep global warming below 2C, when no money can be spent, no cuts in CO2 are required, and actual ECS is actually below 2C and perhaps as low as 0.5C…
The logical and scientific response to wildly inaccurate high-end model projections is to delete them entirely from the CAGW model ensemble, but because of the political reasons explained, this cannot currently be accomplished.
The CAGW hypothesis has already become a scientific embarrassment. More and more scientists outside (and even in climatology) realize CAGW is, for all intents and purposes, a disconfirmed hypothesis, however, because of the $billions in CAGW grant funds at stake, skeptical scientists are still reluctant to speak out for fear of reprisals.
Since the CAGW movement is already in its 26th year (from Hansen’s 1988 Congressional testimony), a growing number of retiring scientists are belatedly expressing their CAGW skepticism. This phenomenon will only gain momentum as more and more scientists retire and global temp trends continue to remain flat/falling/static/marginally increasing.
Also, ECS does not exist as a scientific concept in view of the absence of falsifiability of its numerical value.
Exactly which is why Samurai gave the correct POLITICAL reason for the high climate sensitivity.
Bob do you have for the graphics that you have done for RCP 6 for RCP 8.5 Our Parliamentary Commissioner for the Environment has a report out and they use 8.5 and I am trying to respond to it and while I could use 6 it would be better to use 8.5 If you have them could you email to hearlek@eol.co.nz
What a wonderful collection of highly relevant references. It is a treasure trove.
Why do we always see linear projections? A junior assistant trainees mate in signal processing would tell you that you do a best fit curve based on the average several different periods as the likely trend as the simplest acceptable method, assuming no sudden random disruptions.
When considering what AGW predicts, one should also consider Ferenc Miskolczi recent paper on The Greenhouse Effect and the Infrared Radiative Structure of the Earth’s Atmosphere, published in Developments in Earth Science Volume 2, 2014..
I believe that the paper can be downloaded at: http://www.seipub.org/DES/Download.aspx?ID=21810
I guess that we are all waiting to see an increase in DWLWIR as predicted by the AGW theory, and if there is some increase good quality and convincing data that links that increase with a warming of the atmosphere and the oceans.
Further to my last post, perhaps I should have remarked that there are data issues with the data relied upon by Miskolczi. However, that is a common theme throughout all of climate science. All the data has issues, and i guess one has to work with the best of a bad bunch, but make it clear that one is working with crap, and as a consequence attach realistic error bands to what is shown, or claimed to be shown.
The reason cAGW still persists is a consequence of the crappy quality data that we have, much is being overstretched well beyond its design specification, and yet scientists fail to set out out realistic error bands which are an integral consequence of poor quality data.
Good on yer, Bob! Another brilliant post – thanks so much!
Why are people worried about ‘ocean’ warming?