Guest Post by Bob Tisdale
Monthly sea surface temperature data from NOAA (ERSST.v3b) are available online well before the global land air+sea surface temperature suppliers (NASA GISS and NOAA NCDC) publish their monthly updates. In addition to annual (January to December) data, GISS also presents what is known as the Meteorological Annual Mean data, using the months of December to November. So, in advance of the release of the GISS and NCDC combined products, let’s see how the global sea surface temperatures in 2014 compare to the previous record high back in 1998, on a Meteorological Annual Mean basis, using the dataset employed by both suppliers (NOAA’s ERSST.v3b). We’ll start the data presentations in 1997 to make the comparison easier, and I’ve also provided color-coded horizontal lines to show the 1998 (blue) and 2014 (red) values. Last, I’ve presented the data in absolute terms, not as anomalies, but that makes no difference.
QUICK NOTE FOR THOSE WHO ARE FIRST DISCOVERING THAT GLOBAL SEA SURFACE TEMPERATURES ARE AT RECORD-HIGH LEVELS: The record high global surface temperatures in 2014 are primarily a response to a prolonged weather event in the North Pacific. See the post here. Putting that in more familiar terms: You often hear meteorologists talking about a blocking high during a heat wave. So it might be easier to think of the record high sea surface temperatures globally being caused by a prolonged blocking high in the extratropical North Pacific, south of Alaska. [End note.]
As shown in Figure 1, global sea surface temperatures (based on NOAA’s ERSST.v3b dataset) from pole to pole were 0.02 deg C higher in (Dec to Nov) 2014 than they were in (Dec to Nov) 1998. That’s read two one-hundredths of a deg C. Two. All of the hubbub this year boils down to two one-hundredths of a deg C.

Figure 1
But GISS masks (excludes) sea surface temperature data in the polar oceans, anywhere sea ice has existed. And NCDC, as far as I know, excludes polar sea surface temperature data seasonally when there is sea ice in a grid. So let’s take a look at global ocean data excluding the polar oceans, Figure 2. That is, we’re looking at the data for the latitudes of 60S-60N. And as you can see, on a Meteorological Annual Mean basis, 2014 surpassed 1998 by only 0.02 deg C for those latitudes as well with the NOAA ERSST.v3b data.

Figure 2
WHAT ABOUT NOAA’S SATELLITE-ENHANCED SEA SURFACE TEMPERATURE DATASET, REYNOLDS OI.V2?
In 2008, NOAA introduced its ERSST.v3 data, which included satellite-data starting around 1982. NOAA quickly discovered the satellite-enhancements rearranged the record high years for their combined land+ocean data, making 1998 once again higher than one of the years in the early-to-mid 2000s. If memory serves, the differences were measured in a few hundredths of a deg C. But NOAA didn’t like that, so they removed the satellite-enhanced data from their long-term sea surface temperature reconstruction, making it a poorer-quality dataset, and renamed the dataset ERSST.v3b.
In 2013, GISS switched to NOAA’s ERSST.v3b sea surface temperature dataset from a combination of the UKMO HADISST data before the satellite era and Reynolds OI.v2 satellite-enhanced data starting in 1982. That of course increased the trend of the GISS data a small amount since 1900 and rearranged the highest temperature rankings in the 2000s a tiny amount in their GISS Land-Ocean Temperature Index (LOTI) data.
NOAA still supplies a satellite-enhanced sea surface temperature dataset. It runs from November 1981 to present. It’s known as Reynolds OI.v2, and it’s the dataset I use in my monthly sea surface temperature anomaly updates. (See the November 2014 update here.) It’s the basis for many of the daily sea surface temperature anomaly maps you see online.
[sarc on] Good thing both data suppliers went to all the trouble to change sea surface temperature datasets. On a “Meteorological Annual Mean” basis, the satellite-enhanced sea surface temperature data in 2014 was 0.01 deg C higher in 2014 than in 1998. They gained one one-hundredth of a deg C by excluding the better-quality satellite-enhanced data. Whew!! [sarc off]
See Figures 3 and 4 for the global “Meteorological Annual Mean” sea surface temperatures from 1997 to 2014, with and without the polar oceans, based on the Reynolds OI.v2 data.
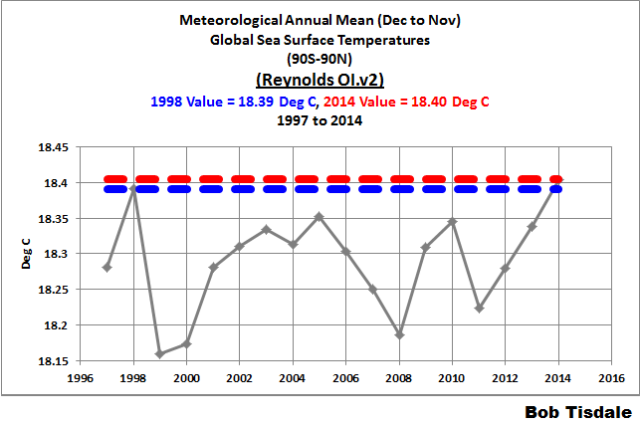
Figure 3
# # #

Figure 4
In a few days, GISS and NCDC will publish their November 2014 values. It will be interesting to see where they fall…and also see how alarmists try to make it appear as though the end of the world is near.
I guess we could call that the ‘gas’ ceiling……..? Bad joke? Never mind…..
Yeah, but the comment was a gas.
What is the error margin on those two hundredths of a degree?
2C, would be my guess.
My thoughts entirely. Within the error margins I expect so no rise at all in reality especially since they discount ice covered waters. They will be using tropical waters next to calculate the global riser.
Thanks Bob.
Ljh, HADSST3 data are based on the same ICOADS source data as the ERSST.v3b. NOAA infills the data for their ERSST.v3b data while the UKMO does not infill the HADSST3 data.
With that in mind, the following HADSST3 data show a variety of 95% confidence ranges in columns 3 through 10, with them combined in columns 11 and 12.
http://www.metoffice.gov.uk/hadobs/hadsst3/data/HadSST.3.1.1.0/diagnostics/HadSST.3.1.1.0_annual_globe_ts.txt
and here are the format instructions:
http://www.metoffice.gov.uk/hadobs/hadsst3/data/global_ts_format.txt
Cheers
Bob if you showed the error bars it would make a punchier message.
My point exactly. Can we really build electronic devices that can read to that level of accuracy, period?
The “accuracy” is not in the individual measurements. The numbers you are looking at are averages, not direct measurements. We all know about “standard error”
..
http://ww2.tnstate.edu/ganter/BIO311-Ch6-Eq1.gif
…
as n approaches infinity, the SE approaches zero
David,
I would think this only captures a portion of the error. You need to include the
precision of the measuring devices and methods and do a full uncertainty
analysis. I don’t think you can use statistics to reduce the error of the
measurement to BELOW the precision of the actual device/methods used.
Bill_W
The error of the instrument is reflected in the lower case “s” (standard deviation) in the equation.
Also, just noticed that from 1998 to 1999, apparently the average of the global SSTs dropped by 0.25 degrees which is 10 times larger than the change between 1998 to 2014 that will now be proclaimed warmest ever.
David Socrates
Is this math? – or a veiled Roman Catholic message – sex = sin?
phlogiston
From your response, it’s easy to see where your projections are focused.
David – to apply the standard error formula, the measurements need to be independent and identically distributed (in the statistical sense).
Hello Alan if you know any machinists ask them this question. For myself with over 40 yrs in the trade (started at age 14 in a tech school) I would have say depends. If their were made with the same q.c. as say a nuclear device I would say maybe. And like such it could be guaranted to work once.
Understand such devices are not strickly electrical, they are also machanical. In the trade we have such a thing as “stacked tolerance. This means we can build said device from components all at defferent extremes of the tolerances. It would function barely, but at which extreme? Are all the devices made with the tolerance on the mean to the high? If instead you averaged them from the low of the tolerance to the high guess the rest.
Next Mat’ls, just like paint differs from lot to lot, so can mat’l if not special order.
Generally the small “s’ that David Socrates refurs to in his formula is undefineable. None of us have all the pieces of the puzzle just, just a few. Just be happy they work and give some data. And remember when they were deployed, and all the advances made since then. In other words don’t expect “boeing 747” preformance from a DC-3
michael
Walt D.
…
The mean, standard deviation and standard error are all values calculated from collected data. Knowledge of the underlying distribution is not necessary to apply the standard error estimator.
Izzat sqrt (N) or sqrt(N+1). I’ve seen both.
And I believe that applies only to N repetitive measurements of the same quantity with the same apparatus, under the same conditions.
Not to N values of N different occurrences.
I know that the shot noise in a very small electric current (charge actually) that gathers a total of N electrons, has an RMS value of sqrt (N) (electrons).
One of the all time major statistical SNAFUS, took place in the Viet Nam War era; specifically on the occasion of the very first “Draft Lottery”.
In essence, males between ages 18 and 26 years old, who had registered for the USA draft law, were divided into 366 groups, based solely on the calendar date of their birth (including Feb 29).
When it came time to choose men to send to Viet Nam (well at least draft for that), they did a ping pong ball like lottery drawing, and selected those 366 numbers in a supposedly random process. An early selected birth date, marked you for drafting.
Within days of publishing the result of this lottery so everybody knew where they stood, some otherwise unemployed statisticians issued a claim that the lottery was biased, and therefore unfair.
it seems that the earliest drawn numbers often happened to be also earlier calendar dates. So if you were born in January, your birthday might come up early in the drawing.
What a ruckus this created, and eventually led to the end of draft lotteries.
Now remember that this kerfluffle took place following the very first one and only draft lottery to have occurred.
So how good is a declaration of non fairness bias based on a single event. Precisely one event had occurred.
Well that depends on how many different outcomes there could have been for that single event.
Everybody knows, that the answer is there are factorial 366 possible different outcomes of such a lottery.
That is a number so astronomically large, that I don’t believe there are that many atoms in the entire universe. Yet on the basis of 1 : 366 ! odds against that particular result occurring, the “experts” declared the lottery biased and unfair.
The experts were so dumb, they didn’t even think that the odds of that particular drawing occurring were exactly the same; 1 : 366 ! as the result being : Jan1, Jan2, Jan3, Jan4,……..Dec28, Dec29, Dec30, Dec31.
They could have had one draft lottery every picosecond, for the whole year, and still not have a big enough sample to be able to declare the results to be not random, but biased in some way.
The odds of winning a lottery only become apparent after you have entered a very large number of lotteries.
Otherwise, if you buy a ticket, you might win; or if you buy all of the tickets except one, they guy(al) who bought that one might win instead of you.
If you don’t buy a ticket you neither win nor lose.
You are absolutely correct when you say that you’ve seen sqrt(n) and sqrt(n+1)
…
The variance of a population is calculated using sqrt(n)
The variance of a sample is calculate using sqrt(n-1)
Here is population variance
http://www.macroption.com/formulas/population-variance-formula-b.png
Here is sample variance
http://www.macroption.com/formulas/sample-variance-formula-b.png
Better links….
Population variance
..
http://sphweb.bumc.bu.edu/otlt/MPH-Modules/BS/BS704_BiostatisticsBasics/PopulationVariance.jpg
…
Sample variance
..
http://sphweb.bumc.bu.edu/otlt/mph-modules/bs/bs704_summarizingdata/Variance_Formula.png
To add my two pennyworth: David Socrates is correct.
Given a wooden rule with increments marked every 3 inches between say 5 ft and 6ft 6 ins, I could then take a random sample of 1000 US males and estimate the true average height of US males to within 0.05 of an inch (and probably closer). It’s not just about the measurements it’s about the distribution of the data.
You are both wrong. You are confusing measuring where you have a greater accuracy with one you do not. If your only measurement is whole cars, you cannot say that 1.5 cars pass per minute. All you can say is that 1-2 cars pass per minute. And you changed feet to inches. Both fine measurements, but hardly interchangeable.
Apparently you are a product of “new math”.
Philjourdan
..
Re: “You are both wrong”
…
According to your logic an American major league baseball player cannot have a .254 batting average. Since he either gets a hit (1) or does not get a hit (0) his “average” can only be “1” or “0”
…
Good luck with that idea. In fact, if you round properly, every single batter in the league has an average of “0”
Wrong again. Your ignorance is astounding. In one case you are arguing that you can predict an accuracy that does not exist. You cannot.
In the other, it is not ‘statistics’ in the scientific sense, is is just an Average. A player cannot hit the ball .254 each at bat. But he CAN hit it 1 out of 4 times roughly.
Learn basic math please. Your ignorance is painful to read.
Let’s put it this way. Usain Bolt’s 100m world record is 9.58 seconds. Supposed in another race they used 10 old fashioned stop watches that measure to 0.1 seconds. Suppose we get 10 measurements – a mixture of 9.5,9.6 and 9.7 readings. The average or these 10 numbers is less than 9.58. Can we say that we have a new world record?
If that was the defined method for determining race outcomes and records for single events, yes. It’s in attempting to define trends over time where the data variability gets you.
Actually, a sample of 30 is generally considered the required minimum (student’s T distribution) to begin talking about confidence intervals. A sample of 10 would be meaningless. Also, aside from sampling error there is the potential for mechanical error in the stop watches, just like in the temperature measuring devices. 0.2 degrees is meaningless.
Sorry, 0.02 degrees, even more meaningless.
The 0.02 degree movement depends on sample size,more so than instrument accuracy.
Socrates,
Actually, it depends more on representativeness of the sample which would not only include sample size but also overall sampling methodology including distribution of the samples.
Presumably zero, because that number is NOT measured by anybody(s), anywhere(s), anytime(s), but is calculated by someone(thing), somewhere, sometime, from some set of real numbers, which themselves were not measured by anyone, anytime, anywhere.
So whatever it was that actually measured some Temperature(s), somewhere(s), sometime(s), not necessarily all concurrently, might have had some error margin(s) sometime(s), somewhere(s) but that information is long gone lost in the prestidigitation.
It’s for sure, there is no one person, you can call on the telephone, and ask: “Was it you who calculated this 0.01 deg. C difference ??
So it’s really turkeys all the way down.
But the very next data item that gets added to whatever this data set is, will either be equal to the very last (most recent) data item that was added, or else it will be higher than that item, or it will be lower than that item.
But unfortunately, nothing in the analysis that led to that 0.01 deg. C increase, nor in Bob’s timely analysis of it, can tell us, which of those three options it will be. And as for the second new data item to get added at some even later time; well that is just totally chaotic.
So don’t worry about it; we will survive which ever of those three options happens.
As an aside to this SST disastrous event. Latecomers to this information source consistently accuse Lord Monckton, of ‘photoshopping’ his ‘extend the stoppage’ monthly exercise by choosing the wondrous 1989 El Nino blast as the start of his time interval; which “artificially” jacked up the monotonous global warming entourage, and thereby hiding the continuing global warming that took place during that 18 odd years of no global warming.
A couple of things to note.
1/ It is true that prior to the 1989 super nino, there was a definite period of generally upward Temperature trends. Nobody disputes that.
2/ It is also true that that super nino event of 1989 was immediately terminated in the following year by the big dump of 1990.
So nyet on 1989 disguising a ramp, as a stoppage, because 1990 put the kibosh on any cloaking device.
As a result, 1989 does tend to set itself up, as a natural wall for Monckton’s algorithm to crash into each month, as it searches for an earlier start to a statistical stoppage.
There is an important corollary to that effect.
To the left of 1989, there is a big cliff, due to the earlier global warming era. The only way for the Monckton algorithm to climb down that cliff to an earlier lower GT month and extend the “stoppage”, is if the current RSS monthly number is itself LOWER than the general level of the stoppage.
And that 1989 super nino has been the de facto algorithmic end point, ever since Christopher started his postage, so the occasional extensions of Christopher’s global stoppage, up to its now 18 year and 2 month length have ONLY occurred because the current monthly RSS has moved lower than the general stoppage level, because the 1989 end point isn’t moving much at all.
So the lengthening of the stoppage is only occurring, because there actually has been a decline in GT during that 18 year interval, although that decline may not have reached the level of statistically significantly altering the trend slope from zero.
The only way Monckton’s end point is going to move back much earlier than the 1989 wall, is if the current RSS starting point of the exercise continues to drop more often than it increases.
I don’t recall, just what the length of “The Monckton Stoppage”, was when he first posted it, but its continual increase in length is evidence for an actual present cooling.
Well that’s just my opinion of course; so do not cite this in your PhD oral exam. It could be total nonsense.
George, I know you that you know that you meant the 1998 El Nino (re your comment at 11:54 am).
In the meantime both SH and NH thickness and extent ice continues to increase within normal ranges….so global warming increases ice production…LOL
Any reason why this data isn’t handed to a third party statistician for assembly/audit?
These organizations are so wedded to producing a desired result that credibility is sorely lacking.
I have had that thought many times myself. There are so many debates about the efficacy of the statistics, why not turn over some of the issues to an independent, non-biased board of the best statisticians in the world for
their call on the quality of methods used. My head swirls at times trying to figure out who is right in the debates on the statistics.
Its harder to find the result you are looking for if you let someone else analyze it for you!
My God! Two of those graphs show a rise of 0.01 degrees, and one shows 0.02 degrees in just seventeen years. It’s runaway Global Warming! We are totally, irrevocably, doomed!
RoHa, can you play it down a little, you’re making me worried stiff.
Don’t you realize that 0.01 or 0.02 degrees in 17 years represents a trend that if continued will result in an increase of 0.05 or 0.1 by 2100. You can already see the massive climate disruptions that take place year to year on changes of a few one-thousandths of a degree. Can you imagine what sort of disruptions would be caused by a full 1/20 th or 1/10 th of a degree? (Hint you need a good imagination! 🙂 )
Bugger, I’ve wet myself.
Are you seriosly suggesting the trend is 0.01 or 0.02 K in 17 years?
No ‘tttt’, Walt is correctly pointing out that in just 86 years from now (2100), Global Sea Surface Temperature may ‘rise’ by one tenth of one single degree (I too have ‘used my imagination’ to picture what impact this will have, but just end up scratching my head).
tttt,
The problem is NOAA/GISS/UKMet like to “suggest” to leave incorrect impressions in the minds of a naive public.
The data analyses Bob presented here speaks for itself. That data doesn’t suggest 0.125degC/century.
So it is the data that suggests there has been no statiscally meaningful change in global temps since at least 1998.
Geejam,
yeah it may, or then it doesn’t. However, the plots look like they have much higher trend than that.
joelobryan,
I don’t know where 0.125 degs/century comes from, and I don’t understand where the conclusion about no statistically meaningful change comes from? To me, even these short plotted timeframes look like having a clear upward trend.
tttt,
“short plotted timeframes have a clear upward trend…”????? YGTBSM.
There are no meaningful linear trends in any of the plots pesented above. Excel or another program could draw one, but it would be meaningless. That you think you see one there is one is precisely the error NOAA-GISS-UKMet wants the public to make on their own. That is how they delude themselves of their scientific integrity remaining intact.
joelobryan,
I don’t particularly care what anyone wants me too see, I can draw my own conclusions. I said it *looks to me* there is a clear upward trend, and that is what I see without considering what the data represents. It might be that there’s no statistically significant trend there, and if so, then that’s my error (I haven’t calculated it). However, you need only go back a couple of years in the time series and you will get a statistically significant trend, and given the even earlier data, there’s no reason to think the longer term positive trend has vanished anywhere.
ttt. I think we are referring to the trend in the highest recorded temperature.
No wonder the Arctic ice will have disappeared by next year.
It promises to be a strong cooling of the eastern Pacific.
http://www.cpc.ncep.noaa.gov/products/stratosphere/strat_a_f/gif_files/gfs_z100_nh_f00.gif
The temperature of the South Pacific. Can be seen the close relationship between the temperature of sunlight.
http://polar.ncep.noaa.gov/sst/rtg_high_res/color_newdisp_sst_160W_95W_65S_20S_ophi0.png
ren says, “The temperature of the South Pacific. Can be seen the close relationship between the temperature of sunlight.”
“Temperature of sunlight?” Should that be temperature and sunlight? And I’m not sure shat you’re trying to tell us. Everyone knows the tropics are warmer than higher latitudes because the sun shines more directly down on the tropics. And everyone knows that there are seasonal variations in sea surface temperatures.
But that does not explain anomalies, which consider the seasonal variations.
http://hockeyschtick.blogspot.com/2014/12/maxwells-demon-proves-why-cold-gases.html
This anomaly (2 degrees C), soon to be significantly reduced. The change in circulation was caused by high solar activity.
http://polar.ncep.noaa.gov/sst/rtg_high_res/color_newdisp_anomaly_160W_95W_15N_65N_ophi0.png
That’s actually too bad, we’ve been enjoying our little reprieve from winter temperatures and are glad to see the snow melting. Last year’s December 8 and later snowfall was still on the ground in April. There’s almost none on the ground at the moment, and we have one more day before the nice warm flow ends.
(Calgary)
ren says, “This anomaly (2 degrees C), soon to be significantly reduced. The change in circulation was caused by high solar activity.”
Do you have data to support that, or are you simply making an unsubstantiated claim?
Yes.
http://www.cpc.ncep.noaa.gov/products/stratosphere/strat-trop/gif_files/time_pres_WAVE1_MEAN_OND_NH_2014.gif
http://www.solen.info/solar/images/swind.png
Pity a worldwide rule cant be made that all temperature graphs must be displayed as 0 to 100 degrees centigrade or the equivalent in Fahrenheit. That would destroy this thing in short order as ordinary people would look at the tiny variations all the drama is about and the laughter at the naked Emperor would become deafening…
Aidan says, “Pity a worldwide rule cant be made that all temperature graphs must be displayed as 0 to 100 degrees centigrade…”
It looks even more pitiful in degrees K starting at zero.
No reason to trade bias one way for bias in another. What I want to see is the variation. You can’t effectively see that in the plot you discribe. That being said, smart people do seem to get quite worked up over 100 years of very stable temperatures.
Plotting Bob’s fig 1 data and using just a Y-axis range of -3 to +33 ºC, encompassing the range of the world’s ocean temps, it looks pretty insignificant.
http://i62.tinypic.com/282ia2a.png
Another choice for comparison is heat content per unit volume. It’s a bit disingenuous to imply that a 0.02 degree increase in ocean temperature is insignificant. An increase of 0.02 degrees in ocean temperature in terms of real heat content is far greater than a 0.02 degree increase in atmospheric temperature.
As correctly pointed out at the beginning of this article, fluctuations in ocean sea surface temperatures are far more likely due to natural ocean cycles than to CO2-induced global warming.
A 1 C change in ocean temperature is insignificant, for the simple fact that we don’t (and CAN’T) measure all of it, only representative samples. Any pretense at this sort of precision is delusional at best, dishonest at worst.
CodeTech, satellites do a good job of capturing sea surface temperatures globally:
http://www.emc.ncep.noaa.gov/research/cmb/sst_analysis/images/satcol.png
That’s a whole lot better than ship inlets and buoys:
http://www.emc.ncep.noaa.gov/research/cmb/sst_analysis/images/inscol.png
Bob,
Sure Satellites do a good job, but we’ve not had them for very long, and OHC, pfft.
IMO what we have is we’re measuring something that until recently wasn’t even measured, and using that to claim something is historically unprecedented, When it could have (and probably did) happen many time in the past, and we just never knew.
It’s disingenuous at best.
Let me also note almost all of the changes in GAT are due to regional swings in Minimum temps. Not a positive trend, up and down changes in min temp at different times and places around the globe. Anyone who looks at the change in station min and max temps on a day by day basis can see this. Max temps dither around zero, up and down. Min temps do this as well, but also have regional “disturbances”, large swings in the daily rate of temp change.
When looking at the rate of change in temperature averages out at thousands and tens of thousandths of degrees, there is no global trend what so ever.
Many western politicians follow the UN on global warming when the true science proves a miniscule change if any up or maybe down . 0.02c up with C02 at 0.004 pts Why are these decimal figures so difficult to understand by our leadership ?
Because who end up in politics generally know how to manipulate people not numbers.
Hmmmm….and where does that warmth go?
Heat is always leaving. Warm surface means cooling deeps. The heat leaves out the atmosphere. As Aidan points out, the choice to use tiny scales to make trivial changes appear scary is deceptive as well.
hunter says, “Warm surface means cooling deeps.”
Not always. A warming at the surface, due to changes in cloud cover for example, can also coincide with a warming to depth.
Bob,
You are right of course. “Always and never are seldom true” as they say.
However for me the rule of thumb I was taught by more than one engineer is that over time, heat is seeking to leave any system in which it is held.
bob tisdsale – you might invent an app for this:
11 Dec: USGS: NASA-USGS Climate Data App Challenge: An Invitation for Innovation
NASA in partnership with the U.S. Geological Survey (USGS) is offering more than $35,000 in prizes to citizen scientists for ideas that make use of climate data to address vulnerabilities faced by the United States in coping with climate change.
The Climate Resilience Data Challenge, conducted through the NASA Tournament Lab, a partnership with Harvard University hosted on Appirio/Topcoder, kicks off Monday, Dec. 15 and runs through March 2015…
“Federal agencies, such as NASA and the USGS, traditionally focus on developing world-class science data to support scientific research, but the rapid growth in the innovation community presents new opportunities to encourage wider usage and application of science data to benefit society,” said Kevin Murphy, NASA program executive for Earth Science Data Systems in Washington. “We need tools that utilize federal data to help our local communities improve climate resilience, protect our ecosystems, and prepare for the effects of climate change.”
“Government science follows the strictest professional protocols because scientific objectivity is what the American people expect from us,” said Virginia Burkett, acting USGS associate director for Climate Change and Land Use. “That systematic approach is fundamental to our mission. With this challenge, however, we are intentionally looking outside the box for transformational ways to apply the data that we have already carefully assembled for the benefit of communities across the nation.”..
http://www.usgs.gov/newsroom/article.asp?ID=4072
They are still giving money to find out why pig farms stink. “Global Warming causes pig farms to stink more”. I’m sure we could get a grant to develop a gas mask.
(Another wasted effort posted by a banned sockpuppet. Comment now DELETED. Cheers. -mod)
Because the discussion is about record highs.
[More wasted effort by a banned sockpuppet. Comment DELETED. -mod]
No, icouldnthelpit, if that were to happen, I’d start in 1997 again to show how insignificant the new high is with respect to the two previous highs. Any reason you’re wasting your time and mine?
(Another wasted effort posted by a banned sockpuppet. Comment now DELETED. Cheers. -mod)
icouldnthelpit, where does it say I do your research for you? The data are available from multiple sources. Feel free.
Again, why are you wasting your time and mine? If you don’t like my data presentation, you’re more than welcome to write your own blog posts and submit links to them to Anthony for publication here.
Have a good day, icouldnthelpit, and good luck with your blog if you choose that route.
(Another wasted effort posted by a banned sockpuppet. Comment now DELETED. Cheers. -mod)
icouldnthelpit, the 1998 record high is coupled to the big El Niño that year and has gained iconic status. Think of it as other major events like the stock market crash of 1929 in the USA, the Blizzard of 1888 in the northeast, the Blizzard of 1978 (one in the midwest, one in the northeast), the earthquakes of 1906 (San Francisco) and 1964 (Alaska), etc.
They’re good reference points when comparing extreme events and comparisons to them cover a moderate amount of time. If we’re beginning a long term decline in global temperatures, 2014 might become a convenient icon to refer to as the start of cooling (even though 2005/2006 might be a better choice). Or, if things get warmer, it will just be another blip on the graph.
(A wasted posting effort by a banned sockpuppet. Comment DELETED. -mod)
I find comfort in warmth.
@icouldnthelpit. “I get that 1998 was an outlier. “. Not an outlier – this is a natural cyclical event. It is part of the global climate system and needs to be accurately accounted for in the climate models.
For the rest of this century there will be plenty of records set in temperature. You can bet the headlines will never give the details like the .02 cited. The warmists need numbers much larger than this every 16 years to convince anyone of CAGW. But why bother with details. It is the breathless and hysterical headlines that count. And BTW, the same goes for the sea level rise. The gap between the headlines and reality is enormous. Where have journalistic standards gone.
May I be the first to add “It’s Even Worse Than We Thought – The Worst Evaaaah”?
I am a lay person so please excuse me for any apparent ignorance. With measurement error doesn’t all this statistical torturing of the data violate basic rules of significant digits? How can .02 of ANYTHING be computed and reported?
“How can .02 of ANYTHING be computed and reported?”
Welcome fellow skeptic.
When you are dealing with averages, your measuring instrument doesn’t need to have the accuracy of 0.02.
You can compensate for the large standard deviation in an instrument by increasing the sample size.
Yes they do. The average cannot exceed the precision of the readings with any confidence.
“When you are dealing with averages, your measuring instrument doesn’t need to have the accuracy of 0.02. …You can compensate for the large standard deviation in an instrument by increasing the sample size.
Does that increase accuracy, or just resolution?
@David
I’m not sure in this case you are correct. The “law of large numbers” seems applicable only to the same population sampled again and again. However, you are not measuring the same volume of water over and over, even if your measuring platform is tethered. Currents are constantly moving new water past your sensor. If I were to measure my son’s weight repeatedly this afternoon at 3:00 on a digital scale, I can get the average you are suggesting because his weight is not changing in relation to the speed with which I sample it. If I do it again next week, or next month, the two numbers can’t be combined to get an even better idea of his weight. Too much may have happened in the meantime to materially affect his weight. Same with water temperatures.
David all a larger sample size would get you is more “SCRAP”. Your dumpster is full better empty it.
michael
Paul, it increases the accuracy of your estimate of the true mean (average).
D.J. Hawkins
…
When creating a time series, you actually are measuring the “same” thing over and over again. A static geographical measuring station can give you hourly data, which attempts to minimize the temporal variation, and since the location is fixed, the geographical variance is minimized. Now, all you need are a LARGE number of observing stations scattered uniformly to get an estimate of global mean temp.
…
Likewise, if you measure your son’s weight every hour on the hour for an entire week, the average of those measurements are very close to his actual weight.
philjourdan
“The average cannot exceed the precision of the readings with any confidence.”
…
Here is an example that proves your statement wrong.
Grab a chair and sit down on the side of any busy street carrying automobile traffic.
Count the number of vehicles that pass you for an hour.
…
Lets say that 90 vehicles passed you in 60 minutes.
…
The average says that 1.5 vehicles passed you every minute.
..
The “precision” of your readings are integers, namely, whole cars. At no point in your measurement can 0.5 cars pass you, yet the average is 1.5 vehicles per minute.
…
No, that actually proves me right. Temperature is not cars, and the readings are not being taken from one place. But from the entire globe. Nor is it comprehensive (in other words, you are not using every single data point, indeed that is part of the problem with “global temperatures”)
You failed statistics.
Paul, Statistical sampling in the real world has one function- to see if you are in control of your process.
Individual devices are q.c’ed. by measurements repeated and compared to a “standard”. The accuracy of your instruments for measurement MUST be less the then the tolerance of what you wish to measure. If you are measuring a tolerance of +/-.001 the accuracy of the device measuring must be +/-.0005 as a rule of thumb. I ask you, “would you fly in an airplane the had parts made and passed on the basis of David Socrates’ averaging?” Best of luck, and yes, I have worked in aero-space. If you are going to listen to David Socrates and fly in such an airplane, made to his AHEM q.c. then you need a parachute, and max out the life insurance.
michael
Mike, since you are concerned with real world examples, lets say you have a factory that makes bullets.
…
1) You can test measure each and every bullet you make by firing it in a gun.
2) Alternatively you can test a random sample of bullets to estimate the mean of the population.
If you choose to use method number 1, at the end of the day, you have produced a lot of bullets, and have none for sale, but you know exactly how well your manufacturing process works.
…
and if you choose to use method number 2, you can get a good idea of your level of quality and have bullets left over to sell.
Which method do you think is better?
David, yes I have done “destructive testing”. But in this case it is the wrong analogy, even a high school dropout would understand that. We are taking about quality control and calibration.
Oh, thank you for noticing a fifth stringer like me. Oh, and do you know what an SPC is?
lets play
michael
Mike, measuring either global atmospheric temperature, or ocean heat content via temperature is not a destructive testing situation. However, the analogy is good because it emphasizes the cost per measurement. Destructive testing is an extreme situation, but it highlights the cost factor in measurement. In the climatological domain, the amount of money available for measurement is limited, so one must be very concerned with the problems associated with random sampling.
…
Secondly, measuring global parameters is not “quality control” but basic science, so there are additional ways to show them dissimilar. As a QC engineer, you have almost absolute control over the process, but as a climatologist measuring mother nature, she resists control
Thank you, David for the reply. First I retract and apologize for the high school dropout remark, It takes me a year just to get a high school graduate up to the point he/she can act independently. Okay, I’m a “Luke Warm”, C02 is a GHG. First, I am NOT an ENGINEER, my dad was. Me, I’m something far worse, I am a Tool Maker with engineer training. I’m the guy who stands at the poor poor engineer’s desk just slowly shaking his head.
David, I would like to increase NASA’s budget X10. We need good accurate measuring devices so people concerned can use the accurate data not try to average it which to leads suspicion.
David, what can I say, we must make them bette,r deploy them, and let the chips fall as they may.
Please take this with an olive branch.
michael
Mike, without people like you, the fat cat CEO’s and mid level managers wouldn’t have a job. You know, and I know that there are too many managers and not enough worker-bees in today’s world. My dad told me to go to college and get a good education, which I did. My cousin the plumber that didn’t go to college is making a heck of a lot more money today than I am. Too bad I listened to my dad.
Sigh, sorry too many grammar errors, not used to writing.
D. Socrates has got himself a most excellent job!! I wonder why I was never able to find employment like that, where I could post comments to blogs all day, every workday? Time stamps tell the story.
O well, I’m retired now, I guess I’ll never know.
Pajama Boy
David thank you
I need to help with supper shortly, so I will leave you with these thoughts many of the people here think C02 is a GHG the question is how much
.
michael
Mike the Morlock
“Statistical sampling in the real world has one function- to see if you are in control of your process”
First of all, not all science are engineering. Second, you can’t control climate, you are just an observer. What we are doing with measuring and estimating the mean global temperature is akin to a person going into a very dark room. Initially he will see nothing. But the brain (using the eyes as “thermometers”) will begin to accumulate data (radiation in visible light) and his brain will start analyzing it (some psychologist says we have a natural statistical calculator in our brain). But since the data is too weak, it will take time to average it all out and produce a meaningful image. The resulting image may not be tolerable for an engineer but definitely better than nothing at all and definitely enough to let you navigate the room.
There is actually a joke about an Engineer and a Mathematician where they were to have sex with a beautiful naked woman.lying in a bed. The caveat is that they can only walk to her half the distance they are still away from her every minute. The mathematician quit without trying because he said it is pointless since he wont get to her. The engineer proceeded since at a certain point the distance will be practically nil.
The point here is that we make do of what we have now and not we hope to have in the future. Another is to learn to navigate the world’s climate (and weather) hopefully.
Paul ah,, do you really want to run with this. Please remember theory stops when you push the button.
I adhere to the wisdom of New Zealand’s greatest scientist; Lord Rutherford.
He said (in effect): If you have to use statistics, you should have done a better experiment !!
He also said: ” We haven’t the money, so we have to be smarter.” Or words to that effect. ( I do have a photograph of his verbatim statements)
Nowadays, “science research” is swilling in grant moneys. Some people live off it for their entire adult lives.
A corollary of Rutherford’s second pearl of wisdom would be:
If there’s plenty of money, who needs to think ??
george e. smith commented
I think what’s going on in climatology is “When your experimental results meet your expectations, why would you try to figure out if anything else is wrong with them? They are already right!”
Bob…..Are the oceans releasing heat that has been stored up for a while? Where did the heat come from that produced the Kelvin wave several months ago?
Kenny, after the 2010/11 and 2011/12 La Ninas, it’s tough to say where the slight variations came from in the ocean heat content of the tropical Pacific. We cycled back and forth from El Nino to La Nina conditions without really showing signs of an El Nino until that Kelvin wave earlier this year.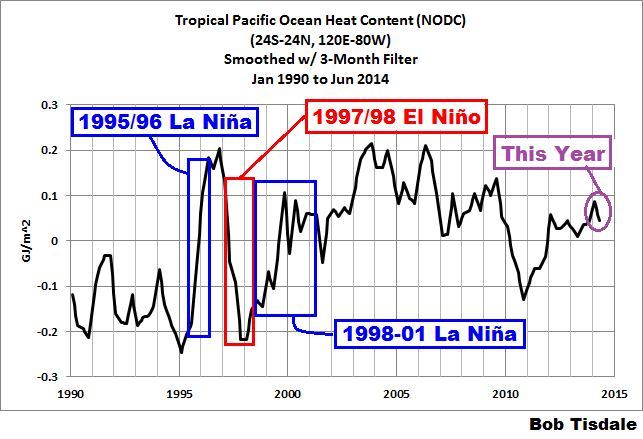
The graph is from the October ENSO update:
https://bobtisdale.wordpress.com/2014/10/10/the-201415-el-nino-part-18-october-2014-update-one-last-chance/
“It will be interesting to see where they fall…and also see how alarmists try to make it appear as though the end of the world is near.”
—
I hear we only have another decade, and if we have not ‘acted’ by then, we’re all goners. That must be about right because there’s been a broad consensus that has been saying approximately that for getting on to three decades already!
PS: please don’t ask to define ‘acted’ as mere mortals are not supposed to ask things of that nature of their Overlord.
How is it that churchgoin’ folks never believe it when some preacher predicts the end of the world, who claims God told him so, but they will quickly turn over their future well-being to politicians who predict doomsday because computers told them so? Then, when it doesn’t happen as predicted, they don’t think to assert that Deity controls their destiny and these are things that man(n) is only allowed to observe, not control. If a consensus of clergy would speak out worldwide, this would be over soon enough..
Beneficial warming to life on this planet…….not catastrophic.
As I understand it, an El Nino does not actually warm the waters. It just spreads the warmth out and pushes some warm water that was subsurface to the surface (from west to east) so the over all surface is warmer. This year was not a full blown El Nino, but had some traits that did the same thing. So the surface was warming due to the eastward moving kelvin wave. The reason for the “record” this year is due to the north Pacific being warmer than normal, which Bob stated was due to a blocking of colder water escaping (moving) from the poles. So the cold water did not cover a larger surface.
Is that about the size of it? I am just trying to get this straight on where the warm was and was not to create the record. Thanks in advance for any corrections and clarifications.
Very worrying. Panic! I initially mis-read HADSST3 as JIHADISTS. Should have gone to Specsavers! (Brit joke. Well very nearly.)
The conundrum for the alarmists is that by wanting a big whopping ElNino to release (ventilate) WestPac equatorial ocean heat to drive up global or regional air surface temps (for alarmist propaganda) means that in the next several coming years the West Pac cools down, and thus atmospheric temps cooldown, will suppress the liklihood of a succesive string of annual record highs.
Oh my.
That looks almost as if something was limiting the maximum temperature of the exposed water at sea-level.
The gravity of this sarcasm shouldn’t be lost on you.
Wonder what happens if next year develops an El Niño…because now you are comparing big El Niño year to a non El Niño year.
What will happen? An El Nino will be followed by the inevitable La Nina and so the longed for temp. spike will come to naught. There will be a few months when the global warmers will shout for joy and dance in the streets and then the slump. Suicides will increase amongst the faithful. That’s what will happen.
trafamadore, it all depends on what happens in the extratropical North Pacific. If the blob reemerges in 2015, then the blob and an El Nino would make for some warm sea surface temperatures in the Pacific. If the blob doesn’t return, then it would be just another El Nino year.
And Ted Williams batted .406 in 1941 only because he had 6 hits in his final two games.
It doesn’t really matter what “caused” the record highs. It’s noteworthy, actually, that we saw record high temps in the absence of a large El Nino event, which we had in 1998.
For the proper perspective, you really need to put that in Hiroshimas.
Actually it has been warming for a long, long, long time. It is called an interglacial warming period. And it’s a good thing or we would all still be hunkered down in caves.
Is it just me or has HadCRUT4 become trendier in the history the last couple of months? Seems like the whole dataset tilted a bit.
You may wish to check out:
http://wattsupwiththat.com/2014/11/05/hadcrut4-adjustments-discovering-missing-data-or-reinterpreting-existing-data-now-includes-september-data/
and
http://wattsupwiththat.com/2014/10/05/is-wti-dead-and-hadcrut-adjusts-up-again-now-includes-august-data-except-for-hadcrut4-2-and-hadsst3/
Wish you had said “(Hot) Whopping…” in the title.
Hadsst3 just came out for November. The yearly average after 11 months is 0.481, which is 0.065 above the 12 month 1998 average of 0.416.
The previous high month of July 1998 with an anomaly of 0.526 was beaten in every month from June to October.
wbrozek, thanks, I’ll go take a look.
Is the ERSST.v3 dataset still avalaible somewhere ?
Simon, I don’t believe it is.
Bob Tisdale,
When the hidden heat comes busting out from ocean depths, any day now, not even your sarcasm will save the pause.
The pause will soon be replaced with a 5 degree surge.
Please graph that.
Seriously, Steve? How did the warming get there, what’s the process?
Repeal the the 2nd Law of Thermodynamics, first.
That’s after you’ve repealed gravity, so that warm water can lie under cold.
Steve Oregon, thanks. That made me laugh, considering I only presented global data in this post. Will that be a global 5 deg C surge? If so, how will that occur, when the subsurface temperatures of the oceans to depths of 2000 meters have only increased at a rate of 0.03 deg C over the last decade?
Hi Bob,
I was wondering if you had any thoughts on the strange coexistence (pointed out by Steve Goddard) on the unisys sst anomaly map of a +6c bright red between Greenland and Iceland with more extensive than normal ice pack, which indeed almost reaches Iceland. It is a bit odd isn’t it, especially coming after last months rumpus about massive -6 anomalies in mid Atlantic? I seem to remember you said last month you didn’t use unisys, is this why?
Steve
Hi Steve. First, I no longer pay close attention to daily sea surface temperature maps. Too much weather noise. But what Steve Goddard picked up looks odd, doesn’t it?
http://stevengoddard.wordpress.com/2014/12/10/something-is-very-rotten-in-denmark/
Here’s a different view from the same source of data:
http://polar.ncep.noaa.gov/sst/rtg_high_res/
I also don’t know enough about that specific sea surface temperature dataset that Unisys is using to comment either way.
I liked the old Unisys color coding of their maps, especially when viewing their animations. Then they ran into a problem with the new dataset and then changed the color coding. I haven’t been back.
Hi Bob,
Thanks for that. I’m interested you say ‘too much weather noise’ in the daily sst maps. I suppose I’d imagined the sst to be more or less free of noise, given that sea temperatures change more slowly than land. But if you’re trying to pick up the really long trends and anomalies then any short term changes are noise, especially if they produce the range of odd data as recently.
And If it weren’t for the contradiction of the ice pack, how would we know?
Steve
At first glance the dataset name “ERSST” reminded me of the German word ‘ersatz’ which means ‘fake’.
It is a bit fake, in the sense that it stands for “Extended Reconstructed Sea Surface Temperature”, and so uses “statistical methods” to reconstruct missing data.
From the NOAA website, where you can download the ERSST data in various formats:
That last sentence is surprising because it suggests that the satellite data may have been thrown out because it didn’t produce the rankings they wanted. Freudian slip? Who decides which rankings are correct?
Having said all that, I see nothing wrong in using data like this for research purposes. I view it as an attempt to harmonize historical data and render it in a seamless and uniform way. Of course it will contain errors, and they have provided an error estimate for each value (which we should plot and compare to the time series). So I think it could be useful for climate studies and such, but should not be interpreted as the “Gospel of Meteorological Truth Down to a Hundredth of a Degree”!
But that’s exactly what the MSM are doing with this info.
Here’s the link to the ERSST website:
http://www.ncdc.noaa.gov/data-access/marineocean-data/extended-reconstructed-sea-surface-temperature-ersst-v3b
… a paper which explains the layered approach that was used to create the datasets. And also a rationale (“cold bias”) for throwing out the satellite data, which still seems a bit ‘biased’ to me (because all data sources are ‘biased’ in one way or another).
http://www.ncdc.noaa.gov/sites/default/files/attachments/Improvements-NOAAs-Historical-Merged-land-Ocean-Temp-Analysis-1880-2006_0.pdf
All of these temperature measurements are, for the most part, made with resistance temperature devices(RTD) which use a calibrated platinum resistance element. These typically range from +-.3 degC error down to 0.0001degC for for a few thousand dollars. In any case, the averages, statistics, and the ERSST temperature reconstructions do not affect the error range of the instrument. The arithmetic doesn’t change the instrument error, which still applies to the final result.
In filling data with statistical methods does not supply any new data or information. It is simply done to make it easier to average a picture of the data in some way and increases the uncertainty in the results by an unknown amount.
“ERSST v3b does not include satellite data, which were found to cause a cold bias significant enough to change the rankings of months.” This statement shows their plain, old bias. It could just as easily mean that the ERSST statistics are causing a warm bias. It shows that the errors in the ERSST numbers are larger than they indicate, since they do not have the courtesy to show how big the changes would be.
There are a number of physical processes which can yield “thermometers” with extra-ordinary Temperature resolution.
Hewlett Packard used to make a quartz crystal thermometer instrument that was based on a totally unique quart crystal oriented “cut” that had a highly linear Temperature coefficient of frequency.
Many cuts, yield parabolic or cubic TCFs, but HP researchers, theoretically calculated this doubly rotated orientation that was very linear over a considerable range. I have no recollection of what the oscillation mode was, or the operating range. The thing is that such devices can make extremely small Temperature changes apparent.
Well whoopee !!
The problem in Temperature measurement, and / or control, is to know just what it is that, is at THAT Temperature.
Same thing goes for PRTs, which are anything but highly linear.
So we can’t expect extreme “accuracy” to formal Temperature scales, but we can expect good resolutions, and good repeatability.
But that is only for the Temperature of the thermometric element itself.
Who, or whatever else may be at that Temperature is where all the misery lies.
Thanks, Bob.
I think 0.02 deg C looks like no change at all, and the global warming is still stopped.
The most significant thing is not what is being observed, but what is NOT being observed. The climate models predict a CATASTROPHIC rise of up to 6 degrees per century.
What really bugs me is that it was very cold last winter and this winter in Indiana. To hear warmest year on record is really aggravating.
You mean coz it was cold at your house, it must have been cold everywhere? Mmmm, I think the planet is bigger than your back yard.
Hoo Boy!
If this rapid ocean heating and ‘acidification’ continue unabated, in 50,000 years or so it will be like simmering the clams and fishes in wine sauce!
Oh, the Humanity….
Bob,
Thanks for the outstanding post re sea surface temperature.
As an engineer it is obvious that hundredths of a degree is statistically not relevant. But that won’t stop the team from misleading the public, probably by not including the minuscule amount of the increase. Of course this is only effective with a complicit media that fails to challenge misinformation.
One question I have (I apologize if you have weighed in on this before). It is a simple concept that as ice forms, energy is released into the surroundings, either warming it or reducing the amount of cooling. How much of a factor is this in “warming” the surrounding warmer.
Enthalpy of fusion for (pure) water is 334 kJ/kg. You should be able to Google it for salt water.
Basically UAH and RSS datasets are set surface dataset, since over 70% of the surface is ocean. As time passes, HADSST3 and UAH/RSS are more and more of. I wonder why?
Could someone explain?
More False Precision Syndrome.
I just love it when these morons at NASAN NOAA etc. quote temperatures to degrees of precision literally orders of magnitude in excess of the discriminatory ability of their instruments.
Do they think everyone – even the non-scientifically trained layman – is that stupid?
Averages are not measurements. The denominator in an average is a “perfect number” and it’s precision is perfect.
Yes it is. But it isn’t the precision of the denominator which is at issue here. Nice try though.
Mr Davidmhoffer
..
This post should help you understand precision in averages.
..
http://wattsupwiththat.com/2014/12/12/meteorological-annual-mean-dec-nov-global-sea-surface-temperatures-set-a-record-high-in-2014-by-a-whopping/#comment-1812936
actually they do , but not just in climate ‘science’ they pull the trick of claiming an ability to measurement to levels of accuracy that is beyond the ability of the instruments they use to measure with . There is an idea that if you throw enough maths at it you can overcome the limitations of such physical realities and just add in error bars to cover your rear end.
Steve Goddard’s page showing sea surface temperatures around Greenland at +6C above average while anomalous ice is present demonstrates that the books are being cooked by the fanatics.
“Record temperatures” were on the cards at the start of year, regardless of what happened in the real world.
http://theconversation.com/are-we-heading-for-a-worrying-super-el-nino-26090
– – – – – – – – – – – – – – – – – – – – – – – – – – – – –
Mark Harrigan
PhD Physicist
If it [a super-worrying El Nino] happens I confidently predict that those at the forefront of climate change denial currently falsely claiming “there has been no warming since 1998” will jump on the El Nino as a one off event and therefore “not to be counted” as an indicator that the planet continues to demonstrate all the signs of increased heat retention.*
– – – – – – – – – – – – – – – – – – – – – – – – – – – – –
* Great Lakes record ice cover, record duration, earliest recorded formation,
* Arctic ice extent 1.7million square kilometres more than 2 years ago
* Antarctic Sea Ice extent, highest on record
* Fall snow cover in Northern Hemisphere most extensive on record
The territory is cold while the map is warm. But the map is not the territory.
Reblogged this on Centinel2012 and commented:
And just think this is the best they they can com up with, to small to mean anything ; but what really significant is this value is about .5 degrees C lower than the average of the IPCC GCM computer models. Which means they are not even in the ball park, I’ve done some complex computer models and if one of my models performed this badly I’d be a bit embarrassed!
Here is a plot of the ERRST reconstruction going back to 1880, showing the NOAA calculated uncertainties:
http://i59.tinypic.com/15zihwl.jpg
The uncertainty of measurements prior to 1950 is understandable. But why does the uncertainty suddenly jump an order of magnitude or so, starting in 2000? That’s about plus-or-minus 0.1C! (And we’re quibbling about 0.01C nudges?) Yikes, looks like another attempt to draw a hockey stick.
Also, the above uncertainty plot is restricted to data between 60S and 60N latitudes. NOAA acknowledges even larger uncertainty in the Arctic and Antarctic ERRST reconstructions. (All of Greenland lies above 60N).
https://climatedataguide.ucar.edu/climate-data/sst-data-noaa-extended-reconstruction-ssts-version-3-ersstv3-3b
Hmm, I erred, it’s “ERSST”, not “ERRST”. (Errly in the morning here).
[No problem, thank you for noting the ERRER, it ist noted. 8<) .mod]
Such a tiny amount , despite so much effort going into finding a ‘increase ‘ shows one of two things , either their rubbish at it , quite possible given the amazingly poor scientific practice seen in this area or that despite their ‘best efforts ‘ the data cannot be tortured enough to get anything more. Either way although their have succeeded in getting the headlines they wanted this time, in the long term their claims are getting farer away from reality everyday.
Has it increased or hasn’t it?
Come on – this is not good enough. We need some dramatic headlines – like – Mann spotted some boiling sea water on the sands of San Jose.
Seems obvious “the pause” reduced glacial runoff which in turn decreased cooling, contributing to the supposed rise, however statistically insignificant or w/i the margin of error…
I wish we could lasso a number of these ARGO buoys, recalibrate them, and determine how much their sensors may have drifted, and how much larger is their measurement uncertainty after years at sea. When one begins to trumpet loudly changes of 0.01C we are in for a sanity check.