Please put down your coffee before reading any further. You wouldn’t want to spritz your keyboard and screen. Don’t say I didn’t warn you.
I have a confession to make. I am one of the very few remaining people around the globe who continue to regularly visit the blog RealClimate. It’s a curiosity thing mostly, kind of like watching the Titanic sink in slow motion.
 I stop by to see what the alarmist wing of the climate science community feels is important enough to spend time blogging about. Much to my amazement a few days ago, there, sitting at the top of the RealClimate main page, was a blog post about…
Ready?
…a widget.
A widget? you ask.
Yup, a widget. Not just any widget, the WattsUpWithThat widget.
The RealClimate post by Stefan Rahmstorf here begins (their boldface):
The “World Climate Widget” from Tony Watts’ blog is probably the most popular deceptive image among climate “skeptics”. We’ll take it under the microscope and show what it would look like when done properly.
See, I told you…a widget.
Imagine you’re a climate scientist; you’re one of the founding members of the website RealClimate; but more importantly, you’re Professor of Physics of the Oceans at the Potsdam Institute for Climate Impact Research of Potsdam University.
Got that? Now, imagine at the top of your high-priority daily to-do list you do NOT find something like help fix climate models, which double the warming rate of the global ocean surfaces over the past 33 years. See Figure 1. Nope. You don’t find that topping the priority list.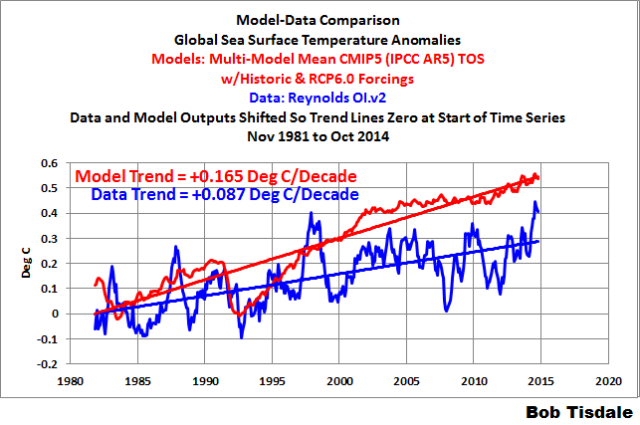
Figure 1 (from the blog post here)
And you do NOT find something like help fix the spatial patterns of ocean-surface warming in climate models so the models might be useful at simulating future climate patterns (temperature and precipitation) on land. See Figure 2.

Figure 2 (from the blog post here)
Imagine…what you do find at the top of your high-priority daily to-do list is Write a Blog Post about the WUWT Widget.
It’s mind boggling.
Have I written a blog post about a widget? Of course. It’s here. And if you click on that link, you’ll find I even produced a video about a widget. And there’s a reason I wrote an article and produced a video about a widget. My role in the climate-science debate is that of a science reporter for WattsUpWithThat, the World’s Most-Visited Website on Global Warming and Climate Change. I’m not a climate scientist, like Stefan Rahmstorf. Climate scientists are entrusted with providing scientific support for what has been called the greatest threat facing the world. Must not be too high a priority if one of the faithful spends time writing a blog post about a widget…and others take time out of their day to comment about that widget on the thread at RealClimate.
A few other thoughts about Stefan’s post, before you happily take over:
Stefan writes in his paragraph 1 (his boldface):
It is better to plot the surface air temperature. That is what is relevant for us humans: we do not live up in the troposphere, nor do natural ecosystems, nor do we grow our food up there…
I suspect Stefan Rahmstorf will regret that statement, because he’s likely to be reminded of it every time he wants to claim ocean heat content is important. (Stefan, we don’t live to the depths of 2000 meters in the oceans. Remember what you said…)
He ends the same paragraph:
… Let us thus use the GISTEMP global annual temperature record from NASA’s Goddard Institute for Space Science (all surface data sets agree to better than 0.1 °C, see comparison graph).
Unfortunately for Stefan, the GISS LOTI data is made up mostly of sea surface temperature data, not the “surface air temperature” data for the oceans, the latter of which is known as Marine Air Temperature. And most of us don’t live on the surface of the oceans…though I wish I did from time to time.
You’ll also note that Rahmstorf spent a lot of time adding notes to an older version of the WUWT widget. See Figure 3. It ends in 2009.
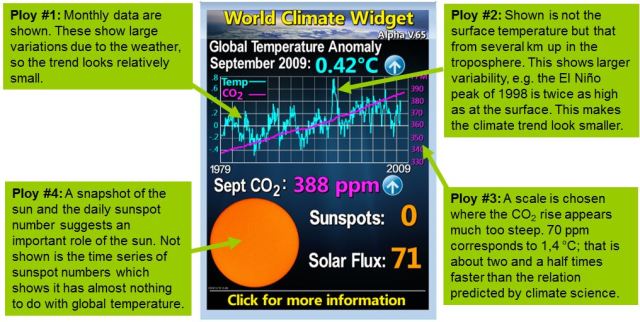
Figure 3
Why didn’t he use a more up-to-date widget, shown in Figure 4? I’ll let you speculate about that.

Figure 4
And now for the truly bizarre:
The RealClimate post includes a link to the October 2009 WUWT post New WUWT feature: World Climate Widget. That introductory post at WUWT was a short time before ClimateGate, when the popularity of WUWT began to soar. Anthony had to put the widget on the back burner, never really promoting it. You can run through the comments on the WUWT widget thread here or use the search feature of WUWT to see if he made an effort to promote the widget. Anthony updated it a while back. But when he changed the WordPress theme at WUWT back around the first of September to “The Expound Theme”, the widget seems to have disappeared from the sidebar. (An oversight by Stefan?) So, Anthony’s never really promoted the widget, and it might’ve disappeared from the sidebar about 3 months ago, but Stefan Rahmstorf calls it “The most popular deceptive graph”, resurrecting it. I think Stefan Rahmstorf is about to discover that the WUWT widget will now become a whole lot more popular in the wake of his blog post. I suspect Anthony will be promoting it—and I’ve got a few good reasons to believe that.
Google Trends reveals that the number of searches for the blog “RealClimate” continues to drop, while those wanting links to the blog “Watts Up With That?” continues to rise. How bad has it gotten for RealClimate? See Figure 5. Occasionally, the blog Hot Whopper, run by the former WUWT troll Sou (Miriam O’Brien), nearly catches up with RealClimate.
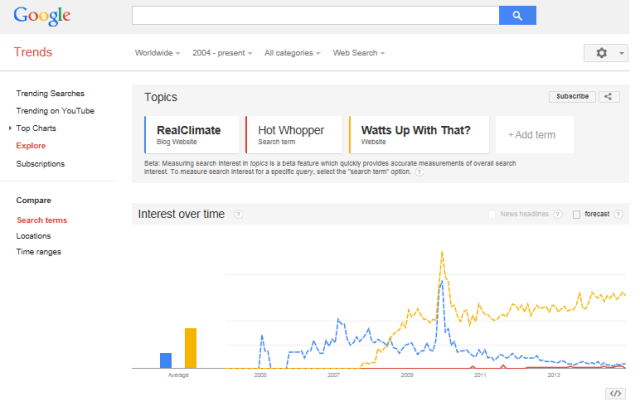
Figure 5
If they continue to write blog posts at RealClimate about WUWT widgets, mimicking what Sou does at HotWhopper, who knows how far that decline in interest for RealClimate will go!
CLOSING
I’m sure you’ll have a fun time discussing the rest of Rahmstorf’s post at RealClimate about a widget. Afterwards, if you would, please consider adding the WUWT widget to your blog. It only takes a few minutes. Anthony has instructions for doing so here. I’ve added the WUWT widget to the sidebar at my blog ClimateObservations. It makes me feel good knowing that it’s there—knowing that it tweaks certain members of the alarmist wing of the climate science community.
Stefan Rahmstorf (and the others at RealClimate), on the other hand, must not have been too impressed with the widget he suggested using. As of this writing, it has not been added to the sidebar at RealClimate.
They’ve got to write about something since they’ve exhausted their globull warming tales.
Brilliant. Thanks for keeping in touch on our behalf with the fast-vanishing RealClimate. And keep up the good work.
Yes, and I wonder how many looks RC gets from skeptics curious about what the gang will come up next to deceive the world.
I’ve always been the under the assumption this describes most if their traffic.
You make a good point – I only looked there to see what Bob was on about. Otherwise I have no interest in the RealClimate propaganda… pretty much a waste of time for anything useful.
[the sun] “has almost nothing to do with global temperature”. He’ll probably regret that one too.
Something I’ve long-time wondered about. If the Sun has almost nothing to do with global temperature, what energy source does the heavy lifting from background radiation temperature of about 3K to the 286K or thereabouts we know and love?
Yup. If it wasn’t for the sun we’d be travelling in a straight line. The earth would be very rocky, icy and dead. and as you say at a few degrees Kelvin. Thanks goodness for the sun.
Well, to be fair, he meant not simply “the sun” but “the variation of the sun activity measured by sun spots” of course.
Nevertheless, he will probably regret that remark in due time after the next 20 years of a gradually decline of the suns activity and its climatic consequences…
fair enough, but the implication is the sun is a constant that does not affect climate change.
If he thinks the sun is a constant, it’s probably because he correlates that with the strength of his sunscreen, which doesn’t change.
So maybe his ideas are more “sunscreen related” 🙂
To mock Stefan I could say he is proposing that you could throw the sun out of the models and the climate would not change at all. More likely (with 51% certainty) he is saying that the sun is either a constant or in complete equilibrium with everything else on Earth and in our solar system except for CO2.
Stefan is convinced like an evangelist seeing the face of Jesus in tree bark, that CO2 is the only significant variable in climate. Now, as a scientist that is something to mock him about.
,,, he is proposing that you could throw the sun out of the models and the climate would not change at all.
That is a very interesting phrasing the question. Keep the Sun constant. What then is causing the variability? The “natural variability”?
With the Sun constant and CO2 rising, what then causes the ups AND downs of “global” temperature?
He didn’t say that. He said that the time series of the number of sun spots has almost nothing to do with global temperature.
which is a claim that the sun is a constant and therefore does not cause changes in our climate.
RealClimate getting fidgety about a widget? That’s almost as sad as them getting fidgety about CO2 and broken hockey sticks.
When will they “Get real, Mann!”.
Just eyeballing figure 5, I’d say the RC trend is less than the WUWT trend. It could be coincidence, but it reminds me of some other trend comparisons.
To borrow a tune from M4GW, maybe RC is trying to “hide the decline”?
Rahmstorf makes some good points.
Good points? Presenting monthly data is some sort of “ploy”? That’s laughable.
If we are concerned about measuring the change in the climate and by definition, climate acts on yearly/decadal scales, then it doesn’t make sense to me show the progression of monthly/daily averages as those are more influenced by weather.
Bill 2, you’re missing the obvious. If monthly data isn’t important, why do we keep seeing reports of record high monthly temperatures from the big-3 data suppliers?
Bill 2,
Please explain why Rahmstorf would use a pick from 2009, when he could have used the 2014 widget.
Bob Tisdale
December 10, 2014 at 2:21 pm
“Bill 2, you’re missing the obvious. If monthly data isn’t important, why do we keep seeing reports of record high monthly temperatures from the big-3 data suppliers?”
Also, why keep Global Warmists talking about Extreme Weather? (That their models never predicted)
Bob/Dirk – I just presented a statement about what I believe. My statement speaks for itself. You are asking me questions about why other people do things. I cannot answer those.
db – I’m not Rahmstorf, so I cannot answer that question. Maybe drop a comment for him at RC?
Bill 2 says:
db – I’m not Rahmstorf, so I cannot answer that question. Maybe drop a comment for him at RC?
I used to try and post comments at RealClimate. I was especially careful to be polite, and I would generally just post a graph, along with a few words of commentary.
But a funny thing happened: not one of my comments was ever posted. They just disappeared.
So no, I won’t ‘drop a comment’ there any more. RC selects what they want readers to see, and if it doesn’t fit their narrative, it isn’t published. If your comments are posted by RC, that means you fit the narrative.
aka: useful idiot. Just sayin’
(Another wasted effort posted by a banned sockpuppet. Comment now DELETED. Cheers. -mod)
Bill 2
December 10, 2014 at 3:51 pm
“Bob/Dirk – I just presented a statement about what I believe. My statement speaks for itself. You are asking me questions about why other people do things. I cannot answer those. ”
Now that’s just too bad, Bill. I just presented a question which you might want to ponder. I do not expect you to be able to answer it.
Like about the temperature of the troposphere not mattering? I have always assumed that he and the other alarmists lived underground. Are they crab people? That part is at least debatable.
It appears that Bill2 has been trumpe d with no answers to the most simplest of questions. It is no wonder they are scared of debate.
Well, isn’t the down-welling long range coming from the troposphere? (In which we live). The warmer the troposphere, the more DLW radiation there is.
The sign of an incorrect theory is ad hoc explanations and modifications (epicycles anyone?) and intellectual hand-waving (might, could, may etc.)
ya, ploy #4. plotting a picture of the sun.
see when you leave data out like the whole time series that is deceptive!
Oh.. Now I understand.. If you hide a decline, if you leave off the divergence, thats ok.
But if you plot a picture of the sun you have implied that the sun runs the show.
yup.
never plot a picture of the sun.
+1 mosh
+1 Mosh-man
Anthony now that eric has detailed what counts as a PLOY, you
ought to build a reference page for each ploy..
I bet readers could find charts from Mann that fit every ploy.
I wonder if Rahmstorf has any problem with a widget that shows the number of Hiroshima atomic bombs the Earth is gaining in heat?
http://4hiroshimas.com/
Burn! 🙂
Agreed. I especially think the trend line complaint should be handled. Such dialogue is part of why actual SCIENTISTS–persons on a search for truth–appreciate criticism, unlike the IPeCaC clowns.
Bill 2
Welcome to WUWT. This will be an interesting evening for all concerned.
Bill 2 December 10, 2014 at 1:33 pm
you wrote “Rahmstorf makes some good points.”
Then you wrote: at 3:51 pm
“db – I’m not Rahmstorf, so I cannot answer that question. Maybe drop a comment for him at RC?”
++++++++++++
Why don’t you tell us what the good points are?
Good point, Mario. ☺
@ dbstealey December 10, 2014 at 7:04 pm
I just cannot believe the hollowness of Bill 2’s contribution… his statements are nothing more than a drive by without merit.
The monthly data is more visually interesting. And allows you to compare month to month. I guess you could add an annual average smoothed line on top in red.
(Another wasted effort posted by a banned sockpuppet. Comment now DELETED. Cheers. -mod)
@ icouldnthelpit
Your annualized temperature anomalies after the midpoint on the timeline seem to be about .4 deg. higher than those I eyeball from the WUWT chart.
I don’t get it. Is this chart sarcasm, or does your data come from a different source?
(Another wasted effort posted by a banned sockpuppet. Comment now DELETED. Cheers. -mod)
@ icouldnthelpit
Then to summarize, your chart shows the temperature anomaly between about 2002 and 2014 bouncing about between +.4 and +.6 deg.C, while the WUWT widget chart (http://wattsupwiththat.com/widget/) shows the 13-month running average anomaly in the same period bouncing about between +.1 and +.3 deg.C. — a rather large descrepancy.
SO: Is the reason for the discrepancy that (1) your chart is based on the GISS data which is a “Global Land-Ocean Temperature Index” (with various adjustments) and the anomaly is relative to a base beriod of 1951-1980, while the (2) WUWT chart is based on UAH Lower Troposphere Data and the Anomaly is relative to a base period of 1979-2010?
If so, then I gather that this exercize is the graphical version of the two talking points: (1) The current decade is the warmest in the previous 100 (or 50)years, versus (2) There has been no significant increase in warming in the past decade.
Is that about it? Or does one chart actually reflect the reality that interests us (our fate as humans) better than the other?
@ icouldnthelpit
Have some fun and change the width of the graph at http://herdsoft.com/climate/widget/config.php?width=640&height=480&start_year=1979&title=World+climate+Widget&temp_axis=Temperature+Anomaly+%28C%29&co2_axis=CO2+Concentration+%28ppm%29&temp_rgb=b2b2b2&co2_rgb=1786ec&alias=2 .
The trend will look flatter and flatter.
And those would be?
My [pencil] sharpener makes better points.
I don’t go to RealClimate, don’t want them to get the hits.
I must I look at RC about once a month just to see Watts going on. Unfortunately,every time I look the heading is nearly,well 97% of the time,it is “unforced variations”. Nothing to see there folks.
I do not visit RealClimate 97% of the time.. The other 3% was when I started following this argument on the web, many years ago, when John Daley was still alive.
I go there a few times to check the number of postings. Is it about one per week now?
Here’s a link that allows you to read with out bumping their stats.
https://web.archive.org/web/20141210233841/http://www.realclimate.org/index.php/archives/2014/12/the-most-popular-deceptive-climate-graph/
Quote:
“Got that? Now, imagine at the top of your high-priority daily to-do list you do NOT find something like help fix climate models …”
Quite so.
Climate Change and ENSO: Take 2
Author: Mat Collins
Wednesday, December 10, 2014
“So, the picture of changes in ENSO, when viewed in terms rainfall response patterns, may be limited by errors and biases that have been long-term features in climate models. Research is required to test the potential impact of SST biases on the change in average precipitation in the tropics. We must improve models, but we must also to better understand the processes whereby biases in present-day simulations link to future projections.”
http://www.climate.gov/news-features/blogs/enso/climate-change-and-enso-take-2
Regular wuwt poster, Bob Tisdale, will be along shortly.
handjive, you are correct. It will be a very short post…tomorrow morning at my blog and at WUWT. I’m still working on the title.
Cheers
Hello Bob, so from figure “5” I take it that warmest blogs do not experience increased growth rates from CO2 as my garden did. I had a real good year here in OR.
michael
Well that is a novel idea, to better understand processes before predicting behavior, but the issue is understanding biases in models? Hopefully that means better understanding climate processes in order to remove faulty assumptions in the models and not taking more wild-ass guesses at the correct “bias”.
Overall still missing the boat however, processes are just discreet components of climate, understanding processes is only a first step, a more significant step is understanding the relationships between all climate processes or actors. Yes it is all about the relationships. The final step is to understand that like actors in juicy roles, climate actors can have a character arc and change their roles in the climate drama over time and how do you predict that?
Since all the climate models are currently producing 100% erroneous results, in a true engineering methodology for prototyping, they should adopt a feedback loop from actual temperature readings into every model in order to achieve a measure of reliable accuracy into their current erroneous coding.
So, since the cornerstone of their time base theory is multiple decades or or often centurion periods, might i suggest they use these feedback loops for say 200 or so years?
If it follows the feedback loops have added sufficient accuracy in their models they can then (and only then) publish them and request some kind of funding?
Wake us up when they actually work!
They cannot do as you suggest because such a process would not result in a crisis. Such a process would definitely make the models more accurate, but would give results that would be clearly beneficial to humans and the biosphere as a whole.
Believe me…they know how to make the models better, but that would mean the abandonment of the whole disaster meme and their source of income. They have no intention of doing that.
You nailed it, Jim
Hi Jim,
( I saw your last drive at Warwick Farm) 🙂
I see their ploy, put so much guff in every report, that they know damn well no one but another disciple would ever read it thoroughly OR an equally qualified critic. The question is, how much longer must those on the expense side of the ledger endure this nonsense?
with their firm belief in high sea temperatures, it is unthinkable that their Titanic was hit by an iceberg (or vice versa). Some of their models may already predict that icebergs are things from the past anyway. So hitting it must be impossible. Better to keep their heads in the hot sand until they are fully cooked.
The other surprising thing when I looked at RC a few months ago was the paucity of posts. It only had a few news post per month … hang on … OK. thirteen new posts since October 1st.
And here on WUWT? Sixteen new posts since two days ago …
w.
In fairness, they could argue for Quality over Quantity.
Some recent posts here have been right Balls Ups.
In fairness, you’re right about their ten-year anniversary post, MCourtney. I don’t think anyone would question their stats.
Their 10 year anniversary post includes this quote.
That is very perceptive of them. It is their opinion that is essential to the site’s debate.
Well maybe the thinking is when you argue with yourself it is hard to be wrong. Even though a committed scientist I believe would manage to do so often. A scientist who finds nothing to be skeptical about in their field is practicing religion.
Well put, Alx.
M Courtney says:
In fairness, they could argue for Quality over Quantity.
Yes. They could argue that. My response: they censor what doesn’t fit their narrative.
And:
In our opinion this remains essential for curating an interesting and substantive conversation.
Well, they can’t win ’em all. When a blog is so one-sided, it is no longer interesting or substantive.
LOL dbstealey: And based on observation, you are correct!!!
And how can you carry on a debate if you cut out (censor) contrarian comments?
So now we know an “echo chamber” can also be called a “curated conversation”.
Both being paradise for the “tautologist”.
Does that bother you, MCourtney?
Evidently, cultivation of a good crop of group-think requires assiduous elimination of unwanted alien growths.
” ‘ A scale is chosen where the CO2 rise appears much too steep. ‘ ”
It’s not possible to plot the CO2 rise too steep compared to the temperature rise . Here they both are on 0 based scales : http://cosy.com/Science/CO2vTkelvin.jpg . dT%dCO2 is at most less than 0.01 .
” ‘ A scale is chosen where the CO2 rise appears much too steep. ‘ ”
Yes, so a much larger range chart should be used for CO2? in that case why not for temperature too ?
Because the difference in slope between the two variables is a 100 to 1 .
So, the site we look at for amusement (HotWhopper) might soon be more popular than RC.
VicV, maybe they’ll both disappear.
There is no point in RealClimate now we have Nature Climate Change and the Guardian Environment pages.
The former publicises speculative hypotheses without any critical peer review.
The latter hectors anyone who doubts the authority of the great and the good of scientists.
What else has RealClimate ever done?
Well I believe that John Christy et al published in Jan 2001 a paper that showed that sea water Temp does not equal sea air temp (why the hell would they be equal) and moreover they aren’t even correlated. That was based on about 20 years of simultaneous +3 m and -1 m air and water temps respectively.
Ergo, ALL of the pre 1980 ish water data going back to 1850 or whatever is total rubbish to mix in with the land air data.
So I don’t believe any global Temperature data before about 1980, which about matches the satellite valid data era.
Yes, I recall that the climate scientists have had to do “bucket adjustments” to past sea surface temperatures because the nautical climate scientists of yore (aka sailors) used highly precise buckets of sea water to measure and log the sea surface temperature. With these highly accurate adjustments, the climate scientists can make comparisons of sea surface temperatures of today with those from 1905… (LOL!)
http://wattsupwiththat.com/2013/05/25/historical-sea-surface-temperature-adjustmentscorrections-aka-the-bucket-model/
I think RC will be gone in a year or two,and the way the climate is going,that may be conservative.
Maybe I should have said “melted away in a year or two”.
In the end, I think they will disappear quite suddenly!
Well Bob, I hope Gavin at least thanks you privately for giving his site a brief kerfluffle of extra hits.
Mike M, Gavin’s got his hands full trying to get the GISTEMP data for Dec 2013 to Nov 2014 to be greater than 2010 for his quasi annual report.
Also, I don’t believe any of the founding members of RealClimate would be thanking me for anything. I haven’t been very kind to them in recent years…but they deserve it for their not-too-subtle alarmism.
Which site is more popular?
Sounds a lot like ‘sour grapes’ to me.
But WUWT is obviously the more popular. That fable doesn’t apply.
But it’s worth remembering that there is wisdom in Aesop’s Fables.
I recommend them.
Maybe Anthony could put the widget on the WUWT home page. i didn’t know about it, until I read this post.
Michael, we have Stefan Rahmstorf to thank for resurrecting the widget. Wasn’t that thoughtful of him?
Thank you, Stefan.
Stefan who?
I think he plays soccer for Potsdam. I may be wrong,
I thought it was ironic that Rahmstorf would write a blog post accusing someone of producing a misleading graph…
https://ipccreport.wordpress.com/2014/12/10/realclimates-deceptive-graphs/
OK. OK. We finally have proof. Studying rising CO2 levels is adversely impacting the IQs of climatologists. Saw Ramsdorf’s Tweet the other day. Nearly died laughing. Hmm, come to think of it, maybe that’s the whole idea. Kill us with laughter.
Can I suggest that you somehow integrate the Google website trends graph into the widget. That should cause them to pop an artery!
Bob, thanks. Regarding figure 5, that’s one hell of a divergence problem.
Thanks, Anthony. That made me laugh.
BTW, who calls you Tony Watts? I was gonna respond about a post at RC by Steffy Rafmstorf.
It’s a Mikey Mann thing, Steffy is just playing follow the leader.
Oh goodness, would that make the divergent “hits” chart a Steffy graph?
Looks more like a good inverse correlation, with the exception of Climategate.
This is uncanny. Figure 5 looks like temperature curves…both spiking i 2009 (COP15+Climategate), equivalent to the 1998 Ninjo, but the RC graph looks like real temp., sinking, whereas the WUWT graph looks like an IPCC model….
Flashback to 4 years ago:
“Renown climate scientist and German government advisor Stefan Rahmstorf was found guilty of a blog attack against a journalist. According to the opinion of a state court, he made untruthful assertions.”
In solidarity with global temperature – Prof Rahmstorf doesn’t change either.
What a mendacious and motley crew they have over at RC.
http://notrickszone.com/2011/12/02/der-spiegel-slams-ipcc-lead-author-rahmstorf-with-piece-titles-scandal-surrounding-german-government-climate-advisor/#sthash.MgcbZ2ZP.dpuf
I just posted the following on the RC page we are discussing: “Given that CO2 continues to rise, and given the hiatus since 1998, could it be that CO2 is not a major driver of global warming?” (5:35PM in their time zone).
Will that simple question survive “moderation”? (It is, after all, a moderate question.)
With their moderation habits, your comment may appear in a form that implies you whole-heartedly endorse their warmist position and ridicule any skepticism!
“I am one of the very few remaining people around the globe who continue to regularly visit the blog RealClimate.”
Glutton for punishment, are we?
/grin
Yes, we are. At one point there was speculation I was more than one person. I try to maintain that image by using phrases like “We discussed” or “We illustrated” in my blog posts.
Sounds like (all of) you are ‘beside yourself’ with Rahmstorf’s blogging, Bob!
Rahmstorf doesn’t like referring to the troposphere. I wonder why not?
He also says that sunspot numbers don’t correlate with temperature.
They do on Planet Earth, Stefan.
Stefan sounds like an idiot when he says the only important thing is surface temperature. It is true that the most important thing to most people is surface temperature better known to most humans as LOCAL WEATHER. However climate scientists are supposed to be concerned with how climate works, in which case considering only surface temperatures is an infantile approach.
I’d never looked at the widget before he mentioned it. Not really interested. How does he know how popular it is? Does it get Alexa rankings or something?
Still, if it keeps him busy then it probably means that he’s not doing something more harmful elsewhere…
German government apparatschiks have all the time and money in the world.
Rahmstorf’s wife produced silver medaillons, in stick shape, with the number of a CO2 certificate on it, when you buy one the certificate gets retired. So I asked Rahmstorf how much CO2 the production of the silver costs, he couldn’t answer it so I, well, didn’t want to buy one anyway.
Other guys at the PIK tried to sell a Global Warming board game. I found it somewhere on a wikipedia list of Global Warming related games. That died as well of course.
I occasionally comment there, most of my past comments took permanent residence in the Bore Hole, but surprisingly they are far more tolerant of the late.
Science should not ignore the value of disagreement, discord and difference of views or opinions..
“The most popular deceptive graph”… ahhhmmmm that would be Mann’s Hockey Schtick.
Oh, but you’re talking truth, Kiwi. They’re talking grant applications.
ladylifegrows, I wish you weren’t right.
But I fear that, yes, truth is considered subjective by the RealClimate crowd.
“The “World Climate Widget” from Tony Watts’ blog is probably the most popular deceptive image among climate “skeptics””
Never even looked at it, let alone used it. Maybe he should ask skeptics if they use it? I’ve been on many skeptic resource sites and I never ever see it referred to. (Sorry Anthony)
As for his complaints, he’s complaining about scales and presentation, not the data. Seriously?
If he really cared about deceptive presentation, he should look at Mike’s Nature Trick™, not a widget that nobody really ever uses.
[the sun] “has almost nothing to do with global temperature”. What does Stefan think is providing the heat to keep the World warm? Perhaps he thinks that CO2 provides “spontaneous” heat…..rather like a giant compost heap?
I used to link to the widget on my weather web page then it went kind of awol as noted. It was a nice device. As a side note will the Red line eat a Blue dot this year yet? Getting close….
http://arctic-roos.org/observations/satellite-data/sea-ice/observation_images/ssmi1_ice_ext.png
A very interesting graph.
The blue dots represent the average ice extent from 1979 to 2006. This seems to be a rather arbitrary period in that it is not the normal 30 year baseline nor a baseline up to the current day.
It can be seen that all the years after 2006 show ice extent below this average. If, therefore, those years were to be included in the average, this would have the effect of bringing the average down.
It is likely we could then say that the arctic sea ice extent was ‘above the average since records began’.
Looking at the hits on the two websites (graphed above) it’s pretty clear to me that they tracked each other pretty well until climategate. They started to diverge a lot after that
If I wanted to be mean, I would liken that event to shining a light on the cockroaches at RC
RealClimate got the leaked/hacked data first.
But RC didn’t trust the hoi polloi with the facts; only their opinions are sacred.
So WUWT got the scoop.
RC got left with the poop.
Do you know what ?
I just went back and spent some time thinking about that graph.
I think it’s a proxy.
I am not a big fan of proxies, but that is a damn fine, bona fida , goddam proxy
it’s a proxy for Mann, Lew, Gleik and any other charlatan you care to mention.
That graph can not be weighted, homogenised, smudged or infilled by the climate alarmists
they can not put their thumb on the scales here.
why do they not spin it ? come on guys. lets hear it
Stefan is a tool with a dodgy history and shouldn’t be talking about graphs when he is famous for graphs better as deception than information. A fine example is a graph that implied global temperature was an unchanging constant prior to 1880. My guess is that even the uneducated masses are smart enough not to buy that whopper.
Can’t attack the science then attack the scientist… Same principle.
Robert of Texas, you need to be a little more specific. Are you referring to Rahmstorf’s post about Anthony Watts’s widget or my post about Rahmstorf’s focus on the widget?
Yes.
“It is better to plot the surface air temperature. That is what is relevant for us humans: we do not live up in the troposphere, nor do natural ecosystems, nor do we grow our food up there…”
We don’t live in the troposphere?!?!?!?! We may not live ‘up’ in the troposphere, but we sure do live ‘down’ in the troposphere. Denver, Co. is 5280 ft into the troposphere (compared to sea level) & there is a whole lot of farming just west of there.
That really puzzled me about his comment as well. Aren’t the satellites measuring the average of the troposphere? I cannot recall the number put on the “depth” of the measurement, but the troposphere starts at the surface, so it’s the average temp from the surface to a height. This average will include the surface air temps, no?
JKrob. A nice but wholly specious argument.
Two irrefutable grounds for that counter statement.
1. The trends are presented as anomalies from some baseline. Satellites do not measure meters above land surface, true. So they will infer colder absolute temps due to the well known altitude lapse rate. Of no matter when converted to trend anomalies to wash out the altitude lapse rate. And it is the over time trends that form the core of CAGW theory, since CO2 warms…by some amount.
2. Climate model hindcasts of surface temps differ by up to 3C. See CMIP5 archive or my book Blowing Smoke. That huge discrepancy in dew points, freeze points, … Is also washed out using anomalies. Erroneously for models purporting to describe physical processes Iike snow, rain, clouds, or ice melt. See essay Models all the way Down in ebook Blowing Smoke for more detail with footnotes.
Let’s just say the widget didn’t bring me here.
The reason they want “air temperature” is because that is where the Urban Heat Island effect is. That is where all the actual warming is, hence all their funding. It is also possible to fiddle with that record, which we have caught them doing several times.
I object to calling alarmists “climate scientists.” I learned in HS physics that science is what makes successful predictions. The hard kind–about the future. The climate models so far have about a 90-98% fail rate, depending on how strict you are. That makes them unscientific, and indeed, antiscientific.
WE are the scientists. We need to say so more often.
btw, I like to look at the climate widget now and again.
I would like to have a WUWT widget but the long term temp and CO2 tread are not the data that I want updated frequently. The data pages I visit frequently are the sea ice page, solar page, and extreme weather (tropical cyclone page during hurricane season). A widget built around these would be good. Maybe analysis of most visited data page would help build a more relevant widget.
A lot of words but what exactly are you trying to tell us? You seem to have copied Soubangers rhetorical style. Yuk
This graphic would have worked well for The previous Titanic-iceberg story, Bob.
It gives one the impression that solar activity sinks ships. But as climategate demonstrated, that only requires loose lips.
Thank you, Anthony, for NOT having a “stupid” website graphic.
…Oh wow, what’s with the giant mountain of views (for RealClimate as well as WUWT) in 2010?
Forgive me, but I only started following this about 6 months ago. What happened then that inspired so much sudden (if short-lived) interest in climate change?
LordCaledus, that spike started in late November 2009. The occasion was ClimateGate.
LordCaledus, PS: The y-axis is interest in the search terms, as a percentage of the interest, where the greatest month equals 100%. Because Watts Up With That had the highest number of search requests, it set the 100% reference point.
Cheers.
Lord, you are joking, right?
If not, google climategate. That was in late 2009. The battle started about 1988. See essays Fire and Ice, and Climatastrosophistry, in Blowing Smoke if still unenlightened by documented history.
LordCaledus
You ask
Several people have rightly answered that ‘climategate’ is a reason and to some extent they are right. But it was not the only reason and I don’t think it was the main one.
In December 2009 there was a Conference of Parties (CoP) at Copenhagen that was intended to provide a successor Treaty to the Kyoto Protocol. Thanks mainly to the Chinese, that horrific intention was defeated. But all the ‘great and good’ flocked to Copenhagen while proclaiming e.g. “There are only 10 days to save the world!”.
But the mass media around the world promoted and reported the lead up to the event reported the event event which failed. In my opinion, it was that immense world-wide publicity which fired the interest of people so they had the “sudden (if short-lived) interest in climate change”. Many then learned about ‘climategate’ and that held their interest for a while, but few would have heard about ‘climategate’ were it not for the publicity about the failed 2009 CoP.
Richard
Welcome to the real world. Please feel free to follow some of the links to the right of the pages.
Correct question though. The graph in figure 5 does show the popular interest in Climate Science AKA the end of the world.
And after the Millennium interest didn’t keep rising.
Yes, Climategate and Copenhagen caused a spike but the overall numbers aren’t sky-rocketing.
This is probably an effect of the pause. If the end of the world was happening then people would be interested. They aren’t.
So it can be seen that the people know (even if they don’t say) that climate science isn’t all it’s cracked up to be.
Now, when will the BBC and other mainstream media realise that they have lost the audience?
Judging from the constant blather on the subject this morning on BBC radio I think they already have . Hence the need to bombard us with the message to herd people back into line.
Back in the day (when dinosaurs roamed the earth), a “widget” was a theoretical object used in micro economics examples. Or so my professor thought. Someone came to class one day to show an ad for a “widget” (it was a razor blade in a plastic handle used for scraping paint off windows).
Alas that company did not copyright the name (could it have?) so a Widget is now everywhere. At least it sounds better than “app” that smart phones have.
philjourdan, hello.Haramph, I always thought that “widget” was a machining idustrial term. Example “we make widgets!”
Hmm we can’t measure this, we need to make a widget! (not a fixture, 10 min of machining rather then 30 hours) You can call anything a widget but there is one thing. At the time they are vitally important, and after that… disposable.
michael
Among computer graphics developers, at least on Unix and Linux, widgets are the pieces of software that make graphical programs, see http://en.wikipedia.org/wiki/X_Athena_Widgets
Given the proliferation of what is called a widget – that statement of yours is the most correct.
Heard on the flight line: Lad, go get me 5 gallons of prop wash, 100 feet of flight line and a widget.
RobRoy,
We had some experimental materials on a C-130’s propeller for one project that came with a solution to clean them after a mission. They didn’t call it “prop wash”, but I can guarantee that the technicians always called it that.
The old hands tried that with me when I first hit the shop (minus the widget), and I went for a long walk on a nice spring day and came back with a bucket with an asphalt rock in it. When they asked me what I had there, I told them the bucket contained the prop wash and the flight line, but that as I didn’t think they wanted me to rip up the whole parking apron, a single rock would have to do. The old Vietnam Vet Master Sergeant that ran the shop could be heard laughing his head off in his office at hearing my response. It was a good day to come from a long line of aviation enthusiasts.
After Judy Curry recently posted about the 5th anniversary of ClimateGate, I went over to RealClimate to reread some of the heroic contortions that followed the original leak. It’s very interesting to be see, in retrospect, how some people could foresee the ongoing impact of the leaked information on their credibility, and to see the knee-jerk minimizing and apologia. I’m gratified to see the site withering away. The Bore Hole and the one-sided gate keeping has made the site a pointless and frustrating echo chamber, fit for nothing more than climate scientology.
Bob, I beg to differ, but there is a huge difference for us humans between “somewhere up in the troposphere” and 2000 meters deep in the oceans. It’s called heat capacity. For the oceans to warm even a small amount, that means there’s been a huge input of excess heat, which can cycle back to the atmosphere and make our land surface MUCH warmer. This heat input could not be offset by slightly lower temps. up in the troposphere, where the air is thin, and heat capacity relatively miniscule.
Dead wrong.
If the oceans – ALL of the ocean surface waters – warmed by 1 degree, 1/10 of one degree, 1/100 of one degree or 1/1000 of one degree, by the MOST they could increase air temperature by is that same 1, 1/10, 1/100 or 1/1000 of one degree … minus losses.
Heat energy can ONLY move from a hot body to a cold body, and – without additional application of energy – can NEVER get hotter than the hot body. (Actually, the cold body will only asymptotically approach the hot body’s temperature even given an infinite period of time.) No, you are wrong. The heat, once stored below in the oceans, cannot reheat the atmosphere.
What was your degree in by the way? How much thermodynamics, fluid flow, or physics have you learned? Perhaps you can tell us what the mechanism is that you believe will increase the atmospheric temperature?
Barry, heat capacity, if you hadn’t noticed wasn’t mentioned by Steffy. Let’s quote him again, “It is better to plot the surface air temperature. That is what is relevant for us humans: we do not live up in the troposphere…” nor do we live 2000 meters below the surface of the ocean, where the temperatures from surface to that depth have only warmed at a rate of 0.03 deg C/decade since 2005
“It is better to plot the air surface temperature. That is what is relevant for us humans: we do not live up in the troposphere…” However, it is in the troposphere where the additional carbon dioxide is supposed to absorb more outward long-wave radiation. If there is no warming in the troposphere but surface temperatures continue to rise, the cause could hardly be carbon dioxide.
Bob,
So in other words … you agree with Stefan; what goes on at or near the surface matters most here. Thanks for clearing that up.
By the way, I note the barest hint of a slope in the blue line at the bottom of the graph. Try using 10^21 Joules instead, it will really flatten out that temperature curve. Plus zettajoules rolls off the tongue so much more nicely than “ten to the twenty-second power Joules”. Two birds with one stone, hey!
Ross,
Funny, I can’t seem to find anywhere Stefan said that there is no warming in the troposphere. Perhaps you could help by finding the actual quote?
Brandon Gates says: “So in other words … you agree with Stefan; what goes on at or near the surface matters most here. Thanks for clearing that up.”
I believe I’ve stated that, or something to that effect, on numerous occasions. I’ve cleared up nothing. You’ve simply missed it or misunderstood–both of which are not unusual for you.
Brandon Gates says: “By the way, I note the barest hint of a slope in the blue line at the bottom of the graph. Try using 10^21 Joules instead, it will really flatten out that temperature curve. Plus zettajoules rolls off the tongue so much more nicely than “ten to the twenty-second power Joules”. Two birds with one stone, hey!”
Not two birds, Brandon, two datasets from the same source data: one showing a metric that few people understand or care about (10^22 Joules) and the other a metric that people understand, the latter of which shows how insignificant the ocean warming is. And why would I use 10^21 Joules when the intent was to show the data as presented by the NODC?
Maybe you should go back to Sou and whine about my data presentation? What’s that? You already have? How remarkable!!!
Nice chatting with you, troll. Why don’t you come back to WUWT when you can contribute something useful?
Adios.
Bob Tisdale is smarter than I but to me it’s a proven experiment, a known fact that one cannot warm water from the surface with warm air. dut to the cooling effect of evaporation.
That said, When the climate science facilitators(prevaricators) suddenly had a light bulb moment and realised all this “missing heat” is in the oceans. This is a RED HERRING . The only response I think reasonable is to ask by what mechanism do warm CO2 molecules warm the ocean. How does it work?
Air warming the ocean? what’s up with that?
Bob Tisdale,
Brandon Gates says: “So in other words … you agree with Stefan; what goes on at or near the surface matters most here. Thanks for clearing that up.”
Fantastic. How about a comparison of 2000m to 100m?
I must’ve missed the lecture in high school physics which said Joules and Kelvins are comparable units appropriate for plotting on the same scale.
You do realize that orders of magnitude in this context are arbitrary don’t you? Just multiply by 10, easy! It will flatten out that temperature curve faster than a steam roller running over a bag of marshmallows.
It’s rare that I get to use the word “execrable” in sentence. It’s so much less pedestrian than “bullcrap”.
Thanks, Bob. Always a pleasure.
Maybe next week Stefan will take on the ENSO meter that I slave over every week.
http://home.comcast.net/~ewerme/wuwt/elninometer-current.gif
Actually, it updates automatically pretty reliably, currently with data from Australia. Every so often things act up and have to wrestle it back under control.
Ric,
You do a damn fine job with it. I check the ENSO meter all the time.
Many thanks for your diligent ‘subservient’ efforts for this blog. Invaluable. No enterprise runs for long without many dedicated ‘worker bees’ to keep their ‘hive’ going and thrifty.
Meant as very sincere complement. Nothing else.
Highest regards.
‘Thrifty’ doesn’t mean what you think it means, Rud.
Meant as a compliment (note the spelling),
Warmest regards.
I’ve lived in New Hampshire long enough to appreciate thrifty. I break out in hives when I go to Washington DC. Oh. different sort of hive. 🙂
no error bars… so misleading..
No trend, either!
The RealClimate site is moribund. Sometimes they go weeks between posts. That’s no way to gain a faithful following.
rabbit,
Or, like Bob suggests, their day job keeps them busy. You know, doing research and writing papers. There’s certainly been no pause in published literature. But if all one reads is blogs, I can see how such a trivial matter might get overlooked.
Brandon, you have a bad habit of reading between the lines and presenting your opinions as if they were others. It’s nice to see a troll like you at work.
Not only is Brandon a troll, but an ignorant troll who claims that latent heat is returned to the surface with precipitation. One of those types.
Bob Tisdale,
First ‘sploded irony meter of the day goes up in smoke in your honor. It died a worthy death. And I quote:
Imagine you’re a climate scientist; you’re one of the founding members of the website RealClimate; but more importantly, you’re Professor of Physics of the Oceans at the Potsdam Institute for Climate Impact Research of Potsdam University.
Got that? Now, imagine at the top of your high-priority daily to-do list you do NOT find something like help fix climate models, which double the warming rate of the global ocean surfaces over the past 33 years. See Figure 1. Nope. You don’t find that topping the priority list.
But then, it’s my opinion that self-awareness is not amongst your copious list of talents. So again you’ve got me dead to rights on my unwarranted assumptions.
mpainter,
https://www.nc-climate.ncsu.edu/edu/k12/.lsheat
Climate Education for K-12 […] Latent and Sensible Heat […] When the water vapor condenses to form clouds, it releases latent heat into the atmosphere. The latent heat then warms the surrounding air around the new cloud droplet causing instability.
http://www.theweatherprediction.com/habyhints/19/
3. Condensation releases latent heat. This causes the temperature of a cloud to be warmer than it otherwise would have been if it did not release latent heat. Anytime a cloud is warmer than the surrounding environmental air, it will continue to rise and develop. The more moisture a cloud contains, the more potential it has to release latent heat.
4. The amount of cooling experienced during melting or evaporation is a function of the dewpoint depression. If the air is saturated, evaporation will be minimized. Evaporational cooling can not take place once dew forms on the ground but can start to take place when the sun begins to warm the surface (dewpoint depression becomes greater than 0).
5. Dry climates tend to have a larger diurnal range in temperature than moist climates. The primary reason is because of latent heat. In a dry climate, evaporational cooling is at a minimum and there is little water vapor to trap longwave radiation at night. Therefore, in a dry climate the highs will be higher and the lows lower as compared to a moist climate at the same altitude and latitude (all else being equal). [2]
http://www.atmos.washington.edu/~dargan/587/587_3.pdf
* Water vapor
** Most important greenhouse gas
* Clouds
** Albedo effect & greenhouse effect
* Exponential function of temperature
** Warmer air can hold much more moisture
* Temperatures decrease with height in the troposphere
** This means most water vapor is confined in the lower levels in the atmosphere as well
* We’re all familiar with the idea that evaporation causes cooling [1]
** Evaporation of sweat cools you off
** Getting out of a pool on a windy day – cold!
* Similarly, condensation – heating of the atmosphere
** Condensation of water vapor is associated with a release of latent heat
More to it than just this, of course. It gets very interesting on page 39 of the .pdf:
What if…
Upper tropospheric warming is significantly outpaced by lower tropospheric warming, and that this continues
* Claim: Global warming would be much more severe
* First, lapse rate feedback is main negative feedback to global warming
** So surface warming would be expected to be more intense without this
* Second, convective instability would be greater in the warmed atmosphere
** Would expect much more severe storms, hurricanes, etc.
* Lapse rate feedback is a safety valve for climate!
For the numerate amongst us, I suggest reading this entire chapter: http://acmg.seas.harvard.edu/people/faculty/djj/book/bookchap4.html#pgfId=998206
Finally it bears reinforcement that considering only one part of a complex system is scientific folly: http://earthguide.ucsd.edu/virtualmuseum/images/ClimaticCauseEffect.html
Effects, are additive and subtractive (see esp. positive AND negative feedbacks) and need to be considered systemically in net. Heat carried away from the surface by evaporation does not magically exit stage left. Energy retained inside the atmosphere which otherwise woudn’t be there can and will be distributed elsewhere by radiative and non-radiative transfers alike until it escapes radiatively at TOA.
——————————
[1] Some of us are fixated on it to the exclusion of all else.
[2] This should sound familiar, starting ’round about here-ish: http://wattsupwiththat.com/2014/11/25/a-first-look-at-surfrad/#comment-1801337 Also see: http://wattsupwiththat.com/2014/12/02/many-thanks-to-kevin-trenberth-for-being-open-minded/#comment-1806291
Bob Tisdale suggests: “Afterwards, if you would, please consider adding the WUWT widget to your blog.”
That’s a fine idea in the context of the concluding sentence in the RealClimate post:
“Watts’ widget is quite a useful indicator though: whenever you see it on a website, you know they are trying to fool rather than inform you there.”
could you be specific? Oh.. that would imply you understand something.
Gosh, I too went to realclimate the other day. During a brief period of détente on of my comments was actually accepted there. The thread was about statistical analysis of inflection points in the surface temperature record. A commenter asked why the satellite record was not used. Gavin jumped in with an editorial response that the satellites measured something else with different signal to noise.
I tried to post the comment, ” “Gavin says the satellites measure something else”. Quite so. They measure the entire troposphere and the entire globe without the need for massive data interpolation.”
Comment deleted. Gosh, I was agreeing with him. So much for détente.
Talking about double standard here are we? If non scientists such as yourself can crap on about science, why not the other way around? How about Judith Curry?
yeah right December 10, 2014 at 7:14 pm
Talking about double standard here are we? If non scientists such as yourself can crap on about science, why not the other way around? How about Judith Curry?
+++++++++++
Just what are you trying to say? Form a cogent thought, and then write it. Imagine if you wrote the above on the other site… You’d have no voice of course. Back at you regarding your scatalogical comment. Looks like the mindless trolls are checking out a place where they’re free to show us how little they know.
If my comment was hard to digest, what I tried to say was simply Bob should stick with blogging about widgets, rahmstorf with science. If that’s still hard to discern, then stop complaining and let everyone do their own work.
yeah right,
You tried to say simply; ” Bob should stick with blogging about widgets, rahmstorf with science.”
Well, I guess Bob has heard your opinion and is giving it the consideration he deems fit, now, are you going to go and tell Rahmstorf to stick with science?
He obviously is inclined to stop by WUWT from time to time but that’s probably just to check the widget.
It would be great if he did take in more than that; he might be interested to read that surface temperatures are no longer the metric in vogue, and he might just see your suggestion that he “stick with science” instead of trivial political stuff.
Funnily enough, many of us here would probably agree with you on that score.
@mebbe, Yes stefan really should stick with science. He’s probably trying to attract traffic to their site by complaining, whingeing, that kind of stuff attracts more interest than boring science. well superficial controversial twisted science does seem to attract more response as well.
yeah right,
I’m sorry you think science is boring. Not to worry, though, you can get plenty of complaining and whining at RC.
Mebbe, what I tried to say was real science tends to bore the typical bunch of folks like you. Sorry, if my comments were not straight forward. I just wanted to be more polite.
If non scientists such as
There was a climate scientist who once frequented this site who claimed that we, because we were not climate scientists, could not understand Briffa’s most recent paper. I asked him, other than being able to collect the data itself, what about the paper was beyond the ken of someone with first year stats under their belt. He refused to answer the question.
The “non scientist” argument is as hollow as one can get.
Hollow and blatantly ad hominem.
yeah right, Sir or Mam, if you would read Carl Sagan you could learn that science is as much about critical thought as it is about facts and figures. Research to prove a fore-drawn conclusion is only a product of religious zeal for that hypothesis and is a trap for the unwise. You must reconcile a given argument with critical analysis such as his Baloney Detector before presenting or accepting it as constructive. Statements from zeal or emotion are invalid to higher thinking (not to be confused with higher education).
You dont have to be a scientist to “do” science.
Additionally, one labelled a scientist doesnt automatically “do” science.
It is worth getting to grips with those two concepts before putting your foot in it again.
It all becomes readily apparent in their effort to regain some sense of control after getting booted off of WUWT by coming up with a new blog mocking the name of WUWT. If they truly felt confident with their, um, “scientific” approaches regarding GW as “facts” they wouldn’t feel the need to do a blog. Their own insecurity and ego betray them. Mockery is their last form of retaliatory defense that ultimately goes nowhere.
I spent some time at Real Climate asking a few questions. I must say, it is quite like poking a hornets nest. This is a cult, pure and simple. One of two things needs to happen. If the government is going to fund climate research, it needs to equally fund both sides of this debate. Or else it needs to fund neither. I have heard tales of how people blindly followed soothsayers of old with their entrail-based predictions. I would have never believed I would witness such an event in our present day had I not seen it myself. This is very disturbing. Thank you to all of you who are fighting this menace.
average joe says: “If the government is going to fund climate research, it needs to equally fund both sides of this debate. Or else it needs to fund neither…”
Unfortunately, since the founding of the IPCC, government-funded global warming research around the world has been directed at proving manmade global warming exists and that it will lead to bad things…all in an effort to meet underlying political agendas.
@Average joe – the government is not “funding” anything. They are buying a no-bid product. Until people realize that, they will not understand why Obama can be so stupid about the issue.
Actually the biggest tall tale that both sides use is the myth of a global average temperature. Any post which seeks to compare trends of such or other are pure fantasy.
Couldn’t agree more, Jeff. I wish this (very significant) issue would receive more air time.
Bob, not sure if you or anyone else noticed this, but dear old Steffy Rahmstorf’s post is actually a translation of a post he did in German more than two years ago!
It’s here: http://www.scilogs.de/klimalounge/die-populaerste-trickgrafik-der-klimaskeptiker-vahrenholt/
So I guess professor Steffy thought his widget post was important and relevant enough to warrant translation and re-publishing to reach a wider audience.
Ausgezeichnet, Herr Professor!
Hi Grammar Guy. Thanks. I saw that he had discussed it at his other blog but missed that it was two years old. Maybe Stefan should’ve checked to see if it was still appearing here at WUWT before reposting it at RealClimate.
Cheers.
Had some real fun last night at RC by asking “at what altitude does the troposphere begin?” The response and my riposte seemed to end the discussion.
Passing moderation was a real problem, fortunately it really past bedtime.
I’m wrong…the discussion continued.
Bob
My admiration for your courage and fortitude have massively increased today. You ACTUALLY visit RC. WOW.
Went there once. The assole was ignorant and incompetent with his reply so I never went back.
Just in case I have archived the following HERE. Stefan Rahmstorf was also one of the lead authors of the IPCC 4th Assessment Report.
I thought alarmists generally claimed recent global warming was 0.7C. 0.16 x 3 = 0.48 C. Must be travesty somewhere.
“It is better to plot the surface air temperature. That is what is relevant for us humans: we do not live up in the troposphere, nor do natural ecosystems”
Nor we live in a closed box at an airport two meters above the surface. Measuring temperature on surface leads to hugely different results if we measure the weather as we feel it on the skin.
I read WUWT almost every day, and until I read this article, I can’t recall ever seeing this widget. Can someone point it out to me? Even now, I can’t find it.
Update: Oh, now I get it. It’s under a menu selection, and it’s something you can add to your own website. Not something I’ve ever come across, however, not even here. I guess I owe some thanks to Rahmstorf for bringing it to my attention.
Bill2:
For the record, climate is oceanic-atmospheric driven weather systems interacting with a given topographical area of the globe to produce wind, precipitation and cloud cover averages and extremes, which result in temperature and cloud/precip ups and downs. If you want to study climate change you must study weather patterns and what drives them. Topographical location (latitude, longitude, altitude, and large land/water features and location) does not change unless we are speaking on paleoclimate time scales.
Thus it makes sense to study weather pattern variations, but not climate or temperature. Studying climate, and even endlessly studying temperature is silly. Daily, weekly, monthly, seasonal, yearly, decadal, and multi-decadal weather patterns and systems variation are all important to the study of whether or not humans are causing changes in weather patterns that would lead to changes in cloud cover, precipitation, wind, etc. Again, because oceanic-atmospheric driven weather patterns change temperature. Therefore we must determine if CO2, and only the amount added by human industry, is powerful enough to march out into weather pattern systems and change them.
So here is the rub with that. There is a bold-faced reason why climatologists, especially the catastrophic kind wanting easy press will not touch weather system data. I know the reason. Do you?
Caveat: There are spots on the globe that also have manmade structures and copious amounts of pollution that affect local weather pattern systems. But this footprint is extremely tiny compared to global natural settings and weather systems
” I know the reason. Do you?”
Don’t be coy.
Weather systems, so far, do not show trends. Precip hasn’t gotten worse. We are not covered with layers of water vapor increases. Tornadoes, hurricanes, drought, all demonstrate patterns that link to natural weather pattern variations. Weather systems, semi-permanent large pressure systems, and even small temporary pressure systems seem unaffected by human additions of CO2 to the atmosphere.
Could it be that by looking at temperature with too fine a lense we have inadvertently gotten our panties in a twist over nothing? If temperature naturally varies in large-ish sloping ups and downs over many decades while weather patterns do their thing, these temperature trends up and down, when looked at too closely, may have scared the easily frightened.
Well Put, Pamela Gray. Your little secret; could it be that the truth hurts? If one is living in the penthouse of a house of cards all atop the gravy train, the truth can hurt too much.
How true that we mustn’t forget that human’s do indeed affect local climates. We should add to the list: de-forestation, agricultural burning and mass irrigation.
CO2 climate change? Sorry no EVIDENCE for that.
Congratulations that your widget got this much attention. I also wrote a text explaining why I disagree with all Rahmstorf’s points:
http://motls.blogspot.com/2014/12/realclimates-opinion-on-wuwt-widget.html?m=0
Thanks, Lubos.
The Climate Widget Wars!
Complete with one side using truncated graphs and out-of-date versions.
Marvelous!
I think the trend divergence of ‘hits’ since 2011 could be partly due to the way folks are not censored here as much as RC and treated with more respect as a rule. That would also explain why so many people ignore sites like Hotwhopper after one visit, like an agnostic at a Pentecostal revival.
I added your widget to my blog, Roberts Projects http://www.robertsprojects.blogspot.com/
It is a very non-controversial DYI site, please check it out!
Robert
They are kidding me, right? The whole theory of AGW says that CO2 in in places like the troposphere is WHERE the green house effect takes place. The problem is we NOT seeing warming according due to CO2 occurring in that troposphere. We THEN should see surface temperatures follow that increase.
The WHOLE theory of AGW is based on this idea, and now they suggesting they don’t look where the heat supposed to be trapped by CO2? So now look at surface temperatures? The surface temps are all messed up by urban heat effects and simple site changes. And surface temperatures are supposed to FOLLOW the increasing heat in the troposphere!
So they saying don’t look where their theory of global warming supposed to case warming! Gasp!
Regards,
Albert D. Kallal
Edmonton, Alberta Canada
(in a loud, echoing voice) “Pay no attention to that man behind the curtain!”
“Watts’ widget is quite a useful indicator though: whenever you see it on a website, you know they are trying to fool rather than inform you there.”
LOL, quite the contrary! Watt’s widget provides more context than the RC version. Omitting CONTEXT is exactly what these advocates do to fool people into believing increasing the GHE heat flux by 1% could cause a 10% increase in GHE temperature gain.