Guest Post by Willis Eschenbach
Today I ran across an interesting presentation from 2013 regarding the Argo floats. These are a large number of independent floats spread all across the world oceans. They spend most of their time sleeping at a depth of 1,000 metres (3,300 feet) below the surface of the ocean. Then they drop down to 2,000 metres, which is followed by a slow ascent to the surface taking measurements of temperature and salinity. Once on the surface they call home like ET, and then drop down to the deeps and go to sleep again.
 Figure 1. Argo float operation. There are about 3,500 floats in the ocean, and a total of ~10,000 floats have been used over the period of operation.
Now, there were several interesting things in the presentation. The first was a total surprise to me. We hear a lot about how the heat is “hiding” in the ocean. But what I didn’t know was that according to the Argo floats, every bit of the warming is happening in the southern extratropical ocean, while the oceans of both the tropics and the northern hemisphere are actually cooling … color me puzzled.
 Figure 2. Change in ocean heat content by zone. Units are 10^22 joules. Graph from the presentation linked to above.
What does that indicate? I’m sure I don’t know … but I doubt very greatly if any of the climate models reproduce that curious combination of warming and cooling.
What I found most interesting, however, was a graph of the global change in ocean heat content over the period. Here is that graph:
 Figure 3. Global change in ocean heat content (OHC) since the time of the full deployment of the Argo floats. Data from the surface down to 2000 decibars (dbar), which is approximately 2000 metres.
I was sad to see a couple of things. First, this is the data with the monthly averages (the “climatology”) removed. I prefer to see the raw data so I can look at seasonal patterns. Second, the presentation lacks error bars … but needs must when the devil drives, so I use the data I have. I digitized the data so I could analyze it myself.
The first thing that I wanted to do was to look at the data using more familiar units. I mean, nobody knows what 10^22 joules means in the top two kilometres of the ocean. So I converted the data from joules to degrees C. The conversion is that it takes 4 joules to heat a gram of seawater by 1°C (or 4 megajoules per tonne per degree). The other information needed is that there are 0.65 billion cubic kilometres of ocean above 2,000 metres of depth, and that seawater weighs about 1.033 tonnes per cubic metre.
 Figure 4. Ocean volume by depth. Little of the ocean is deeper than about 5 km.
Using that information, I calculated what the change in heat content means in terms of temperature change. Here is that graph:
 Figure 5. Change in ocean temperature from the surface down to 2,000 dbar (~ 2,000 metres).
A change of two hundredths of a degree per decade … be still, my beating heart. Unfortunately, I can’t give you any error estimate on the trend because there are no error bars on the data in the presentation.
Let me take a detour here whose purpose will be clear in a moment. I want to look at the CERES data, which is satellite based data on the radiation budget of the earth. Here is the month-by-month change in the “Net TOA Radiation”. The net TOA radiation is the incoming radiation at the Top Of the Atmosphere (TOA) that hits the earth (sunlight) minus the outgoing radiation at the TOA leaving the earth (reflected sunlight plus thermal infrared [longwave] radiation). Figure 6 shows those changes:
 Figure 6. Decomposition of the CERES net TOA radiation into a seasonal and a residual component. Units are watts per square metre (W/m2). The residual component (bottom panel) is the raw data (top panel), with the monthly averages (seasonal component or “climatology”, middle panel) removed.
Now, this is an interesting graph in its own right. In the net radiation you can see the ~ 20 watts per square metre (W/m2) effect of the annual swing of the earth towards and away from the sun. The earth is closest to the sun in January, so the earth gains energy around that time, and loses it in the other half of the year. In addition, you can see the amazing stability of the system. Once we remove the monthly averages (the “climatology’), the net TOA imbalance generally only varies by something on the order of ± half a watt per square metre over the thirteen years of the record, with no statistically significant trend at all … astounding.
But I digress. The reason I’m looking at this is that the excess energy that comes in to the Earth (positive values), peaking in January, is stored almost entirely in the ocean, and then it comes back out of the ocean with a peak in outgoing radiation (negative values) in July. We know this because the temperature doesn’t swing from the radiation imbalance, and there’s nowhere else large enough and responsive enough for that amount of energy to be stored and released.
In other words, the net TOA radiation is another way that we can measure the monthly change in the ocean heat content, and thus we can perform a cross-check on the OHC figures. It won’t be exact, because some of the energy is stored and released in both ice and land … but the main storage is in the ocean. So the CERES net TOA data will give us a maximum value for the changes in ocean storage, the value we get if we assume it’s all stored stored in the ocean.
So all we need to do is to compare the monthly change in the OHC content minus the climatology, as shown in Figure 1, with the monthly change in downwelling radiation minus the climatology as shown in the bottom panel of Figure 6 … except that they are in different units.
However, that just means that we have to convert the net TOA radiation data in watts per square metre into joules per month. The conversion is
1 watt-month/m2 (which is one watt per square metre applied for one month) =
1 joule-month/sec-m2 * 5.11e+14 m2 (area of surface) * 365.2425/12 * 24 * 3600 seconds / month =
1.35e+21 joules
So I converted the net TOA radiation into joules per month, and I compared that to the Argo data for the same thing, the change in ocean heat content in joules/month. Figure 7 shows that comparison:
 Figure 7. A comparison of the monthly changes in ocean heat content (OHC) as measured by the CERES data and by the Argo floats.
Now, this is a most strange outcome. The Argo data says that there is a huge, stupendous amount of energy going into and out of the ocean … but on the other hand the CERES data says that there’s only a comparatively very small amount of energy going into and out of the ocean. Oh, even per CERES it’s still a whole lot of energy, but nothing like what the Argo data claims.
How are we to understand this perplexitude? The true answer to that question is … I don’t know. It’s possible I’ve got an arithmetical error, although I’ve been over and over the calculations listed above. I know that the CERES data is of the right size, because it shows the ~20 watt swing from the ellipticity of the earth’s orbit. And I know my Argo data is correct by comparing Figure 7 to Figure 2.
My best guess is that the error bars on the Argo data are much larger than is generally believed. I say this because the CERES data are not all that accurate … but they are very precise. I also say it because of my previous analysis of the claimed errors given by Levitus et al in my post “Decimals of Precision”.
In any case, it’s a most curious result. At a minimum, it raises serious questions about our ability to measure the heat content of the ocean to the precision claimed by the Argo folks. Remember they claim they can measure the monthly average temperature of 0.65 BILLION cubic kilometres of ocean water to a precision of one hundredth of a degree Celsius … which seems very doubtful to me. I suspect that the true error bars on their data would go from floor to ceiling.
But that’s just my thoughts. All suggestions gladly accepted.
Best of everything to all,
w.
My Standard Request: If you disagree with someone, please QUOTE THE EXACT WORDS YOU DISAGREE WITH. That way everyone can understand the exact nature of your objections.
Data and Code: The Argo data (as a .csv file) and R code is online in a small folder called Argo and CERES Folder. The CERES TOA data is here in R format, and the CERES surface data in R format is here. WARNING: The CERES data is 220 Mb, and the CERES surface data is 110 Mb.
Further Data:
0.65 BILLION cubic kilometres of ocean with 3500 floats, do the math, no accuracy at all
Yes exactly, top it off they move around, there is no reason to believe they are measuring much of anything that we could begin to comprehend. It like taking random skin temperature of a human across the period of a year and then trying to ascertain the humans state of health.
The lack of error bars is sub-prime. Also, with these grandiose averaging schemes, we never get any insight into how any systemetic error is analysed, evaluated and its effect taken into account..
Perhaps there is a measured offset for each float before launch, but is this linear with temperature and does it perhaps change through time or because the biasing/measuring circuitry is changing in temperature. Or does the systematic error vary with the amount of power available. Any way it could be a real nightmare given there are 3500 roving around freely in the oceans currents, and therefore should be open to scrutiny.
That analogy got stretched a bit when you jumped to state of health.
Paul, standard in the air- and marine-temperature measurement community is the assumption that each instance of measurement error has a constant mean and a random distribution. The workers then just estimate and subtract a mean error, invoke the central limit theorem and claim the distribution averages away, and then proceed as though the global average is free of measurement error.
It’s as unjustifiable an assumption as it is universal. In my experience, that assumption is defended fiercely. And for good reason: if they acknowledge the reality of systematic measurement error, the error bars are so large they are left with nothing to say.
Yes, and they move around in the same blob of water during their horizontal drifts so if they sink into a warm patch in a current, they stay in that warm water as they are “moving” around the ocean during that part of their dive cycle.
They move around in currents, so what is it that they are actually measuring? I would like to see where possible, anchored ARGO buoys.
Paul in Sweden December 7, 2014 at 10:41 am Edit
Hey, we’re a full service website. See the TAO buoys.
See also my posts on the TAO buoys, viz:
Further Evidence for my Thunderstorm Thermostat Hypothesis
The Tao That Can Be Spoken …
TAO/TRITON TAKE TWO
Cloud Radiation Forcing in the TAO Dataset
The Tao of El Nino
A Tropical Oddity
TAO Rain, Sea, and Air Data
All the best,
w.
Based upon facts introduced into evidence, the accuracy is indeterminate.
There have been serious problems with the accuracy of the ARGO CTD modules from the beginning of the program. Seabird issued a series of technical bulletins in 2009 that described some of the problems in detail.
The major issue was the high incidence of micro leaks of the float drunk pressure sensor.
The effect of the problem was that the buoys gradually developed an offset in the depth measurement and a reduction in sensitivity in the depth measurement such that the buoys increasingly overestimated the depth. The offset could be readily detected- the buoys would report surface depths above sealevel. The loss in sensitivity was more problematic.
The effect of this problem, and a related problem that affected sensitivity, was that each ARGO buoy reported temperatures at depth in excess of the true temperature (according to the temperature lapse rate) by an amount which increased over time.
I would like to know whether the problem has now been rectified.
Until I do know, I certainly won’t trust ARGO data.
That should read “float druck pressure sensor micro leak problem”
Yes, scienitsts using the data have adjusted it for this problem, but I’m unsure if the Argo data that Willis has accessed has had this correction applied. See Barker (2011) Pressure Sensor Drifts in Argo and Their Impacts. JOURNAL OF ATMOSPHERIC AND OCEANIC TECHNOLOGY, VOLUME 28 p 1036.
Does anyone know what the accuracy of the thermometers on those units are? I’d be surprised if it’s better than 0.1C, especially after a decade without re-calibration.
http://www.argo.ucsd.edu/FAQ.html: How accurate is the Argo data?
The temperatures in the Argo profiles are accurate to ± 0.002°C and pressures are accurate to ± 2.4dbar
Reblogged this on Centinel2012 and commented:
No basic disagreement with you work in fact I was impressed!
I do have a comment though, the 20 watt swing from the ellipticity of the earth’s orbit would effect the northern and southern hemispheres differently since the north is predominately land and the south is predominantly water. The south is closer to the sum in the winter so the water would absorb more heat and there is more water. This would set up a flow of water based on the heat imbalance. This maybe part of what you have found?
The south is closer to the sun in the Northern winter. It’s summer down south in January. I’m not sure if that’s what you meant or not, but it seemed like you had missed that fact from your comment.
Yeah, about that. I once took the time to actually compute the TOA insolation variation from Mr. Sun, and ended up with a number more like 91 W/m^2. Let’s see now:
http://en.wikipedia.org/wiki/Solar_constant#Solar_irradiance
Yup, my calculation agrees well with this article. I get 6.7% variation, they assert 6.9% (probably disagreeing about the base, I’m using the insolation at 1 AU). This works out to be variation from 1412 W/m^2 in January to 1321 W/m^2 in July, and 1412 – 1321 = 91 W/m^2.
So I’m not sure what the 20 W/m^2 is referring to. Presumably some multiple of this after accounting for albedo, emissivity etc. But TOA insolation most definitely does not vary by 20 W/m^2 due to the Earth’s elliptical orbit, it varies by 91 W/m^2. Some other number based on this number may, but not this number.
I truly enjoy pointing out two things when I discuss this number, as they add to Willis’ perplexities. First, solar peak occurs in northern hemisphere winter, or southern hemisphere summer — right at the hottest/coldest parts, in fact. Second, the Earth’s average temperature peaks in northern hemisphere summer — when insolation is lowest — and is minimum in southern hemisphere summer — when insolation is the highest. Talk about counterintuitive! Yes, people have glib explanations for this, but we are talking about 90 W/m^2 difference here. That is an easy 30 to 40 times the entire change in forcing expected from CO_2, and it still isn’t sufficient to overcome the obvious nonlinearities in the Earth’s climate system that would produce the exact opposite result if one attempted to heat nearly any toy/model planet without those nonlinearities.
Of course, CERES shows a strong variation with the same general signal, but all one can really get out of it is that the system is remarkably stable. Oh, and that any modulation of energy flow by CO_2 is completely invisible, at least on the decadal timescale. That too is a bit surprising, although it may just be a matter of resolution.
rgb
RGB:
For every day-of-year (DOY), TOA radiation at top-of-atmosphere follows a cosine equation curve fit to Leif’s 10 years of SORCE measured radiation data (within +/- 0.30 watt/m^2) every day:
TOA =1362.36+46.142*(COS(0.0167299*(DOY)+0.03150896))
Above is in radians, using Excel’s “language” for DOY from 1 to 366.
For Latitude in Radians, again using Excel’s language,
when TAU = Day_Angle (based on Day-of-Year) TAU = 2*3.1415*(DOY-1)/365
Declination angle =0.006918-0.399912*COS(TAU)+0.070257*SIN(TAU)-0.006758*COS(2*(TAU))+0.000907*SIN(2*(TAU))-0.002697*COS(3*(TAU))+0.00148*SIN(3*(TAU))
We can keep going, because, based on each hour-of-day and day-of-year, you can get the actual radiation falling (in clear skies) on each sq meter at any latitude for any hour of the day.
The values in the graphs are above are represent daily total approximations. NOT the actual radiation falling on a flat surface at that latitude.
Thus, for the following day-of-year values, top-of-atmosphere radiation =
Dates:
22 March, June, Sept and Dec represent the equinox and solstices (they vary a little with leap years and all).
5 Jan is solar maximum, 5 July is solar minimum.
The rest fill in the monthly pattern.
“…we are talking about 90 W/m^2 difference here. That is an easy 30 to 40 times the entire change in forcing expected from CO_2,”
More like 200 time the forcing from CO2.
References: https://geoscienceenvironment.wordpress.com/2014/09/04/the-emperors-of-climate-alarmism-wear-no-clothes/
Frederick Colbourne December 4, 2014 at 11:13 pm
Mmm … neither one of you is correct. The change from a doubling of CO2 is estimated at 3.7 W/m2, averaged over the earth’s surface. The 90 W/m2 is NOT averaged over the earths surface. Once we do that by dividing 90 W/m2 by 4, to give us an apples to apples comparison, it reduces to about 22 W/m2.
And dividing 22 by 3.7 gives us a value of about six times the estimated forcing from a doubling of CO2.
w.
Willis writes “The change from a doubling of CO2 is estimated at 3.7 W/m2, averaged over the earth’s surface.”
I would say the change from a doubling of CO2 was actually supposed to be about 1.1W …and then you add (positively assumed) feedbacks to get to the 3.7W. There are no feedbacks applied to the 22W.
I have not looked at in detiail but I always presumed that the 20 W/m^2 variation was based upon the claimed avreaged 342 W/m^2 in the K & T energy budget.which is about 5.85%, but now I am beginning to question the correctness of that presumption.
I am not entirely sure how K & T get the claimed average 342 W/m^2 from the 1412 W/m^2 in January to 1321 W/m^2 in July TOA figures, but once again, I presumed that it was incidental to some weighting from the eliptical nature of the orbit
No – the forcing for 2xCO2 is ~3.7 w/m2. Myhre et al provide a quick and easy formula which gives a pretty close approximation, i.e Forcing = 5.35 x ln(2) for the response to a doubling. If you want estimate the forcing to date since ~1850 use 5.35 x ln (400/285) where current level = 400 ppm; 1850 level = 285 ppm.
While I disagree strongly with this (widely-used) flat-earth approximation, the area’s for a spherical global of radius 6371 km for the latitude bands you’ve used above follow:
Notice, please, the very small relative area of the Arctic Ocean (only 14 Mkm^2 between latitude 70 north and the pole) compared to the huge equator band between 23.5 south and 23.5 north 203.4 Mkm^2; and the even larger mid-latitude band between 45 south and 45 north: 360.7 Mkm^2.
Now, we need to address the percent of each latitude band that is land, and what area is ocean, but that comes after the decision of what latitude bands are chosen.
In reply to Willis and RGB
“And dividing 22 by 3.7 gives us a value of about six times the estimated forcing from a doubling of CO2.”
It is not correct that the figure 3.7 is to include 2.7 degrees of water vapour feedback? Isn’t it agreed the CO2 itself is about 1 degree?
The feedbacks are not in evidence. Assuming there are not powerful negative feedbacks, it means the calculation is really 22/1 = 22.
John, Yes, my bad, I said doubling but I should have simply said “change”.
So, Basis the above – there is at least a suggestion that the ‘science is – in fact – not entirely settled, definitions, understanding, magnitude of effects and all . . .’
Goodness me!
Have the Menn I/C global warming (“we can Menn-make it”) exceeded their briefs?
I would suggest that there may be a presumable case that they are, in fact, busy trying to feather their own nests, and when the whole meme is going down the porcelain telephone . . . .
Mildly unsurprised,
Auto
RGB: A change in solar flux of 90 W/m2 needs to be divided by 4 and then multiplied by 0.7 (1-albedo) to convert it to a global solar forcing of about 16 W/m2.
Willis’s CERES data is the TOA radiative imbalance: TSI – reflected SWR – OLR. It has been adjusted so that the average imbalance agrees with the ARGO, which is why it runs exactly down the middle of Willis’s CERES/ARGO plot. When the earth is closest to the sun, the snow cover in the NH is at it’s greatest and reflected SWR from clear skies is also at its greatest. This increases the 16 W/m2 forcing (radiative imbalance) from ellipticity by about another 5 W/m2.
http://www.pnas.org/content/110/19/7568.full
One ARGO for every 300,000 cubic km of water. I think that if they travel constantly at about 400km/h 24/7 they will be able to visit every cubic km once a month.
Yep, that sounds feasible…
And yet the buoys travel with the water, so they’re not traveling horizontally through the water between readings. Hence, they measure only a very small column of water as they ascend. Those messing with the data make assumptions about the rest of the 300,000 cubic km of water that can’t be statistically projected or substantiated.
Rocky that is a well observed point: They are re-measuring the same water they float with, unless there are flows in different directions at different depths.
Suppose one was East and one was West and they were half the vertical depth each, same speed. The float would cycle up and down remaining in the same physical region all the time, measuring the passing current. Not bad. If the current was 99% in one direction, it would be re-measuring the same water each 10 days, following it with the current. That would tell us nothing about what is going on 20 or 200 km away.
Amen Rocky. I’ve been saying that for a while. The drift data should be treated as spot data where the float gets to depth and then ignored since it’s moving with the water… assuming they stay at the prescribed depth and accurately report that, which I understand has been problematic since the program began.
So does this mean that they will all end up at that floating garbage heap in the Pacific? This feels a lot like the games they used to play with waether stations before they got the satellite that measures surface temperature that showed the nonesence of the weather stations for depicting global averages.
JR December 6, 2014 at 1:11 pm
Nope. That’s surface currents. The Argo buoys, on the other hand, are drifting with the currents a kilometer down. If you look at the distribution of floats, there are certainly gaps and crowded places, but the North Pacific Gyre isn’t one of them.

I wrote about this a couple years back, hang on … OK, the analysis is in a post called Where in the world is Argo. The money graph is:
You can see the over- and under-sampled regions, including undersampling at the Inter Tropical Convergence Zone (ITCZ). The ITCZ runs across the Pacific just north of the Equator.
w.
Luckily that’s only km/hr and not knots
And averaging all those measurements from different parts of the ocean are, like average surface measurements, physically meaningless. Intensive properties, people.
Of course there must be some heat coming up from the bottom. How much do we understand that?
A bit less than 0.1 watts per m2
And what is that based upon? Eg., energy from underwater volcanos, fissures, subduction zones, the fact that the seabed is nearer the core and thereby receives more heat, the fact that the oceanic crust is far thinner than the continental crust, etc?
At best it is a guestimate, with significant errors since we have never attempted the collection of scientific observational data, so we are not in a position to proffer a scientif figure.
This becomes important when one claims that there is some unaccounted 0.75 watts per m2 of energy. If your claimed figure of 0.1 is not 0.1 but is instead 0.3, it may account for almost 50% of the alleged missing energy.
This is a point I was making with the K & T energy budget. You see an input solar figure of between 340 and 342 W/m^2 whereas it would appear (even ignoring the variance of the 11 year solar cycle), the figure should perhaps be 341.625. W/m^2. Now if every figure used in the K & T energy budget is +/- 0.375 W/m^2 how can you begin to claim that there is some missing heat/energy of the orders of magnitude being claimed by the warmists. Some of the errors may cancel each other out, but some may compound.
When you are looking for missing energy in the system of approximately 1 W/m^2 every 0.1 W/m^2 of measurement error, or energy source not accounted for becomes material.
Richard Verney,
Try the paper on this page:
Hofmeister and Criss 2003, page 170 table 2.
63 mW/m² seems to be the going rate for mean oceanic flux.
Oops, the link:
http://www.mantleplumes.org/Energetics.html
I completely understand why you are perplexed. So am I, but no reflection on your post. And the “science is settled????”
Now, there were several interesting things in the presentation. The first was a total surprise to me. We hear a lot about how the heat is “hiding” in the ocean. But what I didn’t know was that according to the Argo floats, every bit of the warming is happening in the southern extratropical ocean, while the oceans of both the tropics and the northern hemisphere are actually cooling … color me puzzled.
Willis, I remember reading in here a few years back about the oscillation between the Antarctic, and Arctic Poles, how each basically cools then warms in alternative cycles, could this be what we see in this?
Alternatively, your Thermostat hypothesis in action, using the ocean currents to move excess heat to the Poles to cool, in conjunction with the convection currents in the atmosphere?
Yes, the poles apparently warm and cool alternately. i believe I read a piece by a meteorologist a while back that said that. He said that when the Arctic starts to revert to ice-build, the Antarctic will go through a warming period – and attention of the warmist liars will shift from the Arctic to the Antarctic.
Joe Bastardi weatherbell analytics.
Perhaps naive question, but how do zonal trends in Fig. 2 of 5.7 x 10^22 J/decade, -.1 x10^22 J/decade and -/4 x 10^22 J/decade average to global trend of 6.3 x 10^22 J/decade in Fig. 7?
Good question, Quinn. The answer is, different sizes of zones.
w.
Well, I thought about that, but it still don’t make no sense. Granting the southern zone is way bigger, it seems odd, even to an innumerate boob such as myself, that averaging in negative trend values in tropics and northern zone could elevate the global average trend above that of the Southern Zone. That would be some pretty darn fancy math, if you ask me.
Let me put it a different way. I know I don’t get out much, but I have never seen an average of values that was outside the range of the values.
Huh? Dang, you’re right, good question. The three zonal values are -.4e+22 J, -.1e+22 J, and 5.7e+22 J/decade … and as you point out the global value is given as 6.3e+22 J/decade. Can’t be. Looks like there must be an error on their part. Good thing my analysis doesn’t depend on their numbers, since I’m using the first differences and ignoring the trend.
Ah, well, always more questions than answers in this settled science …
w.
experimenter expectation effect. Clearly it is impossible to average 5.7, -0.1 and -0.4 and get 6.3, regardless of the size of the 3 basins. The correct answer is probably 0.63 (when all results are scaled to the same order of magnitude).
however, in Climate Science the correctness of the answer depends not on the math, it depends on what the scientists expected to see. if the answer matches what they expect, they don’t bother to check the math. if it doesn’t match, they change the math until it does.
in this case they expected to see warming, so they didn’t bother to check the reasonableness of their results, once they delivered the expected warming.
what this result shows is the problem in doing science without the necessary experimental controls to prevent human bias.
Fig. 3 appears to have 9 additional months of the year 2013 added compared to Fig. 2.
They don’t *average* to 6.3 x 10^22, they *sum* to it. The missing 1.1 x 10^22 is a combination of heat gain in the polar oceans (80 – 90 degrees) and rounding error.
Not to toss in a small spanner or anything, but I was reading on another site this week a claim that the Antarctic ice movement from glaciers into the ocean is 91.5 cu km/year. It was so badly worded that I had to ask if that was the correct interpretation of their text but I think that is what they meant.
I noted that if so, then heating 91.5 cu km of -20 C ice to +4 would absorb 1.27 x10^19 Joules of ocean heat (per year, not per decade). This might in part account for the expanding sea ice around Antarctica (if that volume of glacier ice entering the sea was increasing). They deleted my comment – the only one at the time.
If all the glaciers entering the sea were considered (no idea what that total is) the number might start to influence the total heat gained.
Yes, ocean heat is actually net gain, but it means heat is entering and being lost to melting ice and it has to come from somewhere. As the transport mechanism of the heat liberated by creating replacement glacier snow above the land involves shedding heat higher and closer to the TOA, at least in it part bypasses the need to radiate from the surface.
The heat needed to account for melting all the NH seasonal snow and ice is considerable. It would take maybe 1×10^25 J to melt all the world’s permanent ice. That is enough to hold the oceans at a constant temp for 1600 years (if the 6.3×10^22 gain rate per decade is real).
So the processes of evaporation/condensation and freezing/thawing are the prime controllers of the earths surface temperature. Also, increasing CO2 near TOA should increase the rate of radiation to space more than to the surface. This effect is measurable at the poles where there are inversions (air warmer than the surface).
The global OHC slide in the presentation reads ‘Global, 60°S-60°N’ and shows a trend of 63 ZJ/decade, so the difference isn’t in the polar oceans.
Interesting and creative analysis and it seems to be well rooted in the data.
Is it amazing that the error bars for so much to do with the promotion of the climate crisis are always missing?
The error bars are missing, since these people do not make errors?
Besides, it would be humiliating to admit that one does not have the faintest idea how good the results are. One can also do it by stating ‘medium confidence, expert evaluation’ meaning ‘this is what I think’. Not science, really.
How are we to understand this perplexitude?
Maybe this has something to do with it:
Correcting Ocean Cooling
My mind reels! GK
Ah, the old cooling the past trick to make the present look warmer.
What percent of the global salt water is being measured by these again? How does that coverage look on a map at depth?
I am also checking on the proper use of the word perplexitude! 😉
Thanks for the continue effort to trust but verify Willis!.
Thanks, ossqss. To answer your question about proper use, when things are perplexitudinous, it means that they engender internal consternabulation.
w.
Cleared that right up.
I’ll move on now that that has been conslained.
Are these terms copyrighted or public domain? I could swear I saw one of those in a Mann paper and I don’t wish to be sued for using it.
Supposed to be uniformly pretty cold in the depths of the oceans.
But the Earth’s mantle is quite toasty. Hey, I’m sure they increased their estimate of the temperature recently.
Then there are all the submerged volcanoes, sea vents and such like.
What happens if an Argo float drifts near a plume from them?
Will it vary temperature by a few hundredths of a degree, maybe?
Well that is an interesting question. If the Argo gets caught in the flows from a vent – and this is expected behavior – then they will read too high.
That would be a systematic error…..
The tendency will be for the Argo to center on the plume.
http://www.aeronautics.nasa.gov/pdf/bernoulli_principle_k-4.pdf
Line 5: “measurements of time and salinity” should be “measurements of temp and salinity”, no?
Awe, you have spoiled my fun, I was going to mention that.
Well, all is not lost, I’m going to mention that I worked on (during the design and construction of) underwater Remotely Operated Vehicles (ROVs) that can reach depths of 6,000 meters. I mentioned only 3,000 recently elsewhere on this blog.
http://www.ise.bc.ca/rov.html
Thanks, biff, fixed. My theory is, perfect is good enough …
w.
I think this is generally correct.
The amount of energy that the Earth is accumulating is just a small number.
1.61 X 10^22 joules per year = 1.0 Watt/m2/year across the whole Earth surface.
1.13 X 10^22 joules per year = 1.0 Watt/m2/year over the ocean surface only.
The Sun provides us with 386.4 X 10^22 joules per year. The Earth is emitting back to space anywhere from the same 386.4 10^22 joules per year (Ceres) or something as low as 385.8 joules per year (Argo and other estimates) .
Put those numbers to memory for any future commenting on this topic.
Ceres says there has been no change in the net balance of energy since it was put into orbit. The Argo floats have 0.6 Watts/m2/year accumulating. Sometimes the Ceres operators will say the combined Argo/Ceres data indicates 0.5 or 0.6 W/m2/year is accumulating. (Actually, I think Ceres is missing 5.0 W/m2/year in its numbers somewhere so they use the Argo float data as the base double-check).
Big deal. The oceans warm by 0.3C in 100 years. Nothing happens to the atmosphere temperatures, that is what the numbers say.
The earliest estimates of ocean heat content accumulation in the theory were about 1.4 W/m2/year. If we are getting just 0.5 or 0.6 W/m2/year showing up, then there is a problem.
In addition, where is the GHG forcing showing up then. The IPCC has 2.3 W/m2/year of human-induced forcing and there should be another 1.7 W/m2/year showing up from the feedbacks.
But these numbers are not showing up in the temperatures recorded (the actual ones that is), it is not showing up in the Argo measurements, it is not showing up in the Ceres measurements.
Nor is there any hotspot. The AGW conjecture is comprehensively busted by observations along almost every conceivable metric.
Quinn, your above on hemispheric averages was priceless.
And your equatorial troposphere hot spot comment is more than just very good. See Dr. Christy’s APU testimony earlier this year. Recounted in essay Humidity is still Wet, along with underlying physical explanations hypothesized by Lindzen and experimentally shown by Willis Eschenbach elsewhere.
You get out and about more than you avere. Must be that melting Arctic ice thingy… Regards, and hope you enjoy the rest of Blowing Smoke including essay Northwest Passage.
Thanks, Bill. As I said, the CERES data is quite precise but not all that accurate. The raw data shows an ongoing imbalance of about 5 W/m2. As a result, the idiots keeping the numbers “adjusted” the data to give an ongoing imbalance of 0.85 W/m2.
Why 0.85 W/m2? For one of the dumbest reasons you can imagine … because
Michael MannJames Hansen said so in his infamous “smoking gun” paper. I reviewed that nonsense back in the day, hang on … OK, it’s here, a post at ClimateAudit.So you need to be a bit cautious using CERES data, because while we can say that there has been no change in the trend over the period … we can’t say what the trend is over the period.
w.
This is too common in scientific competition. People try to make they results fit to authority’s results in case they are too imprecise and thus not sexy enough. Argo people might be suffering the same disease. It is sad because good findings are findings that are unexpected, not what the guru expected.
Precise but not accurate — oh dear, my old mum can do better than that.
“Big deal. The oceans warm by 0.3C in 100 years. Nothing happens to the atmosphere temperatures, that is what the numbers say. ”
================================================
I think this only incudes about 1/2 the total ocean volume, so perhaps .15 C per century, with a whole bunch of assumptions.
No there shoudn’t. I think you’re getting confused.
Hang on, is it n x 10^22 J/year or per decade?
I suspect there is some sort of flakyness with the joules part.
The fact that you can’t measure joules directly is an instant clue.
Now since they have a temperature and a salinity profile versus depth they know the density profile so the joules number is calculatable. I think what they have given you for data is some sort of average.
Having been in the precision temperature measurement business for 30 years I automatically get very suspicious of any temperature accuracy claim better than + or – 0.5 deg C. Averages can be calculated to fantastic precision, but the accuracy is always the accuracy of your worst sensor. Been there done that have my FDA scars to prove it.
As usual, people who actually work in the world of precision temperature measurements like you say something like “I can’t measure a cubic metre water bath to a hundredth of a degree without a fistful of constantly measuring thermocouples … 3,500 float for the whole ocean? Fugeddaboutit!”
And I can only agree with you …
w.
@Steve in SC Well said Sir!
C’mon Steve get with the ensemble.
So you also think the Argo boys and buoys might be blowing a little smoke in their FAQ here
http://www.argo.ucsd.edu/FAQ.html
* How accurate is the Argo data?
The temperatures in the Argo profiles are accurate to ± 0.002°C and pressures are accurate to ± 2.4dbar. For salinity,there are two answers. The data delivered in real time are sometimes affected by sensor drift. For many floats this drift is small, and the uncorrected salinities are accurate to ± .01 psu.
From the Argo NKE manual:
6.3.4 Temperature Coding
Depending upon the value of the first bit, it is followed by either 10 or 15 data bits. If the difference between the current temperature measurement and the previous temperature measurement (Tn – Tn-1) is included in the closed interval[-0.512C, +0.511C], the difference (Tn– Tn-1) is coded into 10 bits two’s-complement.
Otherwise the measurement is absolutely coded in 15 bits with an offset of – 2 °C. The temperature is reported in the range -2C to + 30.767C, with a resolution of 0.001C
The Argo floats accuracy is described as: “The temperatures in the Argo profiles are accurate to ± 0.002°C and pressures are accurate to ± 2.4dbar. ” 2.4dbar is about 2.5 meters. So in areas where the temperature gradient is more than 0.002°C/2.5m, or 0.8°C/1000m, the errors in depth swamp the errors in temperature. The tropical ocean has a difference between surface water and 1000m water of about 20°C or more, which makes the temperature error due to depth error 25 times greater than the temperature error itself, or +/- 0.05°C.
Refs:
1) http://www.argo.ucsd.edu/Data_FAQ.html#accurate
2) http://upload.wikimedia.org/wikipedia/commons/e/e7/Temperaturunterschiede_Ozeane.png
Actually, the temperature accuracy is 0.005 degC by design. The 0.002 degC accuracy is an observation of a few of the probes that needed to be recovered and were recalibrated.
http://www.terrapub.co.jp/journals/JO/pdf/6002/60020253.pdf
I’m not sure that your methodology is correct, but if it is your error would be 2.5 times bigger at +/- 0.125 degC.
I believe the Apex floats use the Sea Bird temperature modules with a sensor system that has a tolerance of +/-0.01°C in the range above 1.6 °C or so. How can they get 0.005°C accuracy from that?
Not so, Spoon. If the temperature error is determined by the depth error in the presence of a temperature gradient, then whether the temperature sensor is accurate to +/- 0.002 or +/- 0.005 ceases to matter because a temperature gradient of 20°C per 1000m (or 0.02°C/m), and a depth error of +/-2.5m yields a temperature-at-depth error of +/-0.05°C even for a perfect temperature sensor, or for any sensor with an accuracy significantly better than +/-0.05°C.
UnfrozenCavemanMD, I agree that my huge error is not correct. On the other hand, without more information on the hydrostatic pressure measurement gauge we need to be careful. I see your link that states the accuracy and agree with your conversion from pressure accuracy to depth accuracy. The +/- 2.5 meters is an absolute error, not a cumulative one. The gauge will report a depth within 2.5 meters of where it actually is, but it will be a constant offset. Instead of 2000 m it will be 2001.25m +/1 1.25m. I don’t actually see that this makes the ARGO data useless.
The lower half of the ocean volume the Argo floats do not measure must be doing something on decadal scales. The AMOC anyone??? 1/100th of degree C is a lot of heat for the immense volume, but measuring as temperature delta it is like trying to measure a weak signal… and the Argo designers don’t even try.
All of the abyssal water is very close to 4C, which is the maximum density of seawater and why that is what is found on ocean bottoms. But that is neither steady state nor uniform due to the global thermohaline circulation. At temperatures around 4C, salinity affects seawater density more than temperature does. The deep global thermohaline circulation is powered by seasonal polar ice formation. Salinity increases as brine is exuded from freshly formed sea ice, causing that polar water to sink, in turn drawing surface water poleward as ice forms. This seasonal process is a major poleward ‘surface’ heat transport mechanism.That process ‘stops’ as seasonal sea ice melts. There are few if any reliable measurements of all this.
One possibility for the ‘increasing’ Southern ocean ARGO ‘heat’ Willis notes is simply the observed increase in seasonal Antarctic sea ice ober the ARGO era Similar but converse for ARGO Arctic ‘heat’. Less ice, less sinking cold water, less warmer water drawn from lower latitudes… Of course that reasoning does not explain why the polar ice variations over the ARGO era…
All ‘settled science’.
A friend of mine cleverly joined the Navy during Viet Nam and spent his tour of duty on submarine warfare. His job was to look for acoustic channels where the boomers could hide. These are undersea currents of temperature and salinity different from the surrounding ocean that reflect sonar so that a sub traveling the channel is hidden from an enemy sub. It turns out the oceans are full of these currents. It would be an interesting exercise to figure out what effect these channels have on the energy budget of the iceans.
The US Navy has a vast amount of temp and salinity data from the oceans top 1,500 feet or so, going back to the 50’s…. but it is all classified, since the geoposition data would elucidate patrol and SLBM cruise areas as well as typical diving/operating depths.
As I recall, calculations correlating rate of sea level rise with total sea volume indicate that if temps. at the depths Argo is sampling are rising as their measurements indicate, temperatures at depths beyond Argo’s reach must be cooling. It would seem to be either that or the Argo results are in error.
It would seem to me, that that we should respect the Argo data as data, as look to the unmeasured lower half of ocean volume for more answers to our perplexitude.
Willis:
I do not know if I am going to throw something in the “perplexitude” that will illuminate the problem/issue/difference; or if it will only compound the problem.
You are looking at the difference in energy measured down south between 20 south and 60 south latitude, right? Over a period of years between 2002 and 2014, right?
OK. Ignore the north arctic sea ice right now – it varies between 70 north and 80 north each year over a very limited area locked in by land, and reflects (or allows to be absorbed) very little sunlight in the total scheme of things. And, it is NOT measured by the ARGO buoys available anyway, since they do not float up through the Bering Strait, through the Arctic ocean then out the Denmark Strait or outboard of Greenland where the Arctic sea ice is concentrated.
But.
The Antarctic sea ice does cycle from a yearly low in mid-February of about 2.0 Mkm^2 up to a yearly maximum of 13.4 to 14.0 Mkm^2 in mid-September. Unlike the arctic sea ice, the Antarctic sea ice cycle AROUND the 14.0 Mkm^2 of Antarctica and its 1.5 Mkm^2 fixed ice shelves. Thus, all of the Antarctic sea ice cycles between 67.5 south (at minimum) and 58 – 59 south latitude at maximum.
Relevant? Well, the Antarctic sea ice anomaly was slowly but steadily increasing since 1992 – 2011. Then in very early 2011, the Antarctic sea ice began expanding very rapidly: gaining in June this year an excess of over 2.06 million sq kilometers (Mkm^2).
Is this Antarctic sea ice gain important? Well, 2.06 Mkm^2 is just about the same area as the entire area of Greenland (2.16 Mkm^2).
The entire area of Greenland was “added” to the “regular” sea ice right at the 58-59-60 south latitude of the southern seas. Sure, that record-setting “new” ice area equal to the size of Greenland was present for only a few weeks this early summer, and we have gone back down to a more “normal” Antarctic sea ice anomaly of “only” 1.0 Mkm^2 (today was 0.726 Mkm^2 for example): but the anomaly has been steadily and near continuously GREATER than 1.0 Mkm^2 for three years now.
if Trenberth’s “ice reflects energy, open water absorbs energy” theory is correct (and it fails for most months in the Arctic at latitude 75-80 north!), then the heat is not here anymore.
Half of Greenland has now appeared down south between latitude 67 south and 58 south every day from Jan 2011 through Dec 2014 – shows no sign of abating nor moderating, and is still increasing. The missing heat been reflected it out to space – if NASA-GISS/Hansen-Trenberth-Serezee are right, correct?
But – What happened to temperature during this period? Is their precious “arctic amplification” theory proved even more dead wrong, since we have now “run an experiment” on the earth and … the opposite happened of what theory predicted?
– Ice area increased dramatically near the southern ocean over the three year period 2001/01 – 2014/12.
– ARGO Ocean temperatures in the southern ocean around that new ice area increased in the same years the ice area was increasing most rapidly. The other ocean ARGO tempertures went down by a little in that same time.
– Average land temperatures across the entire Antarctic continent between the new ice area and the southern ocean has been very slowly, but equally very steadily going down the entire period of 1996 through 2014.
Willis,
The Antarctic sea ice has averaged larger the last several years, and even though it mostly melts their summer, the year round average is larger than previous years. the energy of fusion for the larger sea ice average may be at least part of the answer.
Ice is lunch money in the energy budget. Enthalpy of fusion I much lower than vaporization to begin with and the volumes of seasonal ice compared with the total ocean are trivial. Even the total estimated total ice loss from 1976 until before the recent resurgence is insignificant.
OK a minor point, but it never ceases to amaze me how scientists can so easily mangle a simple system. Why not use 6 ZJ instead of 0.6 x 10^22 J? The SI system of units caters for very large and very small quantities. The zettajoule (ZJ) is 10^21 joules.
Thankfully, they’re using joules as the unit of energy. See Richard Feynman’s humorous comments on scientists and units: http://youtu.be/roX2NXDUTsM
Willis. I stopped reading at your conversion from heat to temperature. At the trivially small changes we are discussing here, you need to factor pressure, salinity, time and any number of other critical bits. If the ARGO program is to have any credibility, then show us the numbers. The raw data. If that isn’t available, then the rest is just speculation. Mining promoters selling moose pasture can’t get away with this kind of crap.
Just to be clear. The ARGO data is crap, not Willis’ interpretation.
Thanks, John. Actually, if you run the numbers you’ll find that the differences are quite small. For example, at atmospheric pressure, over the normal range of ocean salinity AND the temperature range of 0°-20°C, the density varies by about ± half a percent.
And for pressure, from 0 dbar to 2000 dbar (0-2000 metres), the variation in density is about ± 0.4%. More info here.
So while you are right about needing to take temperature, pressure, and salinity into account for the conversion … taken all together, for the range of values found in the ocean, we’re talking a variation of MAYBE ± 1%.
What I’ve done is taken a middle value between the highest and the lowest combination of conditions found in the ocean. This will give me something quite close to the average values over the range found in the ocean. As a result, my answer will be well within ± 1%, because we’re looking at oceanic averages.
So while you are correct, there’s no need to stop reading—it’s a difference that makes no difference for an analysis such as I’m doing here.
Regards,
w.
Willis: I appreciate your reply. The ARGO site claims a stupendous accuracy for temperature. Just for reference, the best you can be assured of from a thermocouple is 0.5 kelvin. The accuracy for temperature claimed by the supplier of the ARGO floats is far greater than .5% at about 250 kelvin, .5% is more than 1. Kelvin. The ARGO supplier claims (might be off a bit here) 0.01 kelvin. At those levels of precision, when measuring temperature you need to consider salinity and pressure among other things.
@John Eggert
I am bit mystified by your numbers there. I use a common lab instrument for collecting temperatures, a multiplexer – the Agilent 34972A with a thermocouple module. It can read thermocouples to 6.5 digits though it is dependent on the type of thermocouple to get that degree of precision. There are 2 wire and 4 wire thermocouples, palladium, gallium blah, blah. Getting 0.001 degrees precision is not a big issue. Getting accuracy (by calibration and linearization) is not a big issue. That is why those components were chosen.
The accuracy of the calculated ocean heat content is (as described above by others) dependent on getting a known depth because they have to integrate the temperature across a volume. The temperature profile is nothing like linear with depth – the big changes are compressed toward the surface. This leads to an important observation: if the vertical error margin is the same for all depths (no one said it was) then the heat content error is much greater than that proposed above if the temperature change with depth is mostly near the surface and not linear with depth.
The point is to calculate a volume of water integrated with its vertical temperature profile to get a total heat content. If the depth is off by 0.1m or 1.0m there is a smaller or larger error in the calculated total heat content, right? Well if that measurement zone is a vertical distance and the depth error is fixed, then for any given delta T (top to bottom) the error is larger if the zone is thinner because the probe has ‘less idea’ where it is vertically as a percentage of the total depth of the zone in which the temperature is changing. As a result of being ‘thin, there is a % larger error in the calculated heat content, agreed?
So the temperature precision x accuracy data is pretty good, but the depth precision x accuracy x temperature precision x accuracy combined is not as good as calculated above. Half of the temperature change takes place over much less than 1/2 the vertical field being measured. The net effect of the depth error is therefore more than twice ‘what it appears to be’ when the temperature change is constant with depth. We can’t tell what the actual resolution of the system is (and therefore ocean heat content) without knowing the temperature profile first. In the deeps where the change ins tiny, the calculated results is probably pretty good. But in the upper ocean is where the change is claimed to be, and that is where the total error is highest. Hmmm…
For this reason the error in the OHC calculation may be larger than the claimed gain or loss. Oops. We don’t know which, because we have been presented here with less information than is required to make the calculation. The sources of ARGO data are hiding the true error by giving us the precision and accuracy of the individual components of the system, not the system itself in the context of the temperature profile.
I would be happy if someone were to show that this last statement is incorrect. I would be much more comfortable with the claims of changes in OHC.
Crispin in Waterloo
December 8, 2014 at 6:25 am
@John Eggert
I am bit mystified by your numbers there. I use a common lab instrument for collecting temperatures, a multiplexer – the Agilent 34972A with a thermocouple module. It can read thermocouples to 6.5 digits though it is dependent on the type of thermocouple to get that degree of precision. There are 2 wire and 4 wire thermocouples, palladium, gallium blah, blah. Getting 0.001 degrees precision is not a big issue. Getting accuracy (by calibration and linearization) is not a big issue. That is why those components were chosen.
2-wire and 4-wire thermocouples Crispin? I think you are perhaps mixing up thermocouples and RTDs? If you are talking about thermcouples then the 34972A accuracy is 1degC for type J (see http://cp.literature.agilent.com/litweb/pdf/5965-5290EN.pdf page 16). Page 15 then gives a typical TC accuracy calculation (Example 3) which includes TC probe error and total accuracy of 2.1degC. Certainly PRTDs are more accurate and stable than TCs. But AFAIK the ARGO units use thermistors. Finally, just because an instrument has 6.5 digits of resolution (or even 8.5) does not mean that it is accurate. Certainly the higher resolution a DMM has the better it’s accuracy spec tends to be. But they are not the same thing. In our lab we have an 8.5 digit DMM. If I measure 10V with it the reading might read 10.000;000;0, i.e down to 0.1uV resolution. However, at 10V it’s accuracy spec at 23degC +/-5deg is 80uV.
SteveP
Thank you for taking the trouble to check out the Agilent. We use them in several labs – wonderful instrument.
Convenient Data Logging Features
• Direct measurement of thermocouples, RTDs, thermistors, DC voltage, AC voltage, resistance, DC current, AC current, frequency, and period. So that is the control unit.
The board inserted that actually reads the thermocouples is a 34901and it can handle 2 and 4 wire sensors.
Resolution for a thermistor is 0.08 over 230 degrees = 1/2875 of full scale.
Resolution RTD is 0.06 degrees over 800 degrees = 1/13,333 or 0.000075 of full scale. See the footnotes – it requires an external reference to that precision and that is 6.5 digits.
http://www.farnell.com/datasheets/1851621.pdf page 16
E-type thermocouples have a sensitivity of 60 microvolts/degree C at room temperature. There is a lovely picture of the errors after calibration caused mostly by rounding to the nearest microvolt at
http://www.mosaic-industries.com/embedded-systems/microcontroller-projects/temperature-measurement/thermocouple/type-e-calibration-table showing an error of less than ±0.01 C.
>I think you are perhaps mixing up thermocouples and RTDs?
We call it the thermocouple unit as does Agilent. It reads both.
>But AFAIK the ARGO units use thermistors.
I believe they do and it is possible to do so with 0.01. I am thankful that I don’t have to work at that level. I only need 0.1. It seems the ordinary units using platinum resistance sensors are 0.01 with an accuracy of 0.04 or 0.05 depending on who is reading it. The Agilent is better than the Omega IMV.
>If I measure 10V with it the reading might read 10.000;000;0, i.e down to 0.1uV resolution. However, at 10V it’s accuracy spec at 23degC +/-5deg is 80uV.
I did not find the exact equivalent in the manual for the 34972A/34902 in the time I had.
Crispin in Waterloo
Hi Crispin
Thanks for all the info re the Agilent meter.
That is an interesting link to the Type E Thermocouple Calibration, thanks for that. Please feel free to correct me on this but as far as I can see this mathematical method is used to reduce the error introduced when converting from voltage to temperature using the standard high-order polynomials? However, it doesn’t address how accurate the voltage measurement actually is, how accurately the cold-junction temperature is known and what errors are introduced by the actual thermocouple and cable. I would argue that if my measurement uncertainty is say 1degC then it makes little difference whether my V-T error is 0.1degC or 0.01degC. But maybe I am wrong about this?
Hi Willis,
ARGO bothers me, too. It is clearly a mistake to think that the 0.02 is at all uniformly distributed, as the water under 800 meters or so is all within a degree or so of 4 K independent of depth. Nearly all of it must arise from integrated/averaged variations in the top 100 meters, in fact, since that is where the ocean exchanges nearly all of its energy. Or rather, if Argo shows something else I’d be deeply, deeply suspicious. And there one is trying to resolve a tiny effect by subtracting/integrating a function that varies over a large range (but almost entirely cancels) which is an open invitation to rounding errors, truncation errors, mere computational errors, and worse. Even a tiny asymmetry in the electrical responses of your measurement apparatus can create entirely spurious, quite possibly biased, changes.
But my bigger issue is with the fact that the buoys are free floating and not randomly distributed. By their nature, they are caught up in the major currents and eddies that define the flow of the subsurface waters of the ocean. If they all hover at a fixed depth, especially the SAME fixed depth (1000 m), they are all transported in this layer, and then sample the waters both above and below wherever they end up around a week later.
Let us count the possible sources of systematic biases in such a sampling scheme. No, there are too many. Let’s sum up. It is highly implausible that there is no systematic bias in such a scheme. All it takes is for the bulk of the buoys that measure temperature to be driven at depth towards a region where the ocean is upwelling to create an entirely artificial bias. Ocean currents at any depth are not random. They are driven by heat/temperature and salinity variations.
Randomness is the sampler’s friend. Trusting that a heat driven process has no thermal bias is in contrast silly. Presuming that 4000 buoys can provide accurate temperatures to depth sufficient to resolve 0.02 C of warming a layer 2 km thick times 70% of the Earth’s area, where many times that many thermometers contributing to HadCRUT4 cannot resolve temperatures on the overall surface itself only to any better than 0.1 C is dubious at best.
They would do far better if they a) selected 4000 locations in the oceans randomly; b) fixed the buoys to those specific spots; c) measured temperatures at those spots for (say) a decade; d) moved the buoys to new, randomly selected locations; e) iterated forever. In fact, they could iterate this forever and just move them round robin style to random locations within a uniformly distributed set of domains that cover the ocean, this year shifting all the buoys in some million square kilometer chunk of ocean, next year in another. At least that way they could make definite statements about what’s going on at each fixed location, if not over a year perhaps over a decade.
A further advantage of this is that it MIGHT — with enough sites — give one some insight into heat transport at many depths.
In general, I like ARGO. I think it is a clever, ambitious project, and that in time it will give us really useful state data concerning the oceans. But it is very difficult to see how to divorce its claims (so far) with plain old SST measurements. Does anyone assert that SSTs are known to within 0.02C? HadCRUT4 claims errors around 0.1C, and I have a hard time believing that. That ARGO can resolve trends of 0.002C/year, or around 0.03 or 0.04 C total in the entire timespan that ARGO has existed at all, seems highly implausible. Your comparison of the apparently nonexistent radiation imbalance that is supposed to be producing the warming and the supposed warming resulting from this radiation only emphasizes this point. That the warming is almost entirely localized in a single band of the ocean is, at least, something that requires some pretty serious explanation.
rgb
Could not agree more.
ARGO floats need to be moored either to cover specific equal areas or distributed randomly, but fixed. Their sample is almost useless, worse than relying on random ships sampling the temperature of the water in their engine intakes.
You are right, but it is not so easy to get geostationary buoys. Like weather balloons they go with the flow and the alternatives are corrective thrusters or anchor cables; neither practical.
As usual … what rgb said.
+10
w.
This comment makes a lot of sense.The total heat capacity of the world ocean is not relevant to the process of heat sequestration in the oceans.
This is because Newton’s law of cooling also applies to heating. The temperature gradient from the sea surface to deeper levels is negative exponential, both from theory and observations. This claim is consistent with the figure Roy Spencer derived from his physical model, in turn derived from an IPCC graphic with a different parameter value.
URL: http://www.drroyspencer.com/2011/06/
I said the same thing up thread before I got to this.
It is K-4 grade science according to NASA: http://www.aeronautics.nasa.gov/pdf/bernoulli_principle_k-4.pdf
as the water under 800 meters or so is all within a degree or so of 4 K independent of depth
OOPS. 4K or 4°C
“But my bigger issue is with the fact that the buoys are free floating and not randomly distributed. By their nature, they are caught up in the major currents and eddies that define the flow of the subsurface waters of the ocean. If they all hover at a fixed depth, especially the SAME fixed depth (1000 m), they are all transported in this layer, and then sample the waters both above and below wherever they end up around a week later”
///////////////////////
For years, on almost every ARGO post, I have commented upon the problem that ariises because the ARGO Buoys are free floating. They float on currents or get swept along by currents, which are currents are themselves temperature related.
There has been no attempt to assess what bias is caused by the fact that the Buoys are free floating. In my opinion, it is almost inevitable that some bias will result. Whether that will be a warming bias is moot, but is something that needs to be assessed.
If a wx-station on land is moved just by some hundred yards(or just gets a different painting), this is quite rightfully criticised because of the inconsistency and incomparability of the data. Here we have buoys that merrily floats around the world, giving a reading every now and then. But the data thus produced never ever come from the same point where they have been before or where the Argo has been put to sea first. So these data seem to me simply not worth a tinkers cuss. Furthermore, each Argo covers more than 180.000 cubic kilometres of water, roughly an area of 425 by 425 kilometers, 1 km high. Do we look out of the window at Norfolk, Va to tell how the temperature in Boston, Mass. is? And, if I got it right, there are more Argos in the northern than in the southern hemisphere. All of this is a little bit too dubious to me to be taken too seriously.
Yes, I, and may others have noted this often as well. But a warning. Climate scientists love to crunch numbers to confuse. They could easily use this for another adjustment in their direction, so be carful what you wish for.
Logically however the mean latitude of the floats is of course relevant. Brandon answered some of these questions beginning here, including the one Willis mentions about error bars.
http://wattsupwiththat.com/2014/11/30/the-tempering-effect-of-the-oceans-on-global-warming/#comment-1803131
About four or five comments in succession, with graphs on current float locations, and surface ocean currents.
It’s not every one who can work a Princess Bride allusion into oceanographic data analysis! Ya made my evening, sir.
Note figure 2.
This shows that about 3/4 (per eyeball) of the warming for the 20S-60S ocean occurred during 2010. This is funny business.
It does not seem natural.
Recently several participants in the climatology blogs have suggested that the oceans are warming. How, they have subsequently asked, can we not be facing catastrophic anthropogenic global warming if the oceans are warming?
Willis’s work places their argument in perspective. The oceans are warming at a rate which, if continued for one thousand years, would result in a warming of 2 Celsius. In one thousand years, though, the increment in the atmospheric CO2 concentration that had purportedly caused this warming would have long since dissolved into the waters of Earth’s oceans. This argument features an effect that is without a cause.
Pardon my ignorance, but just how did the ARGO folks measure heat content in units of joules? It wasn’t clear, or I read too fast.
Joules would represent the biggest scariest numbers possible, while thousandths of a degree in temperature would not be alarming enough.
Peter Sable December 4, 2014 at 9:31 pm
Peter, the only ignorant question is the one you don’t ask …
They don’t measure joules. They measure temperature and convert it to joules.
w.
Willis, VERY interesting topic thank you. Have you had a chance to read the article mentioned above by Steve Case? http://earthobservatory.nasa.gov/Features/OceanCooling/ It begs the question- is your data the corrected or uncorrected version for the argo floats? Thanks again for your amazing analysis!
rgbatduke December 4, 2014 at 9:07 pm
Thanks, Dr. Robert. My “~20 W/m2” is actually about 22 W/m2, which represents the ~ 91 W/m2 you get, averaged over the entire surface. CERES puts the actual value at 22.23 W/m2. Note that these CERES numbers are monthly averages, so the swing would actually be slightly larger. Since 91/4 is 22.75, I’d say we agree.
Sorry for the confusion,
w.
The referenced Argo graph separated by latitude only isolates southern hemisphere oceans between 60 to 20 degrees as the source of all ocean warming. Bob Tisdale shows that surface warming is further constrained by longitude to the Indian and South Atlantic oceans, and further yet constrained to north of the Southern Ocean which is also cooling along with the south Pacific…weird stuff. Hard to reconcile with short wave solar warming. Harder yet to reconcile with “eating” atmospheric heat, which is impossible for several reasons.
“Remember they claim they can measure the monthly average temperature of 0.65 BILLION cubic kilometres of ocean water to a precision of one hundredth of a degree Celsius … which seems very doubtful to me.”
How many Argos are there in the oceans to take measures in a swimmingpool of that size? Common sense says that there are far too few. And common sense tells me that, when raw data AND error bars are unavailable. the process of homogenisation, pasteurisation, adaptation, amalgamation and sterilisation is nothing but a gigantic hoax, or, better, a deception.
Non Nomen December 4, 2014 at 11:07 pm Edit
True dat.
No, that’s a bridge too far. The raw data is assuredly available, something like a million temperature profiles, and from this anyone can calculate the error bars … I just haven’t had the time to go through and do it all. Which is why I was happy to find the graph above, so I didn’t have to do that.
w.
Where is the raw data? Got a link?
The climate scientists can measure/adjust land temperatures to within 0.1C from 300 miles away with no problems.
Very nice article with good info.
To counter our public forum in Oz (the Drum) in future discussions, where that obscure joule ocean heat content of 10^22 is mentioned, I intend to counter with a comment that it really means that the number of joules is less than the number of molecules in two spoonfuls of water (tongue in cheek but I will say it all the same!).
On the error level I think David Evans made a good point in an article where it is inappropriate to reduce the error by the root of the number of sample means. His reasoning was that each buoy is not sampling the same population. There are variations in the ocean and, as you have shown, actual physical differences in warming rates such that the error could not be reduced in a statistical manner.
In saying that, I do recall years ago playing with “Stein’s paradox” where all sorts of averages could be thrown into an average to improve the forecasts.
Perhaps it shrinks the error somewhat but not by the full sq root of N.
I believe also that to use that square root of N, one must first fully ascertain whether or not the population measured was “normal” in the first place. Statistics is a good deal more complex than I see applied in some of these assumptions. The “Law of Large Numbers” is another of those fallacies that only work if the underlying distribution is normal. Most of what I have seen is hand waving about normal, but not testing for it.
I have two concerns regarding the heat content of oceans.
1. Do we have data on variation of temperature over even relatively short distances in the ocean? My experience has been that it is very difficult to determine the average temperature of even a gallon of water unless it is well mixed. Consider the lengths that equipment suppliers have to go to with calibration baths.
2. Is the thermal lapse rate of the water considered? What is the change in temperature of a quantity of water rising adiabatically from 2000 meters to the surface? Does this mean that a volume of water moving with a vertical component can have a change in temperature of several hundredths of a degree Celsius in a matter of hours without any change in internal energy? Do the floats have any method of determining the vertical velocity of the water they are measuring?
Vertically or horizontally? Fairly easy to sample vertically e.g through the thermocline, anywhere you wish. ‘Easy’ to sample horizontally some area of the surface- just run an ocean research vessel around on some grid, like looking for MH17.
Very hard to do both at any reasonable grid resolution. Ocean is really big. Hence Argo as a ‘next best’ compromise, with sampling warts described upthread.
Haven’t found much about ocean thermal lapse rate. Unlike the warmer surface into the cooler atmosphere (giving rise to both convection cells and the atmospheric lapse rate)’ oceans are coldest at the bottom and warmest at the top. Convection cells per se are rare. There are density gradients such as cause thermohaline circulation. The usual ocean stratification is euphotic zone (light penetration, photosynthesis, maybe 100 meters), mixed layer (wave mixed gasses and temperatures, maybe 300 meters), thermocline (sharp temp fall off below, varies by latitude, maybe 700 meters), everything else. Hope that helps a bit.
The fact that the Southern Oceans are warmer may be related to the recently notes thickening of the Antarctica Sea Ice. If the were melting in a more normal way there would be more very cold and dense brine water falling to the sea beds and the following the usual flow channels to the north. Less melt, means less cold water flowing north. When I was reading this post I remembered seeing a tv show about how the Antarctica ice melt works. So I thought, maybe that is what explains what the observed data shows,
Tom, I would think the opposite, Bottom water is formed by the ice, which melts every year, so more SH winter ice, means more melt in the SH summer, means more bottom water forming.
The SH sst’s, have actually cooled. The Southern ocean Argo floats are actually quiet sparse relative to the NH, They are especially sparse the closer one gets to Antarctica??? See maps of Argo floats and map of surface ocean currents here. (see the first five or so comments below)
http://wattsupwiththat.com/2014/11/30/the-tempering-effect-of-the-oceans-on-global-warming/#comment-1803131
Hmm, I always thought the bottom water was formed by the freezing of the water every year…as the ice forms it force salt out of the crystals and the cold, salty water left behind sinks to the bottom due to being denser due to the salt concentration.
The water that is in the ice should actually float when it melts due to being relatively fresh while being at about the same temperature, thus less dense.
Owen, thank you, you are correct, yet my direction is cogent , although poorly spoken. More ice forming means more bottom water, and it repeats every year of course with the minimum variable being far less then the maximum,
In summary cooler ocean surface water leads to more ice, and SSTs are a matter of record, so all the hoopla about why is there more ice is fairly easy to understand, also leads to more bottom water.
You found that the ocean is warming in some areas and cooling in others. If the argo floats are drifting in a non random way and we are averaging their data, it seems like that alone could throw the numbers off by much more than total change in temperature (heat content). if 4 floats out of 3500 drifted to the extratropical south from the rest of the ocean (or many shifting overall a small bit that direction) wouldn’t that easily easily cause the total change in temp or heat content measured? This seems too simple so maybe I am missing something.
“tropics and the northern hemisphere are actually cooling”
Not after they have been homogenised they won’t.
Perhaps time to take a look at longer timescales.
From this article http://onlinelibrary.wiley.com/doi/10.1029/2011JC007255/abstract
comes this graph: http://onlinelibrary.wiley.com/store/10.1029/2011JC007255/asset/supinfo/jgrc12191-sup-0010-fs09.pdf?v=1&s=79e93e124ca1fd8a33753fc667ff17deaa20b3e6
It shows a reconstruction for the DEEP ocean temperatures over the last 108 million years.
Even considering the error bars, the deep oceans have a cooling trend over the last 85 million years, losing some 18K during that time. No wonder we started to have glacials/interglacials when the temperature dropped to ~ 3K above present temperatures.
1. A good measurement should be reproducible. If that is not possible then you should be able to describe how the measurement was made to enable others to understand exactly what was measured.
2. The measurement (sample) should be representative of the surroundings (population).
From what I have seen, the ARGO buoys are not adequate to support claims of warming.
Sampling is basic to science. RGB knows this. What proportion of the various depths are affected by upwelling?? Or downwelling?? The buoys fail to represent the ocean temp due to lack of spatial control.
The null hypothesis prevails here. There is no observed warming. Claims of warming are rejected.
BTW, the Ole Humlum chart for 0-2000 meter ocean heat content has a different latitude profile.
Scrol down on his Ocean page at
http://www.climate4you.com/index.htm
Considering that direct shortwave sunlight peneratrates water for a couple of meters and long wave infrared only a few microns, it’s the sun that heats the ocean, not infrared, this only contributes to more evaporation as the water molecules in the boundary layer get more agitated by IR absorption and get more energy to escape from the fluid.
So all you need is less clouds in the southern hemisphere to explain the heating pattern. I bet there must be data for that to support this.
rgbatduke : “Ocean currents at any depth are not random. They are driven by heat/temperature and salinity variations.”
I was about to make the same point, adding the Coriolis effect on surface (driven by wind) and deep ocean currents; bunching effect by the ocean gyres (e.g. the great Pacific garbage patch)
.
What do the ARGO sensors actually measure? Why is the ARGO data presented in Joules, can anyone tell me?. Isn’t it unlikely they are actually MEASURING joules in a volume, and so the data must already be a construct, and a rather complex construct, at that. And then Willis goes and converts it back into Kelvin..
Or have I got the wrong end of the stick?
But, irrespective of that, seems to me the TREND in the Argo data is the important thing for GW and the ‘heat hiding in the ocean explanation’ (or excuse – take your pick) is certainly NOT invalid, because of the vast total heat capacity of the oceans. Nor are the CERES radiation in/out measurements helpful, because a very small, perhaps unmeasurable, imbalance, over time can represent large atmospheric/oceanic effects.
I apologise for my naievity, of course. As always here, it’s great to be hearing the comments of real lateral thinkers such as Willis and rgb.
SI Units. The units of science and scientists since god knows when. Metres, Kilos, joules, etc. Look at wiki . It’s ok for that but not much else.
There are 7 fundamental SI units:
Temperature : the Kelvin (K) (formerly the degree Kelvin )
Time : second (s)
Length or distance : meter (m)
Mass ; kilogram (kg)
Quantity or amount of a substance : the mole (mol)
Unit of current : the ampere (A)
Luminous intensity : the candela (cd)
– – –
All other units of quantities are derived from these fundamental units.
– – –
These fundamental units are somewhat arbitrary. For example speed could have been chosen as a fundamental unit, then the unit of length would have been derived by the product of this speed unit and the unit of time.
In the U.S. customary system, the unit of force, the pound, is chosen as a fundamental unit instead of mass.
Well, okay. But that wasn’t quite my point. Joule is an amount of heat, Kelvin degrees are a measure of the level of heat. No? So you need to estimate other factors to make one into the other, and as the Argos are not measuring the depths, this introduces an approximation. Why don’t we stick to the temperatures themselves and look at trend vs. depth?
Mothcatcher, Argo RTDs measure resistance, which is converted to a temperature and reported. Subsequent calculations extrapolate that to an Energy value in Joules.
We don’t stick to temperatures because for the thermodynamics of climatology, only energy really matters.
A similar extrapolation was done for air temperatures, but more implicitly. The warmers didn’t want people to know that the energy level of the entire atmosphere was insignificant compared to the oceans. They preferred reporting the air temperature of hot summer days in urban jungles. They didn’t want people to know that it was a serious and fraudulent distortion because the energy responsible for that hot day in the city would raise the nearby ocean by a tiny fraction of a degree.
On Figure 4 the quantity “average depth” is something of a misnomer. What is shown is the average depth of equivolume elements, not the more usual average depth of equal surface area elements of the ocean. A recent published (Oceanography 2010) estimate of the mean depth was 3682.2 metre.
I like your posts. Not necessarily for their content, although that is usually very good, but because they provoke DEBATE and the debate roles on with NO ACRIMONY. Why can’t those assole warmist do they same ?
Maybe the descriptive term you use for them is unhelpful?
Stephen,
If you don’t mind I will re-phrase your question so as not to offend.
… why can’t those well- meaning ladies and gentlemen who are bereft of graft, devoid of greed, barren of the need for self- aggrandizement (the ones that honestly believe that a warming planet is a scary thing and that the human populace is likely responsible for the warming) contribute to a clear debate without ACRIMONY?
Possible answers (which may offend): same reason you can’t debate with a farm gnome or a forest elf … they don’t exist in the same reality as do most people. If you ever meet one let me know.
And there is over half the volume of the ocean (below 2000m) not even being measured at all ….
“My best guess is that the error bars on the Argo data are much larger than is generally believed. “
But you don’t say what is generally believed, or where it is stated. I think you are just seeing (Fig 7) the acknowledged Argo uncertainties. Your Fig 3 seems to be von Schuckman and Le Traon, who give an uncertainty of 0.1 W/m2 on the trend. My back calc on that says that if the trend was computed from monthly averages, the residuals would have a sd of about 4 ZJ (10^21). That is not too dissimilar from the fluctuations in your Fig 7. A bit on the low side, but in the review article of Abramson et al (Rev Geophysics 2013) they give a range of 0.2 to 0.4 in trends, implying greater uncertainty. Lyman and Johnson, J Clim 2013, analyze uncertainties in detail, and in Fig 5 show how sampling uncertainty has reduced over time, being about 5 ZJ in 2010. That’s just the sampling part.
Table 7, what happened at the end of 2011?
The ARGO results just stick together – they don’t at any other time in the record.
Instrument calibration changes, perhaps?
Or a question mark over the sampling in 2011?
Willis
A recent WUWT post by Bob Tisdale, i.e.
http://wattsupwiththat.com/2014/11/30/the-tempering-effect-of-the-oceans-on-global-warming/
also presented ARGO data but he reported a trend in heat content of 8.4 x 10^22 Joules per decade over the 2005-2013 period. You report a trend of 6.3 x 10^22 Joules per decade over the same period. Now it’s possible the difference is because he is covering the whole ocean whereas you are only covering 60N-60S but it seems unlikely this can explain all of the difference particularly given the pattern of heating you’ve described above.
I know a lot of people, including yourself, dismiss the small increases in ocean temperature as irrelevant but I think this misses the point. It’s clear that there are ‘ocean oscillation cycles’ (I’m not going to be any more specific than that) which have – let’s call them ‘warm’ phases and ‘cool’ phases.
During the warm phases less energy is absorbed by the ocean and more is taken up by the atmosphere and we experience “global warming” – similar to that seen between 1975 and 2005. During cool phases the oceans actually retain more solar energy while the atmosphere loses out and we experience “global cooling” – similar to that seen between 1945 and 1975. All of this does assume that factors such as cloud cover remain relatively constant but that’s not important to the main point here.
Now then, if we have an imbalance between incoming energy and outgoing energy the cycles will still carry on as before but the atmospheric cooling may be reduced (a bit like the last decade). This recent pause seems like an excellent opportunity to pin down the current imbalance (if it exists) since, apart from melting ice, it will be solely represented by OHC.
While a difference in ocean temperature trends of 0.02 deg per decade and 0.03 deg per decade may seem trivial, it will make a big difference to surface warming if the oceans start to absorb less and more energy remains in the atmosphere. [Note: This does not mean the ocean loses energy. It just means it takes up less].
Bob’s trend suggests an imbalance of 0.76 watts/m2 which is not that far off the Hansen estimate of 0.85 w/m2. Your figures suggest a lower value though the 0.4 w/m2 over the earth area seems a bit too low.
Sorry – I didn’t intend this to be so long.
John Finn
I didn’t see a response about the 8.4 v.s. 6.3 x 10^22 per decade. I consulted my calculator and it seems the heat needed from the ocean waters to melt all the glacier ice from land and snow that precipitates on the oceans is considerable.
The heat gain is not measured, it is calculated from the imbalance, right? So if it is only 6.3 x 10^21 per year, what is the heat required to melt all glacier ice and precipitation (which left the latent heat of fusion behind in the air)? Five per cent? 10 per cent? The imbalance has to cover this too.
Willis wrote: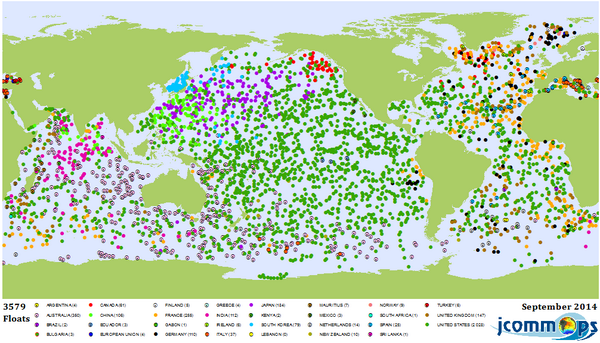 :large
“But what I didn’t know was that according to the Argo floats, every bit of the warming is happening in the southern extratropical ocean,”
As Bob Tisdale showed, in the South Atlantic and Indian Oceans. Which are the two regions with the lowest float density, particularly towards and into the Southern Ocean:
I have a question about the graphs.. How can the global rise in fig 3 be greater than the individual rise of the southern extratropical ocean show in figure 2? I know it has to be something simple, but what am I overlooking?
That is a fair point. The Fig 3 graph might be using additional, more recent data. There is a spike in Fig 3 in 2013 which is not evident in Fig 2 and which only seems to go up to the end of 2012. That could push up the trend a bit.
Willis – you could tighten the calculations by not approximating 1 month = 365.2524/12 days, i.e. use the exact days for each calendar month. It would also be interesting to know exactly how the Argo data have treated calendar effects: presumably you need to match them up.
R.
Very interesting post by Willis.
Equally interesting discussion/comments that followed.
Willis insists we always quote him exactly before commenting or especially before asking a question. So:
“As usual … what rgb said. +10 w.”
So Willis, (and Anthony) when does Dr Robert get unrestricted posting privileges on WUWT and his own archive page of pertinent prior comment?
pouncer, contrary to some people’s perceptions, I’m just a guest author here, I have nothing to do with how the site is run, how it is moderated, or the like.
However, I’m sure that any time that Dr. Brown wants to write a guest post Anthony would be more than happy to publish it …
w.
I suggest that the radiation budget between the surface and space is being moderated by the processes of evaporation/condensation in clouds, while the energy budget below the surface is literally all over the map as a function of all the different surface and sub-surface currents. Has anyone used the ARGO data to try to trace these currents? As Bob Tisdale has pointed out, the Kelvin wave rides on top of the Cromwell current.
For too long, Climate Scientists as well as [snip] have focused on average lower troposphere and land mass temperatures. Although there has been a slow but steady rise, the real answer is in the ocean temperatures. (3% of the newly created heat from Global Warming will be absorbed into the ocean and only 1% of extraneous heat will be absorbed into the land masses.
I thought global warming™ had stopped and been replaced by climate change™ or is it extreme weather™?
Willis, has anyone suggested that the big argo swings in your figure 7 ARE the error bars? The Ceres trace looks a bit like a filtered argo measurement. Eyeball stdev is ~2 zetaJ. Also, it is incorrect to use only the accuracy of the equipment to estimate error in measurement, if that is what I understand the Argo ‘boys’ to mean. Indeed, if the equipment was accurate to a hundred decimal places of temperature, the error bars of the method would be just about the same – very large.
Oops +/- 2 zeta J
2 zetta J or 0.002 yotta J
If an ARGO float is being pushed by a current of water, it is essentially held captive by the parcel of water (consider the Gulf Stream) as it moves. This means that over time a single float is resampling the same parcel of water as it moves and does some mixing and changing. It is not sampling different parts of the ocean. the sample size is much less than imagined.
Craig the water in the Tropics is always going to be consistently warm and the water towards the poles is always going to be consistently cold, basically unchanging.
It is the water temperature between the tropics and the higher latitudes that changes because the heat flow isn’t perfectly steady. This is where the warmers are going to ‘find’ the warming.
Look at the first figure. The float rides a surface current for only a short period of time. It is below the thermocline most of the time
Good point. I don’t think they’re held captive by a current. I think randomness is probably sufficient for the upper 2000 meters.
Why would you expect randomness over time. The ocean currents, both surface and deep, are not random.
Some surface current and Argo float location links a few comments down here. http://wattsupwiththat.com/2014/11/30/the-tempering-effect-of-the-oceans-on-global-warming/#comment-1803131
The currents we’re looking at would be those at about 1000 meters. Some floats will enter currents and some will exit them.
One float per 185,700 km³ of water, if you moved all 3500 floats (or 10,000 overall) into this volume the accuracy would still be highly suspect. A weekly / monthly / yearly location map of all 3500 tracks would be interesting to see.
I would guess it’s due to the short timeframe and low sampling size of the Argo buoys. They aren’t a fine enough mesh to capture short-term fluctuations (sometimes an individual buoy is in the cold part of a cell, sometimes they’re in the hot spot, sometimes they’re in an average spot). Satellite CERES measurements don’t have that undersampling problem I assume.
The Argo buoys are better suited (and intended) for long-term (annual? decadal? century?) trend monitoring than monthly, because undersampling errors tend to cancel each other out in the long term trend calculation. I’m not saying they have enough buoys to give precise decadal trends (that depends on the standard deviation of ocean temperature, you would need all the individual buoy data to analyze/interpret that, and do some out of sample analysis to see how much the number of buoys’ data changes the results).
If you did such an analysis and found out your error bars are too large due to undersampling, the only solution is to add more buoys (refining your mesh) and reanalyze until your error bars converge to the point you need it. But again the error changes on different timescales I believe. The longer the timescale, the less undersampling error. But if it takes 100 years to get meaningful decadal trend data with the number of buoys you have, it’s not giving you info fast enough and you need more buoys.
Remember that the intent of the buoys is more for accurate trend analysis over long periods of time, than for accurate absolute data at a given point in time. The error calculations for each are very different.
Willis, regarding your perplexitude, is the problem looking at two different spheres, one with the radius of the earth, the oceans, the second longer radius, the TOA or atmosphere? Off the cuff, the radius difference seems too small for that grand of an effect.
Thanks, Willis. A very interesting article, as always.
ARGO seems to me like good first try, but to really profile the temperature and salinity of the ocean, which is a moving target, it would need many more buoys. So many that they would become a mayor pollutant themselves. Headline: Small Boat Boat Sunk by Surfacing ARGO Buoy!
THANKYOU Willis! I have only suggested doing this comparison on every ARGO post for the past year!
This to me almost confirms that the ARGO data are junk; it is simply unexplainable and impossible to account for the massive fluctuations in heat content. If it were possible to add in the total heat content of the atmosphere (I don’t know if that data exists) to the ARGO data and the same unexplainable swings in total heat content were present then that would be confirmation that the data are horribly imprecise and possibly horribly inaccurate.
Keep up the good work. This is definitely worth looking into further. The AGW theory — at least the future projections based on it — is close to being proven false. If there is no “hidden heat”, then the whole thing falls apart and the agenda will be derailed, at least for a little while.
Perhaps so, Robert … but I’m still not convinced that it’s not an error somewhere in the numbers. The difference between the two still strikes me as being too large to be a real finding.
But I’ve been over the dang numbers six ways from Sunday and found nothing … perplexitude.
w.
The southern oceans point to the sun around perihelion when the TSI is maximum, so there’s extra energy to store.
The northern land areas point to the sun around aphelion when the TSI is lowest, and they get hotter so radiate more energy during the day.
Seems pretty simple to me.
Willis…you are great. I love reading your stuff!
Willis
I think there are two grave errors in this calculation. First, when you use a 24 hour sunlight model you have to divide the surface area of the Earth by four to get only the radiated surface. The dark sides do not count.
5.1 *10**14 is total surface area.
Second, when using TOA you have to take into account that not all radiation on TOA reach the surface. A considerable fraction is radiated back to space.
/Jan
Thanks, Jan.
First, all of the various flows (sunlight, reflected sunlight, etc.) are calculated on a “per square metre” basis, based on the 24/7 global averages. This means that their instantaneous values are divided by four. However, this doesn’t “get only the radiated surface”, it averages the values over both the dark and light sides.
Regarding your second point, read the definition of TOA I gave above, viz:
So you are right that you need to include reflected sunlight … but it is in fact included.
w.
You are right on both, my fault, thank you for clarifying
/Jan
Hi Willis,
I admit to being confused by the ocean heat data you presented, because I was sure I had seen OHC data (from ARGO) showing a very clear annual cycle, consistent with maximum insolation in January and minimum in July. After serarching a bit I found the following link to then now inactive Roger Piekle Sr. blog: http://pielkeclimatesci.wordpress.com/2008/05/29/new-information-from-josh-willis-on-upper-ocean-heat-content/
In that post Josh Willis shows a multi-year plot of ocean heat content with 1-sigmal error bars for the top 900 meters of the ocean, from mid 2003 to early 2008. While noisy, the plot appears to show a clear annual cycle, with a peak to trough range of ~6*10^22 joules, lagging the solar intensity cycle by a couple of months, which is not too far from the magnitude and timing of ocean heat content change we might expect from the annual cycle of solar intensity. I remember thinking when I first saw the plot that it was reasonably consistent with the annual cycle, and so no surprise.
Perhaps the cyclical pattern is more clear when the deeper ocean is not included, or perhaps there is a difference in the way you and Josh Willis treat the data.
Thanks, Steve. As I said in the head post, what is shown is the Argo data with the monthly average values subtracted out. This of course removes the annual cycle.
w.
Willis,
Somehow I missed that. Sorry. I guess then that you are just seeing the relative noise/uncertainty in the two measurement methods, and clearly the ARGO data is a lot more noisy. The benefit of Argo is that (within the uncertainty posed by noise) you get a long term look at absolute heat accumulation in the ocean and by inference, a better long term estimate of the relative contributions of ice melt and thermal expansion to sea level increase. It is also nice that the OHC appears to track (in a noisy way!) the expected annual cycle of solar intensity.
Couple of observations/questions (to nobody in particular):
a. Why are the so-called ‘scientists’ sucking the public teat, not doing these comparisons?
b. When max insolation finally becomes synchronised with the N Hem summer (as I presume it will do at some time in the future), what difference would this have on climate?
Ralph
Silver ralph: Why are the so-called ‘scientists’ sucking the public teat, not doing these comparisons?
Lots of scientists are analyzing lots of data sets and publishing lots of papers on their work. Willis writes about things that catch his fancy, as he has said (I think he used the word “sparklies”), and makes his results public here. I for one like the “creative tension” of the two approaches.
silver Ralph asks…b. When max insolation finally becomes synchronized with the N Hem summer (as I presume it will do at some time in the future), what difference would this have on climate?
========================================================================
A question I have asked many many times, and no answer so far. If procession theory is correct, then this happens every 25,000 years. However for some unknown reason precession is accelerating, indicating perhaps a 24,000 year cycle.
Despite the fact of 90 W/M-sq. additional insolation during January, the atmosphere cools (increased SW insolation into the SH oceans, thus “hidden heat” for a time from the atmosphere, plus increased albedo due to NH land and snow, thus again less energy into the atmosphere).
What long term changes would occur when the max insolation is in June is a wonderful subject to speculate on, but FEW venture here. The thing is you would think WILLIS (shout out to Willis to engage his curious mind in this direction) would be as curious as HELL to see if this 24,000 year cycle exists in the earth’s record, and if not, why not.
Thanks to Willis Eschenbach for another good analysis, and to rgbatduke for good comments.
About this:color me puzzled.
In my opinion, anybody not puzzled is not paying attention to all of the data, even before today’s presentation. As I wrote at Bob Tisdale’s post: the Earth system is a high-dimensional non-linear dissipative system, rotating with respect to the source of its input, which is varying. What’s worse, it’s round. Models to date are inaccurate, nothing obeys “common sense”. Roundness leads to the 22/90 disparity between Willis’ presentation and rgb’s. Averages relate to totals, but everything that happens does so in response to the detailed conditions at the time and place.
And to put the ! point on what was already written: because the AARGO buoys are drifting, you can’t distinguish between drift to a warmer place and in situ warming.
And the question lingers on: does anybody know what is producing those divergent trends? They would seem to be manifestations of some large intra-oceanic heat flow, or evaporation/precipitation flow, or something.
There are several different models and manufacturers of Argo floats. Has anyone checked to see if the distribution of models correlates to temperature anomalies? It seems like an obvious question, so apologies if it’s been addressed above.
Answered my own question. It’s a little old, but I don’t like the distribution.
http://i62.tinypic.com/2a69ls0.png
Sorry to be a pest, but here is the newest one.
http://i62.tinypic.com/evdu2p.png
I noticed there don’t seem to be any in the Arctic. Is that because the ice would keep them from surfacing? Maybe the ice would prevent them from being placed? Some other reason?
Just asking if anyone knows.
I don’t know about the Arctic, but during the southern winter many of the antarctic floats are listed as being trapped in ice.
http://wattsupwiththat.com/2014/12/04/argo-and-ocean-heat-content/#comment-1806560
Wouldn’t it be expected that the solar max of 2000-03 would result in an increase in SH ocean temperatures, after a thermal lag?
I’m offended by this statement. You took meaningful information and turned into meaningless information. If the basic unit of energy is unfamiliar to you, maybe you really shouldn’t be discussing a problem which has thermodynamics and energy balance at its core.
Solar Energy:
received each day = 1.5 x 10^22 J
received each year = 5.5 x 10^24 J
Energy(crust) = 7x Energy(ocean)
Energy(ocean) = 1280x Energy(atmosphere)
Energy(ocean) = 290x Energy(solar-year)
Energy(atmosphere) = 83x Energy(solar-day) = 1 – 1.5 x 10^24 Joules.
From this we can see SH Ocean (60 S – 20 S) was up about 2.6 solar-days worth of energy.
The difference could be measurement technology related, but it doesn’t seem to be arithmetic. However, it does seem to be conceptual. You conflated the change in energy in one component of the system with the change in energy in the total system. Parts of the system you neglected:
Ocean under 2000 meters
Ocean further north than 60 degrees North
Ocean further south than 60 degrees South
Crust under oceans
Land in NH
Land in SH
Atmosphere
All of these components are exchanging heat. I provided the relative energy levels to give you some perspective. The change you’re calling a “stupendous amount of energy” is actually 1/40,000 of the energy in the ocean.
In short, there is no obvious mystery. Lots of internal activity inside the party, but only a few are coming or going from the party.
Is anything measured directly? Certainly not temperature. There is nothing unbelievable about temperature instrument accuracy of .002. That’s what it is for this technology.
You are obviously familiar with ARGO hardware. I believe that temperature is encoded using 19 bits in the ARGO message, about 2 parts per million precision. Can you convince us that the believable accuracy you quote, about 40 parts per million is achieved in the sensor signal conditioning and digitization circuitry of the buoys – including such considerations as the thermal effects on the measurement of a cold-soaked buoy rising through a gradually (or not so gradually) warming environment.
https://en.wikipedia.org/wiki/Resistance_thermometer
http://www.terrapub.co.jp/journals/JO/pdf/6002/60020253.pdf
So, I think we can discard any comments about the temperature measurements not being precise enough.
You’re really going with a claim that either
A) the international collaboration of scientists screwed up the IT part and are losing precision in the data packets
OR
B) 19 bits is insufficient to store 3 decimal places, when it’s known that water temperature will be between 0 C and 35 C?
If it’s B, then you may want to learn something from: https://en.wikipedia.org/wiki/IEEE_floating_point
Even binary 16 has over 3 digits of precision, but if you take a look at Extended and extendable precision formats, you’ll see that given the temperature range between 0 and 35, 19 digits is quite enough.
This is out of an Argo users manual.
6.3.4 Temperature Coding
Depending upon the value of the first bit, it is followed by either 10 or 15 data bits. If the difference between the current temperature measurement and the previous temperature measurement (Tn – Tn-1) is included in the closed interval[-0.512C, +0.511C], the difference (Tn– Tn-1) is coded into 10 bits two’s-complement.
Otherwise the measurement is absolutely coded in 15 bits with an offset of – 2 °C. The temperature is reported in the range -2C to + 30.767C, with a resolution of 0.001C
I mentioned the precision. I asked about ‘believable accuracy’. You ignored accuracy in your reply. Can you convince us about the accuracy of the measurements? In particular, I would expect all measurements in an ascent from depth to be too cool owing to the thermal effects from a cold-soaked buoy. Furthermore, you assume a perfect signal conditioning and digitisation process. Can you convince us that this is the case?
I wasn’t claiming either A or B in your reply because you answered a question I didn’t ask. Same goes for RH; you are talking about precision, I asked about accuracy.
Why should I? The burden of proof is on you. You are the one making an extraordinary claim, which is that between 1871 (when the technology was invented) and 2014, scientists and engineers have not been able to figure out how to perform accurate temperature measurements. You are claiming that with 143 years of science and engineering behind us, only YOU can think of systematic errors that everyone else just couldn’t fathom (pun intended).
Actually, cell thermal mass corrections are applied to conductivity data and then the data is averaged into approximately 10 m depth bins for transmission. I’m satisfied with this, but what if you’re right? How would the overall temperature readings being too cool affect the variations from the average (anomolies)?
I don’t assume perfect anything, and I don’t need to convince you of anything. What does this have to do with the original article’s results, or with my comment at December 5, 2014 at 1:43 pm? My comment answers the questions raised by the posting.
VikingExplorer
In response to a question from Billy Liar which was
you have replied by saying in full
NO! ABSOLUTELY NOT! HOW DARE YOU!?
That response is insulting not only to Billy Liar but also to every observer – including me – who is interested in the nature and validity of the data.
There is no reason that anybody should take on trust any unsubstantiated assertion by an anonymous internet popup such as yourself.
YOU claim the data is reliable and Billy Liar is merely fulfilling the scientific duty of demanding that you justify your claims. He has said nothing which requires any “proof”, and the “burden of proof is on you” to justify your assertions. Your refusal to provide any attempt at justification suggests you cannot, and your irrelevant mention of “143 years of science and engineering” fails as an excuse for your failure to attempt to justify your assertions.
Richard
Actually, you got the order reversed. All I did was make a verifiable statement of FACT, which is that RTDs are capable of being accurate to within .002 C. This matches the manufacturers spec, as well as the claims from Argo. As an engineer, I used this technology for years, as a new generator design required us to instrument a prototype to verify the thermodynamic design. I made no extraordinary claim when I said:
“There is nothing unbelievable about temperature instrument accuracy of .002. That’s what it is for this technology”.
Billy Liar then started repeated the claims of many others on this thread, claiming that it was NOT accurate. In response, I provided:
https://en.wikipedia.org/wiki/Resistance_thermometer
That should settle the matter. But if it doesn’t, then I would categorize that person as a quack. No one is more anti AGW than myself, but I will not believe that there is some huge conspiracy of millions of scientists reaching back 143 years, all to support the AGW hoax. It’s far more believable that the vast majority of scientists are working within the boundaries of logic, integrity and the laws of science, while an extremely small minority of pseudo scientists promulgate impossible speculative ideas for a political purpose, and a much larger group of politicians and media further those political aims.
I’ve already answered his claim that thermal lag while ascending is introducing error. Besides, the floats spend most of their time at their parking depth. Thus, the burden of proof is on Liar man that RTDs are not accurate to within .002 C.
richardscourtney, I would like to add that it takes a particular rabid kind of stupidity to always argue with whatever the AGW team says, even when they admit to something that’s true, which when followed to it’s logical conclusion, will mean that AGW is impossible.
@VikingExplorer
Thanks for your response.
So, in 2013, the ARGO program are still correcting errors in the data which has been acquired since 2006.
http://www.seabird.com/technical_references/CellThermalMassSciencePoster_2014OceanSciencesMtg_Handout.pdf
The above paper deals with errors in salinity measurements due to thermal problems.
Do you know of any work which deals with the thermal mass of the whole float?
It’s easy enough, as you point out to make a precise measurement of temperature to 0.002°C (2mK) with a time constant of 0.39-0.5 seconds (see link) but is the accuracy of this measurement affected by the thermal characteristics of the float. If the float is in thermal equilibrium with its surroundings throughout its profiling ascent then there may not be a problem. If, however, the float is cooler than its surroundings as it ascends then not only may the sensor be affected by conduction from the relatively cooler float but thermoelectric emf’s may be generated in the sensor conditioning circuitry due to temperature differences.
Any comment?
ALos from the manual
Sensors
Salinity
– range…………………………………………………………………………………………………………….10 to 42 PSU
– accuracy…………………………………………………………………………………………………………-
0.005 PSU
– resolution ………………………………………………………………………………………………………….0.001 PSU
Temperature
– range……………………………………………………………………………………………………………-3°C to +32°C
– accuracy……………………………………………………………………………………………………… -0.002°C
– resolution …………………………………………………………………………………………………………….. 0.001°C
Pressure
– range……………………………………………………………………………………………………..0 bar to 2500 dbar
– accuracy………………………………………………………………………………………………………………. –
1 dbar
– resolution ……………………………………………………………………………………………………………..0.1 dbar
@Bill Liar,
Thanks for your comment. I could be wrong, but my understanding is that the float cycle is about 10 days long. They seem to spend 10 hours ascending to the surface, 5 hours on the surface, 10 hours descending to their parking depth and 9 days at the parking depth.
So, even if you are right about the accuracy during the ascent and descent, it doesn’t seem to be applicable to all the good readings at the parking depth. It seems to me that it’s extremely likely that the international collection of scientists would get it about as close as humans can for the early 21st century. Sure, there is always random and systematic error, but this isn’t new unknown technology or science. It was just engineering a temperature measurement solution that would satisfy the system requirements. I see no reason to believe why that didn’t happen.
I believe strongly that hard core warmists capable of outright fraud are very small in number, maybe less than 100 world wide. They made it possible for Argo and all the rest of the climatology instrumentation to be funded. However, I don’t believe that rank and file scientists are infected with Warmism. For one, US funding of science only extends to US universities, and this is an international effort.
As you can see from http://www.argo.ucsd.edu/Organisation.html, Norway was involved, so how can you doubt it. 🙂
Nordic and Scandinavian countries occupy 4 of the top 8 positions: http://coolfunpedia.blogspot.com/2013/05/worlds-most-honest-people.html
🙂
There are 3 parts to this comment: 1) temperature measurement accuracy, 2) volume of ocean water, and 3) sampling
1) There really is no reason to have significant doubts about the accuracy of RTDs, nor of the Argo technology (https://en.wikipedia.org/wiki/Argo_(oceanography)).
2) My arithmetic could be off, or maybe yours is. I understand that each Argo float occupies a 3° latitude by 3° longitude grid square. At the equator, each degree of longitude is 69 miles (same as latitude), or 111 km. So, the volume of water is 111 * 3 (long) * 111 * 3 (lat) * 2 (depth) = 221,777 cubic km. What am I missing? .65 BILLION is 2,930 times too much.
3) Sure, it would be better if there were more argo floats, but it’s fairly good. I see no reason to expect a dramatically different result if we had more resolution. However, the important point regarding the sampling resolution is that the same issue affects air temperature measurements, but no one cared much about that. There were no surface temperature measurements for 2/3rds of the earth, but hey, let’s claim the whole earth is warming because a few airports are getting hot.
At least now, we’re measuring energy levels in a component of the earth thermodynamic system that actually has some Joules. The energy of the whole atmosphere is only 1/1280 of the energy of the ocean. We’re finally measuring something real, and yet you people are complaining. You seem to want to go back to measuring one small part of 1/1280 of the air/ocean system, and extrapolate that to the earth?
I see now that .65 BILLION refers to all water above 2 km of depth. I don’t see that they ever implied that all water above 2 km has a certain energy. They are averaging over time and volume.
This brings up a question about how you actually went from temperature back to Joules. Maybe you should find the Argo raw data.
Certainly, they took a temperature measurement and extrapolated that to the volume of water for that Argo float, which is 221,777 cubic km of water. Using the mass of that volume of water, they computed the energy in that water.
Thermocouples – types and precision:
https://www.yokogawa.com/fld/pdf/temp/TI06B00A01-01E.pdf
Pee page 17.
@RH
“Otherwise the measurement is absolutely coded in 15 bits with an offset of – 2 °C. The temperature is reported in the range -2C to + 30.767C, with a resolution of 0.001C”
Well, that is the reading precision, but what is the accuracy of the number? ±0.005? ±0.01? The resolution is on the electronics side and is not indicative of the quality of the recorded data point per se. Do they talk about that?
My daily data looks like this [27.943] but I don’t believe the last two.
Presumably the original measurements taken by the floats must have been of temperature, not heat content. So those measurements must have been converted to joules, for some reason.
Now, as your conversion shows a humongous 0.02°C per decade, it follows that the floats are capable of measuring to considerably better accuracy than one hundredth of a degree.
Perhaps I’m doing them an injustice, but I have considerable difficulty in believing that 3,500 of these things can be deployed for a decade and be collectively capable of such a high degree of accuracy over an extended period.
“…according to the Argo floats, every bit of the warming is happening in the southern extratropical ocean”
Since most of the ocean is in the southern hemisphere, it makes sense that the oceans there respond in different ways to longer term changes in solar activity. We shouldn’t expect the two hemispheres to behave exactly the same, or on the same time cycles, and geological history appears to also bear this out.
A curious example could be that both Greenland and the contiguous US/Canada haven’t been warming much at all since the early-mid 20th century compared to the rest of the world, and this seems to indicate a fortuitous thing, if future cooling sets in, it might well be starting in the area of North America-Greenland-western Europe, which is good news against the rampant alarmism there.
An aspect of Mann’s ridiculous hockeystick is that the north Atlantic (the study of which led to his insular views) is sensitive to both warming (which gave him his ‘regional MWP’) but also cooling.
>> So those measurements must have been converted to joules, for some reason.
How about because it’s energy that’s important for climatology?
You’re doing yourself an injustice with ignorance. RTDs are a very new technology (invented in 1871). And yes, they are quite capable of measuring temperature to an accuracy of .002 C.
Skepticism is good, but a little research before you write is even better.
I suppose that you also wouldn’t believe that the generators that I once designed had many parts that were machined to .001 inches.
What was the Geometric Tolerance of your 0.001 inch parts?
For example, 1.350 +/- .001
Your replies lead me to think that you are unaware that accuracy has a very loose relationship with precision. Just because a number has a lot of digits after the decimal point doesn’t say anything about it’s accuracy.
The above was @VikingExplorer not garymount.
‘Its’ not it’s above.
As a trained engineer, I do understand accuracy vs. precision. For those of you in Rio Linda: https://en.wikipedia.org/wiki/Accuracy_and_precision
Your replies lead me to think that you don’t understand thermodynamics (“measurements must have been converted to joules, for some reason”).
Sorry, it was catweazle666 who said “measurements must have been converted to joules, for some reason”.
I seem to remember a comment in one of Willis’ CERES articles that the data itself was not really raw data but the result of a computer algorithm. It may be the CERES data has the variance removed as part of that processing.
I imagine the law of large numbers applies to the coverage issue regarding sparse geographic sampling of each ARGO float having to cover about a 180 mile by 180 mile area of ocean. The expectation would be on a convergence to the true value rather than a bias.
Ragnaar: The expectation would be on a convergence to the true value rather than a bias.
You are on the right track, but your language is slightly off. Convergence to the wrong value *is* bias.
MeanSquaredError of the estimate is Variance + Bias^2. What we have here is a case where the variance of the Argo mean is very small, but the bias is unknown: given the problems elucidated (non-random placement, floating with the currents, etc), it is likely that the bias is very large compared to the variance. In the other language, the estimate is “precise” (aka “reliable”) but it’s “accuracy” (with respect to what we want to learn, the true mean temperature of the region of interest ) is not known.
Argo And Ocean Heat Content The earth is closest to the sun in January, so the earth gains energy around that time, and loses it in the other half of the year. please QUOTE THE EXACT WORDS YOU DISAGREE WITH.
Time for me to get on a hobby horse and get knocked off.
I understand what you are trying to say but disagree with the concept.
The energy in equals the energy out on a 24 hour basis.
Hence when the earth is closer to the sun in January yes there is more energy in but also more energy out to balance.
The atmosphere is naturally hotter as the sun is closer.
But the earth does not retain more energy stored in the sea. Any heat that has gone deep is balanced by colder water elsewhere as the earth has to give up all the energy it takes in over the 24 hour cycle.
If that heat went deep somewhere else had to radiate the equivalent back to space.
Yes there are Kelvin waves, yes, there are pockets of down-welling hot water.
But these do not store extra heat, they only carry heat that has already been balanced by the outgoing radiation from the rest of the sea and land.
That is why “the net TOA imbalance generally only varies by something on the order of ± half a watt per square metre over the thirteen years of the record, with no statistically significant trend at all”
not astounding at all.
TOA is simply the heat in, heat out interface.
Hence so called stored heat cannot come back to bite us. It has already gone back to space.
ENSO and stadium waves and El Nino’s are simply descriptors of current weather patterns.
Yes El Nino is real, the sea is warmer but there is no more heat in the system because of it.
There must be more heat in the system causing El Nino.
The simplest explanation for this would be altered albedo due to cloud cover. This lets more heat into the atmosphere which then heats up.
More complex would be altered albedo due to atmospheric factors we have not taken into account.
Choppy surface water in storms, dust storms, forest fires.
or even factors in the sea which might cause increased reflectance off water.
The last would be simple variance in the amount of energy emitted by the sun which we are reluctant to consider.
angech says…”The energy in equals the energy out on a 24 hour basis.”
=============================================================
No Sir.
===============
angech says… “Hence when the earth is closer to the sun in January yes there is more energy in but also more energy out to balance.
The atmosphere is naturally hotter as the sun is closer.
========================================================
Sorry but not so. The atmosphere cools in January, despite 90 W/M sq. additional insolation. SW radiation over the oceans has a long residence time, penetrates up to 800′ deep, and some of that insolation is lost to the atmosphere for decades, maybe even centuries. It is perhaps valid to think of the oceans as a very powerful SW GHL (Greenhouse liquid)
The atmosphere may cool in January where you are in the Northern Hemisphere but at the same time the atmosphere in the Southern Hemisphere is getting miles warmer.
Overall the energy balance for the whole earth’s atmosphere, not just your little bit, stays the same.
The earth is closer to the sun in January in its elliptical orbit hence the atmosphere in January overall is a little warmer.
VikingExplorer December 7, 2014 at 6:39 am
” mpainter, I never said that Heat transfer is dependent on Insolation. I have said that Heat transfer is dependent solely on delta T. ”
but,
VikingExplorer December 6, 2014 at 4:13 pm
” If the sun lost mass, and our insolation was reduced, there would be a greater delta T, and more Heat would flow.”
You do not read what you have written and you contradict yourself repeatedly.
Stop, reflect and think.
This is completely and utterly false. (David A is too kind). There is absolutely no law of physics that says energy in equals energy out. Earth is exothermic, which means it is slowly losing heat. The earth was liquefied about 4.5 billion years ago when a mars sized sibling crashed into earth, creating the moon. The moon’s orbit is slowly increasing by 4 cm per year, and Earth’s rotation is slowing.
Eons from now, earth may eventually get to a point where it is in radiative balance. However, at some point, the earth’s rotation could slow to around 47 days, and the thermodynamics of Earth would be completely different. Don’t worry about that though, since maybe that situation would be forestalled by the Sun growing into a red giant. This could cause the Moon to be torn apart into a ring of debris that will eventually rain down on us like our worst possible nightmare. Or maybe the sun will lose enough mass so that we’ll go off into space with or without our friendly moon companion.
The point is, these scenarios are just as speculative as achieving radiative balance.
Huh? This is completely false. The energy in the ocean is 1280 times that of the atmosphere, while the energy in the crust is 7x that of the ocean. The energy in the ocean is certainly retained.
There is nothing to prevent the earth from gaining or losing heat. If for some reason, the sun would get hotter, than the earth would either lose heat slower, or start gaining energy.
Viking Explorer December 6, 2014 at 8:36 am “As a trained engineer, I do understand accuracy vs. precision.”
Really?
” The energy in equals the energy out on a 24 hour basis. Hence when the earth is closer to the sun in January yes there is more energy in but also more energy out to balance.
This is completely and utterly false. (David A is too kind). There is absolutely no law of physics that says energy in equals energy out.”
Try the
“law of conservation of energy.” Energy is conserved. What does this really mean, and why is it true?
Energy is similar. If you take any volume of space, then the total energy inside that volume at a given time is always the amount that was there earlier, plus the total amount that has come in through the surface, minus the total amount that has gone out through the surface.
Another way of saying the same thing is that energy can’t be made or destroyed. For there to be more, it must have come from somewhere; for there to be less it must have gone somewhere else.
The conservation laws, such as the conservation of energy, give physics its backbone.
Which bit of accuracy, precision and trained engineer is either accurate or precise given this sort of comment?
You need to take a course in physics. It certainly does NOT mean that “The energy in equals the energy out on a 24 hour basis”. The law of conservation of energy states that the total energy of an isolated system cannot change. Earth is NOT an isolated system.
dU = dQ – dW
OR
dU = Qin – Qout – dW
OR
Internal_energy_change (IEC) = Heat_added – Heat_lost – Work_done
First of all, even if IEC is zero, Work is being performed, so Heat_added != Heat_lost
Second and much more importantly, First Law doesn’t require IEC to be zero. IEC can be quite positive or negative. In the case of planets like Earth, it’s slightly negative. For planets like Jupiter, it’s more negative.
You just claimed that Heat_added = Heat_lost. That’s AGW speak for “I don’t understand the First thing about thermodynamics”.
I see your understanding of maths is as good as your understanding of physics, that is not a compliment by the way. Willis may well give up with you .
Hint dU=H.
angech: The energy in equals the energy out on a 24 hour basis.
Why ever do you believe that? Do you have a reference for the claim?
Try the “law of conservation of energy.” Energy is conserved. see reply to Viking above .
For a more detailed summary look up Newton’s laws and physics of black bodies.
If you wish to carp, which you do,
then you can nit pick on Newton’s laws which however hold true for this level of discussion and you can mention the fact that the earth does provide some energy itself from its core which is minuscule and irrelevant to the concept that the sun is providing energy on a constant basis and the earth is a receiver and emitter of all the energy it receives.
You’re confusing cause and effect.
The Heat transfer from earth core/crust to the air and sea is small BECAUSE the sun is providing energy on a constant basis. Heat transfer is directly proportional to delta T. The surface and lower atmosphere are in near thermal equilibrium, so the delta T is small.
There is in fact an extremely large energy store in core/mantle/crust. If the sun lost mass, and our insolation was reduced, there would be a greater delta T, and more Heat would flow.
The heat transfer from the earths core is minuscule compared to the heat output from the sun which is what warms our atmosphere.
If the sun were to go cold the earth would continue to lose its own intrinsic heat at its own intrinsic rate.
The amount of heat the earth itself emits would gradually diminish over time according to most scientists who assume that the core of the earth is cooling.
You are mixing up total energy, sun plus very small earth with energy flow,very small earth out with imagination, cold sun plus very small earth out. There is a larger differential in surface temp of the cooler earth to the temperature inside the earth but the flow of endogenous energy (very small) from the earth core to the surface remains the same and will diminish in time as the earth’ score cools.
Viking Explorer,
If you investigate the question thoroughly, you will find that geothermal flux depends entirely on intrinsic properties of the earth and its crust and not on insolation.
For example, most spreading centers are undersea. Thermal conductivity of the crust is a low value. The mantle is put at ~2500°C. What matter if the atm temp is 0°C or 40°C? Gradient does not change. Groundwater temp. (Shallow aquifers) is usually at a temp which is the yearly average of the charging area.
Thermal gradient is a characteristic of the region and a typical figure is1° F/100 ft. of depth. The
mpainter, I never said that Heat transfer is dependent on Insolation. I have said that Heat transfer is dependent solely on delta T.
You might want to research a bit further, because you’re wrong to say “Thermal conductivity of the crust is a low value”.
The thermal conductivity of the crust is 68 times that of air, and 2.5 times that of water. Water is generally considered a very good conductor of heat, but not compared to Earth.
Heat transfer is NEVER an intrinsic property of a material. I would suggest taking a course in thermodynamics: https://www.edx.org/course/thermodynamics-iitbombayx-me209x#.VIDXs3l0yUk
angech
December 7, 2014 at 2:22 pm
VikingExplorer December 7, 2014 at 6:39 am
” mpainter, I never said that Heat transfer is dependent on Insolation. I have said that Heat transfer is dependent solely on delta T. ”
but,
VikingExplorer December 6, 2014 at 4:13 pm
” If the sun lost mass, and our insolation was reduced, there would be a greater delta T, and more Heat would flow.”
You do not read what you have written and you contradict yourself repeatedly.
Stop, reflect and think.
angech
The earth can store heat and does not need to balance radiation in and out on any particular day. In fact it can take in excess energy for a long time and have an imbalance, then reverse the net flow for another long period of time. If you stand near a hot wood stove and get warm, you do not cool off instantly when you move to a cold corner. You and your clothes retain some of the heat for a while.
An ocean can retain an enormous amount of heat. Fortunately, if cannot come out rapidly because it moves so slowly. There can be an imbalance with more heat coming in than going out for centuries at a time. It is difficult to detect.
Mr. W. If I may make a suggestion to solve your concerns:
1) Scrap the data. 2) Come up with your own hypothesis as to what the ocean heat content should be. 3) Develop your own sub-prime computer model, with unlimited amount of adjustments, to reinforce your hypothesis . 4) Never, never let anyone V & V your work.
Problem solved.
Mr. W. Next step. Convince the politicians you have the answer to kept our oceans from boiling and you too could become a millionaire like AL Gore.
Willis: In any one month, essentially all of the heat that escapes from the ocean comes from the mixed layer of the ocean. It would be interesting to see if monthly changes in the 0-100 m OHC agree with CERES better than the 0-2000 m OHC. In the top 100 m, a 10^22 Joules change represents a 20-fold bigger temperature change and can be measure more accurately
Total energy produced/consumed in 2008 was 143851 terawatt-hour (TWh) as per wiki.
Convert to joules 143851*3600000*10^9= 5.18*10^20 joules.
If the total energy produced in 2008 was used to heat the 0-2000 meters depth of the ocean, it would add only 5.18*10^20 joules to OHC per year or we can say 5.18*10^21 joules/decade.
The current OHC rate of 6.3*10^22/decade is more than 10 times of the total energy produced/consumed in 2008.
The last line should read as:
The current OHC rate of 6.3*10^22/decade is more than 10 times of the total energy produced/consumed in a decade at 2008 production/consumption rate.
Which only confirms that Man is fairly insignificant (including CO2) in his environment. Each day, the earth receives about 25 times more energy than Man produces/consumes in a year. And yet they want to curtail it. For man, energy is like oxygen.
Willis,
You wrote: “At a minimum, it raises serious questions about our ability to measure the heat content of the ocean to the precision claimed by the Argo folks. Remember they claim they can measure the monthly average temperature of 0.65 BILLION cubic kilometres of ocean water to a precision of one hundredth of a degree Celsius”
But you also say they provide no error bars, so how do you know this? Is this a statement about the precision of individual measurements? As others have pointed out here, there may be significant errors in the assumption that the samples are representative of the ocean as a whole.
The heat content papers I have read do not seem to take seriously the wiggles in the data; instead they seem to only think the data are good enough for decade-scale trends. Data with noise of 1e22 J would be fine for that purpose, since many points go into computing the slopes.
The full range of the noise in your plots of monthly flux looks to be about 3e22 J. Taking that to be 2 standard deviations and remembering that the error in a difference is root(2) times the error in the points gives a standard deviation of about 1e22 J for the data. That is compatible with using the data for calculating trends over 5 to 10 years, or longer.
Mike M.
Willis,
Working backward from your results, an error of 1e22 J is an error of about 0.004 K. That is for the average of some 10^5 to 10^6 samples (3500 floats sampling 3 times a month at, I’m guessing, 10 to 100 different depths). So assuming a random sample, that is an error of 1 to 4 K per measurement. The error here is not the precision of the instrument, but the variation between the measurements and the actual average temperature. That seems quite reasonable, given the crudeness of this calculation; i.e., it is the right order of magnitude.
Mike M.
VikingExplorer December 5, 2014 at 1:43 pm
Since the difference in incoming energy from solar min to solar max is on the order of 0.2 W/m2, and the effect of a change in tropical cloud onset time of 15 minutes is on the order of 6 W/m2, I’m sorry, but there’s no reason to expect a change at all. You assume a perfect system where the climate doesn’t respond to changing conditions. In fact, that tiny of a change in a dynamic, chaotic system is unmeasurable, and likely makes no difference at all.
For example, I’ve looked at SST data and found no such an effect. If you want to claim it exists … how about some data to back it up?
The fact that you are offended doesn’t make the statement offensive. And given a known quantity of water, the two systems of units are interchangeable … so why is one “meaningless”.
Are you always this unpleasant, or is this special for me? I didn’t say joules were unfamiliar to me. I said that the effect of adding 10^22 joules to the top 2 km. of the ocean is not intuitively apparent to people.
Look, Viking, if I say that 476 cubic km of water received 7e+16 joules of energy … is that a lot of energy or a little? Can you answer that without converting to temperature? As I said, it’s an unfamiliar measuring system to most people. Obviously (to everyone but you) I’m well aware of what a joule, because I’m able to work in either system of units. But neither of us could say whether that amount of energy would affect that amount of ocean a little or a lot.
On the other hand, if I say 476 cubic miles of water warmed by 0.001°C, is that a big effect? Everyone is familiar with temperature, so everyone can say that it’s a very small change.
Since you haven’t given us any source for your fabulous claim that the crust is absorbing seven times the energy of the ocean … I’m sorry, but I don’t believe your calculations. See below.
You seem to forget that we’re talking about gaining and losing a large amount of energy annually. So we need to look for a reservoir that is not only large, but can gain and lose lots of energy on an annual timescale.
The ocean under 2000 meters is not doing much on an annual scale, it is well isolated from the surface where the exchange happens.
The ocean further north and south than 60° is a small amount of the total ocean volume, only about 7%.
The crust under the oceans is far too thermally isolated to participate in annual swings.
The land and the atmosphere both participate in the swings of heat. However, despite your claim above that the land has “7xEnergy(ocean)”, researchers say different, e.g.
Next, note that the figures in the head post have the annual swings removed … which means that they do NOT contain such things as the annual freezing/thawing of sea ice.
Finally, and most importantly, note that everything you say just makes matters worse, not better. As I pointed out in the head post, there are other things added to the swings. However, they would show up in the CERES data but NOT in the Argo data, making the Argo data even more out of whack … so you have your argument totally backwards. Recall what I said in the head post:
Yeah, you provided “relative energy levels” … but they’re wrong.
An instant clue to what??
There is nothing unbelievable about an instrument accuracy of .005, which is what the manufacturers claim for the temperature measurement of the sensor in the lab.
However, there is something unbelievable in the idea that 3,500 floats can measure the average temperature of .65 billion cubic kilometres of ocean to that kind of monthly accuracy. That’s one float per 186,000 cubic km of water, taking three measurements per month … and it’s not even the same 186,000 cubic km of water.
Viking, have you ever seen Lake Superior? It’s huge, like an inland ocean. It has a volume of 12,100 cubic km … but each Argo float is measuring 15 times that volume.
If we take fifteen Lake Superiors, and we measure the temperature three times a month, but we replace say a quarter of the water in between temperature measurements … how accurate do you think our results will be even if our thermometer measures to .005°C?
Let me close by saying that your arrogant attitude, acting like you know everything about this subject and we’re all idiots, doesn’t serve you well … particularly when you make foolish claims that the land energy is “7x(ocean)” and the like. Give the ‘tude a rest, my friend, we’re all bozos on this bus … and your “explanation”, as I point out above, only makes the discrepancy worse.
w.
You’re confusing power with energy. The increase in SH Ocean (60 S – 20 S) energy is up about 2.6 solar-days worth of energy. Let’s integrate the solar max extra power over time:
Extra received/day (Solar Max) = 1.366 W/m^2 = 1.366 Joule/sec /m^2 * Area * duration = 1.366 Joules * 1.275 * 10^14 * 86400 = 1.5 x10^19 J
Extra received (solar cycle) = Extra received/day * 5 years = 1.5 x10^22 * 365 * 5 = 2.746 x10^22.
This is 1.84 solar-days worth of energy. It’s pretty close to the 2.6 days worth of energy in the SH ocean.
It’s offensive to say “nobody knows what 10^22 joules means”.
Yes, because you specified the energy. 7e+16 Joules is 7e+16 Joules. It’s not a lot compared to the energy coming from the sun every day. It’s about 15 million times the energy my house uses. When adding energy to a something, we would have to know how much energy is already there.
Actually, people’s familiarity is with temperature of AIR. So, it’s quite misleading. If we raised the temperature of earth’s core by .001 C, it would be a huge amount of energy, that if applied to the atmosphere, would fry us all alive.
I never said “absorbing”. That’s an approximation of the energy it has. Absorbing depends solely on delta T. The ocean is in near thermal equilibrium with the crust its in direct contact with. When the water temperature goes up (even if it’s .01 degrees), a delta T exists, and energy will transfer.
It’s not a large amount of energy compared to the heat capacity of the components you ignored. It’s only 1/40,000 of the total energy of the ocean.
You don’t know that. The energy in question is NOT on the surface, it’s in the volume of water 2000 m deep. This water is in direct contact with the water below 2000 m. Heat transfer is happening whenever there is the slightest delta T.
The change in energy we’re talking about is 0.0025 %. 7% is much greater than .00025%.
Bald face assertion in contradiction of 2nd law. Whenever a delta T exists (and it must if the energy level is up), then heat is being transferred.
I calculated it as 221,777 cubic km, so I think it’s 18.3 Lake Superiors (which I once lived near), but you could be right about the exact volume. But as I said, more floats would be better, but it’s literally a thousand times better than talking about air temperatures and extrapolating that to earth.
Talk about the pot calling the kettle black. I’m sorry if I hurt your feelings by pointing out that your whole article was based on a false premise. Earth has lots of internal energy transfers, but less going in and out of the total system. You conflated one component with the whole system. I’m sorry if I pointed out that calling 1/40,000 of the energy in the ocean a “stupendous amount of energy” is a bit of an exageration.
Viking, I give up. You have managed to misinterpret not only the head post, but every one of my comments to you, and have done so in an unpleasant fashion. I’ll leave you to try to convince the others that you know what you are talking about … me, I know you’re far beyond my poor powers to affect your beliefs. For example, you say:
Two things about that. First, I’m talking about what will make an actual, practical, measurable difference to the graphs shown in Figure 1. The sea floor doesn’t qualify.
Second, you are correct that wherever a delta T exists, there is a heat flow. But we’re talking about annual swings … and the annual swings at the bottom of the ocean are trivially small, meaning the delta T is trivially small.
So instead of noting any of that, you want to nit-pick about some minuscule heat flow? Fine.
You also say you are talking about the total energy in the earth’s crust, and the total energy in the ocean, and so on … but that has NOTHING to do with the subject under discussion, which is the monthly and annual fluctuations in ocean heat content. Fluctuations are not the same as total energy. So your claim may be true about the total energy in the crust (although you’ve given no cite to back it up). I doubt it greatly, however, because a) the crust on average is about 20 times as thick as the ocean, and b) the temperature in the crust goes up by about 2°C per 100 metres of depth, and it’s way hot down deep, and c) the temperature of the ocean goes down with depth.
Given all that, your figure is not believable … but SO WHAT? Again, you’re just nit-picking about things that have nothing to do with the subject under discussion. We’re talking about changes in energy, not total energy content.
So you’re free to try to fool the rest of the folks … me, I’m done with your aggressive unpleasant nonsense.
w.
PS–Again, the fact that you are offended doesn’t make something offensive. Yes, you are offended, I get that … but at least so far, you’re the only person out of the hundreds reading this to make that claim.
But it’s all part of your megalomania, you actually believe that you are qualified to judge for everyone what is offensive, based solely on the fact that you are offended … sorry, but the fact that you are offended don’t impress me much. You seem to be offended by a host of trivial things.
Kettle, meet pot. Just because you’re offended, doesn’t mean it is offensive. You are projecting how you feel onto me. It’s arrogant to discuss thermodynamics without ever having really studied it, worked with it, been paid to do it, and then tell people who have been trained that they don’t know what they are talking about.
Bald Assertion without support. You have a-priori decided that earth’s crust can be ignored, in contradiction to the laws of thermodynamics.
First of all, you’re confusing yourself by thinking about temperature with a subjective (air-based) feel for what is “small”. Second of all, the energy we’re talking about here is trivially small compared to energy reservoirs of the crust under ocean and the ocean under 2000 m. A difference of .01 C might seem “trivial” to you, because you’re thinking about air, but that could easily be enough to transfer this small amount of energy.
I have never said that fluctuations are the same as total energy. However, knowledge of the internal energy of components is key to understanding the thermodynamics. For example, in a large building with marble columns, all at 70 F. You place your hand on the column and there is a delta T. However, the very small thermal mass of your hand vs. the very large thermal mass of the column come into play. Your hand starts dropping rapidly from 98.6, and it feels cold. The marble right next to your hand is warmed up, but the very large thermal mass means that it might warm up to 70.00001 F.
A certain section of the ocean heats up by .01 C. The crust is like the marble with a much larger thermal mass, and heat transfer takes place. The energy responsible for that .01 is like nothing to the crust. The ocean temperature drops by .01, and the crust temperature increases by .001 C. (all example numbers) The reverse could happen just as easily as magma might heat up part of the crust.
Which is irrelevant, since thickness of a component doesn’t stop heat transfer.
Which only increases the chances that the ocean can be heated from below. As I predicted 7 years ago on CA, the heating of Iceland, Greenland and Antarctica have now all been confirmed to be volcanic in origin.
Irrelevant to thermodynamics, but no, it’s actually quite constant below 1000m. The graphs give that impression, but if you look at the scale, it’s a very small temperature range.
The bottom line is that you have conflated one component of the system with the WHOLE system. There are certainly heat transfers taking place between all the components of the system. For all we know, the solar max could account for that energy. It’s on the same order of magnitude. For all we know, magma could have heated the ocean from below. See http://www.utexas.edu/news/2014/06/10/antarctic-glacier-melting/
Wait, would you be offended if I reminded you that Antarctica is IN the southern ocean. Would that make you feel bad? Ahhhhh, poor W. 🙂
“It’s the most complex thermal environment you might imagine,” said co-author Don Blankenship, a senior research scientist at UTIG
You should email him and tell him he’s wrong because:
So, if the domestic trade accountants forgot the whole state of California, it will make the discrepancy (measurement error) even worse, because domestic trade should equal international trade, right?
Willis, thanks for not replying again to this guy.
Thanks, Crispin. What I found was that I was unable to get through to him, he simply wasn’t listening, just reflexively opposing. At that point I cut my losses.
Best regards to all, including VikingExplorer,
w.
Actually W, I was unable to get through to you, and you were simply not listening, just reflexively opposing. You and others want to believe that you have discovered a measurement discrepancy.
Thank you, Willis, for a most fitting ending to a most interesting post and thread.
Too bad this turned into a pissing contest. It would have been interesting to see people scrutinizing the argo floats as much as the OP’s methods. There are 15 models, some of which are exclusively deployed in the southern hemisphere. Some of these floats pump the sea water they measure, some don’t. What is their calibration schedule? I don’t care how precise or accurate they are, they need to be checked. Oh well, maybe next time.
What if I were to say:
Domestic trade is just another measure for international trade.
One source says that international trade = 3.86.
Another source says that domestic trade = 12.69.
Color me puzzled. How are we to understand this perplexitude?
There must be something wrong with how these sources measure things. I bet the error bars on that domestic trade are from floor to ceiling. Let’s scrutinize the accounting practices!
Hey, I’m not done with the post, provoter and RH. I’m just done with VikingExplorer, he’s armored himself with his curious opinions to the point that he’s invulnerable.
As to the questions about Argo, RH, you could start here. There’s also this and here.
I note the following quote from one of those sources:
Then there’s this one …
w.
Willis,
Here is a paper by Hansen entitled:
Earth’s energy imbalance and implications
http://www.atmos-chem-phys.net/11/13421/2011/acp-11-13421-2011.pdf
Hansen discusses Argo data, OHC and energy imbalance. Maybe you might find something there.
Thanks, SGW. Been there … discussed that.
w.
Your “discussed” link is from 2006. Hansen’s paper is 2011. Is this just an updated paper with newer data?
Sorry, my bad. Please note, however, that my previous objections still apply. Hansen does not consider the data previous to his paper, and he uses his whiz-bang climate model which I’ve shown elsewhere outputs nothing but a simple lagged version of the inputs. Short-term data plus bad models = junk.
So in answer to your question as to whether I “might find something there”, there’s no “there” there …
With apologies to Gertrude Stein,
w.
The other thing I noticed in Hansen’s 2011 paper is that there an instrument calibration factor applied to CERES data:
The precision achieved by the most advanced generation of radiation budget satellites is indicated by the planetary energy imbalance measured by the ongoing CERES (Clouds and the Earth’s Radiant Energy System) instrument (Loeb et al., 2009), which finds a measured 5-yr-mean imbalance of 6.5 W m −
2 (Loeb et al., 2009). Because this result is implausible, instrumentation calibration factors were introduced to reduce the imbalance to the imbalance suggested by climate models, 0.85 W m − 2 (Loeb et al., 2009).
This may be a dumb question, but Is it possible you are using CERES data values before they are calibrated?
This following is a side issue, but if satellites cannot even accurately measure the energy imbalance that is hypothesized as being caused by increasing CO2 concentrations, then maybe something is wrong with their hypothesis?? (the measurement error is over 600%!)
Nice quote SkepticgoneW
“The other thing I noticed in Hansen’s 2011 paper is that there an instrument calibration factor applied to CERES data:
The precision achieved by the most advanced generation of radiation budget satellites is indicated by the planetary energy imbalance measured by the ongoing CERES (Clouds and the Earth’s Radiant Energy System) instrument (Loeb et al., 2009), which finds a measured 5-yr-mean imbalance of 6.5 W m −
2 (Loeb et al., 2009). Because this result is implausible, instrumentation calibration factors were introduced to reduce the imbalance to the imbalance suggested by climate models, 0.85 W m − 2 (Loeb et al., 2009).
I noticed how the Team relies on satellite data to support a claim for a radiation imbalance, but when the same technology (reading radiation) is employed to measure temperatures at 1000m (RSS) they prefer to avoid it, using instead land-based thermometers.
If they would be consistent, they would accept that the satellite temperature data as well as it has the best coverage and the least bias. As it shows no warming since 1979, they have chosen to use radiation detection technology for one part of the story and not the other. This is inconsistent.