Global temperature update: the Pause is now 18 years 2 months
Guest essay by Christopher Monckton of Brenchley
Since October 1996 there has been no global warming at all (Fig. 1). This month’s RSS temperature plot pushes up the period without any global warming from 18 years 1 month to 18 years 2 months (indeed, very nearly 18 years 3 months). Will this devastating chart be displayed anywhere at the Lima conference? Don’t bet on it.

Figure 1. The least-squares linear-regression trend on the RSS satellite monthly global mean surface temperature anomaly dataset shows no global warming for 18 years 2 months since October 1996.
The hiatus period of 18 years 2 months, or 218 months, is the farthest back one can go in the RSS satellite temperature record and still show a sub-zero trend.
What will the chart look like this time next year, at the beginning of the Paris world-government conference, at which the Treaty of Copenhagen will be dusted off and nodded through by the scientifically illiterate national negotiating delegates of almost 200 nations, ending the freedom and democracy of the West and putting absolute economic and political power in the hands of the grim secretariat of the UN climate convention?
When the November 2015 RSS data are available, how many years and months of zero global warming will have occurred? Enter our friendly competition by putting your best estimate in comments. For guidance, at the December 2012 Doha conference I was banned from UN climate yadayadathons for life for the grave sin of telling the truth that there had been no global warming for 16 years. And an el Nino of unknown magnitude is expected during the boreal winter, followed by a compensating la Nina.

Figure 2. Near-term projections of warming at a rate equivalent to 2.8 [1.9, 4.2] K/century, made with “substantial confidence” in IPCC (1990), January 1990 to November 2014 (orange region and red trend line), vs. observed anomalies (dark blue) and trend (bright blue) at less than 1.4 K/century equivalent, taken as the mean of the RSS and UAH satellite monthly mean lower-troposphere temperature anomalies.
A quarter-century after 1990, the global-warming outturn to date – expressed as the least-squares linear-regression trend on the mean of the RSS and UAH monthly global mean surface temperature anomalies – is 0.34 Cº, equivalent to just 1.4 Cº/century, or a little below half of the central estimate in IPCC (1990) and well below even the least estimate (Fig. 2).
The Great Pause is a growing embarrassment to those who had told us with “substantial confidence” that the science was settled and the debate over. Nature had other ideas. Though approaching 70 mutually incompatible and more or less implausible excuses for the Pause are appearing in nervous reviewed journals and among proselytizing scientists, the possibility that the Pause is occurring because the computer models are simply wrong about the sensitivity of temperature to manmade greenhouse gases can no longer be dismissed, and will be demonstrated in a major paper to be published shortly in the Orient’s leading science journal.
Remarkably, even the IPCC’s latest and much reduced near-term global-warming projections are also excessive (Fig. 3).

Figure 3. Predicted temperature change, January 2005 to October 2014, at a rate equivalent to 1.7 [1.0, 2.3] Cº/century (orange zone with thick red best-estimate trend line), compared with the observed anomalies (dark blue) and zero real-world trend (bright blue), taken as the average of the RSS and UAH satellite lower-troposphere temperature anomalies.
In 1990, the IPCC’s central estimate of near-term warming was higher by two-thirds than it is today. Then it was 2.8 C/century equivalent. Now it is just 1.7 Cº equivalent – and, as Fig. 3 shows, even that is proving to be a substantial exaggeration.
On the RSS satellite data, there has been no global warming statistically distinguishable from zero for more than 26 years. None of the models predicted that, in effect, there would be no global warming for a quarter of a century.
Key facts about global temperature
Ø The RSS satellite dataset shows no global warming at all for 218 months from October 1996 to November 2014 – more than half the 430-month satellite record.
Ø The global warming trend since 1900 is equivalent to 0.8 Cº per century. This is well within natural variability and may not have much to do with us.
Ø Since 1950, when a human influence on global temperature first became theoretically possible, the global warming trend has been equivalent to below 1.2 Cº per century.
Ø The fastest warming rate lasting ten years or more since 1950 occurred over the 33 years from 1974 to 2006. It was equivalent to 2.0 Cº per century.
Ø In 1990, the IPCC’s mid-range prediction of near-term warming was equivalent to 2.8 Cº per century, higher by two-thirds than its current prediction of 1.7 Cº/century.
Ø The global warming trend since 1990, when the IPCC wrote its first report, is equivalent to below 1.4 Cº per century – half of what the IPCC had then predicted.
Ø Though the IPCC has cut its near-term warming prediction, it has not cut its high-end business as usual centennial warming prediction of 4.8 Cº warming to 2100.
Ø The IPCC’s predicted 4.8 Cº warming by 2100 is well over twice the greatest rate of warming lasting more than ten years that has been measured since 1950.
Ø The IPCC’s 4.8 Cº-by-2100 prediction is almost four times the observed real-world warming trend since we might in theory have begun influencing it in 1950.
Ø From September 2001 to September 2014, the warming trend on the mean of the 5 global-temperature datasets is nil. No warming for 13 years 1 month.
Ø Recent extreme weather cannot be blamed on global warming, because there has not been any global warming. It is as simple as that.
Technical note
Our latest topical graph shows the least-squares linear-regression trend on the RSS satellite monthly global mean lower-troposphere dataset for as far back as it is possible to go and still find a zero trend. The start-date is not “cherry-picked” so as to coincide with the temperature spike caused by the 1998 el Niño. Instead, it is calculated so as to find the longest period with a zero trend.
But is the RSS satellite dataset “cherry-picked”? No. There are good reasons to consider it the best of the five principal global-temperature datasets. The indefatigable Steven Goddard demonstrated in the autumn of 2014 that the RSS dataset – at least as far as the Historical Climate Network is concerned – shows less warm bias than the GISS or UAH records. The UAH record is shortly to be revised to reduce its warm bias and bring it closer to conformity with RSS.

Figure 4. Warm biases in temperature. RSS shows less bias than the UAH or GISS records. UAH, in its forthcoming Version 6.0, will be taking steps to reduce the warm bias in its global-temperature reporting.
Steven Goddard writes: “The graph compares UAH, RSS and GISS US temperatures with the actual measured US HCN stations. UAH and GISS both have a huge warming bias, while RSS is close to the measured daily temperature data. The small difference between RSS and HCN is probably because my HCN calculations are not gridded. My conclusion is that RSS is the only credible data set, and all the others have a spurious warming bias.”
Also, the RSS data show the 1998 Great El Nino more clearly than all other datasets. That el Nino, and that alone, caused widespread global coral bleaching, providing an independent verification that RSS is better able to capture such fluctuations without artificially filtering them out than other datasets.
Terrestrial temperatures are measured by thermometers. Thermometers correctly sited in rural areas away from manmade heat sources show warming rates appreciably below those that are published. The satellite datasets are based on measurements made by the most accurate thermometers available – platinum resistance thermometers, which provide an independent verification of the temperature measurements by checking via spaceward mirrors the known temperature of the cosmic background radiation, which is 1% of the freezing point of water, or just 2.73 degrees above absolute zero. It was by measuring minuscule variations in the cosmic background radiation that the NASA anisotropy probe determined the age of the Universe: 13.82 billion years.
The RSS graph (Fig. 1) is accurate. The data are lifted monthly straight from the RSS website. A computer algorithm reads them down from the text file, takes their mean and plots them automatically using an advanced routine that automatically adjusts the aspect ratio of the data window at both axes so as to show the data at maximum scale, for clarity.
The latest monthly data point is visually inspected to ensure that it has been correctly positioned. The light blue trend line plotted across the dark blue spline-curve that shows the actual data is determined by the method of least-squares linear regression, which calculates the y-intercept and slope of the line via two well-established and functionally identical equations that are compared with one another to ensure no discrepancy between them. The IPCC and most other agencies use linear regression to determine global temperature trends. Professor Phil Jones of the University of East Anglia recommends it in one of the Climategate emails. The method is appropriate because global temperature records exhibit little auto-regression.
Dr Stephen Farish, Professor of Epidemiological Statistics at the University of Melbourne, kindly verified the reliability of the algorithm that determines the trend on the graph and the correlation coefficient, which is very low because, though the data are highly variable, the trend is flat.
RSS itself is now taking a serious interest in the length of the Great Pause. Dr Carl Mears, the senior research scientist at RSS, discusses it at remss.com/blog/recent-slowing-rise-global-temperatures.
Dr Mears’ results are summarized in Fig. T1:

Figure T1. Output of 33 IPCC models (turquoise) compared with measured RSS global temperature change (black), 1979-2014. The transient coolings caused by the volcanic eruptions of Chichón (1983) and Pinatubo (1991) are shown, as is the spike in warming caused by the great el Niño of 1998.
Dr Mears writes:
“The denialists like to assume that the cause for the model/observation discrepancy is some kind of problem with the fundamental model physics, and they pooh-pooh any other sort of explanation. This leads them to conclude, very likely erroneously, that the long-term sensitivity of the climate is much less than is currently thought.”
Dr Mears concedes the growing discrepancy between the RSS data and the models, but he alleges “cherry-picking” of the start-date for the global-temperature graph:
“Recently, a number of articles in the mainstream press have pointed out that there appears to have been little or no change in globally averaged temperature over the last two decades. Because of this, we are getting a lot of questions along the lines of ‘I saw this plot on a denialist web site. Is this really your data?’ While some of these reports have ‘cherry-picked’ their end points to make their evidence seem even stronger, there is not much doubt that the rate of warming since the late 1990s is less than that predicted by most of the IPCC AR5 simulations of historical climate. … The denialists really like to fit trends starting in 1997, so that the huge 1997-98 ENSO event is at the start of their time series, resulting in a linear fit with the smallest possible slope.”
In fact, the spike in temperatures caused by the Great el Niño of 1998 is largely offset in the linear-trend calculation by two factors: the not dissimilar spike of the 2010 el Niño, and the sheer length of the Great Pause itself.
Replacing all the monthly RSS anomalies for 1998 with the mean anomaly value of 0.55 K that obtained during the 2010 el Niño and recalculating the trend from September 1996 [not Dr Mears’ “1997”] to September 2014 showed that the trend values “–0.00 C° (–0.00 C°/century)” in the unaltered data (Fig. 1) became “+0.00 C° (+0.00 C°/century)” in the recalculated graph. No cherry-picking, then.
The length of the Great Pause in global warming, significant though it now is, is of less importance than the ever-growing discrepancy between the temperature trends predicted by models and the far less exciting real-world temperature change that has been observed.
IPCC’s First Assessment Report predicted that global temperature would rise by 1.0 [0.7, 1.5] Cº to 2025, equivalent to 2.8 [1.9, 4.2] Cº per century. The executive summary asked, “How much confidence do we have in our predictions?” IPCC pointed out some uncertainties (clouds, oceans, etc.), but concluded:
“Nevertheless, … we have substantial confidence that models can predict at least the broad-scale features of climate change. … There are similarities between results from the coupled models using simple representations of the ocean and those using more sophisticated descriptions, and our understanding of such differences as do occur gives us some confidence in the results.”
That “substantial confidence” was substantial over-confidence. For the rate of global warming since 1990 is about half what the IPCC had then predicted.
But, but, The Bureau of Meteorology, through their media division ‘their’ ABC, are telling us today that 2014 will be the ‘hottest ever’.
Every 15 minutes!
Well, anyone can go to the BoM website and find records are not broken. The humidity is making the day rather unbearable.
The climatism-loving media do not cite correctly the original WMO report behind this claim.
It says actually:
“The year 2014 is on track to be the warmest, or one of the warmest years on record. The near-surface oceans have been particularly warm.”
and then further in detail:
“If November and December maintain the same global temperature anomaly value, the best estimate for 2014 according to this measure would place it as the warmest year on record. The year, however, is not yet over. Comparing January to October 2014 to the same period in earlier years, 2014 is so far tied for warmest with 2010. It is important to note that differences in the rankings of the warmest years are a matter of only a few hundredths of a degree, and that different data sets show slightly different rankings.
Global average temperatures are also estimated using reanalysis systems, which use a weather forecasting system to combine many sources of data to provide a more complete picture of global temperatures. According to data from the reanalysis produced by the European Centre for Medium-Range Weather Forecasts, the January to October combined land and ocean global average temperature would place 2014 as third or fourth highest for this dataset, which runs from 1958.
Based on these lines of evidence it is most likely that 2014 is currently one of the four warmest years on record, but there is a possibility that the final rank will lie outside this range.”
So let’s see: “One of the warmest” is not quite the same as “the hottest ever”. And even it would be the warmest year then just a tiny bit warmer than 2010 and only on the base of the most “homogenized” global mean-temp curves ala GISS & Co but not on the base of the less-biased satellite data. That means that in reality the so-called hiatus will not stop because of 2014.
Source WMO report:
https://www.wmo.int/pages/mediacentre/press_releases/documents/1009_Draft_Statement_2014.pdf
Dr Mears is an idiot who cannot accept the data.
When the data say elsewise, he says “Yeah, Verily.”
The sign of true faith-based believer.
Signed
//Joel O’Bryan, PhD//
BTW, Thank you Christopher Monckton of Brenchley for the data post. Millimeter by millimeter, this AGW hoax will be pushed back.
Merry Christmas.
Of course you and I \ suspect the numbers of months of zero T rise by net December will be 230 months.
But that aside, what will really grab the attention of the public is Southern OCean sea ice levels. Where will that be in July 2015? Above 2014? That will be difficult to be sure, especially with the weak El Nino.
You can pick up extra months on the left side of the graph (months that aren’t included currently) if future months are cold enough.
I wager 240 months, or 20 years no global warming by the Paris YadaYadaFest.
Actually, I predict that Antarctic sea ice levels will drop back from last year’s level. I swear that I can see a wave in the pattern (been saying it for a couple of years no). If I’m right, then expect to see a drop back. However, I expect the Arctic rebuild to continue.
Refreshing honesty from the NSIDC today:
‘This November has been particularly notable for severe weather in the U.S., with a very strong storm in the Bering Sea affecting Alaska (a remnant of Typhoon Nuri that tracked from the tropics through the Aleutians), record-setting low temperatures in the upper plains, and epic lake-effect snow near Buffalo, N.Y. Such individual events cannot be directly linked to climate change, let alone specifically to sea ice loss.
New research this year from Japanese scientists (Mori et al., 2014) provides support for the hypothesis, put forward by Jennifer Francis of Rutgers University and Steve Vavrus of the University of Wisconsin, that the warming Arctic is contributing to an increasing waviness of the jet stream with the potential for more extreme weather events, including cold outbreaks in the lower 48 U.S. and Eurasia that have been seen in recent years. However, while there is some evidence of this connection, it is not conclusive and many scientists remain skeptical of a link between Arctic sea ice and mid-latitude weather.’
Everything is sinusoidal (well a lot of things) so I agree with “The Ghost”. You could see the start of the decline in Antarctic Ice at the end of the season. Just go look at the graphs on the sea ice page here. Maybe in 2016 or 2018 it will bump up again. Or maybe, as has happened before, the opposite poles growth and shrinkage will continue, like watching the “ice caps” on Mars. One advances while one recedes, and then they switch places. When we have had satellites floating about for a thousand years or so, we may have a better idea. (Assuming NASA can actually launch one 😉 )
Dr Mears writes:
“The denialists
==========
A clear inference to holocaust deniers and the Nazi’s.
Will we see Prof Richard Betts and Dr Tamsin Edwards step up to the plate as per “A big (goose) step backwards”. Will they call out Dr Mears for his language?
I’m not holding my breath because “denialists” is part of the Big Lie. Denigrate your opponents, make them appear sub-human. Ignore the fact that the skeptics correctly predicted the pause.
I’m sorry, but the words “denial” and “denialist” predate WW2. Not only that, but there is no reason that you can’t “be” a denialist” without it referring to WW2. That period doesn’t own the words. Get over it.
Better yet, Tom O:
Get over calling people deniers simply because they are skeptical about the pseudoscience behind CAGW.
I do not think that Dr. Mears can be described as an idiot. Assuming (a big assumption, I know) that the adjustments to data input into climate models are unbiased he rightly identifies:
“The possible causes for the model/observation discrepancies can be grouped into several categories:
• Measurement Errors
• Errors in Model “Forcing”
• Internal Variability (Random Fluctuations) in the Climate System
• Errors in Fundamental Model Physics
The first 3 causes have no effect on the long-term sensitivity of the climate to increased CO [sic] and only some of the fundamental model physics errors (4th cause) would change the long-term sensitivity.”
He goes on to explain:
“Model forcings are changes external to the climate system that can change the state of the climate. These include things like the output of the sun (clearly external), the rise in the concentration of CO2 (CO2 is located within the climate system, but is not directly affected by changes in climate), changes in aerosols caused by volcanoes and/or industrial pollution, and changes in other trace gases such as methane or ozone. For climate simulations, these forcing variables serve as inputs to the program. Any errors in the forcings data input to the model can lead to errors in the output. A simple case of garbage in — garbage out. [my emphasis]. For the plots in the figure above, the forcings come from (perhaps imperfect) measurements for the period up to 2005. After 2005, the models used predicted forcing values derived from estimated future emissions (Representative Concentration Pathways, or RCPs, in IPCC jargon). Many of these forcings may indeed contain errors, not only in the predicted values, but in some cases, even the pre-2005 measured values. The one forcing that is not in doubt is the concentration of CO2. Carbon Dioxide has continued to rise as predicted.”
Dr. Mears is not prepared to comment on the “errors in fundamental model physics” because he is not a climate modeller.
He is, I think, wrong in not questioning the errors in in “fundamental model physics”. While “fundamental physics” is almost certainly beyond the point where it may be queried, “fundamental model physics” is not the same animal. No theoretical modelling is beyond dispute. As the number of parameters increases the mathematics underlying all such models becomes less and less secure.
Hence Dr. Mears believes that anthropogenic CO2 is the dominant long term factor in climate change. Sadly that is a matter of faith and cannot be disproved. But one might as well call the Pope an idiot because he believes in the Deity or Dawkins an idiot because he does not.
Dr. Mears’s conclusion is one that many “deniers” such as myself may, I believe, find acceptable:
“My view is that the subduction of heat into the ocean is very likely a significant part of the explanation for the model/observation discrepancies. What is less clear is whether or not this subduction is due to random fluctuations in the climate, or some sort of response to anthropogenic forcing. An important question is now ‘how long will the enhanced trade winds continue?’. The trade wind anomaly lessened during 2013, but we do not know whether this change will persist over the next few years and lead a positive phase of the IPO, or if the IPO will take longer to flip to its other phase. I’ll conclude by reiterating that I do not expect that the hiatus and model/observation discrepancies are due to a single cause. It is far more likely that they are caused by a combination of factors. Publications, blog posts and media stories that try to pin all the blame on one factor should be viewed with some level of suspicion, whether they are written by climate scientists, journalists, or climate change denialist.”
PS Thanks to Viscount Monckton for another well-researched and interesting article.
Just to add a little from Dr. Mears:
“Also, a philosophical comment — often, we are predisposed to the position that a given effect is due to a single cause. Part of the reason for this is probably human nature. We like to distill complex things into simple stories or parables. The other part is that for most of the science courses we take in school, simple experiments are presented that demonstrate the fundamental ideas in the topic under study. Single causes are often the case in laboratory experiments — these experiments are usually designed to isolate a single causative effect. In “real-world” science, such as the study of Earth’s climate, things are very unlikely to be as clear cut. Instead, each observed “effect” will be due to the combination of numerous causes”.
What is most comical about this quote is that Dr. Mears is suggesting that we not attribute the failure of MODELS to any single cause, but goes on to say, in essence, that the only possible explanation for climate change is human burning of fossil fuels that contribute to the increase of Co2 – in other words, he is predisposed to to the position that a given effect is due to a single cause. I love his closing statement:
“I’ll conclude by reiterating that I do not expect that the hiatus and model/observation discrepancies are due to a single cause. It is far more likely that they are caused by a combination of factors. Publications, blog posts and media stories that try to pin all the blame on one factor should be viewed with some level of suspicion, whether they are written by climate scientists, journalists, or climate change denialists”.
Yes. Never has such a simple point been missed by so many so often.
I regret having to say that Dr. Mears has earned his “title of honor idiot” well enough by using the very unscientific term “Denialist” in a purely scientific debate. People who use such language against opponents in a scientific discussion claim to possess the key to absolute truth. Doing so they leave the realm of science and enlightenment and enter into the dubious corner of superstition and hybris.
Thank you for your comment. Thisis what I’m missing very often in the climate discussion. It is crucial trying to understand the person with another opininion or point of view.
One can never look into anoterh person and find out what ha think. Therefore name calling and making statements about the mental condition of an opponent is not helpful.
We should be generous to others and stick to the facts, as they were shown by Mr. Monckton. Thus we aviod auxilary battefields and personal huffiness.
There is a “single cause” for the failure of the models: the modelers do not understand climate processes well enough. No one does. It is really that simple.
The significance of Mear’s statement is that he publicly acknowledges failure of the models. Even Mosher does not do that.
A non-linear approach: http://hallofrecord.blogspot.com/2009/11/non-linear-perspective-of-climate.html
Alarmists like to say the heat is going into the oceans, but that simply means its not going to get as hot as they thought, when they used to say pretty much all the heat was going into the atmosphere.
They also fail to mention that heat was coming OUT of the oceans in the late 20th century, meaning at least some of the warming they erroneously back then attributed to human activities was natural.
But it takes a while for bureaucracies to see their errors.
Give it a few decades and the above will become the new orthodoxy.
The heat is going into their heads it seems to me. That would explain a lot.
How does the heat goes ‘OUT’ from colder (ocean) to hotter (air) because of CO2? Doesn’t it breaks one of the Laws of Thermodynamics?
Via a long distance version of “Quantum Tunneling”. /sarcastic wild speculation
How does the heat go ‘OUT’. A little thermo for you.
So Sublimation of water is 2,830,000 J/kg.
http://www.theweatherprediction.com/habyhints2/524/
And since most of this energy is taken from the nearby sea water – it will cool
Specific Heat Sea Water = 4,009 J/kg oC 2,830,000/4,009 = 705 or 705 kg by 1- C
Since there is 1,000 Kg per m^3 or 100 Kg per cm-m^2, 1 cm of water sublimated will cool the next (705/100) = 7 cm of water 1 oC.
Oh yea, the average amount of evaporation on open ocean (non-ice) is around 140 cm. That’s how the oceans cool.
Thingadonata, Maybe you can help me since you have brought up the idea proposed by AGW believers that heat is disappearing into the deep ocean and so not warming up the atmosphere, If water expands when heated, why are the sea level not rising (or not rising much)? Or is physics not applicable to AGW?
My entry in the Paris lottery: Slight but measurable cooling.
Regardless what the statistics might be showing (or hiding), the Paris call will be, “Give us more money”.
Toorightmate: Spelling error: ‘more’ is ‘your’.
I suspect that persons at NOAA have already been ordered, “do IT, God Damn IT, or be FIRED”, to fabricate “data, i.e. observations” in order to appease Obama and save the names of the Saints of Global Warming, James Hansen and Albert Gore, and for no other reason.
Global Warming needs ObamaCare, and ObamaCare DESPERATELY NEEDS, at any and ALL COST NO MATTER THE BODY COUNT, WHICH MUST BE HIGH, Global Warming!
Ha ha. Sorry Old Obama-Boy. No Body Count, No Warming. NO OBAMACARE. Yea right, like Obama actually cared. Ha.
Ha ha.
I’m unable to enter your friendly competition as there is no reliable gauge for predicting such things. I’d love to have a go at guessing the number of jelly beans in a jar, for at least in that case there are reliable ‘models’ I can use, such as C=2pi r or what not. Maybe that could be the WUWT Christmas competition.
It seems to me that in general, all the evidence that we have about global temperature shows that natural variability is by far the most important driver. We have the MWP, we have the EWP (c.1920-1940), we have the current pause etc. CO2 just doesn’t seem to matter all that much.
+1
IPCCD. The International Panel of Climate Change Denial.
InterGovernmental Panel On Climate Change:
IGPOCC:
IG: Ignorant
POCC: Chicken Little’s chatter.
IGPOCC has these advantages over “the IPCC”:
• It is a pronounceable acronym, unlike “IPCC,” which is a mere abbreviation.
• It comes without the extra baggage of an introductory “the.” “IGPOCC claims . . .” has only three syllables, not the six of “the IPCC claims.”
• IGPOCC is more memorable than “IPCC”—it’s hard to keep the latter’s letters straight when writing or saying it.
• It’s a more accurate representation of the IPCC’s spelled-out title, because 1) the word “Governmental” is a vital part of it and should not be submerged in “Inter.” Unawareness that the panel is composed of representatives of governments contributes to widespread misunderstanding of “where it’s coming from.” Many people assume, I suspect, that the word is “International”; and 2) “on” is included in IGPOCC.
• IGPOCC mockingly suggests an assemblage of ignorant clucks.
• It lends itself to other word-forms, like IGPOCC-ery and IGPOCC-ish.
So, henceforth, let’s stick it to the chick(en) with “IGPOCC.”
If we were going to cherry-pick start dates, surely we’d select 1998, not 1997?
The start date was selected by, “as far back as one can go without a positive trend in GTA”, hence not cherry-picked.
I want to pick September, 0018. Right in the Roman Warm period when temperatures were a couple of degrees warmer. Added benefit is that it is ‘pre-industrial age’ and to keep below 2 C warming we will have no problems for 4 more degrees.
The EPA having conquered CO2 is now going after O3. Remember Obama is in charge and we will do his bidding. Facts have no bearing in politics.
Before they go after O3, they should perhaps read Prof Lu’s third paper on Antarctic O3. We may need all we can get and control where it goes.
This is Lu explaining to Eli Rabett the review process and the AGW-demolishing alternative hypothesis he developed in 2009.
http://www.climatesciencewatch.org/2013/06/05/response-by-qing-bin-lu/comment-page-1/
Eli’s responses are classic reality-denial and demonstrate he really can’t follow the physics – it is so bewildering he calls it magic (hocus pocus). He also objects to the journal (his point number 7). Classic.
“But is the RSS satellite dataset “cherry-picked”?”
As Werner noted (see Appendix), it’s now about the only one showing a period of non-zero trend “worth mentioning”.
How many facts do you need before you start questioning a hypothesis? Isn’t one good enough?
Except, as the real problem is the divergence of the models and any measurement of reality – it’s clear nothing will lead some to question this hypothesis.
Many errors come from breaking the first commandment.
Warming or cooling or pausing or spinning (ahem) isn’t enough.
We need to know why. And the failures of the models show we don’t know why.
Consider the alternative. Since there is no warming, isn’t it preferable that this lot continues to deny reality? As long as they do, their ENTIRE work will questioned.
Yes, it really is too bad that NASA and UEA have systematically ruined their data sets through unjustified adjustments, dropping of perfectly fine stations only to fill the mesh with interpolation and such.
The climate “science” community is full of people with no respect for raw data – they may be good with numbers, but they are not scientists. All we get has already been filtered through their elaborate virtual bovine digestion machineries. Where I live, summers aren’t hotter, and winters aren’t milder than in the past, and I put more stock in that observation than in the corrupted data sets provided by the gatekeepers.
Nick, a few comments down, Richard Verney gives a response which answers your point very well.
I appreciate that you, unlike many who write about the lack of global warming, do not use the word hiatus to describe the absence of warming. Some may consider this to be pedantic of me but I refer them to the OED definition of “hiatus” as follows:
“hiatus
Syllabification: hi·a·tus
Pronunciation: /hīˈādəs
/
Definition of hiatus in English:
noun (plural hiatuses)
[usually in singular]
1A pause or gap in a sequence, series, or process: there was a brief hiatus in the war with France
More example sentences
1.1 Prosody & Grammar A break between two vowels coming together but not in the same syllable, as in the ear and cooperate.
Origin
mid 16th century (originally denoting a physical gap or opening): from Latin, literally ‘gaping’, from hiare ‘gape’.”
There is no evidence that what we are experiencing is merely a gap. Therefore, the use of “hiatus” is incorrect. The same reasoning applies to the use of “pause.”
Yes, hiatus and pause imply a gap in an ongoing trend.. Perhaps “plateau” should be used.
What is your definition of plateau?
What if the ‘plateau’ comes to an end, and temps begin to rise say from 2015 for the next 20 years? Would you in this scenario still describe the past 18 years as a ‘plateau’
Personally, I consider the description to be merely a question of semantics and debating how to refer to the past 18 years (or so) is merely a distraction.
The fundamental point is that we all know that temperatures have not increased either as projected/predicted by models, or more importantly in response to CO2 emissions these past 18 years, and for those who claim long CO2 residency times and already locked in warming, in response to CO2 emissions going back these past 50 or so years.
The past 18 years clearly demonstrates that natural variation is King. It also suggests that climate sensitivity to CO2 (if any at all) is so low that its signal cannot be weeded out from the noise of natural variability.
plateau is more correct than pause or hiatus. both pause and hiatus assume/imply that warming will at some point continue. since this is unknown at present, both terms are unscientific, even if one is Latin and thus “must be” scientific.
plateau allows that either warming or cooling will follow, or that the plateau may simply continue.
pla·teau
noun
2. a state of little or no change following a period of activity or progress.
verb
1. reach a state of little or no change after a time of activity or progress.
“Vacation” (from rising temperatures) could also be employed 🙂 but like hiatus and pause it necessitates an inevitable endpoint and return to trend.
Thus, “Plateau” is best since it is neutral about what might follow.
Even plateau isn’t quite right. A closer look at the data shows the warming “peaked” and we are now cooling. At some time in the future the cooling may reach a low point and warming will start anew as it did in the 1970s.
http://www.woodfortrees.org/plot/rss/from:1996.75/plot/rss/from:1996.75/to:2005/trend/plot/rss/from:2005/to/trend
It has stopped warming. Nobody knows whether the next official figure for the global temperature from this same data source, even if it is just what they come up with tomorrow, will be higher or lower or exactly the same as they got for today. That is prediction, and statistics is completely non predictive. You can only do statistics on real numbers that are already exactly known.
So global warming has stopped.
What may happen tomorrow or next week, or next month, or next year, will be known tomorrow or next week or next month or next year.
Come back then and find out what happened.
You still won’t know what will happen next.
Ray, Pause & Hiatus might be correct in terms of change. Since we are referring to a period of little or no change, a gap is correct The war example above, is bistable, (war/peace), but climate has 3 states (warm/flat/cool), meaning a gap in either warming or cooling might be appropriate, no?
Either way, Pause & Hiatus are in use and commonly known. I feel that changing them now might be viewed like the switch from Global Warming to Climate Change, and undermine the message that seems to be spreading.
Paul
“What if the ‘plateau’ comes to an end, and temps begin to rise say from 2015 for the next 20 years? Would you in this scenario still describe the past 18 years as a ‘plateau’ ”
Inevitably it will end at some stage. If temps go up it will disappear into the ongoing upward trend, if temps go down it will become a ‘peak’.
Its more than semantics, its the soundbite that appears in the headlines. It aught to be correct.
Hiatus and pause might be correct. We don’t know yet. It could be a plateau. We don’t know yet. What I do know is that it’s a global surface temperature standstill.
If you are sure that temperatures will continue go up after a standstill you would be correct to describe that standstill as a Hiatus or a Pause.
If you were not sure of this you could say Global temperatures have plateaued.
Does anyone know what the “consensus” is on the total contribution of CO2 as of today to the overall claimed “Greenhouse Effect”?
If you google it you get “mainstream climate scientists” citing anywhere between 9% and 26%! The number for the total Greenhousyness of our greenhouse gasses is 33-34C. An exact “official” number here would be appreciated too. It’s kind of hard to properly debunk someone when they don’t give you hard numbers to debunk with!!
Seeing as water vapor makes up 90 to 96% of all so called greenhouse gasses, the 26% figure for CO2 is obviously way out there beyond reasonable.
No it’s not. The way to look at it is like this
The 26% refers to the GH effect from CO2 if all greenhouse gases APART from CO2 were removed from the atmosphere.
The 9% refers to the reduced effect if CO2 alone were removed leaving all other greenhouse gases at current levels.
This basically shows that there is “over-lapping” of absorption bands but also that the presence of water vapour does depend, to a certain extent, on the presence of other greenhouse gases. If, for example (hypothetically), we removed all CO2 from the atmosphere then the atmosphere would cool. A cooler atmosphere holds less moisture so the water vapour concentration would fall. This roughly describes the feedback effect that the CAGW crowd us to produce the higher sensitivity figures.
And, NO, water vapour does not make up anything like 96%.
Since no one is talking about removing all the water vapor and other GHGs from the atmosphere, it would appear that the 9% figure is the correct one for CO2.
Water vapor is something like 2-3% of the atmosphere, while CO2 is .04%. At least 50 times less, so it seems quite possible that water vapor is as much as 96% of the GHG molecules in the atmosphere.
Ok – perhaps mine wasn’t a good explanation. In regions with a dry atmosphere the CO2 effect will be closer to 26%. in moist humid regions closer to 9%. BUT no CO2 in the atmosphere will likely to lead to cooling which will mean less WV in the atmosphere.
Globally, H2O is roughly 30,000 ppm, but of course it varies widely, from over 40,000 in the tropics to maybe 400 or even less in the polar nights. Thus, globally, CO2 is about 1.3% (400 / 30,400) of GHGs by ppmv, as the levels of other GHGs are so low. But in the cold, dry Arctic & Antarctic, if it’s well mixed enough to be at its global average there, its effect would be comparable to that of H2O. But in the moist tropics, its effect would be trivial, or even under some conditions slightly cooling, but in any case scarcely detectable.
I should add that while CO2 might well have its 1.2 degree C warming effect from doubling to 560 ppm in the cold winter night of polar latitudes, there would be no feedback effect from water vapor, since the land is freezing & the sea covered with ice. Nor would raising the temperature of Barrow from -26 C to -25 C have any climatic effect.
Earth’s surface is close to a black body in the thermal infrared and a black body at 288K emits 390 watts/sqM. The earth as a whole loses only about 240 watts/sqM so GHG’s plus clouds plus other pollutants in the atmosphere in total reduce Earth’s energy loss by about 150 watts/sqM. The contribution from CO2 is around 28 watts/sqM so that amount to 28/150 or about 19% of the total. On the other hand, the total impact of all GHG’s being 33-34C is open to question. Water vapour is clearly a green house gas and clouds are inexorably linked to water vapour. If there was no water vapour and thus also no clouds Earth would be receiving around 340 watts/sqM instead of 240 watts/sqM and for a black body to emit 340 watts/sqM its temperature would have to be 278K so that would imply a total impact of 10C not 33C to 34C. Of course one could claim cloud effects are different from those of GHG and should not be lumped in together but if you argue that way you also have to take out the warming effect of clouds (clearly significant if you compare a clear night with a cloudy night) so that changes things again. In my view to accept one impact of a substance in our atmosphere while ignoring other impacts of the same substance is a pointless exercise.
I’ve never understood why the TOA flux is divided by four to get a global average.
The sun happens to shine on one half of this planet and that half receives a heck of a lot more than 340 Wm2.
Anybody who leaves out ANY PROCESS within the Earth Atmosphere System isn’t studying the planet we live on but some hypothetical mental construct.
The fact is, the effect of having this particular atmosphere with ALL its constituents on this particular planet is that of COOLING during daylight hours and WARMING during night time hours (basically). Adding more greenhouse constituent into the atmosphere will enhance this effect i.e. cool more during day and warm more during night.
The default position and occams razor says the two effects cancel each other. (You don’t think so? Check the diurnal range of dry areas with wet areas. Going from dry to wet {enhancing the GHE} only serves to reduce day time highs and increase night time lows.)
Regarding the ‘pause, hiatus, whatever’, the alarmists claim “NATURAL VARIABILITY” is the cause.
SO I ASK THE SAME QUESTION OF LUKE WARMERS (sceptics who accept the science but dispute the magnitude), and their answer is????…..crickets……NATURAL VARIABILITY.
Arguing the exact same position and then wondering why they’re not winning the argument. Go figure
No.
The energy incident on the earth using your figures is 390 w/sqM.
If the earth emits 240 w/sqM this is because it has already reflected the other 150 w/sqM .
Total energy in equals total energy out always in this situation.
Clouds, GHG and pollutants change how much heat the air holds, not how much heat is emitted.
The apparent 288 K average on earth is kept there by the greenhouse effect.
The effective TOA emission is presumably 240 w/sqM if 150 w/sqM have already been reflected.
someone checking the earth from a distance sees 390 w/sq/m outcoming radiation
Well, if you don’t understand that Mr. Humbug, there is no point asking anything else is there?
http://scienceofdoom.files.wordpress.com/2010/02/solar-disc-surfacearea-taylor.png
MikeB
Mea Culpa for expressing myself inadequately.
I’m sure you’re going to present evidence any minute now that shows no part of this planet receives enough short wave flux to raise the temperatre higher than -18C and if not for CO2 places like deserts would never reach 40+ degrees right?
Hope you enjoyed your ‘gotcha’. Keep up the good work.
oh! by the way, if you didn’t bother reading the other 30+ lines of my comment, there’s no point having a civil discussion with you is there? Go get stuffed Mr MikeB
MikeB,
Your diagram is great for a planet with no atmosphere and an albedo that is independent of incidence angle. The problem is that only a very narrow band near the equator receives the direct solar flux at the surface. All the rest of that surface receives less flux as a function of the angle of incidence. Energy reflected in the visible to UV bands are not intercepted by greenhouse gases and don’t contribute to heating the surface or atmosphere much. So if we are going to be exact, the power function is more of an integral over some angular variance in latitude or longitude from the nadir position of the sun. I haven’t really sat down and worked out exactly how that function would look, but conceptually it seems trivial. Of course the devil is in the detail on these things.
Well since this is a science site, and accuracy is all important; for example the Newtonian gravitation orbital mechanics predicts the precession of the perihelion of Mercury with an error of 43 arc seconds per century, I have to call MikeB on his assertion to Baa Humbug, as to the quartering of TSI to get a global average.
For starters, I will give you the trivial points, that (a) earth is not a sphere.
x^2 + y^2 + z^2 = r^2 has no provision for 8 km high mountains on the surface.
And (b) the presence of Earth’s atmosphere results in slightly more than half of Earth’s surface being illuminated by the sun, because of atmospheric refraction.
So I’ll accept for the time being, a perfectly spherical earth with exactly one hemisphere in sunlight.
MikeB’s model is still in error, because that ideal earth is not an isothermal ideal sphere, so it has quite a range of Temperatures over the surface AT ALL TIMES.
The extremes of that range are about -94 deg. C to about + 60 deg. C but a very common range exceeding 120 deg. C can be found 24 / 7 365 days a year.
As a result the total BB like radiation is ALWAYS in excess of 4 times the average over the whole surface.
Given the current Temperature change stoppage, the TOTAL earth emission should equal the TSI insolation. That is the same as MikeB’s model assumption.
But because of the non linearity of the emission versus Temperature function, the AVERAGE surface emission over the whole earth is ALWAYS less than one quarter of the real TSI value.
And the error between the real total emission, and four times the average surface emission is large enough to encompass any GHG assumed forcing.
So I’m with Humbug on this. Why divide by four instead of the more correct larger ratio.
Earth is NOT an isothermal perfect spherical black body radiator.
Owen’s obliquity comment is really a non-issue. It doesn’t matter what the surface obliquity is, it will still receive TSI W/m^2 of projected area. Since the earth’s surface is not smooth, even at the equator at the equinoxes, the surface does not receive a uniform irradiance at the micro-scale, but it is still the projected area that determines how much energy is intercepted.
So approximately pi.R^2xTSI is still the total incident power, constantly. And I wouldn’t describe it as “bursts” even for a particular spot on the surface. During the daylit hours, there will be a smooth rise from essentially zero before sunrise, to a max at the local noon, and decaying back to zero after sunset.
Of course the Surface Temperature profile, will lag from that timing.
But the global average irradiance is always less than TSI/4.
If you postulate an average temperature = To , say 288 K and assume that superimposed on that there is a sinusoidal Temperature excursion having an amplitude =kTo, where k is some factor probably less than 1.0, the total BB radiant energy emitted over a full cycle of that variation is given by:
E = sigma To^4 (1 + 3k^2 + (kTo^4)/8 ) The last term is very small so could be ignored for practical considerations.
So a 10% Temperature cycle amplitude yields a 3% increase in total radiant emittance over a cycle. That’s a big amplitude, and 5% is more reasonable, giving 0.75% increase over the fixed Temperature case.
Yes I know there is a cycle period tau missing from that total energy radiated.
Tom Harley – for your enjoyment:
4 Dec: JoanneNova: Satellites show 2014 was NOT the hottest ever spring (or winter or summer or autumn) in Australia
http://joannenova.com.au/2014/12/satellites-show-2014-was-not-the-hottest-ever-spring-or-winter-or-summer-or-autumn-in-australia/#comment-1632701
2 Dec: WSJ Blog: Jun Hongo: Climate Change in Tokyo? City’s Weather Observation Station Relocates
If you find the temperature shown in Tokyo’s weather report to be a bit lower than what you feel today, you are not mistaken.
Japan Meteorological Agency on Tuesday began operating its new weather observation station in Tokyo which was relocated for the first time since 1964.
The observation spot moved approximately 900 meters west from its previous location in Otemachi to Kitanomaru Park near the nature-filled Imperial Palace. Annual average temperature in the new site is about 0.9 degree Celsius cooler than Otemachi, one of Japan’s largest business districts with a high density of people and buildings, according to the agency…
http://blogs.wsj.com/japanrealtime/2014/12/02/climate-change-in-tokyo-citys-weather-observation-station-relocates/?mod=WSJ_Japan_JapanRealTime
Thanks, Pat. BoM never ever refer to the satellite data, it doesn’t help the agenda they need to keep ‘our funds’ pouring in. Satellite data also makes them out to be wrong about their regular adjustments.
and Onwards marches the Great CAGW swindle:
4 Dec: Reuters: $100 billion climate finance goal ‘a very small sum’: UN climate chief
An international goal of providing $100 billion each year by 2020 to help vulnerable countries adapt to climate change impacts and pursue green growth is far off what is needed to achieve a global clean revolution, the U.N.’s top climate change official said on Wednesday…
Christiana Figueres: “$100 billion is frankly a very, very small sum”.
“We are talking here about trillions of dollars that need to flow into the transformation at a global level,” she added.
She said $90 trillion would be invested in infrastructure over the next 15 years.
“The world needs to decide: Are those $90 trillion going to go into clean technology, clean infrastructure, and above all resilient infrastructure, or is it going to go into the technologies and infrastructure of the last century?”…
The United Nations climate change secretariat presented a report on Wednesday aimed at throwing some light on the money that has already been provided…
But Figueres said countries still needed to agree what part of the climate finance flows identified in the report could be counted toward the $100 billion…
***Figueres described the $100 billion as a “numerical proxy” for the trust developing countries need to have that funding for their climate change activities is actually coming forward.
Governments at least have numbers they can work with now, which should help “puncture many myths”, she noted…
http://news.yahoo.com/100-billion-climate-finance-goal-very-small-sum-225750214–sector.html
you can always depend on Figueres for a good laugh.
most of the money (10 billion) collected so far has gone to set up the agency collecting the money. I kid you not.
reminds me of the department of indian affairs. billions spent to improve conditions for aboriginals in canada. until one divides the sum by the number of civil servants in the department of indian affairs. the result is almost identical to their salary plus benefits. very little $$ actually gets past the bureaucracy and out into the field to help those it was intended to help. instead it goes to feed the every increasing bureaucracy.
Sounds like the “charitable” Clinton Foundation that Hillary donates her speaking fees to.
Yeah ferdberple – I worked on a lot of DIAND projects back in the 70’s and 80’s. Not quite as bad as you painted but pretty bad. For some projects, studies showed that 80% of the budget was used in administration; for construction projects nearly 50% was used up in administration. In the end, that is why DIAND was much reduced and more of the money was given directly to the Bands to manage. Now we know how that has turned out in some of the Nations with certain groups within the Band getting more benefits than the group at large. But it is always like that, whether it is in Canada, the US, the EU, the United Nations, or the World Bank. But at least most of the money is now circulating in the proximity of the Bands rather than in Ottawa.
Ø Since 1950, when a human influence on global temperature first became theoretically possible, the global warming trend has been equivalent to below 1.2 Cº per century …
==============================
… only over 50% of which, according the IPCC AR4 summary, can there be over 90% certainty that human influence was the cause as per:
“Most of the observed increase in global average temperatures since the mid-20th century is very likely due to the observed increase in anthropogenic greenhouse gas concentrations”.
“Jelly beans in a jar” – we ain’t got no stinking jelly beans.
What we do have is a bit of “global warming” beginning to solidify on the Great Lakes.
Thank you, Lord Monckton, for your excellent monthly RSS summary.
The strategy of warmunists and leftist politicians is to do the slow roll. They’ll simply accuse the “deniers” that: 18 years, 19 years, 20 years, ad nuaseam, is “cherry picking”, and try to run out the clock until a natural warming trend eventually resumes.
The problem with this strategy is that the PDO 30-yr cool cycle just started in 2005, so it’s highly probable global temps will continue to fall/rise only marginally for another 20 years.
Accordingly, the only other option is to continually lower CAGW projections to keep them within the 95% confidence interval of observed temps. The denouement should occur when the revised projections fall below 2C, which is the current stated target to avoid catastrophic warming. Once revised CAGW projections fall below, or come close to 2C, then it makes no sense for world governments to waste 10’s of $trillions to obtain a goal which will be met even if no money is wasted on CO2 sequestration.
Numerous other problems exist for the warmunists: Arctic Ice Extents have shown steady recovery following the 30-year AMO warm cycle peak in 2007, Antarctica’s 35-yr Ice Extent growth, and the complete lack of global severe weather trends for past 50~100 years.
CAGW has become a joke. How much longer can they try to keep this charade going?
i think we can conclude that no matter how long the hiatus is, the bs will endure. As consuming as it is, I’d like to thank you and all those continuing this battle of attrition. Truth and freedoms are at stake. Everyone is looking for that tipping point in the argument that may not ever come in any of our lifetimes. The truth is, the most stable point in the arctic temperature during the year is during the peak of summer melt…… And the temperatures have been below average for several years now during this time. Obviously, the same can be said for Antarctica. These “grey areas” of the temperature maps don’t lie.
bs is the one commodity that never seems to be in short supply.
We don’t stick thermometers in the soil and sand to measure surface temperatures on land.
But we do measure the surface temperature of the oceans as part of “global average temperature.”
Why?
It is worse than that. We don’t measure the surface temps of the oceans. In the olden days, they threw a bucket overboard and hauled it up and stuck the thermometer in the bucket to take the water temperature. But as sailing ships gave way to diesel, the methodology was changed to automate it, using the temperature of inlet water for the engine’s cooling system, which comes in below the water line So, the measurement is actually from below ocean surface.
So, for about 1/3 of the earth we’re taking temps a few feet above surface, and for the other 2/3, we’re taking temps a few feet below surface. Then we average them as if they are measuring the same thing. 🙁
Thanks, David – that’s a pretty good description of the “surface temperature” problem.
If we stuck to air temperatures we could compare the measurements against interannual changes to LOD:
http://lh6.googleusercontent.com/-bhHlUSmFWfc/VH8u_rZgK5I/AAAAAAAAAiw/r13isbqjt5A/s800/LOD-vs-ENSO.png
Including water surface temperature as part of the global average equation makes that task impossible.
And yet, the ENSO plot correlates with LOD because the surface water heats the atmosphere without delay. Perhaps we don’t need to measure water temperatures at all.
yes, you are 100% correct. ground data refers to temperature in the Stevenson’s screen at a height above ground — a stationary point. In the case of ocean temperature data, they were the data supplied by ships on their way. Here the temperature is not at a stationary point. With all this pro-warmists groups go on talking on ocean storing temperature and rising temperature etc.
Dr. S. Jeevananda Reddy
Which just goes to show that convective heat transfer from the Troposphere to the Stratosphere trumps any increased heat storage capacity by carbon dioxide. Also, let’s not forget albedo affects from increased cloud cover. Does this mean that the Earth’s atmosphere is a complex system that is not conducive to modelling by a computer program? Oh yes it does!
New from BBC yesterday “Hottest year evah!” (weird weather etc. etc.)
Who needs experts when a lord will do. He should offer his view on ebola research , he’s equally qualified to comment on that. If all these skeptics’ arguments are so irrefutable and soundly researched they can be confidently submitted for peer review to the reputable scientific bodies , thats where it counts, not here in blogworld . But of course the global conspiracy against ‘real science’ is blocking the truth.
Nice ad hom and straw man work. Troll much?
An ad hominem attack would be against Monckton’s character , I’m attacking his lack of scientific knowledge.
You’ve missed the main point
You are correct: a global conspiracy against ‘real science’ IS blocking the truth. Western politicos and corporate / wall street hedge funds cynically exploit the true believers in the PC religion of environmentalism, any questioning of your faith results in horror and the need to burn the heretics. “Troll” is too nice a term for those who will eagerly toady to the PC priests in lighting the heretic burning fires, while refusing to see the fact that labor, wealth, and our future is ‘strip-mined’ for the oligarchy to get even richer.
Yea, who needs “experts” who “hide the decline”, “use the Nature trick”, or “we’ll redefine peer review if we have to” to keep publications they disagree with out of the literature.
The peer review process is corrupted in climate “science”, and it does make it difficult for new ideas to get published. There was a global conspiracy to keep skeptical data and research out of the literature, and thanks to climategate it was exposed, along with the tireless efforts of Anthony and Steve McIntyre etc.
It’s a tough pill to swallow for the warmists, that CO2 keeps rising, but temperatures have remained flat, in direct contradiction to the poor models. There are many journal articles in peer reviewed literature acknowledging the plateau in temperatures, and they are desperately trying to explain this to avoid losing face.
Its always the last resort of those whose submissions are knocked back by the scientific process to claim corruption.
no this won’t be what is touted in Lima…instead:
3 Dec: UK Independent: Steve Connor: No standstill in global warming: 2014 will be world’s hottest year ever
Climate researchers will use the latest data to puncture the myth that global warming has stalled and will urge negotiators at the climate change negotiations in the Peruvian capital Lima to take note of what they see as incontrovertible evidence that the world is on path towards dangerous global warming…
Christiana Figueres, executive secretary of the UN convention on climate change, said: “Our climate is changing and every year the risks of extreme weather events and impacts on humanity rise.”…
The global mean temperatures for January to October are based on worldwide instrument readings compiled by the Met Office and the University of East Anglia (UEA), known as the HadCRUT4 dataset. The Met Office said that the final value for the year will be very close to its central estimate of 0.57C for 2014, a forecast it made at the end of last year.
“Spatially, 2014 has so far been warmer than the 1961 to 1990 average almost everywhere, the main exception being central and eastern parts of North America. For Europe, many countries in northern and eastern parts will likely have had near-record warm years,” said Phil Jones, director of UEA’s Climatic Research Unit…
http://www.independent.co.uk/environment/no-standstill-in-global-warming-2014-will-be-worlds-hottest-year-ever-9901094.html#
Steve Connor is as biased a reporter as you will find, turning out nothing less than climate propaganda from his Independent column, which is itself left-leaning and utterly sold on climate catastrophe.
‘Hacktivist’ sums him and his work up nicely.
When temperature goes up pro-warming groups sensationalize this but why they are not doing the same when temperature comes down?
Dr. S. Jeevananda Reddy
Worse, they torture the station data until it confesses to warming then publish it as “the hottest year evah”
It is interesting that those who have cherry-picked their way into comfortable nests of CO2 complain that others are doing what they did. He who does it well knows best I suppose.
If there was ever something cherry-picked it is the claim that CO2 caused the warming from 1976 to 1996. Prof Q Lu from Waterloo Univ calculated the correlation coefficient of temperatures and CO2 from 1850-1970. It is (R= -0.05). So much for that theory.
And the same from TVNZ this evening, accompanied by film of forest fires, dried out river beds, dropping reservoir levels, Australian men cooling off under cold showers, etc. Then our weather presenter said “In contrast with what is happening worldwide, the hottest year on record in NZ was 1998”. No further explanation or excuse given. They really don’t know what they are talking about, but just swallow the religious message without thinking!
don’t expect Shukman to explain that everyone has admitted to the Pause in so many different ways:
3 Dec: BBC: David Shukman: World on course for warmest year
And he (Secretary-General of the WMO, Michel Jarraud) asserted that the new figures confirm the key trend in climate change: “There is no standstill in global warming.”
This is a reference to the hotly-debated “pause” in global warming which has seen no major increases in temperature since 1998. …
The WMO’s report on the state of the global climate is published every year to coincide with the UN’s annual negotiations on climate change, this time under way in Lima in Peru.
http://www.bbc.com/news/science-environment-30311816
***more than “remarkable” mr. stott – try “unbelievable”:
3 Dec: UK Financial Times: Pilita Clark in Lima: This year on course to be warmest on record
To determine such a link, scientists use climate models to see how likely an abnormal event would be without the human greenhouse gas emissions driving global warming. Mr (Met Office Peter) Stott said it was ***“remarkable” to see a record year of heat occur in the absence of an El Nino…
http://www.ft.com/cms/s/0/95c1bd64-7ada-11e4-8646-00144feabdc0.html
There is obviously something wrong with our thermometers …
You’d be surprised.
That’s why we torture the data until it confesses to warming. Those thermometers just can’t be trusted!
(/sarc for those who need it)
Current absorption of solar energy.
http://www.ospo.noaa.gov/data/atmosphere/radbud/gs19_prd.gif
Snowing here in Normandy (well to the South of anywhere in England).
I could imagine that the people who run the RSS satellite coming under increasing pressure to ‘do something’ about this embarrassing pause. It only takes one ‘team member’ in a critical position within an organisation to subvert it. Either changing the data – unlikely or just performing an incorrect re-cal to give a slightly warmer temperature.
Difficult to make a change that could get through QA checks, but not impossible.
Reblogged this on Wolsten and commented:
And yet we pay insane amounts of subsidies for energy due to blind faith in impending climate catastrophe. Not sure why this isn’t a major political scandal. O, wait a minute, yes I do. All parties signed up to the Climate Change Act so they are all to blame.
When the November 2015 RSS data are available, how many years and months of zero global warming will have occurred?
before or after ‘adjustments’ ?
I predict that RSS will be decommissioned if its data cannot be tweaked to show the same trend as the other datasets simply by removing its funding, possibly even claiming that the satellite is broken because it fails to show the “obvious” warming that media is reporting.
[snip – fake name, fake email address, policy violation -mod]
[Snip. Despicable, insulting comments like that belong on Hotwhopper, not here. Insulting readers with name-calling is not the way to get comments approved. Also, get a valid email address or don’t comment here. ~mod.]
Christiana Figueres is back-tracking fast – did someone tell her it was insensitive/insane to say $100 billion annually “is frankly a very, very small sum”?
3 Dec: Reuters: Alister Doyle: UN sets modest hopes for climate pledges at 2015 Paris summit
Christiana Figueres, head of the U.N. Climate Change Secretariat, told Reuters TV at 190-nation talks in Lima on limiting warming that it was unrealistic to expect a miracle solution at a U.N. summit in Paris in a year’s time…
“We already know, because we have a pretty good sense of what countries will be able to do in the short run, that the sum total of efforts (in Paris) will not be able to put us on the path for two degrees,” she said.
“We are not going to get there with the Paris agreement … We will get there over time,” she said during the Dec. 1-12 climate negotiations in Lima to prepare the Paris deal…
The mood at the Lima U.N. talks is far from the run-up to the Copenhagen summit in 2009, when governments tried and failed to agree a U.N. climate deal. At that time, many nations hoped for a sweeping new treaty.
Figueres said hopes this time are lower. “It is not about knocking people over the head and saying ‘now we have to miraculously solve climate change’,” she said…
The long-term goal is to reduce greenhouse gases to zero by 2100, a target she says will require leaving three-quarters of fossil fuels in the ground. “We just can’t afford to burn them,” she said.
In what Figueres called bad news, the U.N. weather agency said on Wednesday that 2014 is on track to be the warmest year on record, or among the very warmest
http://www.reuters.com/article/2014/12/03/us-climatechange-lima-figueres-idUSKCN0JH2Q320141203
a target she says will require leaving three-quarters of fossil fuels in the ground. “We just can’t afford to burn them,” she said.
=============
having used cheap fossil fuel to industrialize, the EU fears competition from China and India is they also have access to cheap fossil fuel.
if we leave 3/4 of the fossil fuels in the ground, imagine the black market that will spring up. if we think drug wars are bad, think again what will happen once organized crime becomes the sole supplier for fossil fuels.
I could see special large sized submarines commissioned to carry natural gas past the naval forces interdicting its supply. If they worked it out right they could put all the connections underwater and hide the deliveries from prying eyes and call the submarines “Undersea Global Warming Research Vessels”
Isn’t this the case already? Saudi’s, Russians, Venezuela, Iraq, Nigeria, none of them our friends. Drill Baby Drill…
Mears is a nasty piece of work, isn’t he? Denialist here, cherry pick there and then he goes on to try to make the models look as perfect as possible but lo and behold ………. they aren’t. OoooooH the pain he has in his heart.
What does the longest running record ( CET) show ? http://www.metoffice.gov.uk/hadobs/hadcet/
Because the underlying natural variation is 1/f noise then that means the noise is fractal meaning that we can see the overall pattern reflected in subsegments .
And if we look for 2008 to mid-2010 we do indeed see the 1910-1940, the 1940-50 drop and then the rise from 1970-2000 followed by the 2000-2015 pause.
And therefore (by a magic waving of the hands argument which you shouldn’t take too seriously) … what follows after 2015 is indicated by the sharp decline shown on the graph from mid 2010 – 2011.
This decade will be known as the “2nd global cooling scare”, followed by the “2nd global warming scare”, “the third global cooling scare” and finally by the “climate change scare” as we re-enter the 2nd pause.
Is global temperature a Tweedie distribution?
http://hockeyschtick.blogspot.ca/2014/08/new-paper-finds-climate-change-is.html
read the rest…
3 Dec: BBC: Why has the year 2014 been so hot?
Q) I thought there was a pause in global warming?
A) Global mean surface temperatures rose rapidly from the 1970s, but were relatively flat over the 15 years prior to 2013.
Many studies have reinforced a link between uptake of heat by the oceans and the “pause”.
The high surface temperatures of the Pacific and other parts of the world’s oceans might suggest that the pause is coming to an end, but there is no evidence yet to support this.
Climate scientists need more than one warm year to discern underlying trends.
http://www.bbc.co.uk/news/science-environment-30311822
Some day in the future, humanity will look back on this time, soon to be known as “The Peak”, with fond longing as temperatures drop for several decades. They’ll somehow implicate human activity or emissions of some compound or another and try to legislate against it. Mortality from cold will continue to mount as energy is needlessly rationed.
You should read Fallen Angels by Larry Niven & co. It’s an excellent treatise on how greenies will (not) drop an invalid theory in the face of overwhelming evidence to the contrary. Even if fictional, you can see all of the arguments & abuses being committed today.
Larry Niven is among my favorite 3 authors (another being Isaac Asimov, his almost last book about carbon alarm notwithstanding). My friends stare, aghast, as I casually reference tasps, Scrith, and Pak Protectors…
Just a caution regarding this frequently abused term “statistically significant” as saying any trend is “statistically significant” is tantamount to saying it is Mann-made.
What this is actually trying to say is: “is this pause abnormal for the climate”. But that in turn is really the same as saying “is it within normality” and to know that we have to know what is normal.
Unfortunately, as far as I can see all these tests for statistical significance are false, because they rely on the concept that the underlying natural variation is such that the temperature one year is independent of the next. But clearly global temperature tends to be “sticky” so that we see decades when it is high and decades when it is low, so warm years tend to follow warm years and cold years tend to follow cold years. So it is perfectly normal to have a run of warm years as it is perfectly normal to have a run of cold years. And that applies as much to centuries and decades. So, we also see centuries when it is low (little ice age) and centuries when it is high (medieval warm period).
And once you accept that global temperature is “sticky” then these statistical tests have very little meaning.
To put it simply, we have to know what is normal before we know what is abnormal. So, “is it normal to have a period of three decades with warming as seen from 1970-2000 which caused this scare?” The answer is that we saw the same warming from 1910-1940 and CET shows many similar periods.
Likewise this article when it asks “is the pause statistically significant” is really asking the question “is a pause like this normal for the climate”. This is actually the wrong question because when we say “the pause is statistically significant” we are actually saying the “the pause is abnormal” … i.e. the pause must be mann-made.
The real answer, if one assumes the 1/f noise model, is that the pause is not statistically significant and nor was the late 20th century warming
yes. all too many scientists assume climate is a “normal distribution” and then go on to classify anything outside of 2 STD as “abnormal”. however, time-series data in nature is almost never a “normal distribution”
as soon as you treat the data correctly, “abnormal weather” disappears. 1/f noise means that the longer the time period, the bigger the natural variability you should see. If you have 10 years of data, you should see 1 in 10 year storms. If you have 100 years of data, you should see 1 in 100 year storms.
What is changing isn’t the weather, it is the length of the data. We see record temp hot and cold because our records are increasing in length year by year.
Bingo. In “Applied Statistics and Probability” at the U., I sometimes got dinged for setting up the problem incorrectly using the wrong dist. I did the calculus correctly, but the setup was wrong so the conclusion was wrong. Serious stats work is hard. Climate models probably can never be accurate with linear sequential computers, even if they occupy acres and soak up terawatts. To really model this stuff properly, the models should be matrices of differential equations at very fine granularity. We simply do not have the tech to do that yet on a global scale. Electrical engineers use such matrices for control systems development, but we take liberties with the math and the matrix dimensions are very small.
Indeed.
Although I’m fairly ignorant of statistics, I have the abiding feeling that “statistical significance” is used too often without proper reflection on what it intended to mean. It would help if every time it is used it would be explained by saying, “That is, if we make the following assumption, a trend greater than the observed one has less than a, say, 5% probability.” The important point is what precise assumption is being. I doubt that writers always have the assumption in mind, and, when then do, that most readers know what it is.
On that same note, at least this non-statistician finds it hard to recall each time what the term “model” means in this context. Those of us thus afflicted might be helped if we were reminded, for example, thus: “If we assume a zero-trend process with 1/f noise, a trend at least as great as the one observed has less than a 5% probability.”
I have just remembered a website I have which predicts the future of global climate which might help to explain 1/f noise
http://uburns.com/
Note: it just displays a random 1/f pattern so you can see the type of natural variation we expect from a system like the climate with 1/f noise.
4 Dec: UK Daily Mail: Press Association: 2014 set to be world’s hottest year
Professor William Collins, professor of meteorology at the University of Reading, said: “The likely record warm temperatures this year add to the evidence that global warming is continuing its inevitable upward trend, and that we were right not to be lulled into a false sense of security by the slower warming of the last 15 years.”
Energy and Climate Change Secretary Ed Davey said: “More record warm temperatures in the UK and across the world are yet more evidence that we need to act urgently to prevent dangerous climate change.
“UK actions such as our doubling of renewable electricity and our stretching targets for cutting carbon are a good start but we must be frank and acknowledge there is more to do.”…
WWF UK chief executive David Nussbaum said: “With countries meeting in Lima to lay the foundations for a climate deal to be agreed in Paris next year, this is yet another reminder of how our global climate is already changing.
“The UK has already seen increased flooding and other extreme weather events over recent years. Further climate change increases the likelihood of more of these in the UK and across the world. We need leaders to turn down the heat, by turning up their leadership on climate.”
(Sorry we are not currently accepting comments on this article)
http://www.dailymail.co.uk/wires/pa/article-2859232/2014-set-worlds-hottest-year.html
Gotta like Monckton
Eugene WR Gallun.
Lord Monckton, how long do we have to look at no warming (or even cooling) with CO2 going ever upwards before we can say that CO2 is not the cause of warming?
we will not be able to say CO2 is not the cause until the money runs out. at which point a new cause will be found.
‘Global Warming’ is so yesterday. It is all about climate change now, and weird weather.
If there was any weird weather.
Four articles in the last two days with plots showing dead level trend lines. Methinks the lady doth protest too much.
Pay close attention to these flat lines, Brandon; they have a message for you.
mpainter,
And what message does this trend say to me? http://www.woodfortrees.org/plot/hadcrut4gl/from:1945/to:1975/plot/hadcrut4gl/from:1945/to:1975/trend
Meanwhile, back at the ranch…
For the third day in a row our city newspaper has run a climate change story. Each predicts catastrophe, record warming and the last ditch effort needed to save the world through binding world accords.
Folks, we are losing ground to media propoganda and we need a strategy here.
Open to suggestions… there IS no strategy. They have billions of dollars in media holdings, we have reality on our side. Don’t even think about Foxnews, it’s essentially poison to anything left of… hmm… Ayn Rand?
This is going on everywhere – the media tells everyone something demonstrably wrong, the only real question is the depth of their credulity. I try to engage people on forums, youtube videos, etc. and am relentlessly hounded by paid believers, and often my comments deleted.
the media have forgotten the story about the boy that cried wolf. they are hoping that a lie told often enough will become the truth.
This is one of the posts that Sou (Miriam O’Brien) has chosen to comment on at HotWhopper. See my post at MoreOnMiriamO’Brien’sHotWhopper:
http://moreonmiriamobrien.wordpress.com/2014/12/04/miriam-obrien-says-christopher-monckton-picks-some-cherries-plus-rss-and-the-southern-hemisphere/
It includes a link to an archived version of Miriam’s post.
Whose comments did she pick to misrepresent?
Is it just my imagination that she left off the last 4 years of data from her graphs?
Well, I was about to read it when I saw who wrote it. Odious old bigots don’t interest me and Monckton is just that. Yes, I’m a skeptic on warming but I draw a line when it comes to people like Monckton.
You must be fun at parties!
And I bet he’s got lots ‘n’ lots of friends!
I bet at parties he is a lot funnier than you
Eugene WR Gallun
“Cherry-picking”?
If they think the 1997-1998 range is cherry picking, then start in 2000, 2001, 2002, 2003 or 2004. The 10-15 year trend shows the same as the 18 year trend.
UAH, in its forthcoming Version 6.0, will be taking steps to reduce the warm bias in its global-temperature reporting.
Whoah! Really?
My prejudice had always been that UAH had had it right. Partly because of the newer, better equipment thingie, but also, well, just, you know, prejudice.
OTOH, I find the history interesting. First UAH incorrectly reports cooling, but then corrects it by accounting for sat. drift. But it is overcompensation. Meanwhile, RSS starts up and is reporting lower trends than UAH.
And in all that, UAH is essentially skeptical and RSS is essentially the opposite. I always thought that was de facto evidence that both outfits are honest and just trying to get it right.
So now it turns out that RSS may have had it right after all. And we also need to consider LT trend is an upper bound and surface trend should be over 20% lower. This just happens to be what our “unperturbed” Class 1\2 (well sited) USHCN surface station set shows (but this is only land surface, of course).
[snip – fake name, fake email address, policy violation -mod]
[This is “Siberian Husky”. Any more sockpuppetry will result in his comments being unapproved. ~another mod.]
Found this today…..Good read.
http://www.forbes.com/sites/jamestaylor/2014/12/03/media-go-into-panic-how-to-spin-record-cold/2/
Kenny,
Thanks for that lnk. Some of the comments show the really ignorant mind-set of the alarmist lemmings. They constantly use ad-homs and personal attacks, instead of using rational scientific arguments.
That’s probably because they don’t have any good arguments.
It’s a pretty safe bet that
ManBearPigthe warming will continue merrily escaping into the deep oceans, to the utter dismay of the Warmunists and glee of Climate Realists, such that by next November, the length of the Halt will be at least 230 months. Their great hopes for a super duper El Nino have been shattered by what appears to be an El Nono. They just can’t seem to catch a break from mother nature, though they do keep trotting out the 2014-will-be-the-warmest evah meme in desperation. It’s quite amusing actually, to see them squirm.MikeB
December 4, 2014 at 2:29 am
//////////////////////
Mike
it is a pity that you did not attempt to answer the question. Everyone knows the maths, but that was not what the question was getting at.
Solar Energy in is received in bursts: at the equator approximately once every 12 hours, and at the poles there are periods of about 3 months when no energy in is received, whereas energy out is a 24/7 some 365 days of the year.
More importantly, the K & T energy cartoon takes no account of the differences between the eqatorial areas of the planet, which have a greater proportion of oceans where the effect of Solar absorption and DWLWIR absorption is significantly different to that at higher latitudes, and very high latitudes the low grazing angle of incoming Solar and the reflectiveness/albedo of ice.
The K & T energy cartoon does not describe planet Earth. One needs to see what is actually happening 24/7, and the budget and effect of Energy being inputted into the system at all the various latitudes since effect and response is fundamentally different. Averages distort and conceal what is actually going on, an regretfully that inhibits our understanding. The K & T energy cartoon needs to be torn up, and replaced by one that actually describes planet Earth and the processes going on.
Something that’s always bothered me about the global warming theory is that I don’t recall any of the radiative heat transfer associated with it being taught in engineering heat transfer classes. Backradiation from IR absorbing gasses? That was never included in the engineering heat transfer accounting process as far as I can remember. Maybe it was too small to worry about, maybe its more of a physics thing, or I missed that class. So then I asked myself what about using IR absorbing gasses in real world engineered products such as energy efficient windows? Surely just a little bit of energy efficiency improvement there from IR absorbing gasses would translate into better products and more profits. So why aren’t energy efficient windows filled with carbon dioxide to capture the IR heat leaving a room? Because it doesn’t work, you can’t notice the effect of CO2, convection dominates, as well as coatings. The effect of CO2 is puny with windows just like it is puny on planet Earth, where convection and coatings (clouds) dominate. Perhaps someone can dig into the parallels between engineered windows and global warming further, I thought I’d just pass my adventures along. Below is the link to the CO2 sudy.
http://buildings.lbl.gov/sites/all/files/29389.pdf
With the current solar cycle now past peak and the major ocean cycles in or entering cold phases, I predict a small drop in temperatures, as a result by this time next year, my guess is that the pause will be 19 years, 6 months.
All rollicking fun, of course, but one single comment. You speak of linear trends e.g. “1.4C per century”. These are not “trends”, they are slopes. Slopes can reasonably be used to extrapolate a linear function, but the warming expected from CO_2 is not a linear function. In particular, the warming expected from CO_2 as a function of its atmospheric concentration is:

 C
C C, or it will be one degree C warmer than it is now in 2100 if CO_2 is 600 ppm. 800 ppm?
 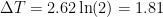 C warmer than it is now. A gaudy 1000 ppm — 0.1% CO_2 in the atmosphere, a number that is the right order of CO_2 concentration for most of the last 500 million years —
 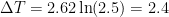 C warmer than it is today. This is a bit worse than RCP 9.5, a scenario that assumes that we shut down the nukes, stop burning methane, destroy all solar and wind and hell, blow up the hydroelectric dams and do nothing but burn coal to make electricity and supply it to every human on Earth at 1st world rates of consumption per capita.
where the offset is chosen to match the anomaly to HadCRUT4, the base of the log is selected to match the concentration in the initial year measured at Mauna Loa, and where the de fact sensitivity is obtained from a two parameter nonlinear least squares fit of the form to HadCRUT4 from 1850 through the present.
From this the total climate sensitivity can be given in the usual terms of doubling CO_2 concentration:
The log function, of course, has a decreasing slope, so if CO_2 grew at most linearly one could argue that this is an upper bound on probable end-of-century warming. However, CO_2 concentration is increasing at a nonlinear rate.
It is remarkably difficult to extrapolate observations of the current rate to the year 2100. There are simply too many variables. If, for example, Lockheed-Martin is correct and they have fusion licked to the point where they successfully demonstrate a 50 MW plant that would fit in the back of a semi’s cargo space, we probably won’t even reach 500 ppm. A simple extrapolation of the best sort-of-exponential fit to the Mauna Loa data from 1959 to the present yields around 700 ppm, close to scenario RCP6.5 in IPCC parlance. A more aggressive increase might take us to 900 ppm. A less aggressive increase might take us to 600 ppm or less. In the end, it isn’t a linear trend in time that matters — the only thing that matters, granting that the best fit to CO_2 above is itself extrapolable, is where you think CO_2 will end up.
As for the best fit itself — there are reasons to think it is extrapolable, reasons to think that it isn’t, but they can be discussed when I publish all of this and the associated graphs on WUWT which won’t happen until I shake free enough time to finish the article, difficult with final exams looming. In the meantime, the curve itself predicts (or rather, fits) the 0.8 C rise not just from 1900 but from 1850 — all of HadCRUT4 — if one builds a simply sort-of-exponential model for CO_2 increase from 1850 to the present that smoothly matches Mauna Loa. However, a mere glance at HadCRUT4 over that interval suffices to demonstrate that a straight line linear trend in time does not fit the increase, not at all, and that in fact the temperature increase is steadily accelerating because the exponential increase in CO_2 over time slope wins out over the logarithmic decrease in temperature over increasing CO_2.
The bottom line is that the right game to play is the TCS game. Pick a number, any number. Theory supports TCS anywhere from just under 1 C to around 1.5C. Dress this number with a decent range of uncertainty beyond that, because linear feedbacks positive or negative will track the log and could increase or decrease TCS a bit. Don’t be biased and assume that you know which way it will go — let the data speak, and remember that the more parameters you add to any model to improve on the basic, theory supported exponential fit given above, the less one can count on the resulting model as each additional parameter comes at a Bayesian “cost” and eventually you can fit elephants and make them wiggle trunks. Then dial in whatever you think CO_2 will be in 2100. 600 ppm? No problem.
Personally, I think 600 ppm is pretty reasonable — it allows for a fair bit of short-run increase in burning coal to help the world’s neediest people but then assumes that pure economics and technological advance will make coal burning plants ECONOMICALLY undesirable long before 2100. Photovoltaics, batteries, natural gas, both Uranium and Thorium fission, and the long-running dream of fusion, or something nobody has thought of (yet) is likely to change everything. Fusion alone would change everything.
Now, I’ve tried to dress the log-only model three different ways so far — with an empirical harmonic variation (which works incredibly well, too bad I have no clue what its cause could possibly be), with the PDO data back to 1900 (which doesn’t help at all, so no, it isn’t “the PDO”) and with volcanos. As far as R can tell, after at least crudely fitting VEI to observed transmission at the top of the troposphere on Mauna Loa, have basically no effect on the climate whatsoever from 1850 to the present — sadly I cannot go back to 1800 and see if VEI 7 Tambora actually had a noticable effect on the climate. This precisely matches Willis’ observations and supports the validity of his “hunt the volcano” game. Even Pinatubo (VEI 6) is indistinguishable from the normal climate quasi-oscillatory variations around the CO_2-only curve, although one can get a TINY improvement in the fit back to 1850 including volcanoes.
What I haven’t done yet (but would like to) is see if any of the quantitative measures of solar activity, fed into R with the baseline CO_2-only fit, do anything at all. I’m guessing that the answer is no, but I like to see for myself. So far, I’m rejecting hypotheses right and left, so why stop now? The only additional hypothesis I can’t reject is the one I can’t support — a pure harmonic variation of amplitude 0.1 and period of 67 years, which produces an amazingly good fit to all of HadCRUT4 and predicts/fits the pause “perfectly”! Perfectly in statistical terms, of course. And no, 67 years is not meaningfully harmonic with Jupiter. Or Saturn. Or the PDO. And in a chaotic system it doesn’t need to be! It could just be an accident!
Nothing in this says that the fit above is correct. For one thing, it won’t work to describe global temperature over the last 1000, 2000, or 10,000, or 100,000 years. For another, I don’t have any reliable data — data worth the effort of fitting — over any of those intervals, not for global temperature. I don’t particularly trust the early part of HadCRUT4, and don’t trust GISS at all (not with a man in charge who was painting lurid pictures of 5 meter sea level rise by the year 2100 ex cathedra from a position of nominal sober responsibility — direct evidence that any trace of scientific objectivity was long since fled and making his organizations treatments of the data highly suspect). I don’t trust the models used to infill, interpolate, extrapolate, krige, and otherwise deal with the enormous sparsity of the data in the 19th century and earlier, where there were still enormous holes in the global map of scientific observations period, and even if I did, fitting a model with a model is one of the deadly sins of modelling theory for which I can offer little excuse for even when I do it myself, but at least in the case of HadCRUT4 I can imagine that there is a foundation of sorts in actual thermometric data without too much systematic bias. Bias of any sort — say its neglect of the UHI effect — would in all probability reduce the best fit TCS and hence reduce all of the “contingent predictions” above per CO_2 scenario.
Hope this helps. And yeah, yeah, I’ll print out the actual fits, put up the R source of the routines that fit the data along with the data itself, and so on, “soon”. As soon as this crazy semester is over, most likely. But in the meantime, they are pretty solid. For grins, here is the money figure that I suspect won’t change much between now and then:
http://www.phy.duke.edu/~rgb/Toft-CO2-PDO.jpg
Really, this says it all.
rgb
Now some might say that if you look at a snapshot of a chaotic system you will always find some sort of cycle that has no real basis and won’t therefore pan out.
But I’ve found a correlation with Mars, Venus ands Mercury (and the Sun) at this respected website.
Sure, but in my case the data contains what, 2.5 periods? Do a fourier transform of the data to get that as an important harmonic over 2.5 periods and people would laugh at you. And I can’t explain it. And yes, in a chaotic system it may not need “explanation” (or be susceptible to any simple one). But I can and will try to “eliminate the usual suspects” in a two-factor model, CO_2 fit as an ln function and “whatever”. The only rule is that “whatever” has to be hooked to data, not to a statement like “that must be the PDO”. There is data on the PDO, and it doesn’t improve the fit to include any linear transform of the data (and no reason to think on examination that any other reasonable transform would work). Volcanoes are really absurd as an explanation. VEI is a log scale, and you have to reach VEI 5 or greater to see as much as a transient (2-5 year) dip in TOT insolation. VEI 4 is just noise on a log scale. VEI 5 is conditional — El Chichon blew out lots of SO_2 and produced a dip almost as large as Pinatubo in TOT insolation, but Mt. St. Helens, also VEI5, didn’t make so much as a blip in TOT insolation. It’s not just about the volume of ejecta, in other words — its chemistry is arguably much more important (as was pointed out in a recent post here, IIRC). VEI 6 Pinatubo you have to kind of squint your eyes and believe in fairies, but there is arguably a tiny dip that you can at least TRY to attribute to Pinatubo even though it could just as easily have been produced by pure chaotic noise like all of the other similar dips throughout the record when there were no big volcanoes. Besides, we have TOT data from Mauna Loa back into the 1950’s — we don’t have to guess. There are three, and only three, episodes where volcanoes COULD affect the temperature, and there is damn little evidence that they did even when you know exactly where to look.
Correlation is not causality, and I think it is wise to apply a Bayesian filter to hypotheses before admitting them even speculatively into a discussion of models, especially when you are trying to fit something that could easily be noise over an enormously short baseline. I can see no possible way non-Earth planets could affect Earth’s climate. Really. Even if they did, it would be via doing something to the sun, and nobody has been able to build a convincing model connnecting the sun to planetary climate outside of the obvious — it’s the primary source of energy. But I’m finding the climate (or rather, global average temperature MODEL fit to an explanatory MODEL) to be enormously insensitive to nearly everything, at least over the last 165 years. Look at the graph! There isn’t much left to explain!
One could, of course, assert another cause that completely alters this fit — a supposed “slow natural variation” of some sort that we cannot compute or fit with any model because it is a non-Markovian result of long-time-scale dynamics we are clueless about. And I fully acknowledge the possibility, and agree that this makes the fits above far from certain as future predictors. All one can do is note that:
a) They are damn good fits. As these things go, remembering that we are really talking fitting a less than 1% effect in absolute temperature variation and that even HadCRUT4’s errors — which for once I actually plotted on the data, note well — are likely too conservative, especially in the 19th century. But they are substantial in the 20th as well! Even CO_2 only rarely comes out of the error bars — the harmonic variation addition damn near shoots them right down the middle. The latter means basically that even if one does find additional stuff to explain it, it had better have a period of 67 years and amplitude of 0.1 C OR greatly increase the model complexity and hence decrease the confidence one can rationally give the model without future verification.
b) My two-parameter, physics based fit beats the pants off of nearly all of the CMIP5 models. It wins hands down, even without the harmonic correction. WITH the harmonic correction — well again, in order for the CMIP5 models singly or collectively to be taken seriously, they need to be able to explain a 67 year pseudoharmonic variation around a CO_2-linked variation with a TCS of 1.81 because the latter works!
Any working model has to basically reproduce my model above, or it won’t work! It is difficult indeed to see how anybody could build a model that would beat it, at least not on this past data. And this model suggests that the climate is enormously insensitive to nearly everything. There just isn’t a lot left to explain, and while one can always introduce additional causes with lots of confounding covariance and get the same result, one has to be very careful when doing so as elephant fitting looms as the ultimate empty exercise in statistics. Too many parameters and you will succeed, but have no way of believing it until you see it extrapolate.
This model might extrapolate for a significant value of might. Time will tell. I wouldn’t be at all surprised if it didn’t, though. The Earth is a chaotic system with unpredictable large scale long time dynamics.
Dr Brown,
This is good work – IF we can believe that the adjustments to the data in HADCRUT are appropriate and that their method of homogenizing and extrapolating the raw readings are appropriate and IF we can accept that the stations themselves are actually representative of the climate zones they represent. The problem is you may have just shown the bias of the database as they have been under tremendous pressure to match the average anomalies to CO2 concentration in the first place. They may be exactly correct (if somewhat over-confident of their error analysis), but I am not convinced yet that the method of slicing and dicing provides for good data to analyze. Given all that, I for one will look forward to reading your article.
In about 100 years we should be able to repeat this with the satellite data sets and get a better read. I am not sure the thermometer record ever passes the sparseness tests of information theory to be useful anyway.
Dear Owen, is the scaling of standard error?
 of our knowledge in the present, and I’m not certain I believe the present error estimate of roughly 0.1 C as that seems incredibly — in the literal sense — optimistic.
Absolutely. As I noted in the post, modelling a model is likely to give you a great fit — to the model — and I share your cynicism about how well we know the increasingly remote past temperatures (by “well” I mean specifically, “within what accuracy” as opposed to even the statistical “precision” of the measurments themselves). I suspect that a brutally honest appraisal would conclude that we know them far, far better in 2014 than in, say, 1880, but a mere glance at HadCRUT4’s own published error bars says otherwise. It says that the total error range in 1880 was around 0.3C (roughly symmetrical, although for some reason they post upper and lower bounds separately as if they have some quantitative basis for doing so, which I doubt). In 2014 it is 0.2 C. Really? We have only twice as much data in 2014 as we had in 1880, because
It is this sort of thing that is so puzzling. On the face of it it is completely absurd. There is simply no possible way our knowledge of the global temperature anomaly in 1880 was within a factor of
But it is not for me to critique the global temperature anomalies, at least not today. Today I’m taking HadCRUT4 at face value and fitting it with a bit of physics (or rather, that’s what I’ll be doing soon). I doubt that they cooked HadCRUT4 to produce this climate sensitivity because if they did, wow does it fall short! It predicts less than the AR4 median estimate under the worse than worst case scenario, the science fiction scenario, of a cCO_2 of 1000 ppm by 2100. For a more reasonable 600 ppm it predicts one whole degree C of additional warming.
This is a reasonable number, hoist to the top of the flagpole by their own petard (to brutally abuse a metaphor or three) so let’s all salute it! HadCRUT4, extrapolated by a physically motivated two paramter fit, predicts 1 C of additional warming by 600 ppm. Now let’s indulge in some serious cost-benefit analysis in the extreme measures we are taking and their cost in both human life and graft and corruption to prevent a catastrophe that is, in fact, unsupported by the data. If anyone had done the fit I present above first, the game would have been over. There is really nothing more to say. The upper bounds of catastrophe are around 2.4 C warmer than today, and that’s only if cCO_2 reaches 1000 ppm, which is unlikely in the extreme if we did absolutely nothing.
rgb
IMO, HadCRUT4 is every bit as manipulated as GISSTEMP, by Jones’ own admission. Neither “surface” record is worthy of any statistical analysis aiming to reflect the real world. Without all their unwarranted (to say the least) “adjustments”, any remotely valid historical series would show the world now warmer than 320 years ago, during the Maunder Minimum depths of the LIA, & even 160 years ago, at its end, but probably not than 80 years ago, IMO. (I seem to recall Jones also owning up that in the raw data, the 1930s were as warm as now, but can’t swear to that & haven’t looked for the reference, so feel free to ignore this sentence, & apologies to Dr. Jones if incorrect.) However, the US was definitely warmer in the ’30s than now.
Chichon doesn’t show up well in temperature data because it coincided with a super El Niño. As a then rancher, I well recall the weather effects of Pinatubo. But volcanic eruptions of VEI 6 & 7 don’t affect climate, even tropical ones. Their effects don’t last long enough. The world’s climate system soon returns to whatever its underlying forces dictate. It is possible however that different climate states affect the frequency of seismic activity. If big eruptions don’t show up in the “data”, it’s because the “data” are corrupt, not because it doesn’t happen. The atmospheric effects are recorded in historical documents as well as valid weather data.
IMO, the effect of CO2 is so slight, given the plethora of feedbacks on a homeostatic earth, as to be negligible. I agree with Reid Bryson, Father of Climatology & historically brilliant naval meteorologist, on the effect of doubling CO2. To green the planet further, 800 to 1300 ppm would be ideal, ie at or below real greenhouse concentrations. More than that might conceivably possibly cause some non-climatic problems, although I doubt it.
You are of course right about historic CO2 concentrations. For the first half of the Paleozoic Era, the order of magnitude was ten thousand ppm (since coefficient of ~3 is the “halfway” point in logarithmic comparisons, & concentrations were 4000 to 7000 ppm or more), then on the order of 1000 ppm for the rest of the Paleozoic, Mesozoic & early epochs of the Cenozoic (~350-3000). The only notable excursion was during the Late Carboniferous/Early Permian Period ice age, but even then the order of magnitude was borderline with the hundreds (that possibly 350 ppm). The drawdown of CO2 from the Devonian Period was probably due to the spread of large land plants.
But all that said, I appreciate your work, despite the limitations of the corrupted “data” with which you must contend. Would like to see you run a similar analysis on a less manipulated but large regional set, such as the US. It’s a large enough land area to be statistically meaningful, IMO.
rgbatduke
December 4, 2014 at 9:30 am
There is a limit to how much Hadley can cook the T books since 1979 because the satellites are watching, however it can & does cool the past with reckless abandon. And they probably didn’t expect anyone to run such a TCS test on their rigged data as yours anyway. Plus, they know that the models will inflate the possible warming from increased CO2 levels with unjustified positive feedback assumptions.
The many shameless shenanigans up to which Hadley got rival those of GISS & indeed exceed that execrable, miserable excuse for a self-serving government agency, particularly in CRU’s treatment of the oceans.
IMO your heuristic exercise is valuable, but because of the abominably bad “data” set upon which you’re forced to rely, doesn’t reflect reality. Still useful though to demonstrate the possible outer limits of the fictional world maintained the CACA Team.
Reality.
http://www.ospo.noaa.gov/data/mspps/np_images/amsua_ts_des.gif
Please submit for peer review, its wasted here !
Help
I am in a graduate class and have just been handed the UN report where Nov is close to the hottest on record etc. How does this report relate to the hiatus?
When one is at a plateau structure in data, it takes very little change to make something the hottest ever because you are bouncing around the highest point anyway. The problem is the next month might be the coldest of the plateau period, and still be among the X hottest ever. (where X is the length of the plateau). At this point it is all propaganda. The satellite records put it into the top 3 or 4 years, which makes me think that some of the adjustments or homogenization process may be what is responsible for the HADCRUT result they are trumpeting.
+1
It bears no relation whatsoever. It is nothing but a blatant, purposeful red herring on their part, and a diversion tactic.
Asking commenters on the WUWT site may not be the best way to get accurate information on global temperatures or climate change in general. There are variety of actual scientific sites (i.e http://www.ncdc.noaa.gov/sotc/global/ ) which would serve your purpose better.
Sir Harry, could you post some links to more un-biased sources please?
You trust government numbers?
Interesting.
Or, you could just go to e.g. the CRU website or the Mauna Loa website and download their raw numbers. Or you could go to woodfortrees and plot them without even having to find and download them. Or you could go to the enormous and probably semi-illegal hassle of having to sign up with the system being used to distribute raw numbers from things like climate models. Or…
Personally, I like my data raw instead of cooked. I promise, the HadCRUT4 numbers I fit above (and I’m sure Monckton’s number in the top article) come from valid and verifiable sources. And as far as I know, nobody who actually knows anything about climate science at all would think about challenging them as they’d know them well enough to recognize them anyway.
Do you? Know them that well? Or are you just indulging your logical fallacy in public for political reasons?
rgb
Actually, Hadley Centre’s numbers are not verifiable. They lost the “data” they claimed to have gotten from the Met for their original shot at GASTA. HadCRTU4 is anti-scientific, since there’s no way to check out the data &, like GISS, they try to keep their data handling methodologies secret. Jones asked why he should hand over the data & code requested under FOIA, when all the scientists would do with it is criticize?
And it gets worse from there. So far are their “data” from being raw, that they are cooked to a crisp.
Raw data are stats Tartar. Uncooked.
RSS & UAH have the year to date at 7th. Individual months are even less significant.
Question! Here’s something I need some help with; hopeful you guys can provide it. The green house gas hypothesis (it’s a hypothesis, correct? For it to be a theory, would there not have to be some proof?) holds that as co2 increases the atmosphere will warm. Is this a correct summation of the theory? If so, then why do the climate change folks only discuss datasets that refer to the warming of the surface? Isn’t the theory about the ATMOSPHERE, not the SURFACE?
GISS, HadCRUT(X) and the like only measure surface temperatures. RSS and UAH measure the atmosphere, correct? If this is the case, which of these data sets will show the status of Green House Warming per the hypothesis?
(Anthony, I had asked you to remove all my comments in the past as it has impacted me negatively in the business community here in Oregon. Apparently they maintain db’s of these type of things that organization like NIKE use to evaluate if you are a cultural fit or not (third party db’s they subscribe too). I recently was brought on and then released from NIKE following a review of their DB and was found to “not be a cultural fit” based on their findings. This means I can post again as everything I’ve ever posted is apparently kept in other DB’s so what’s the point in trying to keep quite now, eh?)
Ouch. And people wonder why I recommend never using your real name online? Cultural fit? You think for yourself and ask questions? Bad person, bad, bad person.
Real name or no, you are cross linked. Your real name is very easy to find. All you have to do is screw up one time on a post somewhere and these bots that crawl everything will find it and link it. I am embarrassed to say–at this point–that I’ve worked on some of these systems. I find that if one lives by the sword, they die by it, eh?
Personally, I don’t think it is a hypothesis, I think it is a part of radiation theory. One can directly compute it, completely understand it at the level of detailed quantum computations, photograph it in action via looking up/looking down spectrographs at the top and bottom of the atmosphere, and it works (as I show above) to at least reasonably explain the temperature changes over the last 150 years. The thing is, the computations rely on some approximations that don’t leave the effect itself in any reasonable doubt, but that do leave the exact magnitude of it less than perfectly known, and then there are feedbacks and all of the morass of nonlinear chaotic dynamics in the Earth’s general climate system where this is only a single input. Possibly confounding things exist in abundance, because even though most of the simple/obvious things can be eliminated as independent factors of importance, the Earth’s climate system is obviously quite capable of changing “all by itself” even when everything else is kept constant!
If you want to ask about a dubious concept in climate science, try this one:
“Equilibrium Climate”
That’s probably damn near an oxymoron.
rgb
That so-called greenhouse gases like H2O & CO2 absorb & radiate photons of different energies is an observation, not an hypothesis or theory. The effects this fact may have on climate however do form an hypothesis, with unsettled issues at every stage. The atmosphere, land & oceans interact complexly.
Eyeballing figure 2 it looks as if the horizontal no warming line could be soon extended to 1991 instead of the Lord Monkton’s 1996 ?
Thanks for including the info from Steve’s site and explaining why you use RSS. I’ve always wondered why and now I know.
Maybe you could include the USCRN as well next time. Only 10 years of data and only for continental USA but all from class 1 locations with an impeccable setup.It would be interesting to see how it is doing.
Our best temperature measurement for the USA , the USCRN is dead flat since inception, 10 years, NO warming, NO “adjustments” NO BS.
You can search WUWT and find an article on this.
If 67 is an harmonic then perhaps it is .618 of the number to be looking for, 108 or 175 or something to do with the golden section which seems to crop up in the solar system.
Meanwhile at the ground level the CET temp record shows 2014 as the hottest year evahh…
http://www.metoffice.gov.uk/hadobs/hadcet/graphs/HadCET_graph_ylybars_uptodate.gif
Let’s have none of this! Mr. M’s head is firmly in the (RSS) clouds – otherwise known as the ‘Brenchly Bubble’. It’s only us mortals that have to deal with surface temperarures
And 1690 is the coldest decade on record and a decade whereby something like a quarter of Scotland’s population died from cold. And what is the result of this supposed “hottest year”? Another 37,000 extra deaths in the winter months will ignored by heartless greenblobbiest zealots.
At some point the pause will end. It may go up. It may go down. The one thing we can be sure is is that the climate continually changes and will not stay the same for long. Prepare for the pause to end. If temperatures go down it will be game over for the alarmists. But if they go up there will be loud triumphant noises of vindication from the alarmist camp.
There are signs the pause may be ending and temperatures may go up. UAH shows an increase, although not enough to end the pause. RSS is the only one of the big five global records to show a large pause at this stage. The land based records are showing increases.
However I no longer have much trust for any of the main land based records – the extent of the automated tweaking has just been too large. However we are going to see claims of ‘warmest ever’ this year based on the land based records accompanied by big media releases trumpeting the end of the pause. This coincidentally seems nicely timed to fuel a political big push in Peru. Coincidence? Yeah right!
I trust UAH and RSS, and some of the smaller regional high quality land based networks which are not showing an increase. I also trust argo sea temperature data, at least from 2004. If those records all go up I will concede that the pause is over.
A rise is much less dangerous than a fall so I’d almost prefer to see a rise. I think the world could stand to be a bit warmer. However a fall would end this nonsense and discredit those who peddle it. A rise would mean we would be back arguing about sensitivities and rates; a more subtle and much less clearcut thing; and the circus would go on.
UAH is considering reducing its warming bias. This will be a transparent process subject to criticism, as they practice science there.
The “surface” data sets are worse than worthless generally, since they’re shamelessly designed to show more warming than actually has occurred. But the media don’t know that & wouldn’t broadcast that fact if they did.
Just a little cooling won’t flush CACA. It will have to be deep & sustained to derail the gravy train before retirement of the current generation of ersatz “climate scientists”, aka GIGO modelers. Otherwise, the Team will keep making lame excuses & the media will ignore the reality. After you’ve announced that warming causes cooling, what else won’t you do?
Forget “why is there a pause”, the question I’m starting to ask is “how come it’s not gone down already”. OK, it took me some time to twig that 1/f natural variation like the climate doesn’t have an equal probability of going higher or lower when it is already higher, but now that I’ve realised that natural variation is stronger than any human factors and that it must tend to make lower values more likely, I’ve realised the most likely next move is down.
Unfortunately it’s not the easiest of things to understand so I’ve put a demo on line at uburns.com.
“When the November 2015 RSS data are available, how many years and months of zero global warming will have occurred?”
Eyeballing the graphs, it wouldn’t take all that much to take the line back to 1988, which would make the hiatus 26+ years. That may well happen in the next few years, but will it happen by Nov 2015? I think not quite. So my contest entry for Nov 2015 is a conservative 19 years 6 months.
Chris (m’lord 🙂 ), may I offer a prediction for the RSS GP: Thanksgiving, 2015. It’s bound to be a turkey!
…a turkey: as in bad news for the IPCC.
Hi ive followed the climate discussion for about 7 years now argued with politisians journalists meteorologists etc….here in Sweden its like you must believe in the carbonreligion and the UN.Im looking forward to experience if UAH and RSS temp data shows a decline the years ahead ! . WOW ! What would the alarmists say ?
Checking your figures I find the last one (fig T1 by Carl Mears)most informatuve even though he does not understand what he is looking at. On the positive side is that he is using satellite data, not ground- based temperatures and as a result the hiatus in the eighties and nineties is not wiped out by any non-existent temperature rise as fakers like GISS, NCDC, and HadCRUT habitually do. His baseline actually goes through the center of gravity of the all five El Nino peaks visible to the left of the super El Nino. A similar line should have been drawn through the temperature segment to the right of the super El Nino because that is the current hiatus we are experiencing now. These two independent hiatus regions do not line up and must not be included in a common graph. This is why the attempted explanations in figure 2 are entirely wrong. The cause of this double hiatus is the existence of a short step warming that starts in 1999, immediately after the super El Nino has subsided, and in only three years raises global temperature by a third of a degree Celsius. This step warming is actually the only warming the world has had since 1979. It and the super El Nino of 1998 together separate the two hiatuses on both sides of the graph. The one on the right is ours and is interrupted by a La Nina in 2008 and an El Nino in 2010. But their common center of gravity lines up with the rest of the hiatus and does not change global mean temperature. At the present time the people hoping to end the hiatus are waiting for a new El Nino to save them but their vigil is in vain. El Nino simply has nothing to do with global warming. This is very easy to see from a study of the ENSO oscillation to the left of the super El Nino. What you need to do is to get a high resolution (at least monthly), unsmoothed temperature graph. Next, draw a broad, transparent red band over it in such a way that most of the noise visible is included under it. This noise is from cloudiness variations and because of this fact its amplitude is basically fixed except for a few outliers. There are five El Nino peaks with La Nina valleys between them in there. Now put a yellow dot at the center point of each line connecting an El Nino peak with its neighboring La Nina valley. These points define global mean temperature. Connecting the points will tell you what global mean temperature is doing. To see an example look at Figure 15 in my book “What Warming?” There is a mild amount of scatter there but you can fit a straight horizontal line to it. The fact that this line is horizontal proves that El Nino has nothing whatsoever to do with global warming. Do that on both sides of the graph and you get two horizontal straight lines that pass each other at a distance of one third of a degree. That is the handiwork of the step warming that followed the super El Nino. We don’t know how this short-period warming was able to keep the temperature of the twenty-first century at this high level for decades after it. The billions that Uncle Sam spends on climate research are not available for silly things like understanding why climate behaves like this. There are a few more things about the Mears graph that I have to point out. El Chichon and Pinatubo are two volcanoes his greenie models are set up to react to. That is done by inserting these two locations into the model code. The models are then set up to show cooling after each such location they come across. Looking at the graph you see that Pinatubo is indeed followed bt an apparent cooling exactly where all the models bend down. They similarly bend down at the El Chichon location but there is no corresponding cooling there because an El Nino sits where they are looking for cooling. Just why does this search for cooling work with Pinatubo but not with El Chichon? The answer is very simple: that “cooling” is not cooling but a misidentified La Nina valley. There is no such thing as volcanic cooling for plate-boundary volcanism. The hit or miss affair of finding volcanic cooling is simply due to the random fit between timing of eruptions with respect to the ENSO oscillation. All identified volcanic cooling valleys are nothing more than misidentified La Nina valleys. This is how it works. If an eruption coincides with an El Nino peak as Pinatubo does there will be a La Nina valley just after that El Nino peak is over and it gets appropriated as the cooling produced by the eruption. But if the eruption coincides with the bottom of a La Nina valley as El Chichon did it will be followed by an El Nino peak, and there will be no valley that can be misappropriated and named after the volcano. This is how El Chichon got cheated out of its “volcanic cooling” valley. This applies universally for all known volcanoes except for super volcanoes that we so far have fortunately avoided. I explained it very clearly in my book but these so-called “scientists” simply don’t read the literature unless it has been through their buddy-review system (if then!). Their code writers for climate models are certainly ignorant of what volcanic cooling is all about. And one more thing about his models. He states that “… we have substantial confidence that models can predict at least the broad-scale features of climate change. …” Broad scale features is not enough. They are all off the mark. It got started with Hansen in 1988 when he showed model climate predictions to the Senate.
His model A was “business as usual,” meaning normal climate we could trace. It turned out that his predictions were way off the mark, all much higher than was observeed as we lived through the predicted times. He used an IBM mainframe but now they have supercomputers and write million-line code. It has not helped, however, they are still no better than Hansen was 26 years ago. Not only are they off the mark, but the majority of errors are on the warm side, predicting more warmth to come than actually happened. It is not likely that this is purely by chance. They have had 26 years to put their house in order. It has not happened and it looks likely that they will not get there. The only rational thing to do with a non-working system is to shut it down. A businessman who is told that all the business forecasts given to him during the last 26 years have been wrong would not hesitate to close it down.
Arro,
One day we’ll have to introduce you to these things called “paragraphs”. In html-related blog pages, you don’t get them using carriage return followed by tab. You get them in context by two carriage returns. That is, to end this paragraph I hit Enter…
TWO TIMES. That inserts a blank line that then visually separates out a paragraph. Otherwise since it ignores the tab character you get your paragraphs visually run together as in the above. Very difficult to read. Please. Try the two line skip trick.
rgb (see, works for signatures too!)
Also, while I agree with the sentiment, I cannot strongly agree with the strength of your conclusions regarding volcanism. When I fit a very simple delta-correlated exponential decay model to discrete volcanism with a strength monotonic in VEI (volcano explosive index, basically a measure of the ejecta volume) I can get SOME agreement with Mauna Loa measurements of top of troposphere insolation. When I fit this modulation of transparency as an additional factor (on top of the basic log dependence on CO_2) I actually do get a tiny bit of improvement and get a p-value for the fit amplitude of .002. This isn’t exciting, granted, but it is almost certainly significant. To put it another way, there are enough coincidences between variations in global temperature and major volcanic events that they clearly exceed random chance as a causal factor, even though their effect is minimal (indistinguishable from the El Nino/La Nina noise, perhaps, but that isn’t the same thing as nonexistent) and transient (lasts no more than 3 to 5 years at most, often less).
And I cannot include Tambora in my fits, as we have no reliable — let me rephrase this, no even arguably, or possibly reliable — global temperature anomaly that extends back that far. So we are stuck with anecdotal accounts of coincidence between Tambora and a lagged year without a summer and so on. From what I can see, a volcano needs to score a 6 VEI before it has much chance of emerging from the noise (for a very few years) as a temperature reducer. Pinatubo barely makes it. Krakatoa barely makes it. Santa Maria in 1902 makes it with a convincing T downturn. Novarupta in 1912, OTOH, happens as temperatures are rising and doesn’t make a dent. 4’s and 5’s are mostly ignored — no effect resolvable from the noise.
This is El Chichon’s real problem. El Nino, La Nina, it was only a five VEI. In spite of the fact that it and Mt. St Helen were nearly back to back fives, in spite of the fact that it was SO_2-rich for its size and actually did spike down top of troposphere insolation for a year, this makes barely a ripple in global temperature, indistinguishable from noise or “unexplained natural variation” that spikes up and down all over the record.
So it is probably better to say that volcanoes have almost no effect until they reach VEI 6, a small but resolvable, transient effect at VEI 6, and I’m guessing that Tambora, at VEI 7, actually did act as a proximate cause to the year without a summer and the extreme cold that persisted, anecdotally, across the 3-5 years that followed it.
The really interesting eruptions are the much larger ones — things like Yellowstone — that happen only once every ten or twenty thousand years, or even more rarely. Those tend to last a long time, give of lots of interesting chemicals and ash, and probably have a profound effect on the climate.
But even a megaton-equivalent bomb like Mt. St. Helens has a pretty much invisible impact on the climate.
Open question — really, really big nukes are pretty close to VEI 6. The Tsar Bomba in 1961 probably qualified at 50 MT, close to an order of magnitude larger than Mt. St Helens. Yet I can see little evidence that it had a similar effect to a VEI 6 volcano, or even to the tiny dips that might go with the double whammy of Mount Agung and Shiveluch in 1963 and 1964, both 5’s (they did have a noticeable effect on TOT insolation at Mauna Loa).
Again, it looks like chemistry is more important than sheer volume of dust, ejecta, etc, and the climate is remarkably resistant to warming caused by even big volcanoes. Big yes, but small compared to the size of the planet, small compared to the effect many other things have, small compared to the capacity of the stabilizing negative feedback mechanisms apparently operating all of the time.
rgb
Chemistry is important. It’s the sulfur compounds that matter, along with the location of the eruption & other factors.
The energy of nuclear explosions is spent in ways totally different from volcanic eruptions. They’re not really comparable in effects at all, although of course surface bursts are more similar than air bursts.
Tambora does show up in the CET, so its effects aren’t just in anecdotal historical documents.
http://www.climate4you.com/ClimateAndVolcanoes.htm
PS: Many here have tried to get Arno to adopt the convention of paragraphs, but as you can see, so far without success.
Milodon, I just don’t see it. I followed your link and looked at the CET record across Tambora and it is absolutely indistinguishable from the record and fluctuations on either side. To put it another way, if we removed the helpful blue bar, and erased the dates on the x-axis, could you identify where Tambora happened? I couldn’t, even though Tambora was VEI 7 and it should stand out like a sore thumb instead of being invisible in the noise.
Later down in the same article it is the same story. They don’t even bother showing Krakatoa against e.g. HadCRUT-whatever, which is a shame because there is actually a semi-coincident dip there (at VEI 6). Semi-coincident because there are dips and spikes of similar magnitude on either side that cannot possibly be correlated with any volcano. So is it causal? Maybe. R thinks it might be, but comparatively weakly, with a p-value of order 0.001, not .0000000….1.
Then they show good old Pinatubo. They again provide the helpful shaded region because again, without it you could never look at the data and go “Wow, a big cooling spike happened right here, must have been Pinatubo”. There are roughly 25 big, sharp dips in HadCRUT4 from 1850 to the present. Given 165 years, a sudden cooling spike of order 0.2C or more happens ever 6 to 7 years. Of these, three are well correlated with VEI 6 volcanoes, and one VEI 6 volcano blows right into the teeth of a stubborn warming spike of over 0.3 C and doesn’t seem to alter it in any way. Once again, given HadCRUT4 with the dates removed (or given HadCRUT4 with no real idea when big volcanoes happened to blow) I defy anyone to pick four candidates for the four VEI 6 volcanoes in this interval and get two right without prior knowledge.
So no, what you sent me seems to represent somebody’s overly vivid imagination more than anything concrete. Again, I don’t doubt that Tambora had an effect. There is lots of anecdotal stuff to support it, but I’ll point out that my mother observed snowfall in upstate New York every month of the year at least one time in only five years of living there back in the 1950s. No help from volcanoes. I myself saw it in May and in September, and that was in the late 1960s. So separating out a true correlation from anecdote and accident remains a problem.
rgb
So when are you going to give up on this futile quest. You know you’re wrong. We know you’re wrong. Everybody knows you’re a freaking nut case. The claim is “global warming”. Not just surface warming. Evidence is overwhelming that the ocean is also warming along with the atmosphere. It’s the total heat being absorbed, not just that being absorbed by the air mass.
“John” may like to see the annex to our paper on what went wrong with the models to be published in a leading science journal in two weeks’ time. Watch this space for further announcements. There is no “missing heat” in the oceans.
John,
We are here to help you.The IPCC (have you heard of this outfit?) defines global warming as an increase in atm. temperature at the surface.
But surface temps have been flat.There has been no warming. No need to wring your poor hands.
SST (and OHC) is determined by insolation only. IR has no effect on SST or OHC. CO2 has nothing to do with OHC. So, relax, have a beer or sip some vin and think happy thoughts. Atmospheric CO2 is entirely beneficial. Say that to yourself several times a day, and you will soon feel better.
Listen, John (if that’s your real name!)
Many might call Sir Christopher a fruit cake, but the man’s just trying to make money.
There is no Ocean Warming:
http://www.nodc.noaa.gov/OC5/3M_HEAT_CONTENT/
All these graphs are made up by dishonest scientists in the pay of those trying to bring in a communist world government
Well written!
Monckton of B, you choose just RSS from all available data sets, and offer words about why you start at 1997, but your RSS researcher Carl Mears seems to dispute your conclusions.
From your link to Remote Sensing Systems, Carl Mears said, and I quote:
“(The denialists really like to fit trends starting in 1997, so that the huge 1997-98 ENSO event is at the start of their time series, resulting in a linear fit with the smallest possible slope.)
Does this slow-down in the warming mean that the idea of anthropogenic global warming is no longer valid? The short answer is ‘no’. The denialists like to assume that the cause for the model/observation discrepancy is some kind of problem with the fundamental model physics, and they pooh-pooh any other sort of explanation. This leads them to conclude, very likely erroneously, that the long-term sensitivity of the climate is much less than is currently thought.”
http://www.remss.com/blog/recent-slowing-rise-global-temperatures
The rest of the article is a good read, as well, but seems to fly in the face of your arguments.
So. Let’s consider – even though the 17 years since 1997 is not a statistically relevant climate interval – what do all the data sets say since then?
Is it possible to guess why you use just one of the many data sets available?
Here’s NCDC from NOAA – 1997 to present trend (upwards), using their visualization tool at
http://www.ncdc.noaa.gov/cag/time-series/global/globe/land_ocean/ytd/12/1997-2014?trend=true&trend_base=10&firsttrendyear=1997&lasttrendyear=2013
Here are trends since1997 for GISS (up), HADCRUT4 (up), HADCRUT3 (up), UAH (up) and RSS (flat), plus an ocean surface trend (up) to avoid any thought of the urban heat islands.
http://www.woodfortrees.org/plot/gistemp-dts/from:1997/trend/plot/hadcrut4gl/from:1997/trend/plot/hadcrut3gl/from:1997/trend/plot/uah/from:1997/trend/plot/rss/from:1997/trend/plot/hadsst3gl/from:1997/trend
6 of 7 data series show continued warming since 1997.
Oh, and oceans hold far more heat than air – what have the oceans been doing below the warming surface?
http://www.nodc.noaa.gov/OC5/3M_HEAT_CONTENT/
Oceans have been warming, too, not pausing.
So, nothing’s been pausing, except for one data set, when started from 1997, which, as one of their researchers notes, is a favorite starting point for people with an agenda. Hmm…
B fagan:
CO2 has nothing to do with OHC.
Hmmm..
mpainter – I’ll assume you are accepting that all the surface/tropospheric trends except RSS are upwards during the short interval since 1997.
But yes, yes, the oceans are warmed by sunlight – including increasing expanses of the Arctic during summers there.
During the recent flattening of solar output, the surface is warming and the ocean is warming to depth. This shows that the current continued surface warming is NOT due to transfer of ocean heat to the air. There’s enough excess to go around.
Bfagan
You need to get up to date. SST has increased because of increased insolation, as shown by a number of studies. This also accounts for the late warming trend circa 1980-2000 in surface temp.
Concerning temp. data, satellite for me. The keepers of the other are an unsavory lot.
Mpainter, please clarify “satellite for me”. Because labeling everyone but the small group showing an opposite short-term trend “unsavory” isn’t science – it’s opinion.
Satellite data is interpreted by UAH and RSS. Both show warming since they began operation, as do all the surface temperature records. During the short interval since 1997 they show opposing trends while using mostly the same data – UAH shows a warming trend, RSS shows a weaker trend of cooling.
So – since their long term trends agree, please justify why you choose one over the other during the span since 1997? My take is that there is no clear tropospheric trend since 1997 since the two satellite groups disagree.
http://www.woodfortrees.org/plot/rss/from:1997/trend/plot/rss/trend/plot/uah/from:1997/trend/plot/uah/trend
Since surface temperatures are continuing to increase from measurements, since one satellite group shows increase from measurements, and one group shows a slight cooling, I’d still say that we’re warming.
The physics of the greenhouse effect haven’t been disproved. Solar output has been weak recently but we’re still not losing heat, we’re gaining it – though the stratosphere is continuing to cool, also as predicted by climate science.
Either, I see little difference between the two. UAH reportedly is being studied for a downward adjustment. Temp. data sets I don’t like because of the questions and issues concerning the data keepers and their methods.
Are you unaware of the issues of character concerning Phil Jones, Keith Briffa, Tim Osborn, et alii at the CRU at EAU? If so, see Climate Audit for a thorough examination of Climate gate, etc. All the data sets are in the hands of confirmation types and are simply unreliable.
Increased insolation is due to a decrease in cloud albedo as observed since circa ’85. This also is the reason for higher SST. CO2 has nought to do with SST.
TSI varies by .1% and this does not change, despite the cr*p you might hear otherwise.
The GHE exists, although it has been mis-characterized by the AGW types.
You seem stuck on OHC. This is unrelated to GHE, or CO2, or DWIR.
Water is -opaque- to IR, which incident on water only can cause evaporation.
If you cannot grasp this principle you are doomed to be a dubious scientist, although you will have lots of company.
Concerning global temp trends, there has been no significant warming this century.
So – unsuccessful character assassination of one of the multiple groups providing surface temperature analysis, plus a rumor that UAH will be adjusted, that’s your evidence? Even though their scientific conclusions are completely upheld?
Surface is continuing a slow warming – add Japan’s JMA to your list of groups to dislike.
http://ds.data.jma.go.jp/tcc/tcc/products/gwp/temp/ann_wld.html
Five Warmest Years (Anomalies)
1st. 1998(+0.22°C), 2nd. 2013(+0.20°C), 3rd. 2010(+0.19°C), 4th. 2005(+0.17°C), 5th. 2009,2002(+0.16°C)
Ocean is warming, surface is warming, we’re in the warmest decade on the record after each of the previous decades was the record holder since 1980.
I’m not obsessed with ocean heat content, just aware of the fact that surface and ocean depths continue to warm without changes in sunlight accounting for that fact – must be something like the greenhouse effect.
But you don’t like some people and trust a rumor of a possible change of unknown magnitude.
Got it. We’re done. Have a nice weekend.
Don’t use 1997, use 2000, 2001, 2002, 2003 or 2004 – they all show the pause.
Looks like you’re either unfit for your position, hopelessly stupid, or incompetent not to be able to see RSS Emperor’s new suit of clothes, spun by the Brenchly Weaver.
“””””…..From your link to Remote Sensing Systems, Carl Mears said, and I quote:
“(The denialists really like to fit trends starting in 1997, so that the huge 1997-98 ENSO event is at the start of their time series, resulting in a linear fit with the smallest possible slope.)…..”””””
Seems to me that Mears is confirming exactly what Lord Monckton is saying. The statistical slope is zero over that interval.
Where Mears Errs, is in assuming that Christopher chooses to start in 1997.
He does NOT. His algorithm searches for the longest possible zero slope up to today’s date (month actually). so it is the data that itself chooses the start point.
What is it with you people who simply cannot understand the trivially simple algorithm involved.
What is the longest period, ending NOW, wherein the statistical trend of the OBSERVED DATA IS ZERO.
That period JUST HAPPENS to go back to circa 1997.
The DATA chooses the START DATE; NOT Lord Monckton.
Sure, George. Just as the world forced him to choose the only data set that has any cooling trend since the extremely powerful El Niño of 1997-98.
Well b , I just told you what he does. He has said often enough what he does. If somebody wants to perform a similar analysis on any other cherry picked data set of their choice, they are free to do it.
Lord Monckton has never claimed that it doesn’t matter which data set you choose.
Statistics is ALWAYS characteristic of the actual data set it is applied to. It has no application to anything else but that data set.
If you apply Monckton’s algorithm to the telephone numbers in the Manhattan Telephone directory, that will not tell you anything about any other data set.
Monckton does not push the assertion that there is no anthropogenic global warming. He understands (I think) the physical arguments in favor of it. What he, and I for that matter, object to is the egregious, extravagant extrapolation of the actual physically plausible range of CO_2 forced warming into 2 to 3 times that on the basis of a small mountain of unverified and indeed, unverifiable assumptions.
To put it bluntly, as many papers and some straightforward physical computations have indicated, CO_2 alone would lead to a climate sensitivity of around 1 C per doubling of CO_2. Around because we cannot do a truly accurate calculation and have to make a variety of approximations along the way, so it could be as little as perhaps 0.8 C and as much as 1.5 C and nobody would blink at it. As a figure I put in above suggests on the basis of actual fits of CO_2/date to Mauna Loa data and fitting the expected algebraic form for CO_2 driven warming to all of HadCRUT4 — thus avoiding any accusations of cherrypicking as I fit the whole damn data set — I get a relatively high 1.82 C of total climate sensitivity, and would suggest that it could be as high as 2 C or as low as 1.5 C and it wouldn’t do horrible things to the fit, given the uncertainties in our knowledge of CO_2 and temperature in the past
This TCS implies that there will be one whole degree C of additional warming by the time CO_2 goes to 600 ppm. I show a couple of “scenarios” for future warming on the graph, but they are all contingent on cCO2(t), the concentration as a function of the date (as well as presumed accuracy/relevance of my fit, which is certainly open to doubt and discussion). I would argue, of course, that this is a very reasonable estimate for future warming driven by CO_2, given that it fits all past warming without any reference to the feedback that the egregious scenarios rely upon. So unless this “feedback” somehow is missing in the past but will be present in the future, the fit I present already includes the sum total of its effect and they do not substantively alter the general logarithmic CO_2-driven warming rate. One could interpret my results as 1 degree of direct warming plus 0.8 degrees of indirect feedback warming, as long as the feedback remains proportional to the direct. Or 1.5 of direct and 0.3 of feedback. The problem is that we cannot possibly statistically resolve the two without a precise knowledge that we lack as the problem is obviously totally covariant in the split if the feedback is linear in the CO_2 forcing.
I don’t think Mr. Monckton would disagree with any of this, but of course he can speak for himself (quite ably, if occasionally more sarcastically than he should, much as I sympathize with his frustration over the entire issue:-).
The point is this. How much should we spend to prevent non-catastrophic warming driven by increased CO_2? 1 C at 600 ppm is not likely to be catastrophic, any more than the 0.8 C the world has experienced since 1850 has been catastrophic. On the contrary, the warmer climate has been without question a universal blessing on mankind so far. Growing seasons are longer. Storms are (if anything) less frequent, and for sound reasons. The temperate zone is larger. Winters are shorter. The seasons for viral diseases like the flu are shortened. Plants grow measurably faster, increasing crop yields.
Every single one of these things means fewer people die from climate related events than would happen if the world were still at the temperatures of 1850, or even the temperatures of 1950.
That doesn’t mean that there is no reason for concern about CO_2 driven warming. There will, no doubt, eventually be negative consequences even if the net consequences remain positive. It does, however, require us to be a lot more conservative and do an actual cost-benefit analysis of measures taken to eventually reduce CO_2 production and (for example) balance them against the enormous and immediate human misery and suffering caused by an inadequate energy supply. I’ll also point out the equally enormous difficulty in projecting out probable CO_2 concentration of the atmosphere (as a function of time) into the future upon which all arguments depend. I’m struggling with this right now as I wrestle with actual data and there are a number of things that are very difficult to explain or understand even in the past record of probable CO_2 concentration, things that make e.g. the Bern model somewhat dubious. As a single example, if you go and download the freely available Law Dome ice core record of trapped CO_2, you will see three distinct intervals where atmospheric CO_2 appeared to actually decrease in the last 165 years. It decreased a bit or remained flat for nearly a decade in each case.
According to the Bern model this is basically impossible. I’m still having an enormously hard time even thinking about what might have caused such an unremarked and yet stupendous thing. The latest such event was in the stretch from 1940 to roughly 1948, which is exactly where one would least expect it, well into the industrial era and over a stretch where the world was literally burning with war and wartime industrial production. We couldn’t dig oil or coal out of the ground fast enough to make the concrete, the steel, and the electrical power the war consumed. But even if global CO_2 production did reduce during that interval (doubtful, but maybe) there is simply no mechanism for rapid CO_2 uptake in Bern, especially into the teeth of anthropogenic additions.
This simply means that we have even less of an idea than many think we do about what CO_2 will do in the future. Our understanding of the past is far from perfect, and the future is necessarily less so. And then there is the probability, some would say the high probability, of new technology that will render the entire argument moot and waste every single penny spent preventing a global warming “catastrophe” so far. Such as the successful development of thermonuclear fusion as a viable power source. Such as the successful development of meltdown-proof LFTR. Such as the development of truly superior batteries that make co-developed improved photovoltaic solar a real possibility. Such as the development of high temperature superconductors capable of revolutionizing the power delivery grid.
Nobody can foresee the most probable trajectory of CO_2 with anything more defensible than drawing a line from the present into the future and saying “I bet it does this”. By the time one defends and assigns priors to the raft of assumptions underlying any curve at all, that’s within irrelevant statistical range of just drawing a line, especially if the Bern model is NOT correct.
rgb
oops with the open boldface tag, sorry.
[But where should the bold close? .mod]
rgbatduke, what I don’t see in your equation is the additional positive feedbacks from increased water vapor, declining albedo (Arctic summer and overall snow cover) and the impacts of methane, nitrous oxide, etc.
We’re not just getting CO2 warming – we’re changing the balance of many systems at once. So I don’t find the low-end estimates re-assuring. Believe me, I wish they were true, but the range of projected warming sensitivity has actually been fairly stable for decades, and hoping – “just guessing” as you conclude, that the low end is true is just reckless.
But you lay out a rosy picture of how kind a warmer planet has been so far. “On the contrary, the warmer climate has been without question a universal blessing on mankind so far.” Ha ha ha.
Allow me to comment on each:
Growing seasons are longer (in temperate climes, depending on water availability and pollinators)
Storms are (if anything) less frequent, and for sound reasons. (and the fewer storms are more intense, for sound reasons, with rainfall/snowfall extremes happening more often as warming evaporates more water. Flooding isn’t beneficial – but more and more of the annual precipitation is coming in fewer and fewer events. In areas that aren’t seeing drying.)
The temperate zone is larger (no, the temperate zones are shifting polewards – not expanding. This will warm more of Canada and Siberia, but that also brings risk of additional carbon/methane emissions from thawing permafrost and increased forest fires in the northern forests. Also, there are indications that the descending portion of the Hadley circulation is moving polewards, leading to declines in rainfall in Southeast Australia, South Africa and possibly in Southern Europe.)
Winters are shorter. (and summer is longer – dying from a heat wave is as unpleasant, too, and many plants depend on cold winters as protection from parasites)
The seasons for viral diseases like the flu are shortened. (and tropical diseases are moving polewards while warm seasons expand.)
Plants grow measurably faster, increasing crop yields. (If they aren’t in an area where annual water availability isn’t dependent on declining snowpack, or on where the Hadley cells are descending, or on availability of nitrogen/phosphorous, etc. FACE experiments for various crops show a decidedly mixed bag, particularly after several years of enhanced CO2.)
You forgot rapidly increasing mortality from India through to China from the same coal pollution that killed thousands in Europe and America in the last century – only it’s millions a year dying now. China’s own government admits to over a million pollution-related deaths a year there.
No, rgb, the Heartland picture of nothing but goodness hasn’t been true and isn’t likely to get better.
And you say this: “And then there is the probability, some would say the high probability, of new technology that will render the entire argument moot and waste every single penny spent preventing a global warming “catastrophe” so far.” “Such as the development of truly superior batteries that make co-developed improved photovoltaic solar a real possibility. Such as the development of high temperature superconductors capable of revolutionizing the power delivery grid.”
This power revolution is already started and is investment, not waste. Oncor in Texas is already planning to spend 5.2 billion on grid storage in Texas – the Battelle group did a study for them and it indicates costs for grid-scale battery technology will drop substantially by 2018. HVDC transmission cables move a huge amount of power long distance with little losses already, and are just fine for connecting Plains State wind with urban markets – if we start investing in them now. Iowa’s planning one east already, Texas is doing an internal interconnect to get their wind energy to their big cities. We don’t have to throw out any renewables or HVDC transmission if fusion finishes it’s long, long “any decade now” gestation.
And here’s where I disagree strongly on what I see as a “don’t spend anything, because it’s all been great and miracle technology may come later” approach:
What if you are wrong?
We’ll have waited too long and started a centuries long disaster, and will have been encouraging decades of additional fossil fuel burning. The cost to adapt will be far higher – while dealing with global pollution, militarization to keep fuel supplies flowing, ocean acidification, sea level rise, etc.. I don’t expect the worst to happen, but with the uncertainty, you can’t rule it out while still trying to tell me the best is likely- you have to consider both ends of the uncertainty spectrum.
What if I’m wrong?
We’ll have invested one or two % of GDP in the following:
– reduced death rates and chronic disease from fossil fuel emissions/extraction
– reduced water demand for fossil energy extraction/power plant cooling
– reduced international military costs due to keeping energy flowing.
– reduced temperature-driven death rates (energy efficient homes are cheaper to heat in winter/cool in summer)
– increased energy security globally
– reduced pollution-based damage to desperately needed crop land
– reduced the impact and severity of ocean pH change
– reduced burden on global transportation networks (China’s high speed train system was built to get people off the coal train tracks)
All these, even if warming is as low as you pray it will be. As you say, nobody can see the most probable trajectory – yet you advise us to plan for it being the best possible outcome. That’s wishful thinking.
bfagan:
If you pee a puddle it helps not.
Warming is beneficial for all life.
Cooling is the killer. These are facts.
Atmospheric CO2 is entirely beneficial.
Some scientists believe that you can warm the planet by increasing CO2.
Unfortunately, this has turned out to be untrue.
“cooling is the killer”? That would be funny if it weren’t for the tens of thousands who died in heat waves over the last 20 years. Coal in your stocking for sure.
Extremes beyond normal ranges are the killers. Crops don’t do so well when temperatures are too hot OR too cold at different ties during their growth cycle. Humans don’t do so well at extremes if they aren’t prepared for them, particularly if they are elderly. Winter deaths are from flu, heart diseases, respiratory diseases exacerbated by cold, particularly if they’re poor and live in cheap housing and have trouble paying bills. But the same conditions of age + poverty kill during heat waves as well – heat stress and lack of air conditioning is lethal, particularly for the elderly. Heat waves also kill when they hit areas that typically don’t have air conditioning, or if heat indexes go so high that it becomes dangerous for outdoor workers who don’t take appropriate precautions.
Read here: http://en.wikipedia.org/wiki/Heat_wave#20th_century Note that the 1995 heat wave killed over 700 in Chicago – primarily old people. Note the record dew point and heat index – that’s where the heat stress comes from. Read about the European heat waves, esp. 2003 and 2010. Tens of thousands of deaths.
So, there will be fewer deaths from cold-related issues, but there will be increased deaths from heat-related issues. The golden age of excess CO2 is a line of BS.
Let’s take your argument about beneficial gases. CO2 is lethal to animals in overly high concentrations, causing suffocation. One of the dangers of CO2 sequestration is that if it ever escapes back to the atmosphere as a gas, it’s dangerous. Natural CO2 outgassing from a lake in Africa killed a couple thousand. Attached is an article about it – read far enough to see that all animals died, but plants weren’t
http://www.history.com/this-day-in-history/gas-cloud-kills-cameroon-villagers
So, I can assume that you are a plant, trying to take over the world, or that you just like using useless generalizations promoted by many of your favorite sites.
Oxygen is also necessary for all life, but too much is lethal. Water is necessary for all life, but again, people can die if they drink too much at once. It’s not poison, it just overwhelms typical body chemistry. Cold can be bad, but hot can, too. The same time period that saw a few Norse live on Greenland saw civilizations in the American Southwest collapse from heat and long-term drought. The issue of climate change is we are introducing stresses up and down the biological systems that have acclimated to the range we’ve been in for the last 10,000 years or so, and we don’t have to keep doing that.
Modelers assume feedbacks not in evidence, as addressed by Dr. Brown.
Net feedbacks are liable to be negative on this homeostatic planet, in so far as the effects of the tiny amount of essential trace gas we have added to total GHGs is even measurable.
The GIGO models consider only radiative feedbacks, ignoring most of the net effects of evaporative cooling & clouds.
If anything, a doubling of CO2 is likely to at most warm the world at “equilibrium” by one degree.
As I’ve elsewhere commented on Dr. Brown’s model, it’s based upon a totally unreliable data set, so while his fit is valid, it’s results are too warm, since HadCRU greatly exaggerates actual recent warming while shamelessly cooling the past. As with GISS, its books are cooked to a crisp.
The many shady ways in which this manipulation is concocted would require a long separate blog post.
Any Idea why the UAH do not show any pause?
See: http://www.woodfortrees.org/plot/uah-land/from:1980/mean:37
/Jan
Because the pause is a fiction.
Flash, even the IPCC admits that global warming has stopped. What you are doing is retreating back into your comfortable Belief System (BS). But the real world is going on without you, and without any regard to your ‘pause is a fiction’ fairy tale.
You could at least provide the link to where they acknowledge the pause. There’s general agreement that the rate of warming increase has slowed since the late 90’s but not that it has stopped, or paused. I agree there’s a lot we don’t know when it comes to the slowdown, but the bottom line is that the science is still sound, it’s still getting hotter, and these are not risks we want to take.
Flasher man:
Warming is beneficial. Cooling is a killer. Which do you want?
It is no good coming here to wring your hands and pee a puddle. Take that to SKS or HotWhipper where they adore that sort of stuff.
Ask and ye shall receive. Go to the IPCC website. Download AR5, chapter 9. Read box 9.2, entitled:
Box 9.2 | Climate Models and the Hiatus in Global Mean Surface Warming of the Past 15 Years
BTW, I actually cut and pasted that from my personally downloaded copy of AR5 because gee, some of us actually read the damn thing. Apparently you don’t. Might be a good idea to. Note well that the publication date of AR5 is such that the “15 years” is now at least “16 years” if not “17 years”.
Do they acknowledge a pause — oops, sorry, “hiatus” — of 18 years or whatever? Not publicly. Nor do they publicly acknowledge the failure of the CMIP5 models — instead they try to hide it in a bowl of spaghetti — see figure 9.8a in the same chapter (right before the box). Box 9.2 is their apologia for the obvious and increasing divergence of the models individually and collectively from the actual climate. They don’t bother to apologize for the literally unbelievably poor correspondence between the models one at a time and the entirety of HadCRUT4, or the terrible correspondence between the multimodel ensemble mean and HadCRUT4.
Here’s a model for you. It’s very simple. A two parameter, physics based model, directly justifiable from the actual radiative theory of global warming. It is conditional on just what the past state of global CO_2 has been in the time before 1959 when we started to properly and consistently measure it, but uses a very reasonable functional extrapolation across the past. As you can see, it beats the pants off of the CMIP5 MME mean, and if you look at figure 9.8a itself as I suggest, you’ll see that not one strand of multicolored spaghetti contributing to that meaningless mean is anything but a joke:
http://www.phy.duke.edu/~rgb/Toft-CO2-vs-MME.jpg
This is why published estimates of TCS are in freefall right now. People are coming to their senses and realizing that the repeated assertions of TCS of 2.8 to 5 or even 6 C are pure hallucination, the ravings of one person in particular who made rescuing the world from catastrophic warming — and flooding, and nuclear power, and… his life’s work and who HAPPENED to be in a powerful position in a government funded institution and able to make his personal fantasy into a collective one for ever so many people.
rgb
Please explain your graph. Not being sarcastic, I don’t understand it. I’ve got a two-year-old and would be delighted if you guys are right.
In defence of Sir Harry Flashman he may have been misled by the Guardian.
I have often referenced and quoted IPCC AR5 Box 9.2 on the environment pages but invariably the comments have been deleted as too accurate – which seems to breach the Guardian’s rules.
If Sir Harry Flashman has learnt about this from the Guardian then it is quite understandable that he disagrees with the IPCC.
“Box 9.2: Climate Models and the Hiatus in Global-Mean Surface Warming of the Past 15 Years
The observed global-mean surface temperature (GMST) has shown a much smaller increasing linear trend
over the past 15 years than over the past 30 to 60 years.” This is well known. However it refers to surface temperature, and it’s a slowdown, not a pause or plateau. And if it proves to be a result of natural variation, and reverses in a few years, well, ladies and gentlemen, we are pooched.
RGB,
Your model could save the world billions, at least.
It’s really the only model needed. If CACA spewers want to add on net positive feedbacks, they can, but would have to justify their manipulation based upon actual evidence, instead of hiding the GIGO assumptions in their worse than worthless GCMs, repeatedly shown ludicrously false.
If anything, feedbacks are liable to be net negative. Plus the models ignore all the human activities that cool the planet. But in any case, any human effect is trivial & beneficial, not significant & catastrophic. Probably not even measurable, as science cannot with confidence even state the net sign of all human effects.
Jan,
UAH data shows no observable rise in temperature over the past decade.
It also shows that contrary to the Narrative, 2014 is far from being the warmest year.
If you make a linear trend on the period you have chosen, you can see a rise
http://www.woodfortrees.org/plot/uah-land/from:2004/trend
/Jan
Munckton – reasons why RSS (Repetitive Siren Song) should be considered the ‘Recieved Data Set’:
“There are good reasons to consider it the best of the five principal global-temperature datasets. The indefatigable Steven Goddard demonstrated in the autumn of 2014 that the RSS dataset – at least as far as the Historical Climate Network is concerned – shows less warm bias than the GISS or UAH records. The UAH record is shortly to be revised to reduce its warm bias and bring it closer to conformity with RSS.”
“Also, the RSS data show the 1998 Great El Nino more clearly than all other datasets. That el Nino, and that alone, caused widespread global coral bleaching, providing an independent verification that RSS is better able to capture such fluctuations without artificially filtering them out than other datasets.”
Mears:
“……surface temperature datasets, which I consider to be more reliable than satellite datasets (they certainly agree with each other better than the various satellite datasets do!). So I don’t think the problem can be explained fully by measurement errors.”
http://www.remss.com/blog/recent-slowing-rise-global-temperatures
The surface datasets have been so frequently tampered with – always in the direction of accelerating the apparent temperature increase – that they can no longer be relied upon for anything. See Steven Goddard’s excellent and repeated exposures of the various fiddles by which global warming has been made to look greater than it is. I prefer the less-tampered-with RSS dataset for the reasons given in the head posting. However, all datasets, at the 95% confidence interval, show much the same picture: no warming for around a decade and a half. Taking the mean of all five global datasets, the rate of global warming since 1990 has been half of what the IPCC had predicted with “substantial confidence” in that year. It is no longer possible credibly to maintain that the rate of global warming is as predicted.
” always in the direction of accelerating the apparent temperature increase ”
..
Citation?
Note: “Steve Goddard” is an imaginary person
Christopher,
Why are you wasting all this valuable evidence here ? . Have faith in the scientific method and submit it to some reputable journal where it really counts , if it has any substance they will publish it.
David Socrates
Better than a citation is a look at how the data sets have changed; for example, look at this is how the GISS data has changed.
Please have the good sense to check the data for yourself instead of asking for the opinions of the data stated by authorities you can choose whether or not to trust.
The constant alteration of the data sets makes serious discussion of them impossible in the scientific literature; see this.
Richard
David Socrates
December 5, 2014 at 3:04 pm
“Goddard” is a real person who uses a pseudonym. Sort of like “Richard Windsor”. At least Goddard uses a pen name of the same sex as he, unlike the resigned EPA Administrator.
Village Idiot,
Satellite data is the most accurate data there is. It is a real time snapshot of the globe. You just don’t like it because it doesn’t feed your confirmation bias.
dbstealey – satellite data is of microwave radiation – it isn’t temperature data until someone processes it with lots of algorithms, data cleanup, and models. And the long-term interpretation by both satellite groups shows a warming troposphere.
By the way, in another reply you used something like “not warming in the last 10 years” – but 10 years doesn’t prove anything climatically. You typically use 30 years for that.
Quick example of how shorter periods put noise into the signal – here’s how both satellite data sets show termperature trends since they began and also since Monckton’s cherry-picked 1997 date.
http://www.woodfortrees.org/plot/uah/trend/plot/rss/trend/plot/uah/from:1997/trend/plot/rss/from:1997/trend
UAH and RSS agree long-term, but disagree in the short time since 1997.
Unless you are feeding a Belief System, the best the “most accurate data there is” since 1997 shows us is “no clear trend”. You can’t simply pick half the data and throw the other half away.
bfagan:
“You can’t simply pick half if the data and throw the other half away”
####
Have you explained that to your comrades?
Mr Fagan deludes himself. I do not cherry-pick the start-date for the monthly RSS update graphs (which at present is in 1996, not 1997). As the head posting makes clear, I calculate the longest period with a zero trend, working backward from the present. On any view, there is no basis for alarm in the slow rate of global warming since the IPCC’s first report in 1990 – unless one is the IPCC, of course, for its projections have proven relentlessly exaggerated. Take away the exaggerations and the climate “problem” disappears.
Cherry picking – selecting the one data set that has a zero trend of any length and then defining an algorithm that “just happens” to find zero trend. Not convinced, especially when the chosen data set over the chosen time is directly contradicted by another equally-reputable data set that uses the same source data.
Cherry picking accusations are the final refuge of the global warmers when you present them with incontrovertible data.
b fagan
You write
True. And it is also true that surface data is of differences in thermal expansion between glass and fluids in a variety of devices – it isn’t temperature data until someone processes it with lots of algorithms, data cleanup, and models.
SO WHAT?
You go on to say
That is a series of statements which are each plain wrong.
There is no “long-term interpretation by both satellite groups” because the satellites have only existed since 1979.
Nothing can “prove” anything in a scientific investigation. Indeed, that is the difference between science and pseudoscience:
science attempts to obtain the closest possible approximation to truth by seeking evidence which refutes (so falsifies) what is thought to be true and then amending what is thought to agree with the evidence
but
pseudoscience assumes that a thought is true and seeks evidence which supports (so is said to “prove”) the thought is true.
Importantly, 10 years is more than adequate to indicate much about climate. For example, the 1994 IPCC Report used 4-year periods to assess changes in hurricane frequency.
dbstealey does NOT “typically use 30 years” to assess climate data; nobody does. Indeed, if that were so then your claim of “long-term interpretation by both satellite groups” could not be true because the satellites have only existed since 1979 which is less than 2 periods of 30-years needed for comparison.
It seems that you have confused the 30-year climate standard period as being a typical period for climate assessment. It is not. Any length of time can be used for an assessment so long as it is stated.
The 1958 Geophysical Year adopted 30-years as a climate standard period because it was then thought that data from prior to 30-years before 1958 was unreliable. This arbitrary choice was unfortunate because 30-years is not a multiple of the 11 year solar cycle, or the 22-year Hale Cycle, or etc. However, 30-years remains the standard so, for example, each of the global temperature data sets uses a standard 30-year period for comparison but they each use a different 30-year period. They each calculate the average (i.e. mean value) for a year and each month during their adopted standard period. They then calculate monthly and annual data as temperature anomalies (i.e. differences) from the average value of the adopted climate standard period.
This use of anomalies is why the temperature data only vary by fractions of a degree during each year while actual global temperature (n.b. global and NOT hemispheric temperature) rises by 3.8°C from June to January and falls by 3.8°C from January to June during each year. And, incidentally, this amount of seasonal global warming and global cooling puts into perspective the silly scare-mongering about a mere 2.0°C of putative global warming over the coming century.
Richard
Richard – I understand what temperature anomalies are. That you conclude with the following shows that you clearly don’t or that you don’t want people to consider the risks. “incidentally, this amount of seasonal global warming and global cooling puts into perspective the silly scare-mongering about a mere 2.0°C of putative global warming over the coming century.” Really? Nobody says that climate change is dangerous because there will be a day when the temperature will break all records. The world isn’t going to explode – the baselines will change and that will have many effects.
And I use 30 years simply because it is a standard for defining the shortest interval to be making anything approaching confident statements about climate trends.
For anyone to be saying “since 1997, the trend in the outlier of the multiple data sets” as if it disproves the effect of increasing greenhouse gases is foolishness – it proves nothing except someone found one data point that appears to support what many people want to hear.
That you point out the short duration of the satellite record adds to the weakness of any claim based on what is not even a trend shown in both of the groups interpretations. UAH shows up, RSS shows down, yet many here decide that, rather than it showing the weakness of making conclusive claims about the short-term satellite data – it becomes their reason to say “all the data sets except the one we currently like are gimmicked”.
I understand science being disproving, not proving. The longest-term trends of every instrument data set from oceans to top of atmosphere show warming beyond what the solar data would indicate. The greenhouse effect is the strongest explanation for most of the most recent warming. Nobody here presents a competing hypothesis that is complete and isn’t disproved.
I understand that the bulk of the evidence from physics and a huge array of different scientific disciplines “strongly indicate” things happening that aren’t refuted because Monckton used a snippet of RSS and posted it on a blog.
Richard S Courtney
Great to have you back and commenting!
Best Regards,
mpainter
mpainter
Thankyou for your greeting.
In this and some other threads I have attempted to correct (seemingly deliberate) misrepresentations which could mislead onlookers. This provides me with a personal risk (for reasons you need not know) from responses by trolls. However, I think that helping people to see through the misrepresentations is a valuable use of whatever time I have.
Richard
Mr. Fagan, “…the outlier of the multiple data sets”. There are only two Satellite temperature data sets and we have been repeatedly told that UAH was the outlier so we use RSS and now you are claiming the same thing because it does not fit in with your messaging on Alarmism. So which is it, is UAH more reliable or RSS?
Hi, Poptech. All that can be said about the reliability of UAH or RSS when asked to look at the time between 1997 and now is to say that it can’t be answered with any certainty.
Two professional groups, working with mostly the same data, using their own algorithms and data models, are producing results that differ slightly in the short term. Both groups have made numerous adjustments to their algorithms over the years, with the adjustments sometimes increasing, sometimes decreasing temperature readings.
I’m not qualified to say one is right and one is wrong, and neither is anyone else who doesn’t have a very deep understanding of satellite orbital mechanics, the characteristics of MSU and AMSU units, the data routines that let them integrate results from multiple satellites over multiple years — do you get the drift?
“1997 to present” is a time period where getting reliable signal from noise is next to impossible. You can’t look at the output of UAH and RSS and just say one is wrong and one is right.
My reasoning on this is that the bulk of the measurements, with all the uncertainties, appears to show that in the time since 1997:
1) the surface temperatures are continuing to rise quite slowly, since all groups with their different algorithms agree
2) the tropospheric temperature signal is too noisy to tell
3) the subsurface ocean temperatures appear to be rising
b fagan
I refuse to enter an argument about which of us understands what climate anomalies are. I explained what they are and you have not pointed to any flaw in my explanation because there is none.
Onlookers can read your and my comments then decide for themselves which – if either – of us understands these matters. One thing of which I am certain is that what you have posted demonstrates you need to purchase a clue.
Richard
Richard – I know I understand the use of anomaly reporting – you might. But you said this:
“This use of anomalies is why the temperature data only vary by fractions of a degree during each year while actual global temperature (n.b. global and NOT hemispheric temperature) rises by 3.8°C from June to January and falls by 3.8°C from January to June during each year. And, incidentally, this amount of seasonal global warming and global cooling puts into perspective the silly scare-mongering about a mere 2.0°C of putative global warming over the coming century.”
I’m sorry, but your last statement still doesn’t make sense. First of all, because surface heating would affect land areas more than ocean surface, that 2C would be, on average, much higher over land. If you look at the central United States, even a 2C difference in annual average temperature can equate to having a climate that had typically been several hundred miles south of you. Growth zones in the US have been adjusted northwards several times due to these changes in average temperatures.
And all things being equal, a 2C warmer winter, and a 2C warmer summer, does make differences. If an area typically has hard freezes every winter, then doesn’t, that affects abundance of pests – as seen in northwestern forests. A 2C warmer summer means an increase in hotter days, and more importantly, hotter nights. This leads to the kinds of heat stresses that affect vulnerable populations. Or would you say that a 2C warmer winter wouldn’t reduce the stress on people due to cold?
b fagan
You really, really need to learn the first rule of holes. Your most recent attempt to dig yourself deeper quotes my having said
And then asserts
You are right to apologise because my comment may not make sense TO YOU but it does to anybody with at least two brain cells to rub together.
I will try to spell it out in a manner so simple that even a warmunist can understand it.
Water is a much greater hear sink than land and the Northern Hemisphere (NH) has much more land than the Southern Hemisphere (SH). Therefore, the seasonal temperature variation in the NH is much more than for the SH: as averages NH summers are hotter than SH summers and NH winters are colder than SH winters. And it is winter in one hemisphere when summer in the other. But average global temperature at any moment is the average temperature of both the hemispheres. Thus, as the seasons vary the global average temperature varies because the NH average temperature varies more than the SH average temperature. And the total variation in global average temperature during each year is + and – 3.8°C.
Please note that in reality temperature is an intrinsic property so temperature values cannot be averaged in any valid way but, hey, this is ‘climate science’ so nobody is constrained by what is valid in reality.
However, please try to understand what the averages are. A mere 2°C rise in global temperature is much less than the existing variation in NH temperature which occurs each year: indeed, it is about half of the difference in temperature variations experienced by the two hemispheres during each year. Anybody who thinks such a trivial change is likely to be problematic lacks any ability to think.
Anyway, this was merely an incidental point appended as illustration at the end of my post. You have not promoted all your other errors, and I suspect you have changed the subject to my appended illustration as a method for you to keep digging while deflecting attention from the fact that all your points were wrong.
Richard
What you seem to consider a trivial seasonal temperature change is what determines when, where and whether we can grow food
Flash,
A warmer world means more land for food & fiber & more food & fiber per acre. The planet has literally greened thanks to higher levels of beneficial plant food. IMO CO2 has had negligible effect upon temperature but a significant effect on vegetation, & hence human health & happiness.
Sir Harry Flashman
I see we are into ‘Wack A Mole’ again: b fagan having retired from the field you poke your head out of the ground with this gem of idiocy
NO!
I have NOT said that “seasonal temperature change” is trivial. Indeed, my explanation says it is NOT trivial.
I have said – and explained –
Your post in response clearly indicates you need to learn how to read before you undertake learning how to think.
Richard
You: “A mere 2°C rise in global temperature…”
Thesaurus: “mere –
1 used for emphasizing that something is small or unimportant”
Mr. Fagan, “1997 to present is a time period where getting reliable signal from noise is next to impossible. You can’t look at the output of UAH and RSS and just say one is wrong and one is right.” – now you are changing your argument from that RSS is an outlier. This is the first time I have heard an AGW proponent effectively defend UAH. RSS for years was used to relentlessly attack UAH as inaccurate and now that it is not being used to support a skeptic argument all of a sudden AGW proponents as telling us not to use it. Forgive me for exposing such hypocrisy.
I have seen no evidence to suggest that the surface temperature records are more accurate or more representative of a global temperature than the satellite records.
Poptech, as I’ve said elsewhere here, I can’t tell you which is more correct, UAH or RSS. They both have their own algorithms, I believe that RSS might still also use NOAA-15 data, which the UAH team considered to be unreliable as far back as 2011.
But I’m not qualified to assess the differences. There are professionals on all climate data teams who work on this as their job. All of the teams show clear warming when you look at what matters – the longest trends in the respective data sets. So I don’t attempt to tear down RSS.
I know the common thing on this blog is to try attacking the other data sets, but I doubt the attackers are qualified, either. Write it up and publish in the journals to force a change, I say. Read the following article and see that the researchers at RSS did so and forced UAH to remove a cooling bias in their data a while back.
http://en.wikipedia.org/wiki/UAH_satellite_temperature_dataset
But now UAH shows warming since 1997 and RSS doesn’t. Lots of people here conclude RSS is “right”. I don’t, and I don’t conclude UAH is “right” either. Trying to identify whether RSS or UAH is “correct” in the short period since 1997 is pointless. I say look at all the data and see what’s indicated. For satellite tropospheric temperatures, I’d say the data is too noisy to tell what the trend might be since 1997. For ocean and land surface temperatures, we’re seeing continued slow warming.
Both satellite groups show stratospheric cooling, which is predicted as part of greenhouse warming. Both show long-term warming, and solar influence doesn’t account for that. By the way, the only reason I believe the “A” in AGW is accurate is because we happen to have measurements of how much carbon we’ve been digging up and burning. The planet would be warming if the same amount of CO2 had appeared magically, or if an equivalent bulk of methane clathrate deposits in the ocean had somehow surfaced and melted.
You say “I have seen no evidence to suggest that the surface temperature records are more accurate or more representative of a global temperature than the satellite records.”
Fine, but that’s opinion, and if you are like me, you are not a climatologist or a statistician. And remember, the quotes about satellite data generally are about tropospheric temperatures, and the surface records are about, well, the bottom of the atmosphere where the sunlight finally hits something. All the different data sets have different strengths and weaknesses, the same as the climate models. That’s why the IPCC looks at big runs of a bunch of the models instead of saying one is “the right one”.
Read “A Vast Machine” by Paul N. Edwards for an interesting history of the development of the whole meteorological/climatological data capture and processing system. Should be available in libraries or used online.
Sir Harry Flashman
In response to my still extant complaint at your false and untrue assertion that I said “seasonal variation” is “trivial” you have replied saying in full
Yes, the thesaurus and my statement are both correct and are each correct.
I wrote
That is true for the reasons explained by milodonharlani in his post addressed to you here.
Will you now apologise for having claimed I said other than I did or would?
If the needed apology sticks in your craw then at least try to have sufficient decency to admit you were wrong instead of trying to deflect discussion onto the meaning of words.
Richard
Richard – why should you be getting any apologies when you clearly don’t understand the implications of a significant rise in average global temperatures?
As I pointed out earlier, a 2C average increase in surface temperature would result in an increase well above 2C on land surfaces, since the 75% of the surface covered by ocean would not warm that much. So land temperatures will, on average, see greater increases.
The high northern latitudes are seeing the greatest increases (again confirming the greenhouse effect is at work), reducing the heat difference between the Ferrel and Polar cells, which can destabilize long-term jet stream patterns, with implications for weather across the Northern Hemisphere.
This shift is already resulting in shifting in rainfall patterns, storm intensity and seasonal processes. Earlier springs might be beneficial if they didn’t have to contend with shifts in rainfall patterns, or the risk of growing season starting earlier – but being hit by killing frosts.
Don’t make the mistake that an increase in average global temperature of 2C simply means “take what you have everywhere and add 2”. It’s more complicated than that. A 2C change means the patterns change – they don’t stay the same, but hotter.
Spend some time with a few books. I found the Princeton Primers on Climate series to be quite helpful.
http://press.princeton.edu/catalogs/series/ppic.html
For the current discussion, I recommend “Climate and the Oceans” by Geoffrey K. Vallis, and also “Atmosphere, Clouds, and Climate” by David Randall.
I’m sorry but I have no idea what you’re trying to say.
b fagan
You begin your sadly stupid recent post by writing
In addition to the reasons you need to apologise which have already been stated, it would be appreciated if you were to apologise for posting unadulterated rubbish that is a waste of time reading.
It is very clear from your writings in this thread that you know nothing about this subject and – in common with all the other imaginary sock puppets dreamed up by Appell – you understand less than nothing about these matters.
I have explained why the putative rise of 2°C rise in global temperature is trivial but you ignore that and pretend such a trivial rise would be “significant”. And you have not responded to the point by mildonharlani that this putative trivial rise would be beneficial. Instead of addressing those realities you want to deflect discussion to your imagined “implications of a significant rise in average global temperatures”.
You have not stated any such “implications” because there are none. As with any possible change it is possible to imagine potential dire consequences but those imaginings are not “implications”.
How much hotter would the land be than 2°C in your imaginary scenario?
Would it be more than the rise of 3.8°C in global temperature which happens every year and nobody notices?
In what way do you think it could be a problem?
Any rational onlooker can see you are blowing smoke.
You say
The greenhouse effect (GHE) needs no “confirmation: it is real.
Anthropogenic (i.e. man-made) global warming (AGW) is an unsubstantiated hypothesis which has no supporting evidence and has failed in all its predictions.
AGW and NOT GHE suggests greatest warming at higher latitudes. Your ignorance of the difference between AGW and GHE is yet more confirmation that you know nothing and understand less than nothing about these matters.
And we are now discussing an appended illustration I provided because you deflected discussion onto that when I showed that each of your assertions was plain wrong. Your assertion of most warming being seen at high latitudes is also wrong and I suppose you have thrown in that assertion in attempt to deflect discussion again so I tell you I will ‘not play ball’ with that.
You conclude by suggesting I “read some books”.
I have been studying this subject for decades (probably since before you were born), I have published in the literature, the US NOAA and the IPCC Chairman have each asked me to peer review IPCC publications, etc.. On the other hand your every post shows you know so little about climate change that you don’t understand it.
If you want to know something then ask: I will answer if I can. But stop pretending you know anything about these matters when clearly you do not.
Richard
Wow, Richard. I tried to look you up after you boasted about your credentials. Where have you published? Are you the anti-regulation Heartland guy, or the doesn’t understand human influence Ohio State Drama guy?
Which of the IPCC reports/working groups/chapters did you participate in?
Why don’t you still understand that increasing the average temperature means that the high and low swings will also increase and that other climatic conditions would change?
You call me names, you’re really good at taking umbrage and demanding apologies and all that drama, but I really, really would like to hear you explain (not just say you explained) how an increase of 2C would not make a difference.
Someone presenting themselves as qualified while showing a lack of understanding of such basic issue is interesting. Please inform we why a rise in climate average doesn’t affect the extremes or the system which had just been warmed.
b fagan
I “boasted” about nothing.
I merely pointed out the stupidity of your ignorant assertions that I should read some elementary primers.
Every unbiased observer can see you are an ignorant, boorish and obnoxious troll who knows nothing and understands less than nothing about about climate science. For example, you are so ignorant that you think the GHE is AGW!
And you write saying to me
You are making those assertions, not me.
You need to justify your assertions. I only need to laugh at them unless and until you justify them.
And you display extreme psychological projection by falsely accusing others of all your faults.
I suggest you crawl back under whatever stone you slid from under. You and your assertions have been completely discredited by your own words and behaviours. And I cannot be bothered to respond to any more of your nonsense because all onlookers can now see you present nothing except nonsense.
Richard
Richard, your reply was pretty much exactly what I expected. Name calling, no answers to my questions, and misconceptions presented with exclamation points.
“Every unbiased observer can see you are an ignorant, boorish and obnoxious troll who knows nothing and understands less than nothing about about climate science. For example, you are so ignorant that you think the GHE is AGW!”
And earlier you said “AGW and NOT GHE suggests greatest warming at higher latitudes.”
So you are clearly confused. There isn’t an “AGW hypothesis” – basic climate science predicts that an increase in greenhouse gas will warm Earth’s the higher latitudes disproportionately – exactly what is being measured now, and it will cool the stratosphere, exactly what the UAH and RSS satellite series show. So those are predictions come true regarding the GHE as we continue to measure rising levels of greenhouse gas.
The greenhouse effect is the greenhouse effect no matter what the source of the greenhouse gas. The greenhouse effect has been measured on Mars, Venus and Titan (Titan link here: http://www.sciencemag.org/content/253/5024/1118) as well as on Earth.
The greenhouse effect is NOT anthropogenic, but the current sources of excess CO2, methane, nitrous oxide (and others) are.
If you don’t believe that, BP provides some excellent information to back up my assertion in their Statistical Review of World Energy at http://www.bp.com/en/global/corporate/about-bp/energy-economics/statistical-review-of-world-energy.html
Have a nice day!
b fagan
Your “questions” are daft: they assume your stupid and unsubstantiated assertions are true.
If and when you manage to substantiate those assertions then there would be something to discuss. At present there is no reason to consider your questions, and only an idiot would consider them.
Importantly, your links add further information that you know nothing and understand less than nothing about climate change. Allow me to start your education in the scientific method. Perhaps if you understand the scientific method then you will stop trolling by posting your ignorant, disruptive, offensive and abusive nonsense.
If you can grasp the basic scientific principle of the Null Hypothesis then you will know why this assertion from you is ignorant and illogical nonsense
The Null Hypothesis says it must be assumed a system has not experienced a change unless there is evidence of a change.
The Null Hypothesis is a fundamental scientific principle and it forms the basis of all scientific understanding, investigation and interpretation. Indeed, it is the basic principle of experimental procedure where an input to a system is altered to discern a change: if the system is not observed to respond to the alteration then it has to be assumed the system did not respond to the alteration.
In the case of climate science there is a hypothesis that increased greenhouse gases (GHGs, notably CO2) in the air will increase global temperature. There are good reasons to suppose this hypothesis may be true, but the Null Hypothesis says it must be assumed the GHG changes have no effect unless and until increased GHGs are observed to increase global temperature. That is what the scientific method decrees. It does not matter how certain some people may be that the hypothesis is right because observation of reality (i.e. empiricism) trumps all opinions.
Please note that the Null Hypothesis is a hypothesis which exists to be refuted by empirical observation. It is a rejection of the scientific method to assert that one can “choose” any subjective Null Hypothesis one likes. There is only one Null Hypothesis: i.e. it has to be assumed a system has not changed unless it is observed that the system has changed.
However, deciding a method which would discern a change may require a detailed statistical specification.
In the case of global climate in the Holocene, no recent climate behaviours are observed to be unprecedented so the Null Hypothesis decrees that the climate system has not changed.
Importantly, an effect may be real but not overcome the Null Hypothesis because it is too trivial for the effect to be observable. Human activities have some effect on global temperature for several reasons. An example of an anthropogenic effect on global temperature is the urban heat island (UHI). Cities are warmer than the land around them, so cities cause some warming. But the temperature rise from cities is too small to be detected when averaged over the entire surface of the planet, although this global warming from cities can be estimated by measuring the warming of all cities and their areas.
Clearly, the Null Hypothesis decrees that UHI is not affecting global temperature although there are good reasons to think UHI has some effect. Similarly, it is very probable that AGW from GHG emissions are too trivial to have observable effects.
The feedbacks in the climate system are negative and, therefore, any effect of increased CO2 will be probably too small to discern because natural climate variability is much, much larger. This concurs with the empirically determined values of low climate sensitivity.
Empirical – n.b. not model-derived – determinations indicate climate sensitivity is less than 1.0°C for a doubling of atmospheric CO2 equivalent. This is indicated by the studies of
Idso from surface measurements
http://www.warwickhughes.com/papers/Idso_CR_1998.pdf
and Lindzen & Choi from ERBE satellite data
http://www.drroyspencer.com/Lindzen-and-Choi-GRL-2009.pdf
and Gregory from balloon radiosonde data
http://www.friendsofscience.org/assets/documents/OLR&NGF_June2011.pdf
Indeed, because climate sensitivity is less than 1.0°C for a doubling of CO2 equivalent, it is physically impossible for the man-made global warming to be large enough to be detected (just as the global warming from UHI is too small to be detected). If something exists but is too small to be detected then it only has an abstract existence; it does not have a discernible existence that has effects (observation of the effects would be its detection).
To date there are no discernible effects of AGW. Hence, the Null Hypothesis decrees that AGW does not affect global climate to a discernible degree. That is the ONLY scientific conclusion possible at present.
Richard
Richard, you can download the data yourself. Here are some of the links.
http://www.ncdc.noaa.gov/cag/time-series/global/globe/land_ocean/p12/12/1880-2014.csv
http://data.giss.nasa.gov/gistemp/tabledata_v3/GLB.Ts+dSST.txt
http://www.cru.uea.ac.uk/cru/data/temperature/HadCRUT4-gl.dat
For the available data (January through October)
NCDC – 2014 is warmest so far
GISS – 2014 is warmest so far
HadCRUT4 – 2014 is warmest so far
RSS – 2014 is 7th warmest so far (they include November)
UAH – 2014 is 3rd warmest so far
Feel free to call me names, but making statements based on the data means you have support for what you are saying – as in “with 10 months of 2014 data available, this year is on track to be the warmest in the surface temperature records going back to the 1880s for GISS and NCDC or 1850s for HadCRUT4”
And we are still rising from the depths of the Little Ice Age in 1650.
So what will damaging and very harmful CO2 restrictions that ARE killing millions NOW going to do to mitigate this 1/5 of one degree increase?
RACookPE1978 –
First, please provide all the evidence you can find of “CO2 restrictions that ARE killing millions NOW”. And evidence isn’t blog posts.
Any of the climate reconstructions that show the Little Ice Age also show that we are much warmer now than before the Little Ice Age started. Here’s just one of those studies.
http://journals.ametsoc.org/doi/full/10.1175/2011JCLI4145.1
You can find many more referenced in this article: http://en.wikipedia.org/wiki/List_of_large-scale_temperature_reconstructions_of_the_last_2,000_years
Hi, Richard.
Your post makes it very clear that you’re the Heartland Richard S. Courtney. Links to anti-regulation sites and to Idso stuff nails that down. Lack of reference to peer-reviewed articles, appeals to the Null Hypothesis, yup.
You said: “In the case of global climate in the Holocene, no recent climate behaviours are observed to be unprecedented so the Null Hypothesis decrees that the climate system has not changed. ”
That’s an extremely damaged Null Hypothesis.
Every climate behavior has a cause, and as many here constantly point out – the climate is always changing – but your Null Hypothesis “decrees that the climate system has not changed”.
Better read up on how to formulate a valid null hypothesis. I’d provide some helpful links, but you’d take umbrage.
And your UHI bit is a classic. But here we are heading to the warmest year in the surface temperature record, and the oceans are driving that. The land-only data sets aren’t putting us at #1, it’s the ocean temps leading.
For GISS – global land plus sea surface temp shows 2014 is #1, but land-only is #4
For HadCRUT4 – global is #1, but land-only is #5.
So, no science, just anti-regulation propaganda. Got it – you’re the Heartland guy, not the other Richard S. Courtney. Thanks for making that clear.
Have a nice day.
b fagan
You have now gone from being a joke to being a very sad clown.
I gave you a clear explanation of how and why the Null Hypothesis refutes your ignorant and anti-scientific superstitious twaddle, and that explanation includes three links to papers in the peer-reviewed literature. You reply saying
That reply is madness.
I have ONLY cited, argued and referenced science in this thread.
You have spouted superstitious, anti-scientific twaddle.
My clear socialist views have induced my being repeatedly reviled on WUWT.
Yet you make the surreal – and irrelevant – personal insult that I promote “anti-regulation propaganda”.
Clearly, your ignorance of me is as great as your ignorance of climate science: and you admit that you found it “helpful” to read “primers” on climate science.
I do not know what you mean by saying I am “the Heartland guy”.
I am proud to say that I was invited to provide a presentation to the first Heartland Climate Conference in 2008 and my presentation was an exposition of one of our 2005 papers; viz.
Rorsch A, Courtney RS & Thoenes D, ‘The Interaction of Climate Change and the Carbon Dioxide Cycle’ E&E v16no2 (2005).
Also, Zeb Jaworowski was nearing his demise and he was too ill to attend that Conference so I accepted his request for me to present his paper to that same Conference (I had the honour to consider Zeb a friend and colleague from 1986 onwards although we were on opposite sides of the Iron Curtain and he was a communist and atheist while I was – and am – a socialist and Accredited Methodist Preacher).
None of this is relevant to the subject of this thread but you said you wanted it to be “clear”.
What is clear is that you know nothing and understand less than nothing about climate science. And you attempt to promote your superstitious belief in AGW by attacking those who promote and defend science. I suspect that you are a teenager seeking a sense of self-worth by your activities. I tell you that those attempts will fail: you cannot gain anything for yourself by trolling other people.
Richard
More name calling. An odd repeat of the “I’m older than you” argument (by the way, I’m middle-aged).
I’ve been reading and following science avidly since the 1960s, and as I’ve become more interested in climate issues, I have in fact read seven of the Princeton Primers on Climate, Spencer Weart’s “The Discovery of Global Warming”, Paul Edwards’ “A Vast Machine” and recommend them all. I’ve never read a word of Al Gore, or seen his movie.
I’m not an alarmist, I’m simply an interested person who is convinced that the bulk of the evidence shows we are at risk. You present two science papers (one from 1998, and one that’s been admitted by the authors to contain errors, and a link to an anti-regulation “Friends of Science” piece.
Your selection is at the decidedly low-end of a broad spectrum of climate sensitivities, yet you seem to feel that the lowest impact is settled science. I can reply by simply suggesting you look at Weart’s 2000+ item bibliography and at the IPCC Working Group 1 bibliographies for papers that include both low-sensitivity and higher sensitivity work. Most published, peer-reviewed research indicates higher sensitivity than you accept. The accepted range of sensitivity for doubling is 1.5C to 4.5C, but that’s not including all feedbacks, and doesn’t include the fact that continued expansion of emissions pushes us towards more than doubled CO2 levels.
You represented the coal industry, you appear to be on the editorial board of a journal notable for publishing authors who show up at the Heartland events with dizzying frequency – yes, I do feel that you are a bit biased in your opinions.
I believe that the responsible thing to do is to make a concerted effort to end the use of fossil fuels in the next 40 or 50 years. They were wonderful as the starting point for developing an industrialized society with all its benefits, but they also produce far more toxic residue than we need, lead to damaging global politics and military costs, and are affecting the climate while also changing ocean chemistry.
My feeling isn’t based only on climate warming and ocean pH change – those are just the last two straws on the camel’s back, indicating it’s time to be building the next energy environment. China’s got over a million a year dying from their pollution – Putin’s control of Europe’s energy security is repugnant, and I’m tired of the U.S. spending so much of my tax money on military involvements in the Middle East – an area that we wouldn’t nearly care about if it weren’t for what they have underground.
If this were thirty years ago, I’d say would still be forced to depend on fossil energy for the foreseeable future, but we now have enough real technologies in power generation, storage and management to make it possible to continue providing energy while eliminating the negatives of the fossil fuel legacy. It takes a while and costs money, but so do coal plants, constantly shipping the fuel, discarding the toxic ash….
Merry Christmas
b fagan
You have been spouting anti-scientific superstitious nonsense and throwing mud.
I have been rejecting your superstitious twaddle with scientific information, and I have explained why your mud cannot stick.
But you have the gall to accuse me of “name calling”.
If and when you learn some climate science then we can have a rational discussion about that subject. And you claim to be an adult: whether or not that be true, you need to grow up if you want to conduct rational discussion.
You now say you want to end the use of fossil fuels. That is a call for mass death on a scale that would pale into insignificance the combined activities of H1tler, Stal1n, Pol Pot and Gengis Kahn. All human acitivity requires energy supply. There are no viable alternatives to fossil fuels and nuclear power for industrial civilisation: they provide abundant energy supply and technologies to use it which have freed people from the constraints of ‘renewable’ energy and the need for the power of muscles provided by slaves and animals. You seem to be blind to the obvious truth that use of fossil fuels has freed humans from the need for slaves to operate treadmills, the oars of galleys, etc..
I repeat that you need to learn you cannot benefit yourself by trolling other people. Try to grow up instead.
Richard
@rgb. There is a weak solar cycle at 67 years. Komotiv or some such name, also another paper by 3 people found a 66.5 year cycle.
http://www.climate4you.com/images/Ap-Index%20Since199001.gif
What comes after “The Great Pause”?
“The Great March Upwards and Onwards”
or
“The Great Plunge”?
Mr Fagan continues to delude himself. All of the principal temperature datasets show a zero trend over several years. Nor do I contrive an algorithm: I use the method of least-squares linear regression, which he will find in any elementary textbook of statistics. The unalterable fact remains that there has been no global warming for somewhere around a decade and a half, and that the rate of global warming (expressed as the least-squares trend on the mean of all five principal global-temperature datasets) is half of what the IPCC had predicted with “substantial confidence” in 1990.
Sir: “a zero trend over several years”? That’s why climatology doesn’t fiddle with “several years”, it’s weather.
I’m presented with measurements from every data set (HadCRUT4, GISS, NCDC, UAH, RSS, JMA) that show that all warmest years in their respective data sets are on or since 1998, and they are all indicating that 2014 is going to be at minimum one of the top 3 if not the warmest year on record. The oceans are gaining heat at the same time the surface is warming slowly. To me, that is unalterably looking like continued warming.
So I’m not convinced. And IPCC “projected”, not “predicted”. This isn’t quibbling, since climate science projects ranges of possible outcomes – not specific year-by-year outcomes. The fact that global temperatures rose faster than model projections in the 80s and 90s and rise slower than most projections recently doesn’t change the fact that the heat is increasing. 80s were the hottest decade until the 90s were, then the 2000s, and we’re looking good so far to continue passing “warmest decade” along.
By the way, how is the peer review coming on that “Singer Effect” paper you promised? The one where you were going to conflate the giant El Niño warming and the volcano-induced cooling and try to pitch it as a single climatic something? I’m still looking forward to reading it.
Regards.
Agreed, just submit the evidence to the real world for peer review , end of saga.
b fagan: “so I’m not convinced”
####
But you are confused. You are still stuck on OHC which has nothing to do with CO2, your qualms notwithstanding.
Also, projections vs predictions is a semantic quibble.
Also, the IPCC defines global warming as an increase in surface temp., not in SST
Temperature trends have never exceeded modeled trends. Your claim that they have is error.
Wrong again. The satellites don’t show 2014 as warmest. Far from it. The “surface” “data” sets are shamelessly rigged. In RSS, IIRC, this year will probably rank #7 since 1979. And this is a quasi-El Nino year, so naturally warmer.
HadCRU & GISS are worse than worthless.
Most of your posts here seem similar. “Those other data sets are —insert disparaging remark—” with no published non-blog science to back you.
Write up some papers, analyze the changes made, review the data validation and gridding operations and all the rest of it, get the papers published. That’s how the satellite teams finally removed the errors from ignoring orbital changes. Otherwise, you are saying “blah, blah, blah.”
That is was a quasi-El Niño year does show up in the surface sets – though not yet in the ENSO 3.4 index.
With the year not yet finished, here’s how most of 2014 ranks:
Global surface
NCDC = #1 of 135 years
HadCRUT4 = #1 of 165 years
GISS = #1 of 135 years
Land only (showing oceans presented more of the warming)
CRUTEM4 = #5 of 164 years
GISS = #4 of 135 years
Satellite
UAH #3 of 36 years
RSS #7 of 36 years
So, what we’re seeing is that at the surface of the planet, the year is overall probably going to be the warmest, especially over oceans.
And up in the air, we’re likely 3rd or 7th warmest, without El Niño like the whopper in 1997-1998 or the lesser one between 2009-2010.
And if you look at your favorites at RSS – they’re continuing to report several results that are in line with warming such as increased water vapor (adding it’s greenhouse feedback), increased North Polar temps in line with CMIP-5 models, and cooling stratosphere, actually cooling slightly more than CMIP-5 simulations
Read the whole page at this link, and note the frequent statements about warming, and discussion about where the overall tropospheric correlation might be off.
http://www.remss.com/research/climate#Atmospheric-Temperature
By your reckoning the ~20 year interval of slight warming from c. 1977-96/98 is also just weather. The shortest interval of climate is 30 years.
Since late in WWII, there were over 30 years of cooling, as CO2 rose, then 20 years of warming as that trend continued, & now going on 20 years of flat to cooling, depending upon data set, even while CO2 keeps rising.
If RSS still shows flat to cooling T in about two years, then CACA will yet again be shown false. But it was born falsified.
Of course, if the original CACA advocates’ statements about 15 & 17 years warming remain in effect, the hypothesis is already falsified. Again.
Mr Fagan continues to delude himself. All of the five principal global-temperature datasets do indeed show a zero trend over several years, notwithstanding the predictions of the models.
Rates of warming are not determined solely by the extreme years (up or down), but by taking account of each monthly value.
The measurements of the ocean are entirely inadequate to determine whether it is accumulating heat or not. If it is, why is it not warming the atmosphere? During an el Nino, the warming of the surface ocean translates into atmospheric warming within as little as two months. Yet there has been 18 years 2 months without global warming. See the appendix to my forthcoming paper in a leading science journal on why the models failed: it deals with the “ocean warming” meme comprehensively.
As for the tiresome quibble about whether IPCC “projected” or “predicted”, IPCC (1990) plainly uses the word “predict”.
Temperature has not risen faster than models projected at any time, save only during the Singer Event.
There is no evidence that the “heat” is increasing: on the contrary, it is clear from all datasets that the atmosphere has not been warming during the past decade or two.
The SInger Event paper will have to wait: a major paper on what went wrong in the models will be published first – probably in ten days’ time. Then an invited paper for the same journal will require final polishing and submission.
The fact remains that – on the mean of all five principal global-temperature datasets – the rate of warming since 1990 has been half of what was then predicted with “substantial confidence”. The “substantial confidence” was misplaced.
Of course, all other things being equal, one would expect the ocean/atmosphere system to be accumulating heat. However, it is not clear that all other things are equal. And it is not clear that, even if they were equal, the accumulation of heat would be sufficient to be detectable. The atmosphere is sandwiched between two very large heat-sinks. Homoeostasis just like that which has occurred over the past 800,000 years, with absolute temperature varying by little more than 1% either side of the long-run mean, is likely to continue, and to exercise a considerable damping influence on the propensity of the atmosphere to warm in response to the small perturbation in its composition that we are achieving.
Except to keep up the scare so profitable for their perpetrators & government paymasters.
Another conspiracy theorist, science and logic have left the building
Let’s hear you explanation for why the “surface” record has been so blatantly manipulated, as easily demonstrated. Thanks.
Jim Hansen & Phil Jones left the science & logic building for the activism building.
I see cherrypicking here to include the one dataset that shows greatest magnitude of a century-class warming spike early in a cherrypicked 18 year 2 month period. Is not century-class in that short a dataset some sort of outlier?
It appears to me that honest flat linear trends in global temperature started sometime in 2001. Also, I see the corner-time for post-corner and pre-corner linear trends joining each other as being largely around 2003 to early 2005, and that may be the actual start time of a very slight cooling trend that could continue another 20 years.
The way things seem to me, a significant part of the fast warming trend from ~1973 to 2003-2005 is a natural cycle, that since reversed. The fact that cooling since then (or even since 1998 or late 1996) is close to zero appears to me to indicate that warming from CO2 increase since then mostly negates the downturn of the cooling part of this natural cycle.
As a result, I see manmade global warming as accounting for about half of the warmup from 1973 to 2003-2005. Non-CO2 portion of manmade greenhouse gas increase, largely stalled sometime in the 1990s, appears to me to account for about 10-15% of the manmade component of global warming from ~1973 to ~2003-2005. So, I figure that manmade global warming via increase of CO2 is occurring, at about 40% of “IPCC center track”.
One thing I ask is to avoid overstating of one’s case. Getting caught overstating leads to a credibility problem. I see a credibility problem with both IPCC and with claim of lack of cherrypicking in indicating that the pause started in 1996.
Exactly the opposite. His method is: Take the last report issued from a single source. Don’t jump from source to source as things vary each month, just stick with one source of global average temperature for each month as it is issued.
“Draw a line” from the latest month’s report back horizontally as far as it will go. (Staistically speaking of course.)
Find the date the horizontal line from the CURRENT MONTH meets the rising temperatures of 1976 – 1998. Report the time interval: 18 years and 2 months.
No “cherry-picking” at all. If, for example, December were very hot, then the next report might be 16 years, 3 months.
And he just accidentally happened to pick the lone temperature data set that includes a zero trend since 1997? Gee, what are the odds of that? He wasn’t picking cherries, but one just seemed to fall into his lap.
D: “overstating one’s case
####
It is worse to make a series of nebulous assertions.
Finally – someone who sees thing they way I do.
Yep – spot on. Of course warming didn’t stop in 1996. Just check, say, the 5 year mean anomalies centred on 1996 and 2010.
‘D’ is correct that there are cycles of period ~60 years in global temperature, that the current negative or cooling cycle began with the new millennium [broadly coincident with the phase transition in the PDO] and that, therefore, the Great Pause that began in 1996 may be the offsetting of a small CO2-driven warming effect by the negative 30-year phase of the PDO cycle.
However, the models predicted neither the cyclic influence of the PDO nor the weakness of our warming influence. Therefore, they did not predict the Great Pause. Nor did they predict the widening discrepancy between the predicted and observed warming rates.
Mr Finn proposes a traditional IPCC dodge – comparing successive pentads rather than longer periods of successive months – to pretend tha global warming has not paused.
In truth, the more honest scientists in the climatological community are acknowledging – as they must – that the growing discrepancy between prediction and observation is suggestive of errors in the models that have created a warming bias in their predictions.
The question what went wrong in the models is considered in more depth in a forthcoming paper. Watch this space.
Please Christopher , just submit your evidence to the real world
“Frank”, whoever it is, should read the head posting, where it will find evidence in plenty, submitted to the real world and now widely featured in the media worldwide. There has been no global warming for 18 years 2 months, and the rate of warming in the quarter-century since IPCC’s first report in 1990 has been half of what was then predicted with “substantial confidence” – a confidence that was substantially misplaced.
The forthcoming paper on why the models went wrong will be reported here in due course. Watch this space.
Mr. Monckton, will the adjustments to the satellite “why the models went wrong” paper be because they’d been missing important volcanic aerosol data and have been missing a significant negative forcing?
Ridley, D. A., et al. (2014), Total volcanic stratospheric aerosol optical depths and implications for global climate change, Geophys. Res. Lett., 41, doi:10.1002/2014GL061541.
“Understanding the cooling effect of recent volcanoes is of particular interest in the context of
the post-2000 slowing of the rate of global warming. Satellite observations of aerosol optical
depth (AOD) above 15 km have demonstrated that small-magnitude volcanic eruptions
substantially perturb incoming solar radiation. Here we use lidar, AERONET and balloonborne
observations to provide evidence that currently available satellite databases neglect
substantial amounts of volcanic aerosol between the tropopause and 15 km at mid to high
latitudes, and therefore underestimate total radiative forcing resulting from the recent
eruptions. Incorporating these estimates into a simple climate model, we determine the global
volcanic aerosol forcing since 2000 to be -0.19 ± 0.09 Wm-2 . This translates into an
estimated global cooling of 0.05 to 0.12 °C. We conclude that recent volcanic events are
responsible for more post-2000 cooling than is implied by satellite databases that neglect
volcanic aerosol effects below 15 km. “
Well, let us look at the data, rather than the assumed study parameters.
http://www.esrl.noaa.gov/gmd/webdata/grad/mloapt/mlo_transmission.gif
Nope. Nice try, but that assumption has been tried before – It does not fly.
If you require accepting Mauna Loa CO2 data from 1959 through 2015 as valid for the entire earth, then Mauna Loa sky clarity data needs to be also valid, right? it the measured sky clarity is the same the past 22 years. No change due to assumed volcanoes.
Christopher, by the real world , ‘It’ meant the reputable scientific community where they peer review submissions to weed out the armchair scientists, not the mainstream media or the Heartland Institute .
Your humble neutered subject
One has not heard “Frank” or its ilk asking Al Gore or their ilk whether their disproven-by-events rubbish has been peer-reviewed. However, the reviewed papers on the basis of which RSS compiles the data I have used in the head posting are linked from remss.com.
And the paper I am about to publish has gone through the usual six months of rigorous peer review and will appear shortly in one of the world’s leading journals of science. Don’t whine till you’ve read and understood it.
The ‘ilks’ shall wait with baited breath to see the paper. Which leading journal is it ?.
Das Frank
“Frank” should wait a week or two and see.
Regarding the peer-reviewed paper – there’s a first for everything*, but unlike Frank, this ilk will not bate his breath while waiting.
*I only say “first for everything” because I search Google Scholar for “climate author:Monckton” and don’t find anything in a peer reviewed journal. As always, it’s possible that I’m missing some link.
I am waiting eagerly for the Singer Event paper.
If I remember correctly, to fabricate a Singer Event, one follows this recipe:
1 – take the global cooling resulting from a very large volcano (let’s use Mt. Pinatubo), and call it “Start Temp”
2 – take the global warming from a very large El Niño (let’s just happen to pick the 1997/98 one). Call that “End Temp”
3 – subtract Start Temp from End Temp.
4 – brush away all references to volcanoes and El Niños
5 – call the temperature change in #3 a “Singer Event”
Was that it?
I should scold everyone here for not understanding what they see when the look at temperature curves. But I forgive you because you are not alone. Temperature curves as presented to us are often computer smoothed or simplified so that their real structure is hard to see. Satellite temperatures are the best way to get started. At high resolution you can see that satellite global temperature curve is a superposition of two independently oscillating components. The larger oscillation has a period of about five years. It is related to ENSO. The smaller one has a period of approximately a month or so. It appears as a fuzz covering the larger scale oscillation. It is related to cloudiness and cannot be eliminated. Its amplitude is limited because the cloudiness view constantly changes as the satellite view sweeps the pattern of clouds. This cloudiness pattern must be covered with a semi-transparent red marker, just wide enough to cover most of it. Having done that you end up with a pattern representing the global temperature change as best it can be shown. But it is an oscillation not tied to anything and we want to relate it to global temperature. The oscillation peaks correspond to El Ninos and its valleys correspond to La Ninas. The midpoint between an El Nino peak and its neighgboring La Nina valley represents global mean temperature for that moment. Connecting all these points shows what global mean temperature is doing. In the eighties and nineties these dots define an almost perfect horizontal straight line, telling us that there was no warming during this period. But this is not what you see in official temperature records. Instead of a temperature standstill in the eighties and nineties it turns out that GISS, NCDC, and HadCRUT all show warming there, about a tenth of a degree per decade. This is an outrageous falsification of global temperature record and amounts to falsified science. I first pointed it out in my book “What Warming four years ago but nothing happened. Turns out that such falsification has been going on for years. This false warming was at one time invoked as proof that anthropogenic greenhouse warming exists. On the contrary, if official temperature carriers have to stoop this low they must know that their legitimate warming must not be real. An additional proof of temperature manipulation comes from comparison of the three temperature sources cited above with satellites. It turns out that all three were subjected to computer manipulation of data which left its footprints in publicly available temperature records. These computer tracks comprise sharp upward pulses at the beginnings of years, all exactly in the same locations in their datasets. There is even one sitting on top of the 1998 super El Nino and making it taller. They are all easy to see if you put them next to a satellite data set. We know from closely examining the eighties and nineties that they raised global temperatues there also. Further checking shows that they did not stop there but continued in the twenty-first century with the absurd result that in their temperature curves the 2010 El Nino is now higher than the super El Nino of 1998. This bold, sustained, and long-term falsification of temperature data should be sufficient to prohibit any of these data sets from being used in future scientific documents again. Any published papers using these data should submit appropriate corrections or be withdrawn.
Monckton:
For guidance, at the December 2012 Doha conference I was banned from UN climate yadayadathons for life for the grave sin of telling the truth that there had been no global warming for 16 years.
Slight economy with the truth here, you were kicked out and banned for taking a vacant seat of the representative from Burma and addressing the conference from his microphone.
Mr Fagan continues to delude himself. Reviewed papers by me have appeared in various journals, including the Annual Proceedings of the Seminars on Planetary Emergencies of the World Federation of Scientists, Energy and Environment, Science and Education, and Physics and Society.
The last, having commissioned, reviewed and published my paper, with a supporting editorial, sacked its editors and also briefly attempted to deny that my paper had been peer reviewed, but withdrew that assertion when I was able to produce the review comments.
This episode, reinforced by Mr Fagan’s lazy search of Google Scholar, his sneering tone and his implicit belief that a man’s past publication record matters more than the quality of that man’s present argument, shows how reluctant the true-believers (paid or unpaid) have become to engage in honest, rational, competent scientific dialogue.
Mr Fagan may find uncongenial the fact that the planet is not warming even half as fast as predicted, but it is a fact, and my forthcoming reviewed paper will expose several of the elementary errors perpetrated in the general-circulation models that have over-predicted global warming with such relentless and suspicious unanimity. In short the paper, co-authored by me together with three distinguished colleagues, will provide some insight into why the models have failed.
Perhaps it would be better if Mr Fagan were to do less sneering until he has at least seen my next paper, and if he were then to attempt to confine his comments thereupon to the scientific realm, and to express them courteously. However wrong he may wish me or conceive me to be, he reflects no credit on his cause by persistent and unjustifiable discourtesy.
Christopher,
I cannot find any articles by you that are truly peer reviewed ( by more than one person ) and not simply editor reviewed . Could you post links please ?.
The APS article was prefaced with a statement highlighting the absence of any peer review.
Where will your expected peer reviewed paper be published ?.
Das Frank
Phil.:
It is to Monckton’s credit that he was expelled under the circumstances that have been chronicled here and elsewhere. We need more Moncktons in those types of conferences.
On the question of the Singer Event, the step- change in global warming between the recovery of global temperature from the post- Pinatubo cooling of 1993 and the Great El Niño of 1998′ the significance lies in the fact that the event’s causes were chiefly natural and that, aside from it, there has been little global warming during the satellite era,
You keep calling two events an event. Basic arithmetic problem there. 1+1 = 2, not 1.
Event 1 – The Pinatubo cooling was a genuine cooling of the global climate system due to a temporary increased albedo from sulfur aerosols, reducing incoming solar radiation.
Event 2 – The El Niño was a temporary movement of heat from ocean to atmosphere – which then moved back to the oceans during subsequent La Niña’s.
So El Niño/La Niña doesn’t change the global heat content, they just move it back and forth between air and ocean.
Since oceans represent the greatest heat capacity in the global climate system, any consideration of global warming must take them into account. They are warming steadily throughout the satellite era, and also are warming steadily since 1997. Look particularly at graphs 2 and 3.
http://www.nodc.noaa.gov/OC5/3M_HEAT_CONTENT/
You are trying to treat two separate events as a single event (duct tape might help) and then represent the surface temperature as “climate” temperature, leaving out the largest component.
If I were Fred Singer I’d insist that you call it the Monckton Event. Good luck with the reviewers at the journals. I subscribe to Science – are you trying there? I don’t subscribe to Energy and Environment.
Mr Fagan, determined as ever to offer nothing constructive, perpetrates the elementary logical solecisms of muddling the parts for the whole. The Singer Event – a sudden,sharp increase in global temperature lasting only a few years – had two causes – the rebound of temperatures following the Pinatubo cooling, and the great El Nino of 1998. Remarkably, there was little or no warming either side of the Singer Event. This pattern of temperature change is inconsistent with a steady increase in the forcing caused by greenhouse-gas enrichment.
And, within the measurement uncertainty, the oceans may not be warming at all. The ARGO network shows them warming at about a sixth of the model-predicted rate.
Fredcehak is yet another who is more fascinated by wondering about my publication record than by the scientific significance of the facts in the head posting.
I have already listed some of my reviewed papers. Let Fredcehak read them and respond to the science therein.
There is no disclaimer above my reviewed paper in Physics and Society. As I have already explained up thread, the American Physical Society, faced with complaints from some 40 of its Fellows, removed the disclaimer falsely asserting that my paper had not undergone any form of peer review after I produced a copy of the review comments.
My next reviewed paper is now in final proof and has had its DOI assigned to it. Publication timetable is in the hands of the editors, but it should not be long now.
And what about asking Al Gore if he has ever had anything peer reviewed and published?
Mr. Monckton – please do provide the DOI so we can be among the first to read the paper.
But still you make reality-challenged statements directly contradicted by the evidence at the source.
You say
“There is no disclaimer above my reviewed paper in Physics and Society. As I have already explained up thread, the American Physical Society, faced with complaints from some 40 of its Fellows, removed the disclaimer falsely asserting that my paper had not undergone any form of peer review after I produced a copy of the review comments.”
All untrue. Links provided to verify.
Note what “Physics and Society” says about itself – peer review ain’t in it.
“Physics and Society is the quarterly newsletter of the Forum on Physics and Society, a division of the American Physical Society. It presents letters, commentary, book reviews, and non-peer-reviewed articles on the relations of physics and the physics community to government and society.”
http://www.aps.org/units/fps/newsletters/index.cfm
Here is the editor’s note at the top of your piece “Climate Sensitivity Reconsidered”
“The following article has not undergone any scientific peer review, since that is not normal procedure for American Physical Society newsletters. The American Physical Society reaffirms the following position on climate change, adopted by its governing body, the APS Council, on November 18, 2007: “Emissions of greenhouse gases from human activities are changing the atmosphere in ways that affect the Earth’s climate.”
http://www.aps.org/units/fps/newsletters/200807/monckton.cfm
Here is a letter from a reader to the editors, concerned about a press release still on the Science and Public Policy web site that falsely claims your piece is peer-reviewed.
Again, “Editor’s response: The newsletter of the Forum on Physics & Society is not, and never has been, peer-reviewed.”
http://www.aps.org/units/fps/newsletters/200810/shore.cfm
Here’s the press release that is still, and has always been, lying about peer-review of an article that you still claim, incorrectly, is peer-reviewed.
http://scienceandpublicpolicy.org/images/stories/press_releases/Press-Release_No-Climate-Crisis.pdf
Who cares about Gore? I look at the science published in “peer-reviewed journals”. And when people make easily checked statements that aren’t true, I keep that in mind when considering all of their work.
Mr Fagan, increasingly desperate to find fault, now accuses me of lying in a press release that said ny paper in Physics and Society had been peer-reviewed. This is merely the latest in a series of sneering smears.
Any reader may enter “Physics and Society July 2008” into Google and then click on “Download entire issue”. He will then find the current version of the issue that contained my invited paper, together with a strong supporting editorial from the then editors.
If the reader, having checked that there is no disclaimer above my article, goes right to the end of the issue, he will now find a false statement that the journal publishes non-peer-reviewed articles. However, in the original version of the edition as published and unalterably in print, the statement said the journal published reviewed articles. One need only go to any previous issue of the journal, such as that for April 2008, to see the statement as it had appeared in the original printed version of the issue in which my paper appeared. Indeed, the [Reveiw ]Editor is listed too.
So, what happened? When my paper was published, there was no disclaimer above it. Far from it. There was a strongly supportive editorial. And the statement at the end of the issue referred to “reviewed articles”. Ten days later the online version carried a disclaimer above the paper, saying the paper had not been peer-reviewed, that the Council of the American Physical Society disagreed with it, and that the entire scientific community disagreed with it.
I wrote to the president of the APS, who then had the disclaimer altered because the Council had not considered my paper and no survey of wider scientific opinion had been taken. However, the new version of the disclaimer still said the paper had not been reviewed, when it had been. At this point, some 40 Fellows put pressure on the President. The disclaimer was then removed, but the alteration to the original wording of the statement at the end of the journal, from “reviewed articles” to “non-peer-reviewed articles”‘, remained. I had no objection to that, because my paper had been reviewed under the pre-existing regime, which was only changed because the APS came under intense pressure from various quarters to try to deny that my paper had been reviewed.
The usual procedure for correcting a paper is for another scientist to write a rebuttal, which is then published in the following issue together with a refutation by the original author. Sure enough, a member of APS’ staff wrote a 3000-word rebuttal and, within 12 hours, I had written and submitted a 3000-word refutation, dealing fully and easily with all points. However, by then the APS had sacked the two editors for failure to adhere to the Party Line on the climate question, which is why the new and more acquiescent editor wrote in a subsequent edition that my paper had not been reviewed. It had been – so [get] over it and move on.
Mr Fagan also says ocean heat content has been rising. Well, according to the ARGO bathythermograph [buoy] it has been rising at only about one-sixth of the rate predicted by the models, but the uncertainties in the measurements are so great that it is likely there has been no increase in heat content at all. Likely because if ocean heat content in the upper or mixed stratum had increased then the air would have warmed too, but it has not, for 18 years 2 months. And if the missing heat had somehow found its way to the benthic strata then it is harmless to us. For the ocean is a very, very large heat-sink, three orders of magnitude denser even than the surface atmosphere.
The other boundary of the atmosphere is of course outer space, an infinite heat-sink. Elementary thermodynamic considerations suggest that a far from dense fluid medium sandwiched between two very large heat-sinks is most unlikely to warm by much in response to the rather small perturbations we are able to achieve. Indeed, in almost a million years the global [temperature] reconstructed from ice cores has fluctuated by little more than 1% either side of the period mean, and there is not the slightest serious reason to suppose it is going to change by much more than that in our own era.
In the above, for “the premature” read “temperature”. I wish Apple did not have autocorrection – it nearly always does more harm than good.
Christopher,
It would be in your interest to clearly post all these reviews and corrections on your own site, why are they so hard to find ?
In response to “Frank”, my publications generally concentrate on the science and economics of global warming, not on the antics of those who take an aprioristic position and refuse to extend the usual scientific courtesies to those with whom they disagree.
My paper in Physics and Society appears in the July 2008 edition, where it may be read and – if thought fit – criticized by all. It was self-evidently produced under the regime clearly spelt out in the footnote to the previous edition of the journal, which stated that it published “reviewed” papers. It is self-evident from the July 2008 edition that there is no longer any disclaimer of the sort that Mr Fagan had mistakenly said was still present, for the disclaimer was eventually removed.
As I always do, I responded fully and carefully to the review comments the journal sent to me. The particular concern was that there were several equations that had not hitherto appeared in the literature and I was asked to justify each one and explain its derivation. I did so, to the full satisfaction of the reviewers, and as a result the revised paper was 3000 words longer than the original 5000 words. It is one of the longest papers the journal has ever published (its usual length is just 2500 words), but the editors were very pleased with it. It has stood the test of time well: there are a few infelicities, but there is nothing substantially in error, and it was one of the earliest papers to draw attention to the defects in the methodology of the general-circulation models in the determination of climate sensitivity.
Those defects are considered in more detail in my forthcoming reviewed paper in a leading journal. Watch this space.
Monckton – you say “It is self-evident from the July 2008 edition that there is no longer any disclaimer of the sort that Mr Fagan had mistakenly said was still present, for the disclaimer was eventually removed. ”
The multiple links I provided to the APS site still show the disclaimers, self-evidently.
http://www.aps.org/units/fps/newsletters/200807/monckton.cfm
http://www.aps.org/units/fps/newsletters/200807/
http://www.aps.org/units/fps/newsletters/200810/shore.cfm
So, the APS has put us into the curious case of each being technically correct. The PDF link to the full newsletter is as you say. The web site’s multiple links are as I say.
The American Physical Society has eleven refereed journals. The policies about article selection, the peer-review process, etc. for each official journal can be found here http://journals.aps.org/policies
For their official journals, editorial policy is guided by the following statement adopted in April 1995 by the Council of the APS:
“It is the policy of the American Physical Society that the Physical Review accept for publication those manuscripts that significantly advance physics and have been found to be scientifically sound, important to the field, and in satisfactory form. The Society will implement this policy as fairly and efficiently as possible and without regard to national boundaries.”
Physics and Society is not one of the eleven APS peer-reviewed journals.
It is one of 39 less-formal “Unit Newsletters”, and of those, Physics and Society was the only one to ever include the words “peer-reviewed” in its self description. I believe the APS regretted that slip and has officially clarified the policy – “Physics and Society” not being a publication held to APS peer-review standards for their official journals.
Here’s the site for all the newsletters http://www.aps.org/publications/other.cfm
I looked at online and PDF issues of every other forum – from issues prior to your 2008 article – and no other newsletter in the “Forums” section ever said items were peer-reviewed, nor did samples of others I checked in the “Divisions”, “Regions” or “Special Groups” collections.
None mentioned peer-review, and several expressly mentioned that articles were writer’s opinion only.
I’ve written newsletters in the past, including one while working at a large company. I’d sometimes get pieces from co-workers, and sometimes request specific changes before including the article, but in no case was my newsletter presenting those “reviewed” articles as anything other than helpful information. If I had presented my newsletter contents as being official statements of company policy, I’d have been removed. It was just a newsletter.
There have been numerous critiques of your paper in other locations – this one appears to be the most comprehensive:
“A detailed list of the errors in Monckton’s July 2008 Physics and Society article” http://altenergyaction.org/Monckton.html
http://www.aps.org/units/fps/newsletters/200807/monckton.cfm
Love the disclaimer at the top…
…
“The following article has not undergone any scientific peer review, since that is not normal procedure for American Physical Society newsletters. ”
In reply to Mr Socrates, that is indeed the untruthful disclaimer that was removed from the issue itself, which can be accessed directly by googling “Physics and Society” “July 2008”.
When you Google “Physics and Society”
The first link given is
http://www.aps.org/units/fps/newsletters/200807/
…
If you then click on the
“Climate Sensitivity Reconsidered
By Christopher Monckton”
…
You get
http://www.aps.org/units/fps/newsletters/200807/monckton.cfm
…
Which contains the disclaimer.
…
If they told you they removed it, they haven’t
When you Google “Physics and Society” “July 2008″.
The first link you get is
http://www.aps.org/units/fps/newsletters/200807/
…
The first sentence states…..
.
“The Forum on Physics and Society is a place for discussion and disagreement on scientific and policy matters. Our newsletter publishes a combination of non- peer- reviewed technical articles, policy analyses, and opinion”
Please note the words ……non- peer- reviewed….”
To Mr Socrates I say, “Asked and answered”. The link he provides is to an older version of the web content of Physics and Society that still contains the disclaimer. As I have already explained, googling “Physics and Society” “July 2008” will provide a link to the actual issue in its current Web for, which does not – repeat not – contain the lying disclaimer that had briefly been added to it.
Readers who would like to know more about the review process and comments for my 2008 paper can go to scienceandpublicpolicy.org and enter “Reviewed or Not Reviewed” into the search pane. One of the first few items listed is a paper by me setting out details of the controversy.
Bottom line: whether various trolls like it or not, my paper of 2008 was a reviewed paper, and it was one of the earliest to suggest that the global warming in response to a doubling of CO2 concentration would be less than 1 Celsius degree.
Since the trolls, desperate to divert attention from the main point of this thread that there has been no global warming for 18 years 2 months, have decided to draw readers’ attention to my 2008 paper, I now have pleasure in repeating that paper’s conclusion:
“Even if temperature had risen above natural variability, the recent solar Grand Maximum may have been chiefly responsible. Even if the sun were not chiefly to blame for the past half-century’s warming, the IPCC has not demonstrated that, since CO2 occupies only 1/10,000 more of the atmosphere than it did in 1750, it has contributed more than a small fraction of the warming. Even if carbon dioxide were chiefly responsible for the warming that ceased in 1998 and may not resume until 2015 [I was right about that one], the distinctive, projected fingerprint of anthropogenic ‘greenhouse-gas’ warming is entirely absent from the observed record. Even if the fingerprint were present, computer models are long proven to be inherently incapable of providing projections of the future state of the climate that are sound enough for policymaking. Even if per impossibile the models could ever become reliable, the present paper demonstrates that it is not at all likely that the world will warm as much as the IPCC imagines. Even if the world were to warm that much, the overwhelming majority of the scientific, peer-reviewed literature does not predict that catastrophe would ensue. Even if catastrophe might ensue, even the most drastic proposals to mitigate future climate change by reducing emissions of CO2 would make very little difference to the climate. Even if mitigation were likely to be effective, it would do more harm than good: already millions face starvation as the dash for biofuels takes agricultural land out of essential food production: a warning that taking precautions, “just in case”, can do untold harm unless there is a sound, scientific basis for them. Finally, even if mitigation might do more good than harm, adaptation as (and if) necessary would be far more cost-effective and less likely to be harmful.”
Not a word of that needs changing.
Well, literally, the last sentence remains true.
However, if I were your editor, I would increase the effectiveness, symmetry and resonance of each of the concluding “Even if …” sentences by placing each within its own paragraph. 8<)
Repeating his words above, thus edited.
After all is said and claimed, the evil in today's CAGW religion stems from forcing 85 years of known absolute catastrophic harm and death upon billions of innocent poor and middle class in the "hope" of "possibly" preventing "some" (vanishingly small) part of the "potential harm" that "may occur" if CO2 is not massively reduced now so "future" temperature rises are avoided. in all their words and claims of trust in the models in each of their Summary for Policymakers, what are their actual predictions of the future they claim we must avoid?
What is the IPCC's actual probability of a cooling or steady-state global average temperature in 2100?
What is their probability of a 0 – 1 degree C rise by 2100?
Of a 1-2 degree C rise by 2100?
Of a 2-3 degree C rise by 2100? By 2200?
Of a 3-4 degree C rise by 2100?
Of that favorite for the papers – the much feared 4 degree C rise – what is its probability? The 95% "chance" their adjectives imply?
RACook – I asked earlier for any evidence for your alarmist claims and don’t recall seeing any provided.
Please, provide documented evidence for your “forcing 85 years of known absolute catastrophic harm and death upon billions of innocent poor and middle class”
For 85 years of the future you claim certainty about “absolute catastrophic harm and death upon billions”?
It’s funny that the scientists pointing out observable, measured changes and projecting risks are called alarmists yet here we get claims like yours made with lots of certainty (and no evidence).
If we take the right steps, and do them carefully – we’ll have less pollution, less economic uncertainty due to fuel price fluctuations, and still have the energy we need.
Christopher,
“Since the trolls, desperate to divert attention from the main point of this thread that there has been no global warming for 18 years 2 months,”
People who simply point out your lack of peer reviewed articles are not trolls, existing peer reviews are readily available , why are your’s so cleverly hidden ? , just post them on your site.
The issue of peer reviews is crucial to the veracity of your claims for ‘no warming’ and not a diversion.
Observations are not theories.
Observation – that car is red. It doesn’t turn blue just because you don’t publish the fact.
Observation – that tiger is eating me. You aren’t OK just because you don’t publish the fact.
Observation – the pause is real. The world doesn’t start warming because it isn’t published. The thermometers are still thermometers.
In short, you have made a category error. You have assumed that reality is subjective – a social construct. And as a social construct the world doesn’t exist unless it is validated by social norms.
But actually the world is a physical reality.
Sorry MCourtney,
..
You cannot prove “the world is a physical reality”
Mr Fagan can look up for himself the references to my reviewed papers, some of which I have mentioned up thread.
In any event, peer review is irrelevant to the question whether there has been no global warming for 18 tears 2 months according to the RSS dataset. That is a simple matter of determining the least-squares linear-regression trend. The result is as I say it is as any competent statistician will make clear.
The peer review question is a deliberate distraction from the truth that the air is not warming as predicted.
Ah, sir. But it was when I tried looking at what you were calling peer-reviewed articles that I came across the discrepancy on the APS site.
I pointed it out, and you persistently tried presenting the archived PDF file as the current view of the APS, while trying to convince us that the fact that the disclaimers remain abundantly scattered on the “Physics and Energy” newsletter site are a simple clerical error. http://www.aps.org/units/fps/newsletters/index.cfm
They’ve added 26 new issues of the newsletter and each of their pages continues to state “non-peer reviewed”.
I believe the APS is making it clear that someone issuing press releases calling a newsletter article a major new peer-reviewed paper was not something that they wish to encourage.
They are protecting their brand by removing the erroneous “peer reviewed” description from a simple newsletter. If your paper had been submitted and published in Physical Reviews E, you’d have a peer-reviewed paper on the APS site.
(By the way, they have an article there about volcanoes and ENSO – I’d be really surprised to see your
“Singer Effect” get through the review process to join the existing article.)
I do notice that in your comments over the last few days, you have carefully used the word “reviewed” to describe your P&E article, instead of “peer reviewed”. Well done.
And then when I looked at the review comments it was clear that this was a style and formatting review, not an analytical peer review of your scientific claims.
http://scienceandpublicpolicy.org/images/stories/papers/monckton/monkton_letter_pys.pdf
By the way, Professor Saperstein, the reviewer, doesn’t appear to have been convinced by your paper – see his comments here about climate change http://www.mi-sci.org/2013/10/23/a-conversation-with-dr-alvin-saperstein-mi-sci-docentsuper-scientist/
I harp on this because credible evidence depends on the source being credible.
As for distracting from the real issue – the constant focus on a short term surface phenomenon fits that description. The climate system continues to warm, despite solar and other trends that would lead one to expect cooling.
With November data in for all the data sets but HadCRUT4, we still see the surface temperature showing warmest year (NCDC, GISS, HadCRUT) and for the satellite record, UAH has this 3rd hottest, RSS has it 7th.
Speaking of distractions, what is the DOI for your forthcoming article?
If, as Mr Socrates seems to think, the world is not a physical reality, global warming is intangible and unreal. QED.
Re: socrates
Many years ago I was in a class where one of the students made the same claim. The professor took him to the front of the class, told him to close his eyes, and began walking him forward while explaining that the real world exists. The student was walked right into a door jamb, painfully whacking his nose.
When the student was seated and still rubbing his nose, the prof asked him what he thought of the unreal door frame, and the class laughed at his silence.