Guest Post by Bob Tisdale
The region east of the Philippines stands out on satellite-based sea level trend maps. See Figure 1, which is from the Map of Sea Level Trends webpage from the University of Colorado Sea Level Research Group. I’ve also shown the coordinates of the region that border it.
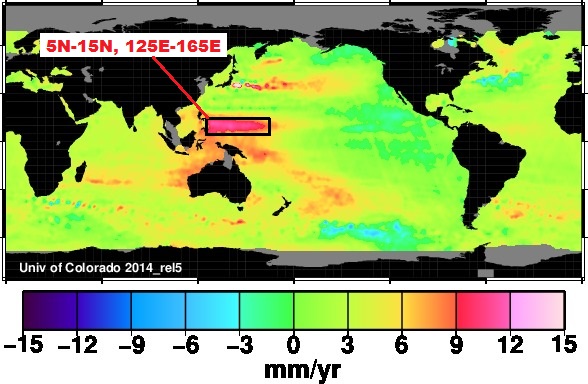
Figure 1
THE UNUSUAL SEA LEVEL RISE EAST OF THE PHILIPPINES APPEARS TO BE ENSO RELATED
That small pocket of extraordinary sea level rise looks like the remnants of a slow moving off-equatorial Rossby wave, or a series of them.
During an El Niño, a huge volume of warm water travels from the western equatorial Pacific to the east. See the animation here. That animation shows the evolution of the 1997/98 El Niño and its impacts on sea level residuals, starting with the two initial Kelvin waves carrying warm water east.
The El Niño does not consume all of the warm water that had traveled east. That is, not all of the heat available is released to the atmosphere, because much of the warm water that had traveled east is still below the surface of the eastern equatorial Pacific. So all of that leftover warm water has to go somewhere at the end of the El Niño. It doesn’t just disappear. The leftover warm water is returned to western tropical Pacific, at about 5N-15N latitude, and sometimes at 15S-5S, as part of phenomena called off-equatorial Rossby waves. The Rossby wave north of the equator during the decay of the 1997/98 El Niño can be seen here. It’s a continuation of the sea level residual animation above. (Note how there appears to be a secondary El Niño event taking place in the western tropical North Pacific while the La Niña evolves along the equator. That’s why ENSO indices can’t be used when trying to explain the rise in global temperatures. The ENSO indices can’t account for ENSO residuals.)
So that small pocket of high sea level trends is exactly what we would expect from a group of off-equatorial Rossby waves returning El Niño leftovers back to the western tropical Pacific.
TIME-SERIES GRAPH OF THE SEA LEVEL ANOMALIES FOR THE REGION EAST OF THE PHILIPPINES
For months, I’ve wanted to plot the data for that region, so that I could get a rough idea of its contribution to the global rate of sea level rise. Unfortunately, the Interactive Sea Level Time Series Wizard at the CU website had been taken down for service. It’s operational again.
As the title of this post suggests, the contribution of the region east of the Philippines to the global sea level rise isn’t a lot. It looks bad on the map, but due to its small size (only about 1.4% of the surface of the sea-ice-free global oceans) it doesn’t add much to the global rate of sea level rise, less than 5%.
Figure 2 presents the time-series graph of the sea level anomalies for the region east of the Philippines. I divided the region bordered by the coordinates of 5N-15N, 125E-165E into sixteen 5-deg latitude by 5-deg longitude grids. Using the CU sea level wizard, I downloaded the time-series data for the center of each of those 5×5 grids. I then averaged the data for the 2 separate latitude bands (5N-10N and 10N-15N), and then took a weighted average of the sea level data for those 2 latitude bands to account for the very slight differences in area. (The area weighting actually makes little difference for two latitude bands that close to the equator.)
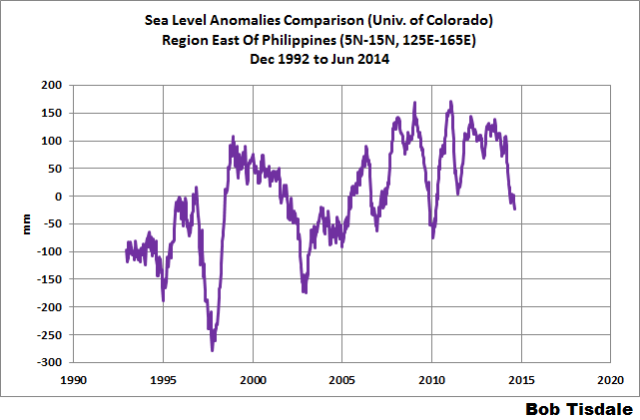
Figure 2
There is a very strong ENSO component to the sea level data for the region of unusual sea level rise, east of the Philippines. The 1997/98 and 2009/10 El Niños are the causes of the strong dips in sea level anomalies there. The 3-year La Niña that trailed the 1997/98 El Niño is visible, as are the double-dip La Niñas that preceded and followed the 2009/10 El Niño. Note the sharp drop-off this year in response to the (attempted) early evolution of the 2014/15 El Niño.
NOTE: For most of the global oceans, longitudes must be entered into CU sea level wizard as negative numbers. For example, the longitude of 127.5E is entered as -232.5. (Both ways you’re 52.5 degrees west of the dateline.) The sea level wizard rounds it to the nearest single digit.
GLOBAL SEA LEVEL DATA COMPARED TO THE REGION EAST OF THE PHILIPPINES
Figure 3 compares the global sea level data from the University of Colorado (here) to the sea level anomalies for the region east of the Philippines. I didn’t bother to reference them to a common time period. The rate of sea level rise for the region east of the Philippines is about 3 times faster than the global rate. That’s about what we would have expected based on the color coding of the trend map.
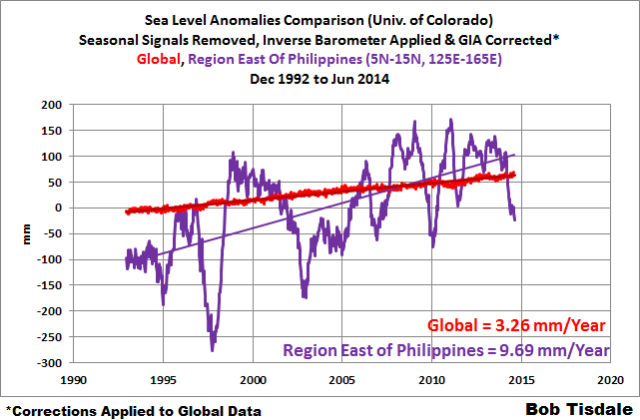
Figure 3
HOW MUCH OF AN IMPACT DOES THE RISE IN SEA LEVEL EAST OF THE PHILIPPINES HAVE ON THE GLOBAL TREND?
Using the NOAA Latitude/Longitude Distance Calculator we can get an approximate estimate of the surface area of the region bordered by the coordinates of 5N-15N, 125E-165E. It’s roughly 4.9 million km^2. The surface area of the global oceans is about 391 million km^2, and, of that, sea ice has on average covers about 18.1 million km^2 annually. The region of the unusual sea level rise east of the Philippines, therefore, represents less than 1.5% of the surface of the global oceans not covered in sea ice. We can then area-weight the data for the coordinates of 5N-15N, 125E-165E by that percentage and subtract it from the global data. The remainder is compared to the global sea level data in Figure 4.
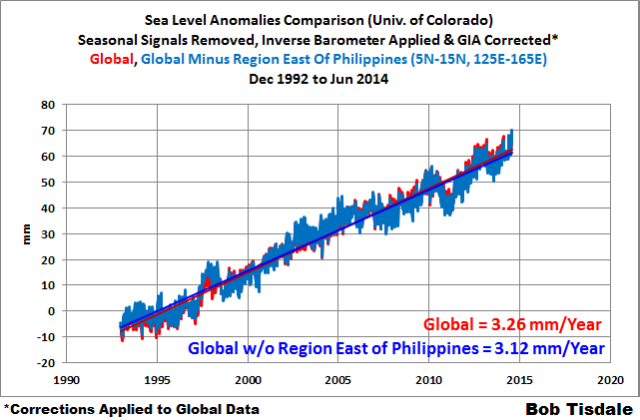
Figure 4
The difference in the rates of sea level rise is very small, only about 4.5%.
THE OLD UNIVERSITY OF COLORADO SEA LEVEL TREND ERROR MAP
Yes, I’m aware of the old sea level trend error map that’s available from the WayBack Machine. That map used to be posted on the University of Colorado sea level website. See Figure 5. The archived 2007 source of the map is here. The estimated errors in that region east of the Philippines were comparable to the trend.
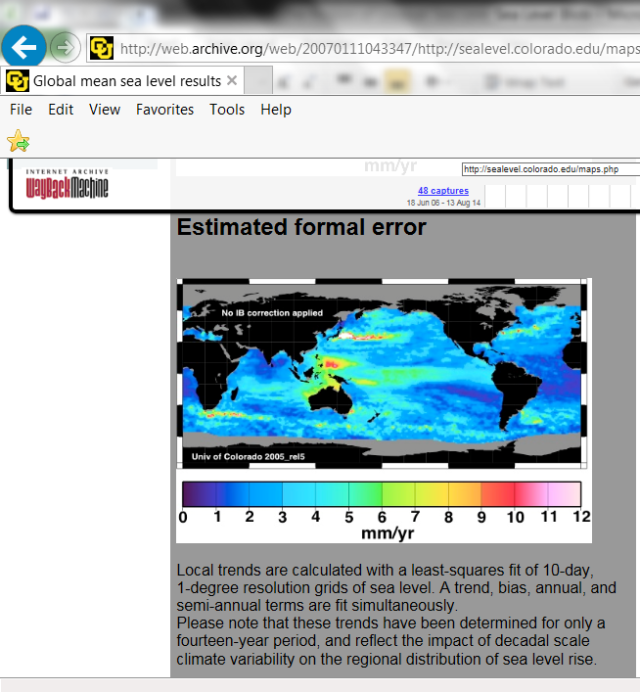
Figure 5
That error map is no longer posted by the University of Colorado. Why? You’d have to ask them.
But the volatility and the excessive trend of the sea level in that region should be caused by ENSO residuals. And, bottom line, the sea level rise for that region has little impact on the global rate.
Will the sea levels in that region continue at that pace into the future? Much of it depends on ENSO, and that’s something climate models still can’t simulate. Extending that excessive trend into the future would be foolish, especially when we have no understanding of what ENSO will do in the decades to come.
How about going back to basics? It’s been known for long that the area in question have a landsinking. Landsinking can’t be described as sea level rising…..
It can if you want to write an hysterical and catastrophic headline as nearly all sea level articles are. Nearly all articles neglect mentioning this factor. The MSM mission is not to inform. It is to brainwash.
It most certainly is. to brainwash…..
That area is very active tectonically so any sea level change will be associated with plate tectonics nothing else.
Yes, the WayBack Machine. Besides the Trend Error Map, analysis of data available from the WayBack Machine shows us that CU’s Sea Level Research Group has rewritten the historical data to inflate the global average by nearly a millimeter per year. All you need to do is compare the March 2004 Wayback data with today’s version.
Removing the East of the Philippines data might reduce the reported rate by 0.1 mm/yr, but the 3.12 mm/yr remaining is still 30% the result of corrections and adjustments made since 2004.
http://image.made-in-china.com/2f0j00KeNTPWQnZhku/Water-Slide-Hill-Side-WS-038-.jpg
there is a very strong……….gravity component….to the sea level data for the region of unusual sea level rise, east of the Philippines
http://www.jpl.nasa.gov/images/earth/pia04652-browse.jpg
Latitude, what’s the time period of the map?
Have no earthly idea…i was just the first one I found when googled “gravity map” this is probably Grace….We used to keep up with it, but there’s no point….it never changes
it’s the GRACE model from July 2003:
http://www.csr.utexas.edu/grace/gallery/gravity/03_07_GRACE.html
and it does look rather similar to your fig 1.
Those gravity anomalies are mostly due to tectonic factors and change very slowly. [They] affect the absolute sea level, but not sea level change
tty, it’s the mass of the mountains that increase gravity
Sea level fluctuations are also due to undersea Seismic Activity.The Philippines is on the Pacific Tectonic Plate.
Actually that plate is the one subducting beneath the Phillipines and causing the volcanic activity and earthquakes.. the Phillipines is a back arc island group.
I agree with Latitude. A localized rise in sea level is anomalous. My guess is that it correlates with a gravity anomaly, a temperature anomaly, or is simply due to error in in the data.
Why is the estimated formal error (Figure 5) is so high in certain regions? WUWT?
volcanoes, sea mounts, etc increase gravity….gravity holds the water on top of it
My immediate thought was ALSO measurement error, but pressure anomaly is possible too- It’s not just gravity that affects sea level, but also atmospheric pressure. Is the air pressure in that area east of the Philippines lower for some reason?
Alan, it’s both. There was a good amount of volcanic activity in that area. The sea-level lunatics didn’t understand what they were seeing, and they didn’t know how to use their crayons very well when making their absurd coloring map.
To read the map properly, they’re telling us sea level has been rising nearly a centimeter/yr for 20 years. Of course, it has not been doing so. Lat’s picture was trying to point to the absurdity of such a notion.
At any rate, what happened, was, yes, there was some rise from the big El Nino, but, that water didn’t stay up, mostly because it’s water, and water always seeks a level.
The actual rise was in a much more confined area. Essentially, what the sea level sillies are doing is incorporating older faulty satellite data with newer, somewhat
betterdifferent data. The older satellites, ie Topex/Poseiden picked up artifact from earths rotation, you can see the smearing here….http://www.aviso.altimetry.fr/fileadmin/images/data/Products/indic/msl/MSL_Map_TP_Global_IB_RWT_NoGIA_Adjust.gif
Jason I did a little better job of reducing the smearing, but, it still wasn’t very good. Jason II doesn’t have rise by the Phillipines at all, but, you do still see some smearing in other places.
When one looks at the “reference” map, it still tells us the area is still rising a 10mm/yr, even though Jason has shown none in that area since 2008. But, then, that’s just for today. If we make a big deal out of it, the crazies will simply adjust their data to fit their notions, as they did with Envisat and Jason I a couple of years ago when they were both showing sea level decrease. That data is now gone and we have new data which bears no resemblance to the old data. . At least GISS makes you look for what changed.
These are academic exercises because whatever we’re told the satellites are saying isn’t anywhere close to reality.
[Extended Line out removed. .mod]
Well, crap. I screwed that up. I just wanted to strike through the word “better”. Sorry,
James
[Already fixed. 8<) .mod]
You the man, mod!
+1 James nailed it
Sea level data from the tide gauge at Palau / Malakal (7N, 135E, which is inside the box) from 1969 to 2012. 2.34 mms/year over the period. Higher in 1989 than today.
http://www.psmsl.org/data/obtaining/stations/1252.php
http://www.psmsl.org/data/obtaining/rlr.monthly.plots/1252_high.png
Nearby tide gauge with very similar data (but quality flag).
http://www.psmsl.org/data/obtaining/stations/1251.php
Bill, I think you pointed out that if the satellites were used in conjunction with the land around the tide gauges, then we would have a far more accurate ideal of SL changes.
Of course this makes sense, as the land is affected far less by tides, and tidal cycles. Do you have any indication this was done?
David A, tide gauges are used as references for satellite-based sea level data.
Bob, I think it is more accurate to say the satellite based sea level organizations “pretend” that they use tide gauges as a reference. If they actually did use them, they would have 1.6 mms/year of sea level rise instead of 3.2 mms/year.
Bill Illis, the upward step in that graph in response to the 1997/98 El Nino is quite remarkable.
OT, but is anyone aware of any research involving a relationship (or non-relationship) between the Earth’s magnetic field and atmospheric flow?
Should be ‘atmospheric flow patterns’. A good Sunday to all!
Your statement, “(Note how there appears to be a secondary El Niño event taking place in the western tropical North Pacific while the La Niña evolves along the equator. That’s why ENSO indices can’t be used when trying to explain the rise in global temperatures. The ENSO indices can’t account for ENSO residuals.)” is the center pivot of the debate between model runs of natural forcing and CO2 forcing temperature compared to observations.
All model runs match in the short run is a function of tuning to observations as well as compounded error being initially small then growing substantially larger as model runs continue into the future. Neither sets of climate models (CO2 models or natural models) match current observations because of increasing compounded error and that neither kind of model includes ENSO residual factors as a source of temperature anomaly trend.
It is time to put to bed the notion that ENSO is random and short lived. It is assumed to be “averaged” out of the temperature series if models are run long enough with the model mean calculated. It is assumed then that any trend up must be anthropogenic. However, the models are front loaded TO HAVE a fudge factored trend to get warmer. That a warming trend then emerges to much knicker twisting and flagellation by catastrophic climate modelers always amuses me. It’s like eating a big turkey dinner then being utterly panicked that you poop more than usual after a bit of time has passed.
Further, the natural models are front loaded to HAVE NO TREND when averaged with a mean. This is preposterous. Climate changes. It goes up. It goes down. It can even stay the same over short, medium, and long-term time spans. The spaghetti graphs demonstrate this phenomenon quite well. The error is when they are averaged with a mean and then we are told “climate does not change” unless humans burn something. This is incorrect. Because natural climate trends up, down, or not in random ways, you can randomly take any one of those natural spaghetti paths and ride it. That’s potentially a real possible temperature trend in the future. The line that shows the mean is not real.
Bob has once again shown us that the oceans have by far the greatest potential to absorb energy, move it around, send it under the top surface, collect it in one spot or spread it out, cough it up to the surface all at once or slowly over time. The miniscule anthropogenic CO2 addition to the various long wave infrared heat absorbing and re-radiating molecules in the atmosphere do not have the capacity to do what the oceans can do and will be buried in the natural oceanic/atmospheric teleconnected source of land temperature trends, weather pattern variations, and climate shifts.
The climate models, if used to show how all this works, are at worst wrong, and at best incomplete. Every single climate scientist who has worked with the long term climate models knows this to be true. Hell, even current short term ENSO models cannot accurately predict ENSO oceanic/atmospheric teleconnected processes without constantly being restarted nearly every month with the current set of ENSO data.
The unusual sea level rise in the Philipines does not a template make. Why do you ignore the established fact of sea level recession since 1776 on East Coast USA.?
Richard Guy says, “Why do you ignore the established fact of sea level recession since 1776 on East Coast USA.?”
Because it wasn’t of interest to me for this post.
Richard Guy:
Probably because Bob was discussing El Niño processes in the western Pacific.
How does CO2 change gravity, by what mechanism?
It does not. Next question.
Thanks, Bob. Good article.
From Global Mean Sea Level Time Series (seasonal signals removed) (Sea Level Research Group, University of Colorado):
“There is a strong correlation between the Global Mean Sea Level (GMSL) and the Multivariate ENSO Index (MEI), with the GMSL often lagging changes in the MEI.”
See http://sealevel.colorado.edu/
In my opinion, such sea level variations show only the limits of our technology to replicate a straight line. I trust ocean waters’ ability to find the lowest places more than I trust the mappers’ ability to graph it. Possibly there are gravitational variances but it seems unlikely. Remember that actual error is twice of estimated error, historically.
Bob,
The sea level data of the U of Colorado is spurious, infamously so. Why do you use it?
mpainter, why use it? It’s remarkably similar to other satellite-base sea level datasets, and their “Wizard” allowed me to answer a question in which I was interested.
The question is why do you use spurious data?
mpainter, your presumption is that the data are spurious, yet you’ve offered nothing to substantiate the claim.
The area east of the Philippines is among the worst places in the world to assess sea level change because it is in a major, active, tectonic area (the Philippine trench). In 1970, following a magnitude 7.3 earthquake, sea level at the Manilla tide gauge jumped upwared abruptly as a result of land subsidence, which is apparently still going on. The tide gauge record there shows 0.02 mm/yr rise from 1900 to 1970, then a substantial vertical jump in 1970 and a considerably higher rate after that. Bottom line here is that rates of eustatic sea level change are strongly influenced by land subsidence in this area and should not be used for assessing sea level rise.
So we have an El Niño alert level raised and the signs of decay in the Rossby wave at the same time. I’m confused!
Reblogged this on Centinel2012 and commented:
Good analysis but I would expect nothing less here!
Seas “mounding” up against a lee shore as a result of continuous trade winds is what causes this SLR and it happens in various parts of the world where this situation applies.
But they reach a certain height and that’s as far as they go, generating currents away from these mounds that reach speeds of up to 4 knots over very long distances [while the mound remains].
These SLs do not continue to rise and their height is proportional to consistency of wind strength and direction.
You will see from tide gauges all around the Pacific Islands, areas which consistently are lowered awa raised by these El Ninos.
Easy answer. Godzilla finally had to pee after his little romp through a Tokyo Kirin beer factory.
Also being discussed at More On Miriam O’Brien’s Hot Whopper
http://moreonmiriamobrien.wordpress.com/2014/11/24/miriam-obrien-says-bob-tisdale-gets-into-a-spot-of-hot-water/
Bob,
just a thought. Could you check what adjustments they make for sea roughness?
JF