Guest Post by Bob Tisdale
The sea surface temperature anomaly maps from Unisys had many people thinking there had been a drastic cooling of the surface of the extratropical North Pacific. But as discussed in this weekend’s post On The Recent Unisys Sea Surface Temperature Anomaly Maps and Cooling of Northern Hemisphere Ocean Surfaces, there were other sea surface temperature anomaly maps that were showing much less cooling there. On Monday, Harold Ambler reported in his post UNISYS pulls down map showing dramatic ocean cooling that Unisys was suspending their sea surface temperature anomaly maps while they remedied some problems. Later that day, Unisys then followed that up with a post at their news blog that they were suspending those maps.
The NOAA ERSST.v3b sea surface temperature dataset is the first to be updated every month (that’s especially true now that the preliminary monthly Reynolds OI.v2 SST data are no longer available from the NOAA NOMADS website, which is being modified), and the ERSST.v3b data are in for October 2014. They can be accessed at the KNMI Climate Explorer.
The good news is, the blob (hotspot) in the eastern extratropical North Pacific has dissipated. See Animation 1, which cycles between the September and October ERSST.v3b sea surface temperature anomaly maps. That blob was associated with a ridge of high pressure there, both of which were contributors to the California drought.

Animation 1
Will the blob return next year? I hope not, but I suspect it might. Will the blob’s recent weakening help to allow some more rain to fall in California? I hope so.
Now the bad news: the sea surface temperature anomalies for the extratropical North Pacific have dropped, as shown in Figure 1. (For the extratropical North Pacific, think the latitude of the big island of Hawaii at about 20N then northward to the Bering Strait at 65N.)

Figure 1
But, the sea surface temperatures of the tropical North Pacific, Figure 2, still look as though a moderately strong El Niño is taking place…when, at best, the sea surface temperatures of the equatorial Pacific have only been tickling the threshold of an El Niño since the boreal summer.

Figure 2
As a result, there has been some cooling of the surfaces of the North Pacific as a whole, Figure 3. But there is still a long way to go for it to return to its “normal” of the period of 1989 to 2012, a 24-year period when there was little to no warming of the surface of the North Pacific. See the post On The Recent Record-High Global Sea Surface Temperatures – The Wheres and Whys.

Figure 3
In turn, the sea surfaces of Northern Hemisphere and global oceans are only showing minor downturns from their peaks last month. See Figures 4 and 5.

Figure 4
# # #

Figure 5
The October 2014 Reynolds OI.v2 sea surface temperature data should be available at the KNMI Climate Explorer sometime next week. I’ll provide a full update then.
In closing, thank you, Unisys, for pulling those maps.
My N Pacific AVHRR SST movie is here. Should be OK at least in Chrome and Firefox. Yes, nothing much happening.
Nice !!
Pardon my ignorance… Does this mean that we are going into a warming scenario in the Northern hemisphere?
If so, it will be most welcomed, as winters here tend to be a bit tough… in spite of the fact that if my understanding is correct the greeniewarmongerers are going to ride this one and milk it for all that its worth
Texas, Arkansas,and Oklahoma are already getting the El Nino-like rains today.
http://i61.tinypic.com/2cffdad.jpg
http://i61.tinypic.com/xmqzwk.jpg
Is Cal next???
Nice to see so integrity, unlike others
It is amazing to watch those rapid changes in sea temperature up to 3 degrees occurring in the Pacific and the Atlantic. I wonder how much of that makes its way into ‘The Models’?
Depends, of course, on what models you’re referring to. The Reynolds Quarter Degree OIv2 is used in the NWS Climate Forecast System V2, and its Climate Reanalysis. The RTG SST HR http://polar.ncep.noaa.gov/sst/rtg_sst_hr/ is used in the NWS high resolution North America Model, and will be used in the NWS Global Forecast System when it upgrades to its new higher resolution version.
Bob, do you think Typhoon Nuri will have a measurable effect on N Pac SST’s?
Hi gyan1. It’s possible. And it would be nice.
I plotted the weekly sea surface temperatures of Sandy’s storm track for the year 2012 a week after she strolled up the coast. Sure does look like Sandy had an impact.
http://bobtisdale.files.wordpress.com/2012/11/figure-12.png
That graph is from the post here:
http://bobtisdale.wordpress.com/2012/11/11/the-impact-of-sandy-on-sea-surface-temperature-anomalies-along-its-track/
Half a year later, that dip seems to get lost in the other weather noise when we plot the weekly data for the extratropical portion of Sandy’s track starting in 1990:
http://bobtisdale.files.wordpress.com/2013/05/04-weekly-extratrop-eastern-seaboard.png
And that graph is from the following post:
http://bobtisdale.wordpress.com/2013/05/19/hurricane-main-development-region-sea-surface-temperatures-anomalies-plus-a-couple-of-other-regions/
Thanks Bob! That was my expectation but wanted to have it confirmed. It will be interesting to watch SST’s after it makes landfall.
We are having the warmest fall I’ve ever witnessed here in the PNW with the first frost nowhere in sight. I’m hoping cooler SST’s following Nuri will get our ski season underway.
Your efforts are much appreciated!!
…90% of global warming goes into the oceans…and they sure have warmed since the 1970’s hey!

http://www.realclimate.org/images//heat_content2000m.png
“The heat content of the oceans is growing and growing. That means that the greenhouse effect has not taken a pause and the cold sun is not noticeably slowing global warming.”
http://www.realclimate.org/index.php/archives/2013/09/what-ocean-heating-reveals-about-global-warming/
So, help me out with the math here for a minute.
if the ocean average temperature goes up by 0.05 degrees in 20 years, after 80 years how much could the earth’s air temperature increase by? Maximum increase that is.
If 90% of global warming goes into the oceans, then clearly there is no problem at least in the medium term, by which I mean many hundreds, if not thousands of years. The effects are essentially disapated, and there uis no known mechanism whereby it can come back to sudddenly and violently bite.
But if 90% of global warming goes into the oceans, it does not explain why (if it truly was real and not an artefact of homegnisation, UHI, poor station siting, and station drop outs) there was measurable atmospheric warming since the mid/late 1970s through to late 1990s, whereas for the past 18 years (or so) there has been no measurable atmospheric warming. WUWT?
Not to mention that the little bit of ocean warming we MAY have had, is , like the atmospheric warming,1/2 or less then what the IPCC models predicted.
It won’t because the heat is going into the ocean because of a negative PDO it will come back out when the PDO turns positive.
Yea, but a slightly warmer CO2 juiced atmosphere adds a steroidal effect to the whole system, including the ocean. The PDO does what it always does, just a little juiced now.
The sun is the fly-in-the-ointment for the warmists wanting to pin the rap on CO2.
Another waste of time discussion. The sun has slight cool phase so is out of step with the warming. Yea, I know, your answer is no, its cooling and greenhouse physics is not real.
The solar activity of the last 90-some years, the PDO, ENSO, and the AMO can explain most if not all of the observed global temperature variations of the last 100 years. And no one still has any convincing mechanistic explanations for the MWP and LIA variations, other than possibly being a non-linear chaotic climate dynamic.
All of those solar and ocean-atmosphere cycle observations and real dynamical variations can place the Earth’s climate sensitivity to pCO2 doubling into the noise of natural climate variability. The CO2 signal, if it exists, gets swamped by other factors and feedbacks, such that it may take millenia to detect a CO2 signal, by which time the interglacial could ending in chaotic fits and swings anyway.
So Avery, you are correct, discussing CO2’s role in changing climates is a waste of time and money.
Martin
Provide evidence and data that the same OHC trend did not exist between 1880 and 1960. If you can do that, you may have something that is noteworthy. Otherwise, so what.
Martin, could you please tell us how many samples of ocean temperature at 2000m are available for 1955 when your graph begins? You cannot even estimate OHC unless you have sufficient sampling. What is the declared uncertainty? I don’t see any indication of error bars there.
That graph is a complete joke in terms of science. There was only reasonably wide coverage of 2000m temps from 2003 onwards. Anyone presenting you with that sort of think is either not competent in science or is competent and is trying to deceive.
Cold sun? Yeah, that statement speaks volumes.
Am I the only one that finds it strange that the heat content of the ocean can supposedly vary by 5*10^22 joules in just a few months without a corresponding change in the temperature/heat content of the atmosphere? The heat just magically appears in the oceans. What does 5*10^22 Joules translate to in terms of atmospheric temperature?
It’s de minimus. Check out Bob Tisdale here.
That still doesn’t answer my question. Look at the latest supposed spike of OHC around the end of 2012 into early 2013. That’s an increase of about 5*10^22 joules in just a few months. Where did that heat come from? There are only two possible explanations, either it came from the atmosphere or it came from within the Earth. Assuming that there was no major catastrophic uptick in subsea volcanic activity, it had to come from the atmosphere.
Now how do you take 5*10^22 joules of energy from the atmosphere and place it into the oceans without a very obvious drop in atmospheric temperatures? In fact, shouldn’t every change in ocean heat content correspond directly to the inverse change in atmospheric heat content with only a very slow but constant increase in total heat content over time? If they don’t, the data are wrong!
Clarification of my last sentence:
If the two data sets don’t inversely correlate very well, then the data are wrong!
[Rather, both data sets may be correct, but there may be no correlation. .mod]
Robert W Turner November 5, 2014 at 2:09 pm
Where did that heat come from? Who knows.
I can’t produce a link right now, but I heard the following about four-to-six weeks ago. You know that CO2 number attributed to volcanoes in the earth’s energy balance? The USGS says it’s about 130 million tonnes annually, but you can read numbers from that to 200.
According to the paper I read recently, however, that number only includes about seven underwater volcanoes globally, which surprised me. But, the paper said, they (?) now know there are over 3,000 active underwater volcanoes. It’s just that have not been measured, and they have no idea how much heat or CO2 they are emitting. I think (but don’t hold me to it) there are at least seven active volcanoes among the 14 volcanoes located under the western ice sheet of Antarctica.
So where does the heat come from? Who knows.
Thanks. I’ve just always been curious about why it appears that the total heat content of the planet varies by so much over short time spans. It’s too bad there are so many research scientists chasing a boogeyman instead of filling in all these gaps in knowledge.
Mod – It could be that they do no correlate well but I’ve always assumed that the total heat budget should be relatively stable. The obvious reason that they wouldn’t is orbital/tilt cycles (which could be smoothed with a 12 month running average?) and cloud cover variability. I would think that with CERES all of the data would be there to shine some light on the subject, assuming heat from the Earth’s interior doesn’t vary enough to account for the acute changes.
Ah, Martin. You’re quoting Stefan Rahmstorf’s September 2013 article where he makes this ridiculous claim
His (and your) chart is from this Levitus paper at the NOAA link given: http://data.nodc.noaa.gov/woa/PUBLICATIONS/grlheat12.pdf
[But you should also look at the supplementary notes, also given on the NOAA site, which clarifies how the ocean heat content estimates are made: http://data.nodc.noaa.gov/woa/DATA_ANALYSIS/3M_HEAT_CONTENT/PDF/heat_content_differences.pdf%5D
Now look at the tables on pages 17-19 of the Levitus paper that NOAA and Rahmstorf got the chart from, and that you reproduce above. See Table S1 on page 17? Look in the far right column: TChange – total change in volume mean temperature [C].
What does it say for the change in ocean heat content, volume mean temperature and related quantities for the 0-2000 m layer for the World Ocean and individual basins as determined by the linear trend for the 1955-2010 period?
0.09 C. 9/100 of a degree Celsius temperature change in a total of 55 years!
Oh, but it’s measured in 10^22 joules, you say. Scientists use joules—a big scary number, 10 to the gazillion–because they can convert the amount of joules into watts per meter squared (w/m^2), or degrees Celsius, or volts, BTUs, etc. See the column in Levitus’ paper that says <i<HChange, which Levitus says is “HChange – total change in heat content [10^22 J]?” See it? The 9/100th of a degree C change in temperature for 55 years in Levitus’s S1 Table equals a total heat content change in those 55 years of 24*10^22 joules. (pg 17-18). Now look at the left axis of the chart you show above. 24*10^22 joules in the original Levitus paper. 0.09 C. (A ‘Big Kahuna’ barbecue ring uses 67,520,000 joules to cook a steak.)
But you and Rahmstorf and all the other non-researchers at realclimate.org bought the bamboozle that
FACEPALM. Now do you understand why the scientists around here get snippy when they’re trying to get this into your head?
Here’s Bob Tisdale’s discussion of the same thing: http://bobtisdale.wordpress.com/2013/04/17/a-different-perspective-on-trenberths-missing-heat-the-warming-of-the-global-oceans-0-to-2000-meters-in-deg-c/
This is a better Bob Tisdale post: http://bobtisdale.wordpress.com/2010/01/01/the-warming-of-the-world-oceans-0-700-meters-in-degrees-c/
4.13 x 10^17 joules / KM^3. What does that number represent? That is the energy it takes to convert one cubic kilometer of continental ice from -30 oC to water at 4 oC
Useful information:
heat of fusion of water = 334 J/g
heat of vaporization of water = 2257 J/g
specific heat of ice = 2.09 J/g•°C
specific heat of water = 4.18 J/g•°C
Step 1: Heat required to raise the temperature of ice from -30 °C to 0 °C Use the formula (for temp see average profile temp Antarctica) http://www.pnas.org/content/99/12/7844.full q = mcΔT Per Kg 1000 x 2.09 x 30 = 62700 Joules
Step 2: Heat required to convert 0 °C ice to 0 °C water
q = m•ΔHf Per Kg 1000 x 334 = 334000 Joules
Step 3: Heat required to raise the temperature of 0 °C water to 100 °C water
q = mcΔT per Kg 1000 x 4.18 x 4 = 16720 Joules
Total -30 oC ice to +4 oC water per Kg = 413420 Joules / KG
Where
q = heat energy
m = mass
c = specific heat
ΔT = change in temperature
ΔHf = heat of fusion
One metric tonne of water has a volume of one cubic meter (1 tonne water(1,000 KG ≡ 1 m³)
One gagatonne of water has a volume of one billion cubic meters, or one cubic kilometer.(1 Gt water ≡ 1 km³)Of course, one gigatonne of ice has a greater volume than one gigatonne of water. But it will still have a volume of 1 km³ when it melts.
413420 Joules/KG x 1000 KG/t x 1,000,000,000 t/KM^3 = 4.1342E+17 Joules / KM^3
But you say ‘DD’ how does this compare to the well known ‘Hiroshima bomb’ measurement.
By today’s standards the two bombs dropped on a Japan were small — equivalent to 15,000 tons of TNT in the case of the Hiroshima bomb and 20,000 tons in the case of the Nagasaki bomb. (Encyclopedia Americana. Danbury, CT: Grolier, 1995: 532.)
In international standard units (SI), one ton of TNT is equal to 4.184E+09 joule (J)
Hiroshima bomb TNT 15000 x TNT to Joules 4.18E+09 = Joules total 6.276E+13 =>
or 1 KM^3 of ice melt (4.1342E+17 / 6.276E+13) = # HiroBmb per Km^3 = 6587
That is correct. Place one Hiroshima bomb in a grid every 54 meters apart to melt the ice.
How about all that ‘Missing Heat’? Ocean heat content has increased by about 2.5 X 10E23 Joules since 1970 (IPCC AR5).
So 2.5 X 10E23 Joules / 4.1342 x 10E17 Joules/KM^3 = 604,712 KM^3
Well that sounds like a lot of ice, but Antarctica has between 26 and 30 million and Greenland has 2.5 million of those KM^3, so in reality it works out to 604,712 / 30,000,000 = 2.02% of the total.
http://hypertextbook.com/facts/2000/HannaBerenblit.shtml
Please tell me to what accuracy in percentage has the volume of ice has been measured since 1970?
Have you ever done a special study of the effects from known underwater vulcanos in three areas of the Pacific:
source Earthquake map</AS used for present values (up to 30 days or else one have to go statistic values)
chose option 30 days 2,5+ worldwide and terrain on the map then chose to zoom world.
* From Barents Straith down eastward to Kodiak.
and
* From Barents Straith down to islands of Indonesia ,
and
* From Port Hardy (Canada) southward to Purranque Chile
You need to know how to "draw"/calculate from a good algoritm, and analyse the effects of the techtonic plates on vulcanoeruptions. Takes a while but IF you aren't capable of using those "help-calculations" then it doesn't matter if you have good algoritms for each of the Northern Pacifics currents in sea and streams (above all jet streams) in the atmosphere, then you are lost trying to find a good reliable mathematic model for temperatures in the Oceans. No matter which.
It takes time and a lot of analysing, as I did back in 1993 when analysing sealevels från peak Stone Age up to 1000 AD. Climate never is a curve for 30 or 100 years. You need to have your input figures confirmed from dendrologic values around the sea/ocean you are analysing.
Climate is always changing due to techtonic plates movements, vulcano eruptions, distance and angle Earth-Sun, Gravitation (complex to understand and calculate) as well as the other natural forces of Earth inpact on and periodicity of
* Oblikvitet (Earth slope to Sun)
varies over a period of 41 000 years from 22,1 degrees up to 24,5. At present around 23,5 going down.
* Wobble of the Earth
due to a gyro-effect in Rotation speed the wobbling has a periodicity of 26 000 years. As you might know the Earth isn't a perfect sphere that you have to have in your mind as well
All in all there are so many factors you never considered and above all not the most important one: You will never get a sound conclusion without all needed factors and their periodicity counted for. Above find a few of them.
Living in California and being a snowboarder I definitely hope the blob doesn’t return! We NEED this winter to be at least close to normal precipitation.
Lots of luck. You live in a drought prone area where that condition can last for decades. You guys have been living in a period of relatively small changes for the last 100 years. but there are historic records which show that in the last couple of thousand years one drought lasted for over 200 years.
Thanks Bob.
Yes, some of the worst maps ever. I’m glad they are gone.
Likewise, glad the blob is gone. Now it is raining in Washington State with some flooding – the usual places. Next up is what Dr. Roy has called a “Bering Sea Bomb” and what that might bring. Nuri is not yet making news here. Perhaps by Saturday the Seattle office of the NWS will realize that area is roiling.
Do I have to make a graph for this?
Thanks Bob for always telling it like it is.
A question for Martin: By what mechanism is the addition of CO2 molecules to the atmosphere (which then become slightly warmer due to their absorption of outgoing long wave radiation) warm the oceans but not the air in which those CO2 molecules reside?
Skeptics have long argued that most of what we call ‘climate change’ is natural. Those arguments are dismissed with a hand wave because skeptics have not been able to produce a complete mechanism to explain how natural climate variations occur. Yet, the skeptical argument is at least reasonable, given the complexity of the Earth’s atmosphere. There are many things about the atmosphere that we do not know, including the scope of natural climate and ocean variations. It is not at all unreasonable to assume that the mechanism for natural climate variations will be found in our ignorance.
It is unreasonable, however, to suggest that extra energy captured by atmospheric molecules will not show up as a warmer atmosphere, but, quite magically, as a warmer ocean! Not only is there no mechanism presented to explain this, there isn’t even any room in our ignorance for such a thing to be possible.
Precisely, not only is it meant to bypass the surface of the ocean it’s meant to bypass it’s own origin!
The ridiculous argument of the alarmists is that all natural climate cycles somehow suddenly ceased in the 1950s after being around for many hundreds of millions of years.
Placing a neutral hat on, you have to ask the question: “With what has happened over the past 60 years in global temperatures, how much is man made and how much is natural?” Answer: We don’t have a clue, although personally I think it is mostly natural.
The atmosphere doesn’t have to warm the ocean, it only has to prevent the ocean from releasing its heat. Warmer air, next to the surface of the ocean, less heat comes out of the ocean.
And now really reaching for straws, but it is ok to speculate, but speculation proves nothing. It is a possible explanation out of an infinite number of possible explanations. But thats not the point.
The point is ocean participation in climate was poorly factored if factored at all in climate models. Models that unequivocally (the science is settled) claimed to prove AGW. When the models ran into problems with real world observations, climate scientists rushed to come up with a rational. Their rush for rational did not help prove AGW but instead proved their climate models were inept at modeling climate, never mind predicting or forecasting climate.
The only problem there is, the atmosphere is not warming.
You are pretending that the mechanisms of evaporation and cloud formation have no part to play in helping cool the planet.
If you read the article on Real Climate, Stefan Ramstorf (spelling?) argues that since the upper level warmed last decade, it the heat is now being mixed into the lower levels, that is still consistent. The upper level did get warmer as heat passed through it.
I believe the amount of heat is still less than modeled. He also feels the need to talk about Hiroshima bombs. To me, that reeks of desperation.
Speaking of magic, if the ocean isn’t being warmed by enhanced greenhouse effect, then what is warming it?
In other news, the chances of the US signing on to any significant international climate agreement in 2015 just went down the tubes tonight. (Obama may sign, but the Senate will never approve, making any presidential agreement meaningless)
Oh, and all of Tom Steyer’s money was thrown away.
Hopefully it will go further than this, a lot further, and the cluster*ck on humanity that is the climate change fraud will be consigned to the trash heap of history
Thank You, Bob. For all Your work and dedication.
Please, can You drop a few words to the “New England-Blob”. Gulfstream or is there a better explanation? Are the sea surface temps in this region really 2 degrees warmer than average? Is the 2 degrees C or F?
The ENSO meter on this page seems to be stuck, didn’t change for months.
strike, why don’t we call that “New England-Blob” by another name, the Gulf of Maine Plus Region, and we’ll use the coordinates of 35N-50N, 75W-55W for it.

The sea surface temperatures in the Gulf of Maine Plus region are currently warm, but they were warmer back in 2012.
Do you recall the weather-related reason for the elevated sea surface temperatures there in 2012? Unfortunately, I don’t.
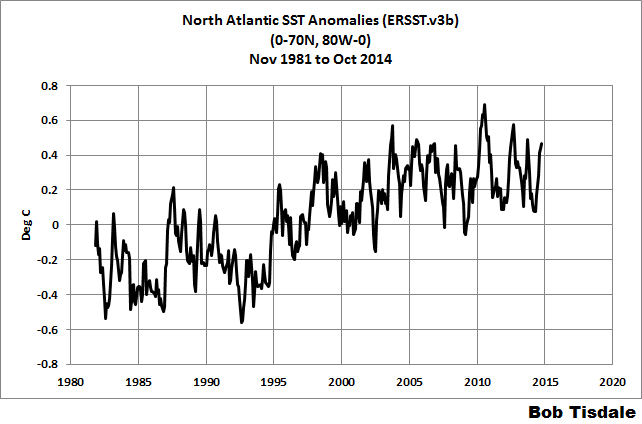
And, of course, the surfaces of the North Atlantic as a whole aren’t exceptionally warm. In fact, they’ve shown little to no warming since 2003, suggesting that the AMO has peaked.
Cheers
Massive cooling in the North Pacific in
the NOAA twice weekly’s. In fact,
I’m wondering if the PDO has changed
phase. Aleutian low, amplified West Coast Ridge and severe winter likely for
the Eastern U.S. California Drought
looks to get worse if this is a 1976/77
analogue.
Oh, and by the way, Senator Inhofe is going to take over the chairmanship of the Senate Climate Committee. He’s one of us – SWEET!!!
Yeah, I hope he goes on a rampage gutting the nonsense the Committee has been up to. Go, Inhofe! Damn the torpedoes! Full speed ahead!
EEEEEEEEEEEEEEEEEYESSSSSSSSSSSSSSSSSSSSSSSSSSSSS!
That should be interesting….
Thanks Bob.
That tropical N.Pacific graph is interesting. I note several peaks that appear to be separated by about 9 years. Quickly by eye: 1987, 1996, 2006, 2015?
This is probably of lunar origin, something I’ve been pointing out for a number of years.
My spectral analysis of this region shows it to be one of a number that show a strong circa 9 year peak.
http://climategrog.files.wordpress.com/2013/03/icoads_pds_9_13_grp.png
http://climategrog.wordpress.com/2013/03/01/61/
I suggested earlier this year when you started posting about the pseudo El Nino that it may come out stronger next year as the maximum perigee will be very close to the spring equinox. I’ll have to have a closer look those previous years.
PS. In fact this region look more like 8.85y ( the perigee precession period ), the Altantic regions are closer to 9.1 ( probably 9.05 ) which comes from superpostition of 8.85y and 9.3y periodic cycles. The later is also of lunar origin.
It’s not the whole story but it’s a strong component. This would seem to be the 9.1+/-0.1 that Scafetta has already published.
October SST warmest on record then. Not much cooling of ocean temperature in sight for the next two months either. 2014 will be the new warmest land-ocean temperature record. Will not last long though. 2015 will be warmer.
Quote from earlier post,
http://wattsupwiththat.com/2014/11/01/on-the-recent-unisys-sea-surface-temperature-anomaly-maps-and-cooling-of-northern-hemisphere-ocean-surfaces/
Bill Illis, November 1, 2014 at 8:08 am
The NCDC has screwed up the seasonality in its temperature anomaly figures. I assume this was not just a mistake but something done on purpose so that once per year (in the summer and early fall) they could publicly claim that “look, the last 12 months have been the warmest on record”.
Temperatures are supposed to be adjusted for seasonality. That is what an “Anomaly” means. How is the average Earth temperature changing compared to the “normal” for the period. Well, this is how they changed the record since the first time I saved it in November 2008.
http://s17.postimg.org/i118sk5zj/NCDC_Adjustments_to_Seasonality_2008_vs_Sept14.png
What area was most responsible for the change in this seasonality. High Latitude Ocean SSTs.
Charted just back to 2000 so that one can see this more clearly.
http://s13.postimg.org/ciiwzi0on/Zoom_in_NCDC_Adjustments_to_Seasonality_2008_vs.png
Unisys has been in this game for a long, long time (one of the first I believe) and I think they just got fed-up with the NCDC/NOAA and started using their old seasonality values.
There has been unequivocal cooling of high latitude regions in the southern hemisphere. What is the physical reason for the sudden cooling of high latitude southern hemisphere regions?
http://www.ospo.noaa.gov/data/sst/anomaly/2014/anomnight.11.3.2014.gif
Everyone is assuming that what was been observed in the recent past (last 70 years) is normal or the new normal and are hence making predictions assuming there has been no changes in the primary climate drivers. The expected paradigm (media and the warmist scientists) is no warming or slight warming, not cooling. The warmists scientists are ignoring the observations that support the assertion that the warming in the last 70 years was primary due to solar magnetic cycle changes rather than the increase in atmosphere CO2. The media parrots the warmists.
Significant cooling would change that ‘paradigm’. The uncertainty as to when the cooling will occur (assuming I understand the mechanisms) is the mechanism that causes there to be a delay in cooling when there is an abrupt change in the solar magnetic cycle.
If I understand the mechanisms, the northern hemisphere will follow the southern hemisphere with significant cooling 40 to 60 degree. There is a physical reason for everything that is observed. There are cycles of warming and cooling in the paleo record that correlate with solar magnetic cycle changes, there has been a sudden and significant change to the solar magnetic cycle.
GCR is currently very high (highest ever measured for the peak of solar magnetic cycle. GCR is normally low during the peak of a solar cycle as the solar heliosphere is strong and highly extended when solar magnetic cycle activity is high. Pieces of magnetic flux from the sun are ejected into the solar heliosphere which extends past the orbit of Pluto when the solar magnetic cycle is strong. The solar heliosphere blocks and deflects the high speed cosmic protons which are called galactic cosmic rays GCR or cosmic ray flux CRF for historical reasons.) Even though GCR is high, solar wind bursts continue due to persistence due to low latitude solar coronal holes which has mitigated the GCR high latitude cooling and have contributed to the El Nino like events. The solar wind bursts are starting to abate as the coronal holes dissipate and move to higher latitudes on the sun where they no longer affect the earth. (Solar wind bursts create a space charge differential in the ionosphere which modulates the global electric current removing ions from high latitude regions and changing properties of tropical cloud cover.)
A sudden and unexplained spotless sun would be observational evidence to support the assertion that the solar magnetic cycle has been interrupted. I am waiting with anticipation to see the updated solar large scale polar field.
http://cosmicrays.oulu.fi/webform/query.cgi?startday=17&startmonth=07&startyear=1964&starttime=00%3A00&endday=17&endmonth=08&endyear=2014&endtime=00%3A00&resolution=Automatic+choice&picture=on
Well done Bob. Thanks for your effort.
Bob.
DMI maps shows it has cooled, well at least the Northern part. they use ECMWF data to produce maps.
I still have no idea to post pictures on here so I have to do it with a twitter link.
Just figures, DMI site is down at the moment
https://twitter.com/NJSnowFan/status/529479329802371073/photo/1
BOB ,while we are on this SST subject may you can explain why NOAA SST are warmer? then others.
here is one example I Tweeted to Anthony.
https://twitter.com/NJSnowFan/status/529603394387070976/photo/1
You can’t directly compare an anomaly figure (polar.ncep) with a temperature figure (acnfs).
Let’s see some of the Pacific moisture visit California….the sooner the better.
I also noted at the bottom of the last thread that the Climate Explorer appears to be using an old dataset from the NCDC or that the NCDC is using different numbers in its Official SST temperature records than the Climate Explorer is using.
The Different versions of each for 20N to 90N. 1981 to Oct 2014.
http://s8.postimg.org/nq8dw3bx1/NCDC_Monthly_ERSST_v3b_1981_20_N_to_90_N_Clim_Exp.png
And then back to 1880.
http://s30.postimg.org/7o00inaip/NCDC_Monthly_ERSST_v3b_20_N_to_90_N_Clim_Exp.png
Sorry everyone, it looks like I screwed up entering one of the fields in the Climate Explorer. They are the same. But there is still something wrong with the seasonality/climatology.
http://s23.postimg.org/fhvqt7ne3/NCDC_Monthly_ERSST_v3b_1981_0_N_to_90_N_Clim_Exp.png
Even though the Eastern Hot Spot is dissipating, the Western [Japanese region] is cooling. This is producing the same cool West warm East ocean conditions. I would expect the Jet Stream to continue its same path: dip in the West, pop in the East. I also expect the Jet Stream to move further South as it always does during Winter in the Northern Hemisphere.
One can compare the Weekly anomaly maps of August 27 to October 29 to see how the Ocean SSTs have changed, particularly in the northern hemisphere.
Week of August 27
http://www1.ncdc.noaa.gov/pub/data/wksst/wksst.20140827.gif
Week of October 29
http://www1.ncdc.noaa.gov/pub/data/wksst/wksst.20141029.gif
Interesting. Usually warm water off the west coast would lead to a wetter climate inland. (Cold ocean currents are associated with deserts due to the lack of moisture escaping from the ocean.) But not in this case. What’s the reason for the high pressure system over “the blob”? And why does it prevent moisture transfer from the ocean to the air?
BOB
“But, the sea surface temperatures of the tropical North Pacific, Figure 2, still look as though a moderately strong El Niño is taking place…when, at best, the sea surface temperatures of the equatorial Pacific have only been tickling the threshold of an El Niño since the boreal summer.”
I only see NINO 3 in the El Nino range . The other nino regions 4, and 3.4 are barely in the Nino range and 2+1 region is well below at near 0. I do not share your optimism yet.
http://www.tropicaltidbits.com/analysis/ocean.html
Glad to see this post and discussion. I had been looking at UNISYS SSTs more often than I should admit for the past 7 or 8 years and asked Joe Bastardi a question about cold water that UNISYS was showing in Hudson Bay a couple of weeks ago. He let me know then that NOAA products were more accurate. UNISYS’ transparency, though, including a couple of comments in the thread at talkingabouttheweather.com, about the situation has been admirable.
Very useful confirmation from Bob that global warming continues. The global SST anomalies plot shows warming at a rate comparable with that of both satellite and land surface measurements ie 0.15C per decade, maybe a bit less.
And its not “bad news” for sceptics. Its simply what is happening.
As a Skeptic, all I want is the proper use of science.
.Although I believe any human effect on the atmosphere though CO2 production to be unlikely, I would love to be proven wrong and look forward to a few decades of warmer weather. The human race will do what it does best, and that is to adapt. To believe that 2 degrees C is a crisis is sophmorish and unscientific.
If it really just “is what it is” then why the collective desperation for an el Nino – 20 posts from Bob on an as yet technically nonexistent event.
Remember also that SST is only a few cm at the surface. There is a lot more ocean beneath.
It’s more gruesome than that. Initial measurements of SST from ships is from 1-10 meters below the surface. From buoys, it is (typically) 20 cm to 1 m. From microwave satellites, about 2 cm. And from infrared (AVHRR, VIIRS, GOES, …), it is about 10 microns.
Most places that provide only a single SST are providing a buoy-equivalent temperature. That’s definitely the case for the RTG HR and the Reynolds quarter degree OIv2.
Current forecast is for the !$!# Rex Block to set up and keep CA dry through the weekend. Hopefully the warm water will defeat it prior to Thanksgiving.
It has been very pleasant so far in upper California. This time last year was at least 20 degrees colder. My tomatoes have new growth and new blooms on. The local 10 day forecast is for continued above average temps.
Bob may me glad that the Unisys graphics have gone, but I am not. I liked them, and I felt that they were perhaps independent to some extent. Possibly they have some issue with their data analysis, but I rather fear that they are being “got at”. There’s so much peer pressure in big corporations. Anyway, it will be interesting to see what Unisys come back with – or whether they just fold completely.
Rich.
When they stopped posting earlier this year, I switched to Weather Zone and Tropical Tidbits, plus I also look at NCEP. I like the first 2 the best. Their resolution is very good, and their color scheme let,s me easily follow the shifts in temp. NCEP floods their chart with too much red. I liked the seamless borders that Unisys uses on their map. I would tile that on my widescreen and get a great full screen map of the global oceans.
http://polar.ncep.noaa.gov/sst/ophi/
Bob thanks for showing me this product. I think it is great.
My only point re UNISYS SST anoml product was / is that UNISYS finally got around to realizing that the color bar for the product was wacko and they DID address it, with white/lite grey for the zero T anoml , before they pulled the plug.
Hopefully, when the product reappears it will still have these items as they have been changed to.
The UNISYS SST color bar was never the issue. They changed the wrapping palette to a simple linear one and it made no change to the overall picture of apparent cool SSTs in the high latitude NH.
We are not being given the full facts here. Something strange is going on and it relates to base period. Not color palette.
Color palette is and always has been a (possibly deliberate) red herring. It’s irrelevant.
Bill Illis is I think closest to what is really going on in his posts about games being played with seasonality.
Bob
Your graph #2 is covers areas outside of the usual four El Nino areas .You are at 100 E. Should you not start at 160 E? . Also you cover 0-20N .Should you not use -5S to +5 N?. Graph # 2 is of interest but does not really reflect the usual four Nino areas . What would the graph look like for the changes that I mentioned .? Any comments ? I see signs of a weak El NINO developing this first week of November but its far too short a period .to call it anything yet .