Guest Post by Bob Tisdale
The recent post at WattsUpWithThat Yes Virginia (and everyone else) there is an El Niño coming was written by Joe Bastardi of WeatherBell Analytics. As a result of that article, Joe and I exchanged a good number of emails. Once again, Joe Bastardi was more than willing to teach from the perspective of a professional meteorologist. Joe took the time on a Sunday afternoon during (U.S.) football season to discuss El Niños and forecasting with me. Thanks, Joe.
The 2014/15 El Niño has to be one for the record books. It has probably been one of the most-observed and most-studied weak El Niño events ever. It started early in the year with a large Kelvin wave (discussed in the first post of this series). Alarmists around the globe began predicting all sorts of mayhem… to be brought on by what they assumed would be a “super” El Niño…which, in turn, they claimed was caused by, and made worse by, human-induced global warming. Contrary to all the prognostications of gloom and doom, the El Niño fizzled into weak El Niño conditions during the boreal spring and summer, destroying all of the alarmists’ hopes and making some persons look exceedingly foolish… exceedingly foolish.
But one of the “constants” throughout the year has been Joe Bastardi’s forecasts that this El Niño would not be a strong event—that the El Niño would reach only weak to moderate levels.
You may, at this time, be saying to yourself, What El Niño? The El Niño hasn’t developed yet.
It depends on how we’re defining an El Niño—which index we’re referencing. That’s the topic of this post.
Now, this discussion would not be taking place if a super El Niño had developed. But that never materialized.
You may also be thinking, If it’s not a super El Niño, why do we care?
The tropical Pacific influences weather around the globe, regardless of whether the sea surface temperatures for a specific region are above or below El Niño and La Niña thresholds. In addition to the numerous other factors that dictate your regional weather, meteorologists have to rely on many indicators from the tropical Pacific when preparing their seasonal forecasts, not just the sea surface temperatures of a specific region along the equator.
I learned a good number of things from Joe Bastardi during that email exchange, but on the topic of El Niño, one of points he stressed was, I was limiting my definition of an El Niño to the one based on the sea surface temperatures of the NINO3.4 region—the classic NOAA definition. NOAA uses the sea surface temperatures of the NINO3.4 region of the equatorial Pacific for their Oceanic NINO Index (ONI) and for their classifications of “official” El Niños and La Niñas.
NOAA defines El Niño conditions as sea surface temperature anomalies of the NINO3.4 region equal to or higher than +0.5 deg C. And as of last week, the week centered on Wednesday, October 22, sea surface temperature anomalies were once again back at the threshold of El Niño conditions. Let’s expand on that.
This year, NINO3.4 sea surface temperature anomalies barely squeaked into weak El Niño conditions during the boreal summer, then dropped back toward zero, but have returned once again to the threshold of El Niño conditions…according to the weekly data. Whether the sea surface temperatures there remain at or above that threshold long enough for NOAA to classify this year’s event as an “official” El Nino has yet to be seen. (And that was how I was limiting my view of an El Niño.)
ANOTHER OF THE CURIOSITIES THIS YEAR
Figure 1 is a map of the average sea surface temperature anomalies of the tropical Pacific for May through September 2014. Highlighted on the map are the four NINO regions. More than a decade ago the NINO3.4 region was selected for use as the primary NINO index. In the 1997 paper The Definition of El Niño, Trenberth notes:
Mean temperatures are higher in the Niño 3.4 region than in Niño 3 and its proximity to the Pacific warm pool and main centers of convection is the reason for the physical importance of Niño 3.4.
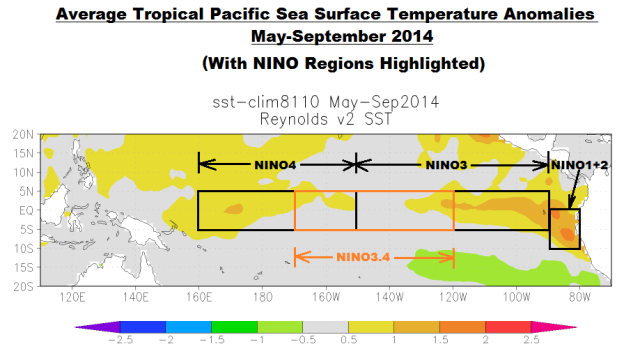
Figure 1
This year, from May to September, the equatorial Pacific has warmed east and west of the NINO3.4 region, as shown in Figure 1. To expand on that:
The equatorial Pacific stretches almost halfway around the globe. NINO regions occupy the central and eastern portions. And while the weekly sea surface temperatures of the NINO3.4 region have occasionally reached El Niño conditions this year (just barely), the monthly values have not. See Figure 2. But the sea surface temperature anomalies for the entire central and eastern equatorial Pacific (5S-5N, 160E-80W) have been at or above +0.5 deg C since May 2014, with most of the warming taking place in the far eastern equatorial Pacific.
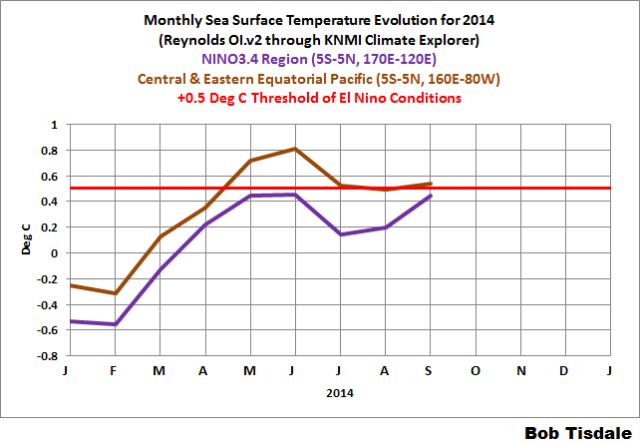
Figure 2
For some reason, the NINO3.4 region hasn’t been cooperating, but east and west of it, the equatorial Pacific has been in El Niño conditions for a good number of months, with the sea surface temperatures in the NINO1+2 region continuing to remain elevated and with the NINO3 and NINO4 regions cycling into El Niño conditions, back out and back in. See Figure 3. In fact, the NINO3 region reached the +1.0 deg C threshold of a moderate El Niño for a couple of weeks.
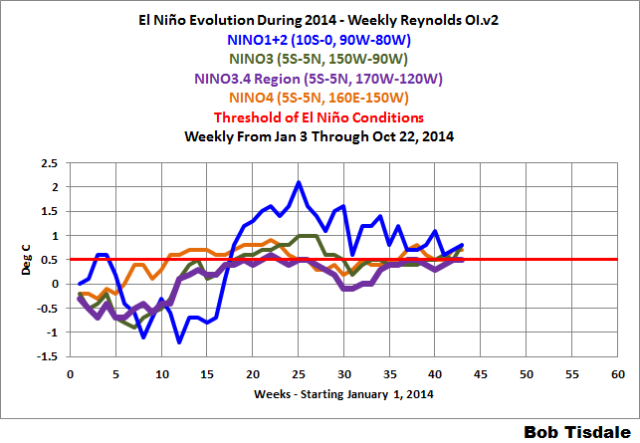
Figure 3
NOAA focuses in the NINO3.4 region with its Oceanic NINO Index, so many people, like me, also focus on it. This year, the (weak) El Niño conditions have been taking place east and west of the NINO3.4 region. Very curious.
THE 90-DAY SOUTHERN OSCILLATION INDEX IS ALSO SHOWING WEAK EL NIÑO CONDITIONS
As of October 30, 2014, the 90-day Southern Oscillation Index (SOI) value has been within weak El Niño conditions for more than 1 week, where a negative SOI value equal to or more negative than -8.0 is considered El Niño conditions.
Let’s phrase that another way: Based on the average 90-day SOI, weak El Niño conditions have existed in the tropical Pacific for the past 3 months.
CAN’T FORGET THE MULTIVARIATE ENSO INDEX
The Multivariate ENSO Index (MEI) is another ENSO index published by NOAA. It was created and is maintained by NOAA’s Klaus Wolter. The Multivariate ENSO Index uses the sea surface temperatures of the NINO3 region of the equatorial Pacific, along with a slew of atmospheric variables…thus “multivariate”.
According to the most recent Multivariate ENSO Index update discussion (my boldface):
The long anticipated emergence of El Niño conditions in 2014 has been under way since May-June, despite the lack of signal in Niño 3.4 SST…and its sudden drop in the MEI this month.
The MEI had been showing El Niño conditions for the three bimonthly periods (May-June, June-July, and July-August) before dropping out in August-September.
BUT…
…(big but), keep in mind that El Niño and La Niña rankings according to the MEI aren’t based on fixed threshold values such as +0.5 for El Niño and -0.5 for La Niña. The MEI El Niño and La Niña rankings are based on percentiles, top 30% for the weak to strong El Niños and the bottom 30% for the weak to strong La Niñas. This is difficult to track, because, when using the percentile method, the thresholds of El Niño and La Niña conditions vary from one bimonthly period to the next, and they can change from year to year.
As a clarification, looking at the numerical values of the MEI timeseries, the 19th ranked positive MEI for AugSep is 0.526 (through 2014), but for the next three bimonthly periods (through 2013) the 19th ranked positive MEI’s for SepOct is 0.638, for OctNov it’s 0.645 and for NovDec it’s 0.559. It would be interesting to know why Klaus Wolter uses percentiles instead of fixed thresholds.
I’ll have to add the MEI to my next few monthly El Niño updates.
BOTTOM LINE
NOAA’s primary ENSO index (NINO3.4 sea surface temperature anomalies) is not indicating that we’re in weak El Niño conditions. And, when all is said and done next year, it’s entirely possible that this year’s El Niño won’t be highlighted in red on the Oceanic NINO Index. But that does not mean weather conditions are not responding to the other factors that contribute to an El Niño, where
- other factors include those considered by the Southern Oscillation Index and Multivariate ENSO Index, and
- other factors that are impacted by the sea surface temperatures of the other NINO regions east and west of the NINO3.4 region.
It all boils down to what one uses to define an El Niño and how one uses that information when making a long-term weather forecast…which is where Joe Bastardi excels.
POSTSCRIPT
Just a quick animation of the last two months of subsurface temperature anomalies graphics along the equator, from the NOAA GODAS website: As noted in the last two updates (here and here), there has been a strengthening of the latest downwelling (warm) Kelvin wave. That warm water should continue to travel east and be drawn to the surface over the next few months.
Animation 1
EARLIER POSTS IN THIS SERIES
- The 2014/15 El Niño – Part 1 – The Initial Processes of the El Niño.
- The 2014/15 El Niño – Part 2 – The Alarmist Misinformation (BS) Begins
- The 2014/15 El Niño – Part 3 – Early Evolution – Comparison with 1982/83 & 1997/98 El Niño Events
- The 2014/15 El Niño – Part 4 – Early Evolution – Comparison with Other Satellite-Era El Niños
- The 2014/15 El Niño – Part 5 – The Relationship Between the PDO and ENSO
- The 2014/15 El Niño – Part 6 – What’s All The Hubbub About?…
- The 2014/15 El Niño – Part 7 – May 2014 Update and What Should Happen Next
- The 2014/15 El Niño – Part 8 – The Southern Oscillation Indices
- The 2014/15 El Niño – Part 9 – Kevin Trenberth is Looking Forward to Another “Big Jump”
- The 2014/15 El Niño – Part 10 – June 2014 Update – Still Waiting for the Feedbacks
- The 2014/15 El Niño – Part 11 – Is the El Niño Dying?
- The 2014/15 El Niño – Part 12 – July 2014 Update – The Feedbacks Need to Kick in Soon
- The 2014/15 El Niño – Part 13 – More Mixed Signals
- The 2014/15 El Niño – Part 14 – Warm Water Recirculated?
- The 2014/15 El Niño – Part 15 – August 2014 Update – An El Niño Mulligan?
- The 2014 15 El Niño – Part 16 – September 2014 Update – Still Seeing Mixed Signals
- The 2014/15 El Niño – Part 17 – Is There Still Hope for a Moderate El Niño?
- The 2014/15 El Niño – Part 18 – October 2014 Update – One Last Chance?
And for additional introductory discussions of El Niño processes see:
- An Illustrated Introduction to the Basic Processes that Drive El Niño and La Niña Events
- El Niño and La Niña Basics: Introduction to the Pacific Trade Winds
- La Niñas Do NOT Suck Heat from the Atmosphere
- ENSO Basics: Westerly Wind Bursts Initiate an El Niño
What’s the uncertainty of that 0.5 C anomaly? Are we so focused on the veins in the leaves on the trees that we have completely lost sight of the forest?
Crap!…there’s a forest?
When did THAT happen?…and I’m sure we caused it.
nickreality65, NOAA does not publish uncertainties with their weekly SSTa-based ENSO indices…
http://www.cpc.ncep.noaa.gov/data/indices/wksst8110.for
…or with their monthly data…
http://www.cpc.ncep.noaa.gov/data/indices/ersst3b.nino.mth.81-10.ascii
…or with their 3-month-averaged NINO3.4 data known as ONI.
http://www.cpc.ncep.noaa.gov/products/analysis_monitoring/ensostuff/ensoyears.shtml
With respect to your second question, that’s one of the reasons for this post.
Seems to me you don’t really win a bet by retroactively changing the terms of that bet. Just sayin’….
Claude, I suspect you’re referring to my proposed bet with Joe Bastardi on the thread of his recent post. Joe’s reply to me (email) was that we’re already in El Nino conditions, so how could we bet on whether we’ll enter into them. Regardless, I’m going to buy him lunch when I finally do run into him.
I can’t think of a nicer guy I would want to eat with. BUT be careful, Joe is a carbs man and burns it off later.
Enjoy
Yeah, smacks of moving goalposts to me. So that the ball will go into the goal.
good to see you’ve opened your mind here Bob.
Joe B knows the atmosphere and what effects it in the real world.
if he is a Raider fan like me, it was not much of a sacrifice. 😉
Ditto for Bucs fans.
I suspect Joe is more of a college football fan, so Saturday may have been TV day.
You must be right, rain predicted for California.
Great to see this rain event coming together over California. Just a drop in the bucket as they say but extremely welcome. Ridging builds back in quickly, early next week and the next storm may be awhile but this storm, this far south at the end of Oct/start of Nov is a good sign.
Raining pretty hard here in the Bay Area as I type.
Lots of soggy wet Giants fans for the parade !!!
@Philin California -I lived in SF for 2 years. It rained almost every day! Ok, 2 years is not climate. But no one is going to convince me that SF is part of “Sunny” California! 😉
Hey bob,
Very glad to hear. I’ve been suggesting you guys
get together for some time.
Just enough of an El Niño to lose any of that deep ocean heat that Trenberth had been hiding away?
BOM (Australia): http://www.bom.gov.au/climate/enso/tracker/
I would not trust anything BOM do. Members of Parliament have been calling for an inquiry see http://joannenova.com.au/2014/11/george-christensen-australian-mp-calls-for-an-inquiry-into-the-bom/
Here on the East coast of Australia it certainly feels like an El Nino October. I don’t have any statistical analysis to back that up, just anecdotal observation which I know is prone to be carried by errors in memory. It just feels hot – El Nino hot. And we’ve not getting our afternoon storms, which tends to go with El Nino conditions.
Bob there was a mention a couple of months ago that there was still a 50% chance of an El Niño by BOM based on the 3.4 level going back up to what seemed a positive 0.25 degree level
Looking at a chart of positive and negative 0.25 levels over the last five years we had 1 El Niño and 2 La Nina’s but about 15 -20 times the crossing of these levels.
How does the Bureau compute a 50 % chance in the next few months and if their base for an event in the next say 2 months is a level of 0.25 degrees why is it so obviously wrong?
Angech, BOM uses a group of models to estimate the likelihoods:
http://www.bom.gov.au/climate/enso/#tabs=Outlooks
So a weak El Nino discharges some of the heat from the Pacific warm pool. Is this typically enough to delay the next El Nino for several years, or could the weak one be followed immediately by a normal one?
James, the only back-to-back El Ninos, starting with a weak El Nino, in the ONI table occurred in 1976/77 and 1977/78 and they were weak-to-weak:
http://www.cpc.ncep.noaa.gov/products/analysis_monitoring/ensostuff/ensoyears.shtml
Cheers
Agree Bob,
http://ggweather.com/enso/oni.htm
Interesting, the similarities to the WInters of 76/77 and 77/78 and our current state.
We also had numerous southward incursions of the “Polar Vortex” during both those WInters with the weak El Nino’s.
I believe that sort of pattern has higher odds when we have a La Nina and lowest odds when we .have a strong El Nino.
Weak El Nino’s like this one, maybe are just not powerful enough to overcome the effects from the northern branch of the jet stream(in the US) with a strongly -AO for instance. In that case, Arctic air masses are flushed south and meet El Nino jet stream energy farther south than they would than if a stronger El Nino was deflecting the northern stream more(with milder and more moist flow farther north)..
However, overall, for the past decade, we’ve been back in the same -PDO part of the cycle(vs +PDO in the 80’s/90’s), which, like in those 1970’s years tends to result in weaker and less El Nino’s.
Thanks, Bob.
if 76/77 was an El Nino, why was that the height of that drought period?
hell, just every day in January 77 was a Santa Ana here in Lost Angels. there was a permanent lenticular cloud over Mt. Baldy that i could see from my school in Boyle Heights.
I know 1998 was the “super el nino” but have we ever had a “super la nina”? Not that I want one I’m just curious if the sediment or historical record shows any large la ninas.
Thanks
TRM, it depends on how you define super La Niña.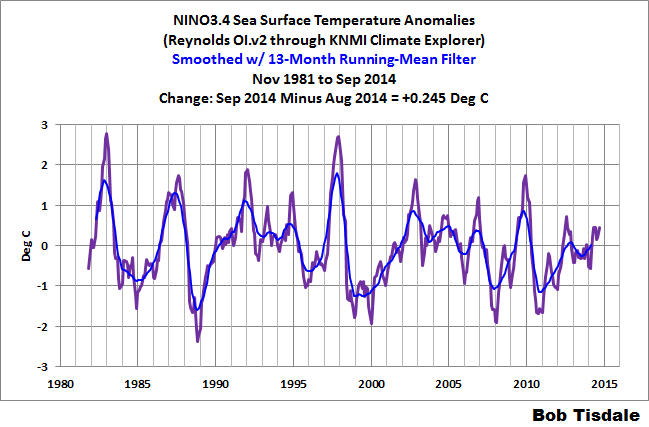
The 1988/89 La Nina was a strong event in terms of NINO3.4 sea surface temperature anomalies, almost as strong as the 1982/83 and 1997/98 El Niños:
And according to the NODC ocean heat content data for the tropical Pacific, the warm water that was released by the 1997/98 super El Niño, and redistributed in its wake, was created during the 1995/96 La Niña:
http://i45.tinypic.com/11uz2c0.jpg
In my eyes, that makes the 1995/96 La Niña a super La Nina.
Sweet! Discharge. Recharge. I am of the opinion that Bob has described the lungs of our Earth. She breaths in and breaths out. In sometimes smooth and deep, and sometimes short and ragged breaths. She has hot spells, and sometimes cold spells. She keeps secrets while shouts to us. In a word, mercurial. But nonetheless magnificent.
I predict rain followed by wind and then nightfall. And clouds. There will be clouds.
That was a very interesting post! As far as global data sets are concerned, Hadcrut4.3 is in first place after 9 months with an average of 0.560. This is above the previous record from 2010 of 0.555. Some people make a big deal out of the fact that this happened without an El Nino. On the other hand, if 2014 really was an El Nino year, but by a different definition, that changes things a bit.
However the satellite data seem to see no signs of an El Nino at all. After 9 months, UAH, version 5.5, is ranked 8th and RSS is ranked 7th. There is no way that either will set a record this year or even come in second place.
It would appear as if different types of El Ninos affect different data sets differently.
With northern Pacific and Atlantic SST dropping this month, RSS and UAH will be interesting for Oct/Nov.
Sadly, the weekly Reynolds OI.v2 SST data are not available with the NOAA NOMADS website modifications. It would be interesting to see what’s transpiring…instead of having to wait for the monthly data through KNMI.
Really very well done Mr. Tisdale; the organization, font changes, brevity of points, clear transitions, etc., made for this dilettante, a pleasurable read. Normally I would not suffer well an articulation of minutiae but your skill with presentation has really come a long way toward reaching the marginal audience.
I have nothing against changing the definition or emphasis of what constitutes an El Nino and what are its important effects . But lets do that for the next El Nino with the benefit of proven or validated actual history and analysis of what happened , not just speculation . Moving goalpost when it looks that one is losing the ball game , smacks of the same game that we fault the alarmists for.( namely if the observable data does not match the unproven theory, change the historical data or rules so that they do.
“NOAA defines El Niño conditions as sea surface temperature anomalies of the NINO3.4 region equal to or higher than +0.5 deg C.”
Defining an El Niño relative to temperatures in the central Pacific seems a far cry from that of the Peruvian fishermen who introduced us to them:
“An early recorded mention of the term “El Niño” to refer to climate occurred in 1892, when Captain Camilo Carrillo told the geographical society congress in Lima that Peruvian sailors named the warm north-flowing current “El Niño” because it was most noticeable around Christmas. The phenomenon had long been of interest because of its effects on the guano industry and other enterprises that depend on biological productivity of the sea.” (from the Wikipedia)
I imaging from looking at the anomalies map that the Peruvian fisherman would agree with Joe Bastardi. The temperatures off the coast of Peru make it an El Niño regardless of what’s happening in mid Pacific (i.e Region 3.4).
Many thanks to Bob and Joe. Goes to show how the value of open-mindedness leads to deeper understanding of a very complex phenomenon.
Yes, both open-mindedness and clarity of method, including any underlying assumptions. Bob has always clearly stressed that he was using NINO 3.4 as his indicator. Joe has a better method; science moves ahead, in contrast to AGW, where the indicator would have been called “a model,” never published, and carefully protected from the eyes of the “unworthy,” who might “find something wrong with it.”
Bob, thanks as always for your interesting post. However, here’s the current state of the MEI:

The blue lines show the month-by-month upper 30% and lower 30% values, which when exceeded (according to Klaus Wolter) indicate El Nino and La Nina conditions.
I fail to see why Joe (and perhaps now you) think that based on the MEI we are in an El Nino. The MEI got barely above the threshold in May, has been dropping ever since, and in September is now just below the 30% threshold shown in blue in the above graph. So if it was an El Nino, it was both 1) weak, and 2) finished in September.
My best to you, keep up the good work.
w.
Hi Willis: First, let me refer you again to the statement made in the NOAA MEI update: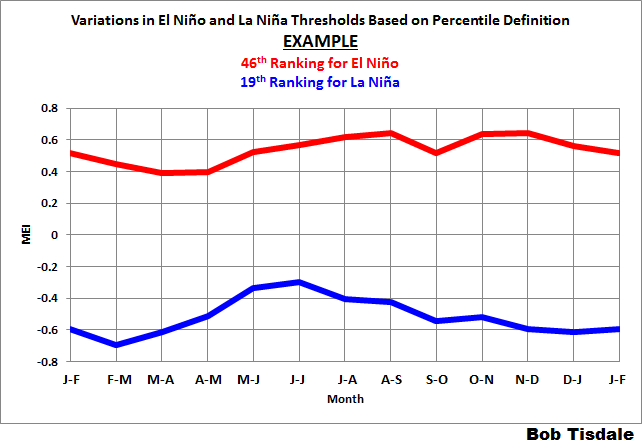
“The long anticipated emergence of El Niño conditions in 2014 has been under way since May-June, despite the lack of signal in Niño 3.4 SST…and its sudden drop in the MEI this month.”
http://www.esrl.noaa.gov/psd/enso/mei/#discussion
I don’t believe I’ve misinterpreted what Klaus Wolter had written, “El Niño conditions in 2014 has been under way since May-June, despite…its sudden drop this month.”
Second, thank you for plotting the MEI data against the varying threshold. It helps to illustrate what I had written in the post—that it was “difficult to track, because, when using the percentile method, the thresholds of El Niño and La Niña conditions vary from one bimonthly period to the next, and they can change from year to year.”
I had also roughed out a graph of the varying thresholds for the year, based on the 46th ranking for El Niño and 19th ranking for La Niña. Here’s the final version:
That’s really awkward. For example, during A-S, it’s more difficult to be in El Niño conditions than it is in S-O. Go Figure.
Enjoy your weekend, Willis. Looking forward to your next post.
Bob
One of the key parts of an El Nino that you write about is the reversing of the trade winds.
The Australian Meteorology Bureau reports in their latest October ENSO Update :
“Trade winds are weaker than average over the western half of the tropical Pacific and near-average over the remainder of the tropical Pacific .
During La Niña events, there is a sustained strengthening of the trade winds across much of the tropical Pacific, while during El Niño events there is a sustained weakening of the trade winds. ”
As much as I would like to believe what you and Joe now claim, that an El NINO is already under way, the evidence that you both present just does not compute based on even your own writings and analysis .
Did Bob ever use the term “reversing” with regard to trade winds? I don’t recall him using that term. Ever.
Hi herkimer: You are correct. Reversals of the trade winds (westerly wind bursts) are key to the development of El Niño events. Here’s an example of the 2014-to-July and 1997 Hovmollers for wind stress (not anomalies) along the equator from the July update: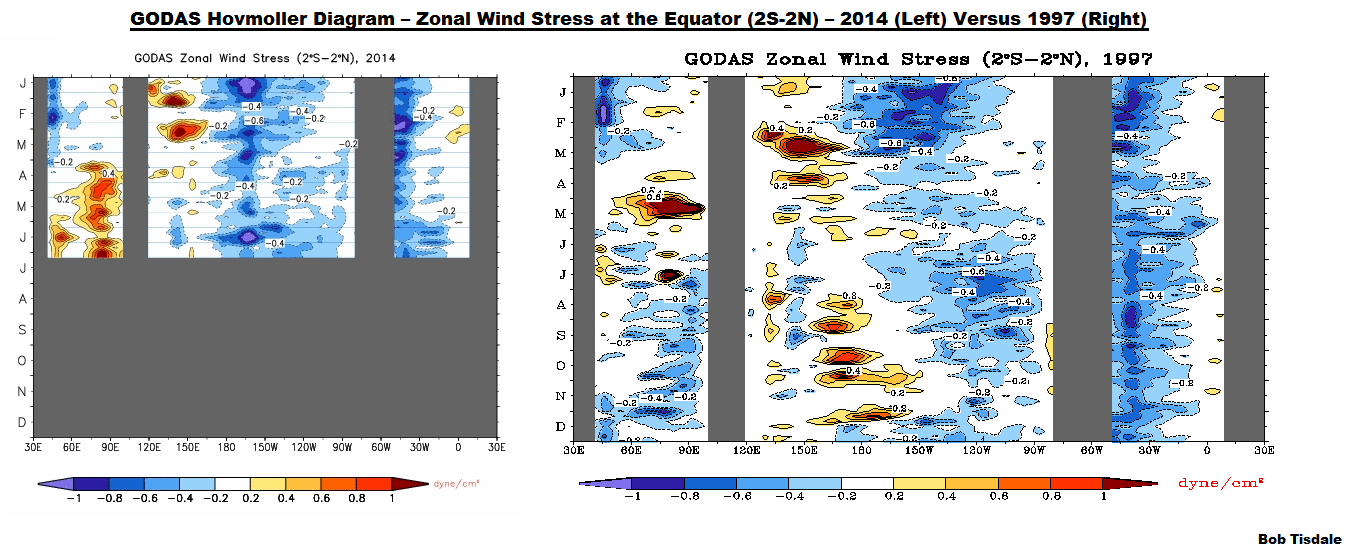
During the development of the 1997/98 El Niño, westerly wind bursts in the western and central equatorial Pacific just kept coming. After the initial ones in February and March 2014, we haven’t had those westerly wind bursts this year.
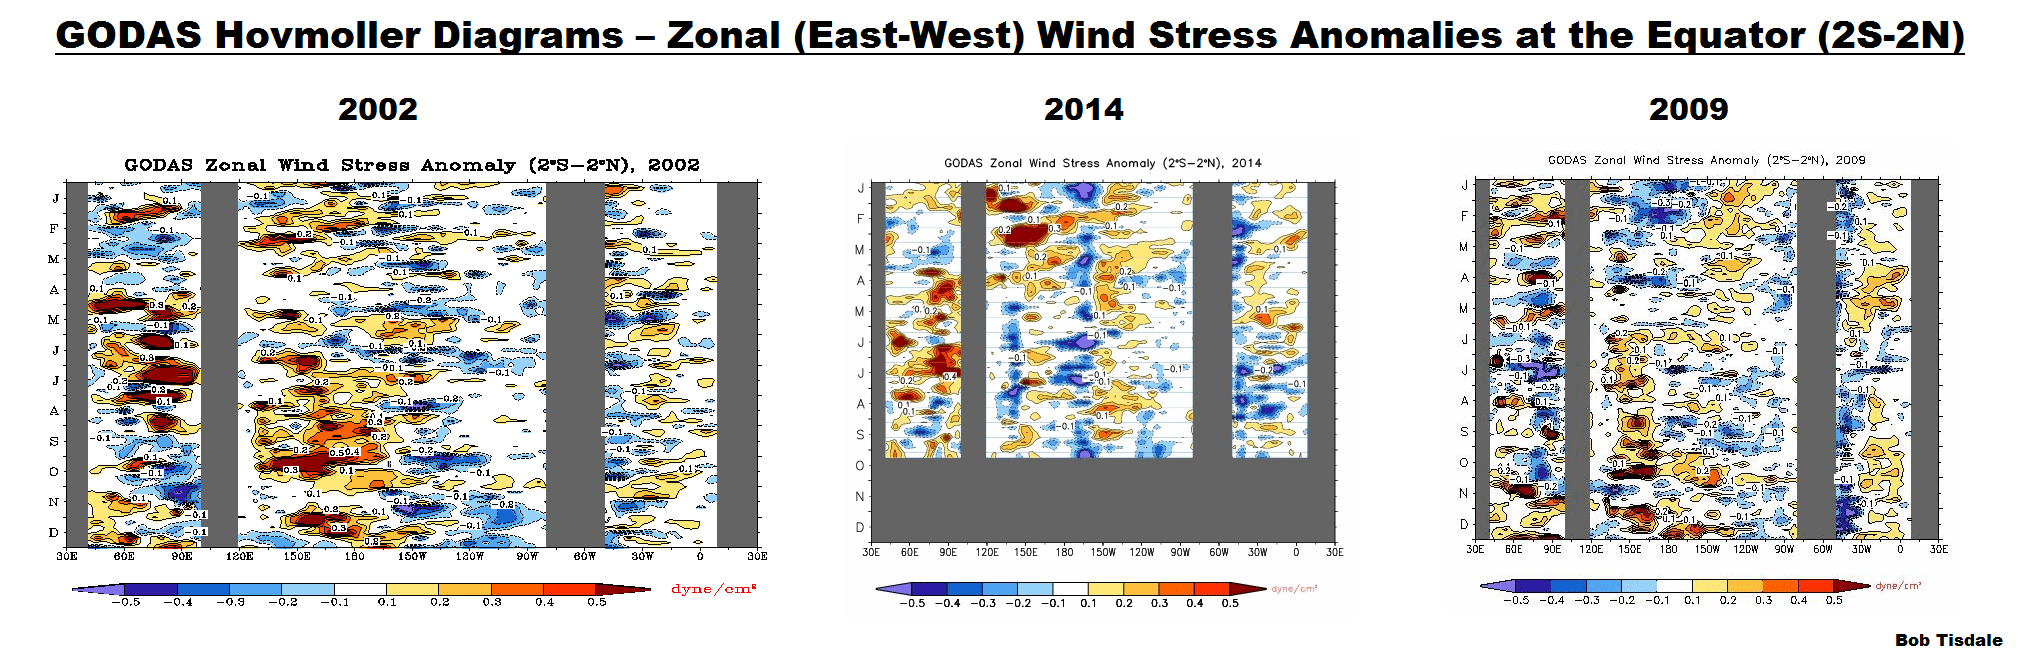
We also haven’t had much in the way of weaker-than-normal trade winds. See the following illustration that compares Hovmollers for wind stress anomalies (not “absolute” values) along the equator from the October update (compares YTD 2014 to the evolutions of the 2002/02 and 2009/10 El Niños):
But something else happened this year, a pocket of warm water from the original strong downwelling Kelvin wave split off of the equator and headed back to the west. See the “Warm Water Recirculated” post from the series:
http://bobtisdale.wordpress.com/2014/07/26/the-201415-el-nino-part-14-warm-water-recirculated/
That pocket of warm water later fed back into the Equatorial Undercurrent (Cromwell Current) and has been carried eastward, in another downwelling (warm) Kelvin wave…without the help of a westerly wind burst. See the “An El Niño Mulligan?” post:
http://bobtisdale.wordpress.com/2014/08/12/the-201415-el-nino-part-15-august-2014-update-an-el-nino-mulligan/
Then, a few weeks later, more of that returned warm water fed into the Cromwell current, and strengthened (perpetuated) the current downwelling Kelvin wave. All without the assistance of westerly wind bursts or any real weakening of the trades in the western equatorial Pacific.
The 1997/98 El Niño was a freak. So far, this year has been freaky, too, but in many different ways.
Such is weather.
Cheers.
Reminds me of a lava lamp – except that the Earth itself is not heating the ocean from below – at least not as much as the heat source in a lava lamp.
I have been of the opinion that there has been an El Nino occurring since April/May. It’s important to consider the cause, which has been there, not the symptoms. You wouldn’t consider yourself to have a cold only if your left nostril obtains a certain level of blockage right? So why consider ENSO to be at El Nino only when the obscure NOAA conditions are met?
Robert, if I understand you correctly, we shouldn’t consider the El Nino to be actually happening when certain pre-specified thresholds are exceeded … instead, we should just go with your “opinion”???
I’m not clear at all why you are opining that an El Nino has been occurring since April/May … astrological portents? Subsea conditions? The world wonders.
Regards,
w.
If conditions similar to this El Nino happens often, then invent a new name for it – like El Androgino.
Nothing obscure about them. They’re perfectly transparent.
A warm STT at the Nino region 1-2 does not always imply that an El Nino is about to happen . It was also warm during OCTOBER 2013 and 2012 and 2010 with no El Nino. Taking a few of these isolated events as proof of an El Nino without looking at the proper bigger picture can be misleading.
I still maintain that based on the current signs to-date , there is no solid evidence whatsoever that we have a current or future El Nino THIS WINTER.
When is the following La Nina to begin?
Feb-March 2015
Bob, you can’t be caving in to NOAA and their worshipers? Whilst it may be nice for some to rely on so much of what “they” say I’m sorry but I just can’t. Living downunder I will rely on the Tropical Team at BoM. ENSO is still Neutral as far as I’m concerned and they are concerned. I know you know, that SOI and Nino 3.4 numbers only count when the criteria meets generally 5 consecutive months. This year so far they have not. Close yes, but meeting the criteria, no. There are what, 8 or 9 models used, Poama I believe (this is written quickly and off the cuff, I could be in error) is BoMs and it shows Neutral. On another note, we all know BoM has guilty of many transgressions re Global Warming; it’s so blatent its laughable, but I have personally met the Tropical Folks and am impressed; they appear to be immune to the pressure brought onto to the rest of BoM. I hesitated to write this, but Joes article was a bit too pushy and bordering on arrogant for me and I still believe we are not paying attention to the actual weather from the equator southward. And I have yet to see an analysis of SSTs off Equador and the state of the fisheries. I say if the fish and SST off the coast are normal we are neutral.
Also there have been no westerlies to speak of. This is the start of Cyclone season downunder; there have been few signs of rotation in our ‘hot pool’ and the MJO has been quiet. Winds everwhere east of the dateline have been easterly quadrant; maybe a few incursions of northerlies crossing the equator, but this is quite normal. So NO westerlies Bob and I’m looking at it everyday.
This last few weeks the Jet has been impressive and at 500hPa the troughs and ridges have been sharp. Plenty of 1030 Highs. They bring fresh trades. I’m starting to ramble so cheers from New Zealand.
the main indicator for me are the fish. when the artisanal inshore fishermens boats in the southern islands of philipinnes remain tied up,you know el nino conditions exist
Is there already an El Nino? Well, it depends on the meaning of what “Is” is.
Thank you, wws
Weather Dave
I too like to review what BoM say. Here is their outlook as of October
“Three of the eight international climate models surveyed by the Bureau indicate the possibility of ocean conditions reaching El Niño thresholds by mid-summer, with the remainder favouring persistence of neutral conditions. The models which indicate a possible El Niño forecast peak central equatorial Pacific SSTs reaching at most moderate El Niño levels. ”
Three out of eight is poor odds for an El Nino in my opinion.
It is interesting when one looks at the plot of the POAMA MODELS monthly mean NINO3-4 FORECAST, the ensemble mean curve does not exceed 0.4 until about March of 2015 and only gets to about 0.6 – 0.7 by about June 2015. It seems that even the models as an ensemble do not predict an El Nino THIS WINTER at this time .
Bob Tisdale, thank you for another informative post.
El Niño conditions have been evident for at least three months in Eastern Australia. I’d say we have one but a weak event and for my own sake that it breaks down in March/April. It’s a tad difficult to grow crops without sufficient rain and we need big opening falls to replenish sub soil moisture.
Thank you Bob!
The Eagles must not have been playing’ Joe’s a South Philly fan.
Judging by the Autumn we have in Laramie, my answer is yes.
We have El Nino LIKE conditions here in Canterbury NZ.
Very sunny and very dry for the last two months.
Is an El Niño Already Taking Place?
Depending on people’s private definition, yes or no. According to the CPC definition absolutely no.
Not necessarily private definitions, FergalR. When all is said and done, the BOM may say that there had been a weak El Nino. based on the SOI.
Bob
Thanks for the further clarification about the recent unusual nature of the events in the Pacific. Whether all this turns into an El Nino this winter, we will just have to wait and see .
So everyone is right to a degree or another… LOL science at work!
Guano birds carrying horse mackerel at NOAA it seems. Spare bottle of Lea & Perrins in the canteen cupboard too no doubt. Full English breakfasts served all day.
Nice post Bob, you are such a great teacher.I have learned so much from you.I can not fully express my thanks and appreciation here.
El Nino is bad news for Australia as the populated Eastern States are affected by drought during the event. Right now there is much rain throughout the entire Nation sweeping from West to East, week in week out which is unusual, this has been happening for months now where once the rain was not inland but coastal. However the rain along the Eastern Coast has been virtually constant for years and is brought on by Southern High Pressure systems moving from West to East.
No sign of it stopping just yet.
http://www.eldersweather.com.au/synoptic/
East coast rain is often a result of dominant blocking Tasman Sea highs that cradle lows againt the coast while the inland remains very dry and is often associated with El Niño. The vast expanse of SE Australia has been in a decile one for precipitation for many months. Your post is at odds with the current situation.
Interesting discussion. No two el Ninos are alike especially ones with borderline existence. Twenty posts (almost) on an el Nino that only exists when we shift the goalposts! Why are we following an agenda of AGW desperation for el Nino? It is what it is.
Some weeks ago it was pointed out that Peruvian upwelling had returned and with it the anchovies were increasing. For me the anchovy tonnage landed in Peru has equal importance to any meteorological index of el Nino. With upwelling and the anchovies back, the el Nino was dead and buried.
We are overthinking ENSO by adding more and more multivariate parameters. ENSO at its core is the Bjerknes feedback which involves just two things: Peruvian upwelling, and the trade winds. Everything else follows from those two.
All our models and thinking about ENSO have developed during a single warming el Nino dominated PDO warm phase since 1976. Now we are moving into a different Pacific ground state and will have to learn about new dynsmic processes.
Why the excess warmth in the east and west Pacific? Maybe it is linked to the anomalous high latitude cold SSTs both north and south. Perhaps transport of ocean heat poleward from the equator is slowing?
I am following it because I want reservoir replenishment in Cali (plus snow to ski on) and because following it so intricately is contributing to our future predictive capabilities. Your assumption of the motive for interest is an inaccurate generalization (redundant).
The trade winds have turned westerly from 160°- 180° and are looking weak to the east http://www.bom.gov.au/climate/enso/sst_wind_anom_5day.large.gif
I am puzzled by the temperature convergence of the equatorial regions in Fig 3. Nino1+2 has been cooling for approximately 18 weeks. A mixed bag of signals for sure, but the trade wind change is very interesting and will be worth watching.
Has El Nino already formed ? The trade wind change would indicate so.
Keith Minto
This is the same graph that the Australian BoM used to make the comments that I noted earlier I my previous post, namely,
ENSO Update :
“Trade winds are weaker than average over the western half of the tropical Pacific and near-average over the remainder of the tropical Pacific .
During La Niña events, there is a sustained strengthening of the trade winds across much of the tropical Pacific, while during El Niño events there is a sustained weakening of the trade winds. ”
There is nothing new in your comments here.
If you go to http://earth.nullschoo.net/#current/wind /surface
You will note that the surface winds are mostly blowing east
I should correct my previous post
You will note that the trade winds are blowing mostly west[not east]
That web page should read
http://earth.nullschool.net/#current/wind/surface
El Nino, La Nina are created by external forcings (wind mostly) that (on a localized basis) alter the thermocline and natural lapse rate in ocean temperatures from what one would expect in an idealized entropic system. The boundary layers created in warm and cool pools have their own entropic characteristics which further effect the rate of achieving overall equilibrium.
“Forcing” cuts both ways. The winds force the oceans. The oceans force the winds. Its a connected system, which, with nonlinear dynamics thrown in, also forces itself.
I’ve noticed for some time now that anything on the plus side of ENSO neutral tends to produce somewhat above average rainfall in California. It’s the major El Niños that produce the 200% years. I still say we’re better off with average or a little above average rainfall because there are fewer flooding type storms with damaging winds but still enough rainfall to fill the reservoirs. A weak El Niño for the 2014/15 rainfall season might just be perfect.
Unfortunately less intelligent humans learn little about climate from their parents or grandparents and seem bent on being forced to learn the same lesson over and over again. The only way to stop that short cycle is to require each generation to care for grandparents as soon as they hit the age of 18. Let’s call it the new draft into service. Maybe we could stop this cyclic madness that every generation of nitwits seem bent on spreading: Oh its freezing! We caused it!!! Oh its heating up! We caused it!!!! Oh we are sinning and the world will end!!! And we caused it!!!!!
Please Lord give me a fricken break from the “current generation”.
Latest …
1. Troup’s SOI
2. Pressures
I have to respectfully disagree. There neither is now, nor is there going to be, an El Niño this year (much as it pains me to say it). These pre-El Niño-like symptoms we’re witnessing are only natural aberrations and not the full-fledged event.
Mr. Tisdale,
I would love to see a video of your discussion with Joe Bastardi along with the graphs you were discussing. That would be a great educational experience.
Why is it that many data sets that show present temperature anomalies used the the 1971-2000 data set. it is well know the globe was cooler from the forties thru the mid seventies. With the temperature inertia of the oceans being so massive is it fair to use a number that stats out cold?
Keith Minto. I will add to Herkimers comment regarding easterly winds. There have been no westerly winds of any significance in the SW Pacific. The only westerlies that have occurred are those from a passing depression or tropical disturbance. I think that you possibly confuse ‘anomalies’ with actual wind. I have always found that in meteorology anomalies can quickly give a novice the wrong idea. For those interested in SW Pacific wind forecasts try http://www.metvuw.com/. This is from the Univ of Victoria in NZ who use GFS. I am a tropical forecaster and use UK Met, ECMWF, GFS and a French Model that has proved quite valuable to me. BoM does not forecast east of the dateline so their data is of limited value. However back to the winds. The other cause of any westerlies, that last for only a week or so, come with an MJO pulse which has not been active at all recently.There are a few other causes but are trivial.
Hi,
I’ve just found someinformation that seemed to be very useful, please take a look
gerjaison