0
0
votes
Article Rating
Gotta love the “is caused by an inherent model structural deficiency ” in the significance statement.
This opens the door to what may happen to CO2 in the coming decades if the Earth goes into a 30 year cooling cycle.
The mean growth rate of CO2 should begin to level off (1) if it is due primarily to outgassing from our ocean’s with a slowing OHC rise and (2) plant biomass greening (termed “global terrestrial primary production” by the authors.) as described here.
http://www.esrl.noaa.gov/gmd/webdata/ccgg/trends/co2_data_mlo_anngr.png
“is caused by an inherent model structural deficiency ”
——————————————————————-
When the space shuttle challenger exploded into a fireball filling the sky, the NASA announcer called it – “a major technical malfunction”
When a Chevy Volt exploded into flame and destroyed the owners house, the marketing department called it – “an uncontrolled thermal event”
I think I recognise this language…
“Inherent model structural deficiency. ” = “Our model exploded.”
But we must not discount the possibility of 16% more plant CO2 absorbtion being excuse #55(?) for the “pause”. (And here they do have some ground as there is some evidence of “global greening”)
Konrad;
I spent several minutes on google trying to find your “Chevy Volt exploded. . .” incident but didn’t find one. Instead I found the 3 crash test vehicles which would have been total losses and became smoldering fires after a minimum time of one week. Also, I found the battery explosion at a GM test center where a “Not Volt” battery was undergoing an abuse test. Last, I found garage fires where Chevy Volts were plugged into 15 amp recepticals which overheated and eventually caught fire. There was one incident where a Volt was parked next to another electric car which caught fire first, then burned the Volt.
The first issue here is actually 2 cars and 1 battery which resulted in fires DAYS after the damage was done. Other than the fact that the only way they could repeat the incident was by removing the battery from the car and smashing it there’s clear evidence neither the occupants of Volts or other cars in the crash are in any danger of being burnt to death because of the battery. The fact that news releases about this use pictures of gasoline only cars burning is further damning to the idea of “you’re going to burn to death in a volt.”
The second issue here is the battery test at GM. We don’t know what chemistry that exploded battery used, but we do know it was not a Volt battery. We also know that they were intentionally abusing the battery. In the real world the car’s software would not allow the driver to do what the test lab was doing to the battery. This is standard procedure to subject a system to extreme loads or conditions in attempt to accelerate failure onset and often results in failures which are never seen in the real world.
Lastly, there are the house fires. I did some research on this at the time these were reported and it turns out the outlets used were most likely installed with insufficient current handling capacity for the 15 amp charger on board the car. To be more clear, go look at appliances you own which have electric motors and plug into 15 amp outlets. None of them are rated for 15 amps continuous! GM made the mistake of assuming any old 15 amp plug would do when pulling a 15 amp load. In the real world this isn’t true. The end result is GM changed the vehicle software so it would pull something less than 15 amps and SURPRISE garages stopped burning down. Remember when everyone said the electric car isn’t practical because of the battery? That isn’t true, its because of your HOUSE and your electric utility. In the case of the volt burned by another electric vehicle, it was a DIY conversion vehicle that caused the initial fire. It damaged the Volt, which caught fire later (still lots of time to escape).
The truth is you’re much more likely to die in a fire if you’re driving a gasoline powered anything than if you are driving any electric vehicle. Even in the Tesla fires, they involved either severe underbody damage, a bifurcated vehicle, or speeds close to 100 miles per hour, all which would result in elevated risk for fire in a gas car too.
After that long-winded reply I must say I’m not a CAGW believer. Instead I say BURN BABY BURN as I continue to drive 90 miles a day in my worst in class fuel economy vehicle. That said I am a believer that electric cars have several benefits over liquid combustible fuel which will result in them being the primary mode of transportation in the next 50 years.
Sorry, but the growth rate of CO2 is not going to level off if emissions keep increasing. Your graph shows that CO2 growth rate is not leveling off, but continuously increasing on decadal scales. If a growth rate is increasing, that concentrations in the atmosphere are in fact accelerating. Wishful thinking on that “cooling cycle,” too. It may very well be that we would have been in a cooling cycle now, but because of higher CO2 levels, we are only seeing a “pause.”
The rate of change of the CO2 increase is quite variable: between 10% and 90% of human emissions each year in the past 55 years of accurate measurements. Over decades, that varied between 60% and 40% of human emissions. The net result over the last decades is rather flat, as good as it was in other periods. That is natural variability and both more uptake by the biosphere and the non-warming oceans may play a role.
Nevertheless, the increase is (near) totally caused by human emissions and temperature is only modulating the variability around the trend, which hardly influences the trend itself.
A good catch there Edim.
That bar graph (who draws bar graphs) definitely has the mark of a level trend since 1998.
And what about that 1998 mega el Nino CO2 peak.
Nah ! the increased Pacific Temperatures in 1998 wouldn’t cause excess CO2 out gassing from the oceans to boost the atmospheric CO2; would they ??
If I didn’t know better, I would posit that the ocean temperatures drive the atmosphere CO2; but we all know it’s really the other way round. And that bar graph proves it.
argumentum ab auctoritate
Professor X, Professor of Science A presents an argumentation for a thesis. You need to remember that due to the thesis being presented by a professor. That goes for all cases, whether this professor pronounce him-/herself within his/her own scientific field or in other science fields.
A thesis or an argument presented by a professor does not mean that the professor is credible because he is a professor. In other words: It does not necessarily mean that the professor’s statement, even if it is within his own territory, is sound and free from biases as well as independent of the influence of research grants from the interest group. Business, individual interest groups, etc. Authority is no safe criterion of credibility.Fallacies in argumentation
“Global climate models have underestimated the amount of CO2 being absorbed by plants, according to new research.”,
They aren’t talking about GCM’s as such. These don’t generally model carbon uptake; their CO2 forcing is usually prescribed by scenarios. They are talking about carbon cycle models. They are adapting the Community Land Model CLM4.5. GCM’s may be run coupled to a CCM, but they are different.
[Formatting fixed. -w]
Nick, a quick google search for “GCMs” and “carbon uptake” brings up 170,000+ hits. Many of them talk about the GCMs modeling carbon uptake, such as
Acceleration of global warming due to carbon-cycle feedbacks in a coupled climate model
So while you are correct that GCMs don’t “generally” model carbon uptake, some of them do.
w.
So plants absorb 16% more CO2 than previously thought.
Earths radiation budget revised down 30%
http://wattsupwiththat.com/2014/01/17/nasa-revises-earths-radiation-budget-diminishing-some-of-trenberths-claims-in-the-process/
TSI has increased by about 1 w/m2 since 1750
http://lasp.colorado.edu/home/sorce/data/tsi-data/
Not much room left now for AGW is there?
Not much room left now for AGW is there?
Could it be less than we previously thought!
NoTricksZone – 12 October 2014
By Ed Caryl
Using 1999 GISS Data, Global Warming Trend Since 1866 Only 0.5°C Per Century!
We are told over and over again that the globe has warmed by 0.8°C since 1880 or 1850. Lately we have seen article after paper after publication that states this number in Fahrenheit, 1.44°F, because that sounds larger. But is this number correct? What is it based on?
GISS and Google “way-back machine”
Recently, a file from GISS in Google’s “way-back” machine came to my attention……..
I don’t think this will make much difference in the current growth rate of CO2 in the atmosphere. Currently the net carbon cycle of the biosphere absorbs 1 GtC/year extra due to the 100 ppmv extra CO2 partial pressure in the atmosphere. If that increases, the uptake by plants will increase too, about in ratio to the increase in the atmosphere, all other necessities being equal (which is seldom the case in nature). Thus much depends of the human emissions which, until now, increased slightly quadratic over time and are currently around 10 GtC/year. Biosphere uptake thus is around 10% of the current human emissions, including the 16% correction mentioned by the above research. Thus while the 16% correction may be important for the historical temperature-CO2 changes, it has less influence on the current increase.
Temperature has a huge influence on the year by year increase in the atmosphere, but that is a minor player in the continuous increase of CO2 in the atmosphere since ~1850.
Ferdinand –
“Biosphere uptake is thus around 10% of the current human emissions…”
Presumably this is a net calculation of the ‘mass balance’ variety, of which I am seriously suspicious, and unless you have backup evidence for that, I think it is worthless.
Total human emissions are many times LESS than the total flux of CO2 through the biosphere and as the CO2 system is a complex dynamic with significant and difficult to calculate feedbacks, I don’t think we can learn anything very much from this.
Indeed, it is the net uptake by the biosphere which is currently ~1 GtC/year. The in/out cycle itself is estimated at about 60 GtC/year day/night mainly local uptake/respiration (both integrated over a year), which hardly reaches the rest of the atmosphere and 60 GtC/year which is seasonal: high uptake in spring/summer/fall and decay all year long and extra in fall.
The seasonal and net uptake can be measured based on the δ13C and O2 balances, which are highly influenced by the biosphere, but hardly by any other carbon cycle, including the oceans. See:
http://www.sciencemag.org/content/287/5462/2467.short
and
http://www.bowdoin.edu/~mbattle/papers_posters_and_talks/BenderGBC2005.pdf
Ferdinand’s arguments are, indeed, notoriously circular. It is very clear that atmospheric CO2 is essentially the result of a dominant temperature dependent natural process. Here, it is very obvious that the rate of change of CO2 is dependent on temperatures, it has leveled off with them, and will decline in the future with them.
Hello Bart,
I was waiting for your comment…
There is no connection between the variation in rate of change, which is almost completely temperature variation dependent and the trend in the rate of change, which is not caused by temperature. Both are caused by different processes:
– the variability is caused by the influence of temperature on the tropical forests as temporarily source.
– the trend is not caused by vegetation, as that is a net, growing sink over decades.
Any link with temperature between two different processes based on one of them is spurious.
Here the influence of the temperature rate of change on the CO2 rate of change. There is a 90 deg. lag between the derivatives because there is also a 90 deg. lag between changing CO2 changes and temperatures changes. The flat temperature derivative trend has a high influence on the CO2 rate of change, but zero influence on the CO2 derivatives trend. The latter is caused by the slightly quadratic human emissions trend which gives a linear trend in the derivatives which is twice the observed trend in CO2 increase.
Moreover, historical CO2 levels are tightly bound to temperature of not more than 8 ppmv/K, which is the case for over 800,000 years. The current increase of CO2 is 110 ppmv above the historical equilibrium. If that happened at any time in the past 800 kyears, that would be measured in every ice core, even with the worst resolution.
Last but not least, the biosphere is a proven sink, based on the oxygen balance. The oceans are a proven sink, based on over 2 million measurements, be it still a small sample on wide oceans. But if the oceans were a net source, that would violate a lot of observations, like the mass balance, the δ13C balance and the nuclear bomb tests 14C decay rate…
One failed observation is enough to kill a theory, several failed observations must be enough to give this discussion a final rest…
“There is no connection between the variation in rate of change, which is almost completely temperature variation dependent and the trend in the rate of change, which is not caused by temperature.”
The trend is a near perfect match. It is obviously temperature driven.
“There is a 90 deg. lag between the derivatives because there is also a 90 deg. lag between changing CO2 changes and temperatures changes.”
No, there is a 90 deg lag because there is an integral relationship. What you have stated is mere tautology.
“Moreover, historical CO2 levels are tightly bound to temperature of not more than 8 ppmv/K, which is the case for over 800,000 years. “
The best, most modern, and most reliable measurements plainly show the integral relationship in the modern era. As that is the era with which we are concerned, we do not need to concern ourselves with questions about what conditions reigned thousands of years ago, or how reliable proxy measurements for that time are. We know what is happening right now, and what has been happening since at least 1958, when the record of reliable atmospheric CO2 measurements begins.
“Last but not least, the biosphere is a proven sink, based on the oxygen balance.”
This is speculative, based on assumptions about oxygen sources, sinks, and mixing dynamics.
“One failed observation is enough to kill a theory, several failed observations must be enough to give this discussion a final rest…”
Indeed, it should be. But, you refuse to understand that the 90 deg phase lag can come from no other than an integral relationship, and that the trend in rate must therefore be temperature dependent, and you refuse to acknowledge the ongoing divergence between emissions and atmospheric concentration.
What will you do, I wonder, when temperatures fall, and CO2 rate of change falls with them, while emissions keep accelerating upward? What excuse will you come up with then?
Bart we have been there before, but for some newbies here I will repeat the arguments…
– There is a direct relationship between the variability of temperature changes and the year by year variability in the rate of change of CO2. That is modest: ~+/- 1 ppmv around the slope. Over the full 55 years, the variability is less than halve the current human emissions and practically invisible in the total increase.
– There is a weak relationship between the temperature increase and the increase in the atmosphere:
http://www.ferdinand-engelbeen.be/klimaat/klim_img/temp_co2_1960_cur.jpg
where a huge change in temperature has little effect on CO2 levels (4-5 ppmv/K), while the total increase would be over 100 ppmv/K if temperature was the cause.
– There is a near perfect match between human emissions and the increase in the atmosphere:
http://www.ferdinand-engelbeen.be/klimaat/klim_img/acc_co2_1960_cur.jpg
– The mass balance is negative for any natural contribution over the past 55 years, The only way that some natural source could be the cause is if 1) the sinks are rapidly accommodating to any increase in the atmosphere and 2) the natural carbon cycle increased a 4-fold over the past 55 years, in lockstep with the 4-fold increase of human emissions and the 4-fold increase of the increase in the atmosphere per year.
– About 1): only the ocean surface reacts fast on changes in the atmosphere, but has a limited capacity (10% of the changes in the atmosphere), all other known sinks are slow to extremely slow.
– About 2): there is zero indication that the total natural carbon cycle increased (except in the NH extra-tropical forests). To the contrary, the recent estimates of the residence time are showing an increase in residence time which is consistent with a rather stable throughput in an increasing atmospheric CO2 mass.
– The biosphere as a whole is a proven sink, based on the oxygen and δ13C balances.
– The oceans are a proven sink, based on a lot of measurements. Moreover, if the oceans were the cause of the increase, the δ13C levels would go up, not firmly down as is measured.
– The increase caused by humans fits all observations, temperature as cause fits none.
The trend is a near perfect match. It is obviously temperature driven.
The variability is certainly mostly temperature driven, but as the variability and the slope are certainly caused by different processes, there is no reason to use temperature to explain both the variability and the slope. That is just curve fitting…
No, there is a 90 deg lag because there is an integral relationship. What you have stated is mere tautology.
There is no integral relationship between temperature and the slope of the CO2 rate of change at all: the Bode theorem is for a single process and a single variable with a strong feedback on its own. Here we have two independent variables both influencing CO2 levels without much feedback on temperature. An integral relationship with temperature violates Henry’s law of the solubility of CO2 in seawater which is between 4-17 ppmv/K. The feedback caused by any increase above the temperature-CO2 equilibrium for seawater is negative which completely lacks in an integral only calculation…
This is speculative, based on assumptions about oxygen sources, sinks, and mixing dynamics.
If real measurements don’t fit your theory, the measurements must be wrong? Any known O2 sink or source besides the biosphere and fossil fuel burning?
But, you refuse to understand that the 90 deg phase lag can come from no other than an integral relationship, and that the trend in rate must therefore be temperature dependent
The relationship is for the temperature – CO2 changes, where CO2 lags temperature with 90 deg.
The relationship is for the temperature derivative – CO2 derivative changes where the CO2 rate of change lags the temperature rate of change with 90 deg. The integral of the temperature derivative is very small and so is the resulting CO2 increase caused by the temperature increase.
The relationship is NOT for the temperature changes – CO2 derivative changes,
you refuse to acknowledge the ongoing divergence between emissions and atmospheric concentration.
What divergence? Still widely within natural variability:
http://www.ferdinand-engelbeen.be/klimaat/klim_img/dco2_em4.jpg
where the red line is the remaining CO2 increase based on a temperature influence of 8 ppmv/K and an e-fold decay rate of the excess CO2 of ~50 years (base 290 ppmv for the temperature in 1850).
What will you do, I wonder, when temperatures fall, and CO2 rate of change falls with them, while emissions keep accelerating upward?
If that happens, I will accept the facts, even if that is physically very unlikely to ever happen…
“Bart we have been there before, but for some newbies here I will repeat the arguments…”
I am as weary of it as you. But, as long as you keep proffering these circular arguments and assertive narratives, I must by necessity respond.
“There is a direct relationship between the variability of temperature changes and the year by year variability in the rate of change of CO2.”
And, there is a direct relationship between the slope in temperature and the slope in the rate of change of CO2. The rate of human emissions also has a slope. Since the slope is already accounted for by the temperature relationship, there is no room for human emissions to have a significant impact.
There is nothing magic about this. It is very common behavior associated with feedback loops, which suppress output excitations from external disturbances.
“There is a near perfect match between human emissions and the increase in the atmosphere:”
The match is lousy, and diverging. The match with temperatures is much better, and not diverging.
“The mass balance is negative for any natural contribution…”
This argument is completely circular. You do not know the net natural contribution, because anthropogenic forcing also drives natural sink activity. That portion of the natural sink activity cannot be considered purely natural, because it would disappear if anthropogenic forcing were to cease.
“…but as the variability and the slope are certainly caused by different processes…”
An assertion, not a fact. And, not possible, due to the total lack of phase distortion.
“…the Bode theorem is for …”
The Bode theorem is very general, and you do not understand it.
“If real measurements don’t fit your theory, the measurements must be wrong?”
Never claimed it. I merely stated there are other possible reasons for it, which you ignore because it would upset your narrative. We are, right here, arguing on a page discussing aspects of the carbon cycle which have been previously misunderstood. And, you are going to tell me we know uniquely everything there is to know about oxygen flows? Please…
“The relationship is for the temperature – CO2 changes, where CO2 lags temperature with 90 deg.”
90 deg phase lag over all frequencies = integral relationship. There is no way around it.
“What divergence? Still widely within natural variability:”
You can always get a fit which you can claim is within natural variabilty – that is merely testimony to the robustness of least squares fitting, something which is well known and provides no information of note. But, you cannot mask the fact that atmospheric concentration is at a standstill during a time when emissions have been rapidly accelerating.
“If that happens, I will accept the facts, even if that is physically very unlikely to ever happen…”
Prepare yourself, my friend. Because the downturn is kicking into high gear.
Bart, here we go again…
And, there is a direct relationship between the slope in temperature and the slope in the rate of change of CO2. The rate of human emissions also has a slope. Since the slope is already accounted for by the temperature relationship, there is no room for human emissions to have a significant impact.
Bart, it is proven beyond doubt that the year by year (2-3 years) variability in the CO2 rate of change is caused by vegetation: higher temperature = higher CO2 rate of change. It is proven beyond doubt that the decadal slope of the rate of change of CO2 is NOT caused by vegetation, as the above research strengthens: vegetation is a net, growing sink for CO2. Thus higher temperature = zero to negative CO2 rate of change from vegetation.
Thus there is no reason at all to assume that the slope in temperature and the slope in the rate of change have anything to do with each other. To the contrary, as temperature has a very modest influence on CO2 levels both in direct measurements (Henry’s law) as in historical ratio’s, there are more arguments against such a relationship than for (including the 13C/12C ratio).
Thus your argument that the temperature relationship is the cause of the slope of the CO2 rate of change is not based on proven facts.
The match is lousy, and diverging. The match with temperatures is much better, and not diverging.
Talking about divergence… If you add the CO2 rate of change to your temperature plot, that shows an increase in the period 1960-1980, while the temperature level drops (and human emissions increase…). Besides that, cherry picking the temperature trend that fits best and choosing the right factor and offset is simply curve fitting without any underlying physical process…
You do not know the net natural contribution, because anthropogenic forcing also drives natural sink activity. That portion of the natural sink activity cannot be considered purely natural, because it would disappear if anthropogenic forcing were to cease.
As humans currently emit around 3% of the natural emissions, they can’t be responsible for more than 3% of the sink rate (if the sinks show a rapid response as you think, which isn’t the case). The net sink rate is 1.5% above the total emissions, thus humans are responsible for 0.05% above the total emissions, assuming that human and natural emissions have the same effect on the sinks…. If humans stop all emissions, the remaining net sink rate still would be 1.45% above the total emissions.
Further, if all CO2 behaves the same, no matter its source, the 4-fold increase in human emissions over the past 55 years and the 4-fold increase rate in the atmosphere and the 4-fold increase in sink rate must be accompanied with a 4-fold increase in natural emissions, if these are responsible for the increase in the atmosphere.
For which isn’t the slightest indication…
The Bode theorem is very general, and you do not understand it.
The Bode theorem is for a feedback system. The temperature-CO2 system is largely one-way and what there is as feedback has a very long time constant. That doesn’t influence the rapid responses seen over 0-3 years. Thus not applicable.
We are, right here, arguing on a page discussing aspects of the carbon cycle which have been previously misunderstood.
The oxygen balance was only possible since the 1990’s with the best available accuracy, the above research is for the period before the oxygen balance could be measured.
90 deg phase lag over all frequencies = integral relationship. There is no way around it.
The 90 deg phase lag is between the variability of the direct measurements (T and CO2) and between the derivatives (dT/dt and dCO2/dt), not between the temperature variability and the CO2 rate of change variability. That simply has no physical meaning. Integrating the temperature rate of change gives 0.5°C increase and a related maximum 4 ppmv CO2 increase since 1959…
Last but not least:
not possible, due to the total lack of phase distortion.
There is no phase distortion if the variability is caused by a temperature dependent process and the slope is not temperature dependent. I have done a test in Matlab/Simulink with three different frequencies and adding an independent slope, the latter before and after integration. Only a 90 deg lag and a smaller amplitude for the higher frequencies but no distortion of the phase lag due to the external slope, here included in the integration:
http://www.ferdinand-engelbeen.be/klimaat/klim_img/matlab_sin_t_co2_slope.jpg
Here we go again…
“It is proven beyond doubt …”
It is not.
“Thus there is no reason at all to assume that the slope in temperature and the slope in the rate of change have anything to do with each other.”
Yes, there is. The slope and the variation match nearly perfectly, with no phase distortion indicating separate processes.
“If you add the CO2 rate of change to your temperature plot…”
It’s a pretty good match with Southern Hemisphere temperatures. This just goes to show that the effect is regional. It is hardly surprising that the Southern Hemisphere dominates, with wide ocean expanses and the CO2 absorbing Amazon and Congo basins, a.k.a., the “lungs of the world”. If we had something other than bulk average measurements, we could undoubtedly get an even better fit. It is really quite amazing that we can get this good a fit, and that indicates a very strong signal to noise ratio, i.e., the relationship is quite assured, and it is from a uniform, dominating process.
“If humans stop all emissions, the remaining net sink rate still would be 1.45% above the total emissions.”
That would be a transient response which would quickly dissipate. Then, you would be left with purely natural flows, and you would find nature had become a net source.
“…the 4-fold increase in sink rate must be…”
There has been no 4-fold increase in sink rate. I have demonstrated this mathematically to you.
“The Bode theorem is for a feedback system.”
No, it is for any system described by a linear (or, linearizable), minimum phase transfer function.
“…and what there is as feedback has a very long time constant”
This is mere assertion.
“The 90 deg phase lag is between the variability of the direct measurements (T and CO2)…”
Which means that CO2 has an integral relationship with temperature. Sorry, Ferdinand. There is no way around it.
“There is no phase distortion if the variability is caused by a temperature dependent process and the slope is not temperature dependent.”
Yes, there is. If the slope in temperature were being high pass filtered out in some exotic fashion, that would leave a phase distortion, a leading phase in fact, right in the middle of the observable frequency range. It doesn’t. There isn’t.
Ferdinand –
many thanks for the links. The O2 measurement approach is new to me and, like the good sceptic I am, I’d need to be convinced that measuring O2/N2 ratios would have any hope at all of determining carbon movements and it seems the Science article recognises the huge uncertainties, without actually admitting that they undermine the results.The C12/C13 ratios are more familiar and seem to be on more substantial ground. C12/C13 is of course the key to establishing that the increase in CO2 is largely due to fossil fuel use, and I have until now accepted it. However, work of several groups, including that of Salby and Humlum, questions this. That work is universally ‘panned’ by the warmists,and I’ll admit I went along with that, mostly because of the coincidence of the CO2 rise with industrialisation, but recently I’ve had some doubts. I wonder what your thoughts are? Or maybe this is for another thread?
The main problem for the oxygen balance is the necessary accuracy of the O2 measurements: better than 1:200,000. That is at the edge of the analytical possibilities. But I suppose that this will get only better in the future…
The nice point is that oxygen changes are directly coupled to carbon movements in the biosphere and fossil fuel burning, besides a small correction for ocean surface temperatures.
About Dr. Salby, I had several comments on his speech, main two points:
– his CO2 migration in ice cores simply is impossible, as that implies a negative CO2 level during glacial periods and a tenfold increase for every 100,000 years back in time over interglacials…
– his integrating of temperature over time doesn’t give extra CO2: there is an equilibrium of ~8 ppmv/K, not a continuous release of CO2 for a fixed temperature offset.
About Humlum: he shows that the variability of the CO2 rate of change follows the temperature changes, which implies that CO2 can’t drive temperature (not completely right, but not relevant). But the variability of the rate of change and the CO2 trend are caused by different processes: the first is the influence of (ocean) temperature on the decay rate in (dryer) tropical forests at elevated temperatures (El Niño), which gives extra CO2 in the atmosphere, while the general trend is more CO2 uptake by (extra-tropical) vegetation at increasing temperatures…
Besides a letter in Nature (different subject: a clash with Greenpeace about chlorine use) and a few articles in E&E, the last one about the (overblown in the models) influence of human aerosols, I have no “peer-reviewed” articles about any subject. Mainly because my background is in chemical process engineering (and later on process automation) thus I have not any “climate” background, be it that climate is one of my (too) many hobbies for over 30 years, after reading a book about the influence of the sun on our climate…
Thus I don’t think that something I write will be welcomed in the mainstream climate community press… I do comment on several blogs (of friends and foes). I even did comment in the early days of RC on their blog but as after a while about halve of my comments disappeared in cyberspace, even when completely on topic, I did give up to comment there…
Ferdinand,
FWIW, my advice is: don’t give up.
Willis Eschenbach has no degree in climatology either, nor in any closely related field. Yet he is a published author. Multiple times, in fact.
Based on your many comments, I have no doubt that you can do the same. The field very much needs an outsider’s view; it is becoming too ossified. It needs to be stirred up.
Get some co-authors, and an editor to coach you on what the journals look for, and to proof-read. And if you ever do author a paper, remember to include a statement that while CO2 is rising, that is a net benefit to the biosphere. Because that is a fact, isn’t it?
Also, if you want some practice, Anthony is always looking for well written, intelligent guest submissions.
Ferdinand
I’ve appreciated your comments here and found some of your earlier postings. Impressive, thorough, and set out with delightful clarity. Plenty for me to think about for now! As a parting shot, I’d just like to note you seem to have great confidence in the measurements and the quantitative calculations regarding CO2. Looks like you have sympathy for the mass balance approaches, whereas I don’t think we have enough info to be comfortable with that at all. I note you have worked in chemical and process engineering. There you will have input conditions which are known to the most exact limits, and processes with effects which can be measured, tested, modified, repeated and scaled reliably. If feedbacks occur, you can measure and control them exactly. Such experience is useful, but I put it to you that such methods just can’t be rolled out in atmospheric science in the same way. So I respect your authority, but with the caution that you trust the ability of the numbers too much. Your criticism of Salby and Humlum looks right, and Salby is particularly annoying in that he doesn’t really answer criticisms – one has to assume he can’t. But my own limited scientific experience deals with biological systems which are driven in an entirely different way and so I still have some nagging reservations regarding the fossil component of CO2 rise.
I’ll explore and I shall also keep an eye on your posts. Oh that more postings on these blogs were of the same quality!
Many thanks – please keep it up.
Thanks Mothcatcher for your kind words…
During my working life I was confronted with a lot of problems, including failing models of the chemical processes involved, which in theory and in the lab were working fine, but got horribly wrong when upscaled to production. Or where one of the suppliers swindled with the specs by adding some masking agent (not detected in the quality control) which ruined the following reactions… So I have a healthy skepticism against any measurements and especially critical about models in general…
About CO2 measurements: one can only hope that one day surface temperature measurements are made with the same rigorous quality control as CO2 measurements are done. See:
http://www.esrl.noaa.gov/gmd/ccgg/about/co2_measurements.html
Or the fascinating history of the struggle of C.D. Keeling to continue the CO2 measurements against all kinds of administration:
http://scrippsco2.ucsd.edu/publications/keeling_autobiography.pdf
About the human emissions: these are based on fossil fuel production and sales. While most is sampled by governments (in earlier days by the financial administration, because of taxes…), the figures are less reliable, but if anything probably more underestimated than overestimated, due to under-the-counter sales…
What nature adds or removes is the difference between the previous two, thus without knowing any individual natural CO2 flux, we know the difference with reasonable accuracy. That makes that in the past 55 years nature as a whole was more sink than source, with reasonable, increasing confidence, as the sink rate increases over time, dwarfing any fossil fuel production and sales errors.
The research in the introduction is about one of the main sinks. If that increased over time (which is the case), that doesn’t change the calculated total sink rate, it only changes the partitioning between the two main players: oceans and vegetation, the other known sinks are either too small or too slow… But one never knows which surprises we still may see in the future…
“It is proven beyond doubt …”
It is not.
Bart, there is conclusive evidence that the fast reactions temperature come from (tropical) vegetation: if a CO2 increase is caused by vegetation, the CO2 and δ13C changes go opposite to each other, which is the case here:
http://www.ferdinand-engelbeen.be/klimaat/klim_img/temp_dco2_d13C_mlo.jpg
If the oceans were the main cause, the CO2 and δ13C changes would parallel each other.
And there is conclusive evidence that vegetation in general is a net, increasing sink, the earth is greening…
It is hardly surprising that the Southern Hemisphere dominates
The trends 1960-1980 still are opposite: a temperature drop and an increase of the CO2 rate of change…
More important: the main increase is in the NH, not in the SH which lags the NH with 6-24 months:
http://www.ferdinand-engelbeen.be/klimaat/klim_img/co2_trends_1995_2004.jpg
which is the next strong argument against the oceans as source of the extra CO2: the largest natural deep ocean CO2 sink is in the NE Atlantic, while the largest natural deep ocean CO2 source is in the SH along the Chilean/Peruvian coasts…
That would be a transient response which would quickly dissipate. Then, you would be left with purely natural flows, and you would find nature had become a net source.
If there was a fast response from the sinks, these would react on the 3% drop in human input only. That is a drop of no more than 0.05% of the 1.5% net sink rate. There is no reason to drop the sinks further if the reaction of the sinks to the inputs is the same for human and natural CO2.
Thus the net sink rate will remain for a very long time with a tau of ~50 years, until the CO2 levels will be at ~300 ppmv, the historical equilibrium for the current temperature…
There has been no 4-fold increase in sink rate. I have demonstrated this mathematically to you.
If the human emissions increased a 4-fold and the rate of change in the atmosphere increases a 4-fold, then the net sink rate increased a 4-fold.
If the natural fluxes were the cause of the increase in the atmosphere, they must have increased a 4-fold (and thus also the total sinks) too in lockstep with the human emissions, or the natural fluxes can’t be the cause of the increase in the atmosphere…
No, it is for any system described by a linear (or, linearizable), minimum phase transfer function.
All descriptions I have found about the Bode theorem were about feedback systems, not for a mainly open loop system, which the T-CO2 system is (the feedback is in the carbon cycle, hardly any in the CO2-T part).
“…and what there is as feedback has a very long time constant”
This is mere assertion.
Do you think that the reaction of temperature on the increased CO2 levels is fast (or even important)?
Which means that CO2 has an integral relationship with temperature. Sorry, Ferdinand. There is no way around it.
Which is only for the fast reacting processes, which in general integrate to zero CO2 change. For the longer term processes which react on the slope of temperature, the ocean carbon cycle gives a strong negative feedback to the increase of CO2 in the atmosphere:
http://www.ferdinand-engelbeen.be/klimaat/klim_img/upwelling_temp.jpg
and the biosphere in general increased its uptake with higher temperatures and more CO2, another (weaker) negative feedback.
These secondary feedbacks on the dependent variable are not included in the Bode theorem or your calculations…
If the slope in temperature were being high pass filtered out in some exotic fashion, that would leave a phase distortion, a leading phase in fact, right in the middle of the observable frequency range. It doesn’t. There isn’t.
You still don’t see that there is no connection between the processes that react on short term temperature variations and processes that react on a longer term slope in temperature. The 90 deg phase shift is for the fast responding processes only which decrease in response in 2-3 years (by lack of “fuel” in the case of the tropical forests). The temperature slope has a direct influence on oceanic increased inputs and decreased outputs, but that is compensated over a longer time frame by the feedback of the carbon cycle on increased CO2 levels…
“…there is conclusive evidence…”
No, this is not conclusive evidence, it is only surmise. You can say something should indicate something to your heart’s content, but science is replete with examples where what was thought should be the relationship turned out not to be.
“The trends 1960-1980 still are opposite…”
Except for one little blip in the late 1960’s, they are pretty much the same.
“If there was a fast response …”
Responses have to obey certain rules of continuity in the real world. One of those rules is that a 90 degree phase shift over all frequencies can only result from integral action.
“If the human emissions increased a 4-fold and the rate of change in the atmosphere increases a 4-fold, then the net sink rate increased a 4-fold.”
It does not follow. I showed you the math on a previous thread. The sink factor of increase is the change in sink activity divided by total sink activity. Since total sink activity is large, this factor is small.
“All descriptions I have found about the Bode theorem were about feedback systems…”
I have explained that it means. It is very general.
“Do you think that the reaction of temperature on the increased CO2 levels is fast…”
Evidently, the rate of change is affinely related to temperatures, so it starts moving immediately in response. There is a 90 degree phase lag, so the response from temperature to CO2 level is delayed a mere quarter of a cycle for a given input frequency component.
“For the longer term processes which react on the slope of temperature, the ocean carbon cycle gives a strong negative feedback to the increase of CO2 in the atmosphere”
Evidently not, as the CO2 tracks the integral of temperature. There may be a negative feedback, but it is not strong, and it takes a long time to manifest. It is not observable in the span of time since 1958.
“You still don’t see that there is no connection between the processes that react on short term temperature variations and processes that react on a longer term slope in temperature.”
Again, this is merely assertion on your part. The data indicate an integral relationship with no observable phase distortion. That is what I see.
I think we are going in circles, and there is not much point in continuing. You may have the last word if you like. My failure to respond should not be construed as acquiescence. Until we meet again…
No, this is not conclusive evidence, it is only surmise.
It is as conclusive as measuring a pH of a solution while adding some acid. Or heating water and watching what the temperature is doing…
Except if you know of any process in the carbon cycle that releases CO2 and at the same time let the δ13C level drop, besides human emissions and the biosphere…
One of those rules is that a 90 degree phase shift over all frequencies can only result from integral action.
Yes, but that only applies to the fast responses. You still don’t see that the slope and the variability are from independent processes: the variability is the reaction of (tropical) vegetation on fast temperature changes. Its integration is near zero after a few years. The slope is from an entirely different process that, if it is has a frequency at all, has at least a 640 years period…
Since total sink activity is large, this factor is small.
Bart, I showed you the math too. Human and natural CO2 have the same physical properties (with a very small difference in isotopes), As the human emissions increased a 4-fold and the net increase in the atmosphere and the net sink rate also increased a 4-fold, the natural emissions and total sinks must have increased a 4-fold or you violate the equality of physical properties for human and natural emissions. If they didn’t increase (as the small increase of the residence time indicates), then the natural fluxes are not responsible for the increase.
There is a 90 degree phase lag, so the response from temperature to CO2 level is delayed a mere quarter of a cycle for a given input frequency component.
Again, that is for the fast responses only, not for the slope…
Evidently not, as the CO2 tracks the integral of temperature. There may be a negative feedback, but it is not strong, and it takes a long time to manifest. It is not observable in the span of time since 1958.
Only if you forget the human input… The human input is twice the increase in the atmosphere, while the integral of the variability in temperature is near zero. One can match any two straight lines with an arbitrary factor and offset, but that is curve fitting without any physical or observational base…
The data indicate an integral relationship with no observable phase distortion. That is what I see.
What you see is the very small CO2 variability (+/- 1 ppmv) caused by the temperature variability (+/- 0.3°C), while the temperature trend since 1960 is in the same order (+0.5°C), with an unknown period. There is an integral of the variability of near zero, while the direct influence (both measurements and historical) of the temperature increase is maximum 5 ppmv.
What you don’t see is the very huge contribution of human emissions over the same period: over 150 ppmv while the increase in the atmosphere is some 80 ppmv, of which 5 ppmv from the temperature increase, the rest from the human contribution…
Ferdinand,
So, Dr. Engelbeen! We meet again!
And once again I ask that you mention the central point of the entire debate; the reason we are all here:
All things considered, the rise in CO2 is a net benefit to the biosphere, and since there is no evidence of any global harm due to the increase in atmospheric CO2, then CO2 must be “harmless”. There is no evidence to the contrary, and the accusations that CO2 are implicated in Polar bear deaths, or in accelerating sea levels, or in the putative disappearance of Arctic ice, or an increase in extreme weather events, or in runaway global warming itself [the original scare], have all turned out to be wrong.
None of the alarmist predictions demonizing CO2 have come to pass. All their predictions have failed. When one group’s predictions are 100% wrong, they must be held to account.
If and when any subastantial predictions of global harm from the rise in CO2 are shown to be accurate, then reasonable folks can begin to take them seriously. But that has not happened. They were completely wrong. All of them.
Normally, when one group’s predictions are all wrong, they are dismissed as being on the wrong track, and no more is heard from them. But the global warming alarm is different, in that there is a huge amount of money involved.
Money is what keeps the “carbon” scare alive. When a certain clique is paid a lot of money to take a position, that position will be argued forcefully. Whether it is right or wrong does not matter, and the fact that some of those promoting the ‘carbon’ alarm are scientists does not matter. They are being paid to sell a product — catastrophic AGW — just like a radio host is paid to sell shampoo, even if he is bald. They are paid to alarm the public, so that is what they do.
It is up to people like you to take the debate the final step, to it’s rational conclusion: since all available evidence indicates that the rise in CO2 is both harmless, and beneficial to the biosphere, we need not be fearful of ‘carbon’. Rather, we should be happy that more of that beneficial trace gas is being made available free of charge.
More CO2 is entirely a good thing. The alarmists were wrong, and their false alarm must be contradicted with facts at every opportunity. So please, when you give your analyses, conclude with what people need to hear repeatedly: that CO2 is harmless, and it is beneficial to the biosphere. You will be doing your part to promote scientific veracity, which is in short suppy in the public’s mind. We don’t have the alarmist crowd’s money. But we have the facts. Let’s use them.
dbstealey,
No “Dr.”, just a B.Sc. in chemical engineering (be it later on had a job in process automation at M.Sc. level, thanks to a lot of selfstudy).
I can repeat here the point that CO2 has more benefits than it caused problems (if any), but that is preaching for the choir…
I do have a lot of discussions in our local media and blogs with warmistas about the lack of harm and the benefits of more CO2.
Recently, we have formed a group in Flanders/Belgium of “OpenKlimaat” (needs no translation I suppose) to promote an open debate about all things climate related, which largely lacks in the media, where the IPCC still is the Bible of Climate.
Although I was surprised that there was an article today in the media that the climate researchers couldn’t explain that the sea ice around Antarctica is rapidly expanding (something known for years by us!)…
What already changed is the reaction of the average John Doe: lots of critical comments these days, partly due to soaring electricity bills (thanks to subsidized windmills and PV installations…). Still the media need to follow…
But anyway, I do react on both sides of the fence: errors (and wishful thinking) made by skeptics as good as by the other side…
“But experts believe the new calculation is unlikely to make a difference to global warming predictions.”
“Working out the amount of carbon dioxide that lingers in the atmosphere is critical to estimating the future impacts of global warming on temperatures.”
2 statements – very close together. Is this muddled thinking
Since this “rogue” CO2 is generated at ground level, what is the chance the greater majority of any CO2 excess is absorbed by nearby plant life, which will also accelerate NEW plant growth.
That is of course, if you believe a relatively minor increase in CO2 has any bearing on AGW whatsoever.
They don’t give one. But probably a more relevant figure they quote is:
“Relative to the 1901 value, the over-predictions of these 14 ESMs range from 10 to 25 ppm by 2010.”
That gives an idea of the uncertainty. But compared with what really affects GCM’s, which is the uncertain estimate of future fossil fuel use, that 10 to 25 ppm over a century is tiny.
Nick Stokes
October 14, 2014 at 5:03 am
“They don’t give one. But probably a more relevant figure they quote is:
“Relative to the 1901 value, the over-predictions of these 14 ESMs range from 10 to 25 ppm by 2010.”
That gives an idea of the uncertainty. But compared with what really affects GCM’s, which is the uncertain estimate of future fossil fuel use, that 10 to 25 ppm over a century is tiny.”
To address the uncertain estimate of future fossil fuel use, the IPCC has their scenarios A, B and C. So – that uncertainty has been addressed. (that all these scenario projections have failed abysmally is irrelevant in this regard)
Also the 10 to 25 ppm uncertainty are from 1901 to 2010 – so would grow if extrapolated to 2100, naively to 20 to 50 ppm, and still be unaddressed by previous IPCC reports.
I don’t think this issue can really be called ‘major’. Yes, it is important to understand how ecosphere reacts to elevated CO2 concentrations and it is good to have strong evidence that plants provide negative feedback in that area but it is not going to budge the issue that is usually considered major, i.e. rising CO2 concentrations. Unless there is major ‘ecosphere shift’, plants are not going to stop or even reverse the trend, they only provide some level of damping.
Nope. It looks like new surprises come up every week for climate scientists. The science is not settled, the Earth’s biosphere is not going to be destroyed by the trace gas and plant aerial fertilizer Co2.
EurekaAlert – 9-Oct-2014
Plant communities in Holy Land can cope with climate change of ‘biblical’ dimensions
…..For nine years the research team of German, Israeli and American ecologists subjected extremely species-rich plant communities to experimental drought designed to correspond to predicted future climate scenarios. For this, the study used four different ecosystems aligned along a steep, natural aridity gradient that ranges from extreme desert (3-4″annual rainfall) to moist Mediterranean woodland (32″).
The recently published study demonstrates that in contrast to predicted changes, no measurable changes were seen in the vegetation even after nine years of rainfall manipulations. None of the crucial vegetation characteristics, neither species richness and composition, nor density or biomass – a particularly important trait for these ecosystems traditionally used as rangelands – changed appreciably in the rainfall manipulations.
These conclusions were reached regardless of whether the sites were subjected to more or less rain.
“Based on our study, the going hypothesis that all arid regions will react strongly to climate change needs to be amended,” stated Dr. Katja Tielbörger (University of Tübingen in Germany), the lead author of the study….
http://www.eurekalert.org/pub_releases/2014-10/ru-pci100914.php
http://www.nature.com/ncomms/2014/141006/ncomms6102/pdf/ncomms6102.pdf
“Plant communities in Holy Land can cope with climate change of ‘biblical’ dimensions”
You mean that plant communities can cope as climates change?
But can they cope with climate change manufactured by climate scientists of ‘doctrinal’ proportions?
Someone should tell those plants they only think they are coping while the models prove that clearly they are not.
The terrestrial biosphere – a growing carbon sink
The Carbon Cycle: a geologist’s view
/Users/euanmearns/Desktop/vnld9l.jpg.png
Humans emitted ~200 ppmv in the past 160 years, the increase in the atmosphere is ~110 ppmv…
Before humans increased their use of fossil fuels, there was a quite linear ratio between temperature and CO2 levels in the atmosphere of ~8 ppmv/K over the past 800 kyears, where CO2 lagged temperature, that completely vanished since about 1850 (and slightly so in centuries before).
Thus it seems quite obvious that humans are (near) fully responsible for the increase. See further:
http://www.ferdinand-engelbeen.be/klimaat/co2_origin.html
Ferdlnand:
You state: “…where CO2 lagged temperature, that completely vanished since about 1850 (and slightly so in centuries before).
Thus it seems quite obvious that humans are (near) fully responsible for the increase.”
I must admit this has me sitting on the very edge of my seat wondering which of the 50+ currently-in-vogue excuses you will use to explain temperatures over the past 20 years.
…I’m waiting…
Johann,
The difference is that the pre-industrial people used wood as main fuel, but wood in general doesn’t add CO2 into the atmosphere, as what is burned only releases the CO2 that was captured a few years to a few decades before out of the atmosphere. And the number of people at that time and their energy use was a lot smaller than today.
Nevertheless there are slight increases of CO2 and methane in earlier centuries, which makes some believe that land use changes and rice culture were already increasing over a much longer period…
Thought I would post this here and ask about timescale resolution;
http://www.biocab.org/Geological_Timescale_op_712x534.jpg
David Ball,
That chart has a very rough resolution and I doubt that the CO2 levels were that low during the Cretaceous: I have seen figures of 10-12 times higher than today. Most of that was disposed by chalk bearing plankton (coccoliths) at the sea bottom which makes the thick chalk layers in southern England and French Normandy and a lot of other places.
Over the past several million years the CO2 levels decreased until the pre-industrial levels we have seen over the past 800,000 years in ice cores, which show a rather linear ratio with temperature of about 8 ppmv/K, Here for the 420,000 years Vostok ice core:
http://www.ferdinand-engelbeen.be/klimaat/klim_img/Vostok_trends.gif
Most of the deviation from the ratio is because of the long lags of CO2 (several thousands of years) when the temperature drops into a glacial period. The opposite, the warming from a glacial to an interglacial period has a smaller lag, but still about 800 +/- 600 years.
Thus while the pre-industrial CO2 levels were dominated by (ocean) temperatures over the past few million years (based on plankton deposits as proxy and ice cores for the past 800 kyears), that doesn’t say much about longer time frames where the position of the continents, the evolution of new life forms, etc. have played a huge role.
significantly increased land area available for vegetation growth in Canada, Russia and Northern EU as the NH land mass warms following the LIA. This is clearly seen in the high northern latitude readings.
The Southern Hemisphere readings however see no acceleration, even back over 50 years. This argues strongly that humans are not causing the increase in CO2 reported at Mona Loa. This also argues strongly that Mona Loa is not a good global indicator of CO2; that it is responding to the regional Northern Hemisphere increasing vegetation signal.
Even more interesting, there is no increase in the rate of change of CO2 in the Southern Hemisphere over a period of 50 years. As well, the min and max in the Northern Hemisphere are trending in opposite directions.
Which suggests that:
1. CO2 is not well mixed
2. seasonal vegetation is increasing poleward in northern hemisphere
3. CO2 concentration is not nearly as simple as assumed.
ferdberple,
About your points:
1. A maximum of +/- 2% of full scale difference between any two stations anywhere in the world, where about 20% of all CO2 is exchanged with other reservoirs in halve a year each direction, I call that well mixed. If you have a different definition for “well mixed”, I like to hear that,
2. Agreed, but that mainly gives an increased seasonal cycle and only a little more net CO2 uptake.
3. CO2 concentration measurements are very simple, robust and reliable, the underlying processes are far from simple…
The simple fact that the rate of change has not increased in the southern hemisphere in 50 years makes it very hard to believe that humans are causing the increase.
If human activity was causing the increase in CO2, we should have seen an increased in CO2 production at the South Pole. Instead the South Pole CO2 is flat for the past 50 years. Which tells us that CO2 accumulation in the atmosphere globally is not accelerating. Rather, we are seeing an increase in N Hemisphere growing cycle, which is affecting Mona Loa.
Which tells us that Mona Loa is not a reliable indicator of global CO2, as it is being affected regionally by the increased vegetation towards the North Pole as the NH has warmed following he Little Ice Age.
The South Pole CO2 reading, being flat argues strongly that the cause of the increase in CO2 at Mona Loa cannot be a result of human activity. Otherwise, the South Pole CO2 reading would be increasing lock-step with human CO2 production (because there is no vegetation at the South Pole to influence the reading regionally).
What we are seeing at Mona Loa is the result of increased vegetation growth in the Northern Hemisphere. We are not seeing any change in the rate of growth at the South Pole, which suggests that AGW has no foundation in reality.
Ferdberple, you are looking at the seasonal cycle. That says something about extra plant growth (thus slightly more net uptake!) but nothing about the cause of the increase, which is at the South Pole the same as near the North Pole, only with a lag, as most of the human emissions are in the NH and the ITCZ allows only a 10% of air mass per year exchange between the hemispheres:
http://www.ferdinand-engelbeen.be/klimaat/klim_img/co2_trends.jpg
and you can compare them to human emissions:
http://www.ferdinand-engelbeen.be/klimaat/klim_img/acc_co2_1960_cur.jpg
The chart was made by Roger Andrews. The data are de-trended. It is the growth in amplitude of the seasonal cycle that is of interest. Combined with the huge difference between N and S hemispheres, which despite all the land being in the N, i still find surprising. In our book, the growth of atmospheric CO2 is down to emissions, 54% are removed from atmosphere each year, and it looks like most if not all of the increase has gone into increased plant growth rates.
http://oi57.tinypic.com/28whxtx.jpg
http://oi60.tinypic.com/533fqo.jpg
Euan, most of the increase in the seasonal cycle is from the growth and decay of spring-summer leaves and following decay in fall-winter and several years more. That increased mainly in the NH where there was a lot of increasing forests by the increased temperatures, both as land area as by the increased temperatures themselves (longer growing season) since the LIA.
But the net increase in uptake is rather modest: the net uptake is the difference between uptake by plants and the decay/feed/food of the total biosphere (bacteria, molds, insects, animals,…). That includes the more permanent storage of CO2 in humus, roots and stems of plants.
The total is currently ~1 GtC/year of the ~10 GtC humans emit, based on the O2 and δ13C balances. The rest of the human emissions remain in the atmosphere (about halve the amount as mass, not as original molecules) or are absorbed by the oceans. Thus the increased forests area and temperature is good for a net removal of about 10% of the human releases, but that is growing…
The effects of higher CO2, aerial fertilization, have been found in many experiments and estimates made of the future impact. Last year Shevliakova et al. provided an estimate of the past net reduction in CO2 from past increased biosphere activity. They “estimate that enhanced vegetation growth has lowered the historical atmospheric CO2 concentration by 85 ppm, avoiding an additional 0.31 ± 0.06 °C warming.”
Historical warming reduced due to enhanced land carbon uptake
http://www.pnas.org/content/110/42/16730.full
Seems to me that many are ignorant of the process of photosynthesis: it is a photo-chemical reaction which occurs in the chloroplasts of all green plants whereby carbohydrate is synthesised from water and carbon dioxide and as well it provides oxygen as a by-product. The rate of reaction will increase with increased temperature, light intensity and availability of substrate; it’s normal chemistry and greenhouse growers have been using additional light, temperature and carbon dioxide enrichment for a very longtime to increase crop yields.
Animals do not synthesise carbohydrate and are totally dependent on trees, plants, algae for their energy source and without it would slowly die off. It’s obviously more complex with bio-pathways such as the Krebs cycle, but carbon dioxide is the basic building block of life itself, so what do we do demonise it and tax it if we can.
If there are direct measures of atmospheric CO2 concentrations (obviously there are), and if these measurements are reasonably accurate, then a discovery of 16% more utilization by plants than previously calculated/believed only means that CO2 delivery into the atmosphere (from whatever sources) is 16% higher than previously believed. Because of plant utilization, that additional 16% does not stay in the atmosphere long enough to be measured.
A discovery that more CO2 has long been used somewhere/somehow, or absorbed into anything, or bled into another universe, can’t effect the actual amount in the atmosphere that has been measured. The abstract states that this 16% seems to answer the question of why the amount measured in the atmosphere all these years has been less than some theories predicted should in the atmosphere.
That WUWT post says:
WUWT – 29 Sept 2010
[Press Release]
The global uptake of carbon by land plants may be up to 45 per cent more than previously thought. This is the conclusion of an international team of scientists, based on the variability of heavy oxygen atoms in the carbon dioxide of the atmosphere driven by the El Niño effect. As the oxygen atoms in carbon dioxide were converted faster than expected during the El Niño years, current estimates for the uptake of carbon by plants are probably too low. These should be corrected upwards, say the researchers in the current issue of the scientific journal NATURE. Instead of 120 petagrams of carbon, the annual global vegetation uptake probably lies between 150 and 175 petagrams of carbon…..
The now published study was carried out under the direction of Ralph F. Keeling, a professor of oceanography and the son of the late Charles David Keeling, after whom the so-called Keeling curve was named….
Reblogged this on gottadobetterthanthis and commented:
–
Quite significant. “This increase represents a 16% correction, which is large enough to explain the persistent overestimation of growth rates of historical atmospheric CO2 by Earth system models. Without this correction, the CFE for global GPP is underestimated by 0.05 PgC/y/ppm. This finding implies that the contemporary terrestrial biosphere is more CO2 limited than previously thought.”
It seems to me the take-away is that we are only beginning to have enough CO2 in the air for the plants. As the plants optimize to the slightly more plentiful plant food, they will increase their uptake even more.
It is worthwhile to keep in mind that while rates of burning have been ever increasing for decades, the CO2 concentration has been growing approximately linearly. While we have been tracking CO2, it grows steady, but the amount of CO2 we humans are adding goes up faster every year. It sure seems the plans are screaming, “THANK YOU!”
Especially in the last 10-15 years as China has brought 1 coal fired electric plant online every month on average. Of the 2300 power stations in the world China now has 650 of them (multiple units per station).
No signs of slowing down even with the 3 gorges damn coming online they are still building more coal plants and investing in LFTR and other nuclear technologies.
Given the massive increase in emissions over that time period the linear nature of CO2 increases means the sinks are underweighted.
If plants are removing more CO2 from that atmosphere than previously thought, then the relationship between future emissions and CO2 forcing would have necessarily been overestimated. I am not sure that this is the whole story. The following quote is a comment from me on a 2010 thread discussing the location of Trenberth’s missing heat”.
” If total biomass is growing it could explain the location of the missing heat, as photosynthesis is an endothermic reaction. The heat would literally be hiding in the woods.”
Would the heat used in in photosynthesis of the “extra” CO2 absorbed be non-existent, trivial or something that should be quantified and categorized as a consequential (as opposed to direct) negative feedback ?
” If total biomass is growing it could explain the location of the missing heat, as photosynthesis is an endothermic reaction. The heat would literally be hiding in the woods.”
Good observation. I recall from one of Murry Salby’s lectures that about half of anthropic CO2 emissions are absorbed by sinks. If a substantial portion of that is photosynthesis, we could be having a lot of solar energy stored in plants. And there is evidence of increased plant growth globally, including unlikely places such as the Sahel. Jimbo has linked to numerous relevant articles on this site over time.
Greening biosphere abstracts.
Also
July 2013
Deserts ‘greening’ from rising CO2
Increased levels of carbon dioxide (CO2) have helped boost green foliage across the world’s arid regions over the past 30 years through a process called CO2 fertilisation, according to CSIRO research….
If elevated CO2 causes the water use of individual leaves to drop, plants in arid environments will respond by increasing their total numbers of leaves. These changes in leaf cover can be detected by satellite, particularly in deserts and savannas where the cover is less complete than in wet locations, according to Dr Donohue…..
The energy absorbed during photosynthesis would mostly be released when the plants are eaten, whether by microbes or larger animals. Additional release occurs when wood is burned for heat or cooking. Much of all types of release happens over the following winter. Thus, much heat sequestered by photosynthesis during the growing season would be returned to the atmosphere over the following winter, resulting in a moderating effect upon seasonal variation. (Lingering heat sequestration would occur within woody structures persisting over multiple seasons, but would ultimately be released following death of the plant.)
Hasn’t increased average global temperatures during the last century largely been noted to be due to less cold winters? So, increasing atmospheric CO2 levels could be contributing to increased world average temperature not by being a GHG, but by being plant food.
SR
Reblogged this on JunkScience.com and commented:
Clouds, aerosols, forcing and now CO2 uptake that the models seem to have trouble with.
Greening is not just a reducer of CO2 in the atmosphere. What about the fact that the greening is an endothermic (takes energy out of the air) reaction? This is a double negative feedback. First, CO2 emissions are reduced by the process and the greening will itself have a linear temperature reduction affect to subtract from it further. Anyone got a calculation of the endothermic effect? I’ve never seen this talked about in connection with CAGW projections. Comon’ botanists, surely there are some out there that are not in CAGW bondage.
It seems to me that the energy would be about as much as the energy that would be released in the oxidation of an equivalent amount of carbon, plus the energy released in the oxidation of the amount of hydrogen reduced in the process. The really difficult question would address the relationship between the amount heat so removed since 1950 and the difference between current temperatures and the temperatures that we would be experiencing currently without the “extra” heat sequestration resulting from the “extra” endothermic photosynthesis. God knows this. I suspect no one else does.
Also, an interesting phenomenon in the life cycle of climate science is emerging. More and more papers are coming out eschewing the alarm and fewer and fewer alarmist papers are coming out (All in Australia? as they battle their defunding – which ironically underscores the political science that it had become). I wondered how this CAGW would all end. It will like covering a linoleum floor with a new layer of linoleum.
They’re not the only ones Chris. Article and map available at wiki http://en.wikipedia.org/wiki/Right-_and_left-hand_traffic
Apparently, so did the ancient Greeks, Egyptians, and Romans. [What did the Romans ever do for us…. 🙂 ]
Of course it won’t make a difference in “global warming.” With 24 years of deductive reasoning under my belt as a chemist, I already knew that! And predicted all this in my novel GOING GREEN: http://chrisskates.com/novel-becomes-energy-crystal-ball/
The marine organisms have plenty of CO2 (in form of -bi-carbonates) available for them: CO2 is not a limiting factor for photosynthesis in the oceans. Trace elements like iron are the main limiting factor: there is abundant life where deep ocean upwelling brings a lot of trace elements to the surface…
Thus while more CO2 has its measurable influence on land plants, it hardly changes the uptake by sea plants.
ferdberple, October 14, 2014 at 6:04 am
[…] “Which suggests that:
1. CO2 is not well mixed” […]
====================
Ferdinand Engelbeen, October 14, 2014 at 11:45 am
“ferdberple,
About your points:
1. A maximum of +/- 2% of full scale difference between any two stations anywhere in the world, where about 20% of all CO2 is exchanged with other reservoirs in halve a year each direction, I call that well mixed. If you have a different definition for “well mixed”, I like to hear that” […]
=====
Ferdinand,
Do I have this right…
You don’t like stomatal density as as a proxy for past concentrations of CO2 because CO2 isn’t well mixed in the areas where plants grow.
But you like ice cores because CO2 is well-mixed in the places where ice grows.
?
Khwarizmi ,
For 95% of the atmosphere CO2 is well mixed. It is not well mixed in the first few hundred meters over land, where a lot of (mostly natural) sources and sinks are at work. That is where land plants grow and thus the stomata index (SI) data are biased by the local/regional CO2 levels which are influenced by sinks and sources in the main wind direction.
One can remove the bias by calibrating the SI data against ice cores, firn and direct CO2 measurements over the past century, but there is no guarantee that the local/regional bias didn’t change over the previous centuries due to landscape changes and even the main wind direction might have changed during certain periods (LIA vs. MWP).
See the difference in local CO2 levels (with nightly inversion) of Giessen (semi-rural), mid-west Germany and the same days at a few official stations, all raw, uncorrected data:
http://www.ferdinand-engelbeen.be/klimaat/klim_img/giessen_background.jpg
Even the average of the Giessen data is about 40 ppmv higher than the “background” data and the monthly averages are wildly variable.
There is hardly any CO2 variability in Antarctica, where most ice cores were drilled and very few CO2 sources and sinks are interfering. Only a continuous growth of CO2 levels is measured there.
Thus indeed, SI data are good indications of rapid changes, thanks to their better resolution, but their absolute CO2 levels must be taken with a grain of salt…
However, who cares if they underestimate CO2 absorption by plants. Co2 cannot do what they say, so this is more of an agricultural observation for the crop growers.
NO gas at any concentration in the atmosphere can warm the climate. During a sunny day, CO2 and water vapor are saturated with IR radiation and the absorption and emissions of IR are a wash, having no effect.
BUT, at night these gases are radiative gases, effectively converting atmospheric heat energy to IR radiation which is lost to space. This is why the air chills so rapidly when the Sun sets and why breezes pick up so rapidly on a partly cloudy day, as the air in shadows cools so rapidly that it creates small high pressure zones that then blow outward.
The are RADIATIVE gases and there is no such thing as a greenhouse gas.
I believed initially the AGW theory as it made some sense. The data seemed to back it. However, even then I totally disagreed with the prognosis that things would get worse as a result. Factually, 7 times more people die for a 1C change in temperature down than up. Therefore increasing 2C would produce a lot of saved lives not dead people. It would save lives. That’s only from the causes of pneumonia and other diseases and problems associated with colder weather. The fact is that negatives associated with warming temperatures are extremely cheap. For instance, France had 15,000 deaths from a heat wave 15 years ago. The next year there was a similar heat wave (even hotter) and 10 people died. Simple measures like drinking more water, having a fan or going to an air conditioned building occasionally, checking on relatives almost 100% eliminated deaths. The cures for deaths from colder temps are not nearly as easy to mitigate. Further as many of you are quite aware this 16% less change in CO2 than expected is clearly a result of increased biotic plant life. A LOT MORE PLANT LIFE. To generate that kind of CO2 absorbtion there must be a lot more plants. With more plants generally comes more animals. NASA satellites show a 50% increase in biotic life on the planet in the last 40 years. Measuring specific frequencies that plants absorb they are able to calculate overall the increase in plant life. This is in stark contrast to what we hear that the planet is dying. Quite the contrary all scientific evidence contradicts this. Some particular plants or animals may be suffering but one must consider the natural extinction and species introduction rates. There are 37 million species of all living things on the earth estimated. We don’t know what the natural number that die or are created every year. Therefore it is impossible to calculate an extinction rate that is abnormal or bad. It is not clear what is bad or good. How do you make judgement calls on nature? If we assume everything that man does must be bad then we still don’t know if the numbers have changed much or if any groups are changing much. Previous theories of extinction have proven 10-100 times too scary. It seems like AGW is probably about 5-10 times too scary than reality.
The temperature 5000 years ago called the climactic optimum was several degrees warmer by every estimate including AGW adherents. During this time human kind found enough plants that were able to be grown and produce food that several populations of humans around the world simultaneously established civilization and became agricultural allowing man to climb out of our hunter gatherer nomadic existence, allow specialization and civilization. It therefore seems unproven that 2 C rise is necessarily associated with negative environmental consequences. Descriptions of life at that time seem to have the nile river twice as big for instance. Predictions of droughts, massive storms don’t aren’t consistent with this. I would like to understand why the earth will react differently than it did 5,000 years ago?
Lastly, the earth over the last 300 or so years has been rising in temperature and even longer we know since the last ice age. So far every degree change that is upward has been associated with increasing human success and improvement of life. I don’t know if we can say the same for animals but our prosperity I would argue is helpful to animals as we are more enlightened and richer to help them and there is evidence that the environment and our treatment of all animals and plants increases beneficially as wealth increases. As a mathemetician, physicist there is no reason to believe that this next degree or two suddenly are bad. For that to be the case it means we are currently at the optimal temperature of the earth now. Probabilistically I am skeptical of statements that say our current situation is perfect and any variation up or down would be bad. I find that unlikely just on the face of it. No proof has been given or significant evidence that we happen to live at the “perfect” temperature.
Change produces negative and positive consequences. The probability that when studying the change the results are all negative is unbelievable. When the motivation of the authors of studies is to create alarm or their belief is that there is cause for alarm there is a virtual certainty they will find only negatives. This is the case and requires a skeptical mind to studies which show only negative or largely negative consequences. I simply don’t believe them. I wouldn’t vote a penny for any of these people to have additional funds to study things based on the quality of research we are seeing. I think we should fire the whole bunch and get a new batch of scientists to study this without an axe to grind and a objective skeptical opinion which is the “default” best position any scientist should take.
I am pretty sure any logical, scientific person would not believe the AGW theory nor the idea of negative consequences and that is why I engage scientists whenever I can to discover if they truly believe this stuff. So far I have not found many scientists who have an opinion or willing to defend an opinion. I took a global warming class at stanford and there was not any proof given for any large or catastrophic change in climate, the world or anything. All that could be explained in those weeks was some basic physics about co2 absorption and a few “facts” about this or that. No solid “science” was offered that could show any significant climate change. The professors were frustrated with my questions and they tried to change lectures to counter my points but none of them was curageous enough or capable of showing anything “provable” or even roughly like a proof that temps would climb 2-3C. No attempt was made to replicate Hansens paleontological analysis which I find extremely flawed and they must also because they didn’t even bother to try and use it. The models were clearly unprovable and consisted of unsupported unproven conjectures with high levels of errors built in. The head of Lawrence livermore climate modeling said in fact the models were bad and didn’t predict. When the class looked stunned he repeated his statement. They were bad. They didn’t work. He admitted the idea of averaging models had no statistical basis that made any sense.
Overall this whole thing is very upsetting in terms of what it means about science and science funding and science debate in the US.
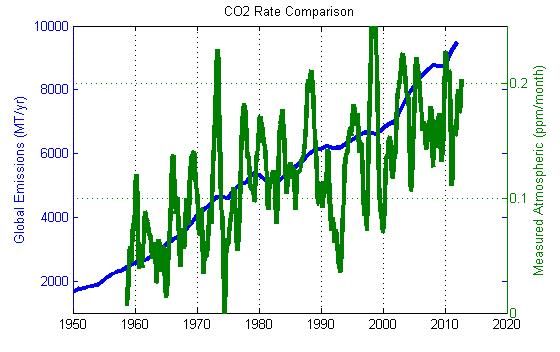
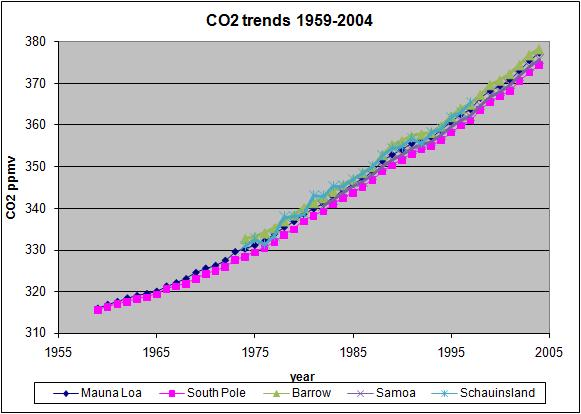
Global climate models have underestimated the amount of CO2 being absorbed by plants, according to new research.
Scientists say that between 1901 and 2010, living things absorbed 16% more of the gas than previously thought.
The authors say it explains why models consistently overestimated the growth rate of carbon in the atmosphere.
But experts believe the new calculation is unlikely to make a difference to global warming predictions.
The research has been published in the journal, Proceedings of the National Academy of Sciences.
Working out the amount of carbon dioxide that lingers in the atmosphere is critical to estimating the future impacts of global warming on temperatures.
Source: http://www.bbc.co.uk/news/science-environment-29601644
Understanding and accurately predicting how global terrestrial primary production responds to rising atmospheric CO2 concentrations is a prerequisite for reliably assessing the long-term climate impact of anthropogenic fossil CO2 emissions. Here we demonstrate that current carbon cycle models underestimate the long-term responsiveness of global terrestrial productivity to CO2 fertilization. This underestimation of CO2 fertilization is caused by an inherent model structural deficiency related to lack of explicit representation of CO2 diffusion inside leaves, which results in an overestimation of CO2 available at the carboxylation site. The magnitude of CO2 fertilization underestimation matches the long-term positive growth bias in the historical atmospheric CO2 predicted by Earth system models. Our study will lead to improved understanding and modeling of carbon–climate feedbacks.
The research has been published in the journal, Proceedings of the National Academy of Sciences.
Impact of mesophyll diffusion on estimated global land CO2 fertilization
Abstract
In C3 plants, CO2 concentrations drop considerably along mesophyll diffusion pathways from substomatal cavities to chloroplasts where CO2 assimilation occurs. Global carbon cycle models have not explicitly represented this internal drawdown and therefore overestimate CO2 available for carboxylation and underestimate photosynthetic responsiveness to atmospheric CO2. An explicit consideration of mesophyll diffusion increases the modeled cumulative CO2 fertilization effect (CFE) for global gross primary production (GPP) from 915 to 1,057 PgC for the period of 1901–2010. This increase represents a 16% correction, which is large enough to explain the persistent overestimation of growth rates of historical atmospheric CO2 by Earth system models. Without this correction, the CFE for global GPP is underestimated by 0.05 PgC/y/ppm. This finding implies that the contemporary terrestrial biosphere is more CO2 limited than previously thought.
Source: http://www.pnas.org/content/early/2014/10/10/1418075111
h/t to WUWT reader PhilW