Richard Betts heads the Climate Impacts area of the UK Met Office. The first bullet point on his webpage under areas of expertise describes his work as a climate modeler. He was one of the lead authors of the IPCC’s 5th Assessment Report (WG2). On a recent thread at Andrew Montford’s BishopHill blog, Dr. Betts left a remarkable comment that downplayed the importance of climate models.
Dr. Betts originally left the Aug 22, 2014 at 5:38 PM comment on the It’s the Atlantic wot dunnit thread. Andrew found the comment so noteworthy he wrote a post about it. See the BishopHill post GCMs and public policy. In response to Andrew’s statement, “Once again this brings us back to the thorny question of whether a GCM is a suitable tool to inform public policy,” Richard Betts wrote:
Bish, as always I am slightly bemused over why you think GCMs are so central to climate policy.
Everyone* agrees that the greenhouse effect is real, and that CO2 is a greenhouse gas. Everyone* agrees that CO2 rise is anthropogenic Everyone** agrees that we can’t predict the long-term response of the climate to ongoing CO2 rise with great accuracy. It could be large, it could be small. We don’t know. The old-style energy balance models got us this far. We can’t be certain of large changes in future, but can’t rule them out either. So climate mitigation policy is a political judgement based on what policymakers think carries the greater risk in the future – decarbonising or not decarbonising.
A primary aim of developing GCMs these days is to improve forecasts of regional climate on nearer-term timescales (seasons, year and a couple of decades) in order to inform contingency planning and adaptation (and also simply to increase understanding of the climate system by seeing how well forecasts based on current understanding stack up against observations, and then futher refining the models). Clearly, contingency planning and adaptation need to be done in the face of large uncertainty.
*OK so not quite everyone, but everyone who has thought about it to any reasonable extent
**Apart from a few who think that observations of a decade or three of small forcing can be extrapolated to indicate the response to long-term larger forcing with confidence
As noted earlier, it appears extremely odd that a climate modeler is downplaying the role of—the need for—his products.
“…WE CAN’T PREDICT LONG-TERM RESPONSE OF THE CLIMATE TO ONGOING CO2 RISE WITH GREAT ACCURACY”
Unfortunately, policy decisions by politicians around the globe have been and are being based on the predictions of assumed future catastrophes generated within the number-crunched worlds of climate models. Without those climate models, there are no foundations for policy decisions.
“…CLIMATE MITIGATION POLICY IS A POLITICAL JUDGEMENT BASED ON WHAT POLICYMAKERS THINK CARRIES THE GREATER RISK IN THE FUTURE – DECARBONISING OR NOT DECARBONISING”
But policymakers—and more importantly the public who elect the policymakers—have not been truly made aware that there is great uncertainty in the computer-created assumptions of future risk. Remarkably, we now find a lead author of the IPCC stating (my boldface):
… we can’t predict the long-term response of the climate to ongoing CO2 rise with great accuracy. It could be large, it could be small. We don’t know.
I don’t recall seeing the simple statement “We don’t know” anywhere in any IPCC report. Should “we don’t know” become the new theme of climate science, their mantra?
“THE OLD-STYLE ENERGY BALANCE MODELS GOT US THIS FAR”
Yet the latest and greatest climate models used by the IPCC for their 5th Assessment Report show no skill at being able to simulate past climate…even during the recent warming period since the mid-1970s. So the policymakers—and, more importantly, the public—have been misled or misinformed about the capabilities of climate models.
For much of the year 2013, we presented those model failings in dozens of blog posts, including as examples:
- Will their Failure to Properly Simulate Multidecadal Variations In Surface Temperatures Be the Downfall of the IPCC?
- Models Fail: Land versus Sea Surface Warming Rates
- Polar Amplification: Observations versus IPCC Climate Models
- Model-Data Comparison: Hemispheric Sea Ice Area
- Model-Data Precipitation Comparison: CMIP5 (IPCC AR5) Model Simulations versus Satellite-Era Observations
- Model-Data Comparison with Trend Maps: CMIP5 (IPCC AR5) Models vs New GISS Land-Ocean Temperature Index
In other words, the climate models presented in the IPCC’s 5th Assessment Report cannot simulate what many persons would consider the basics: surface temperatures, sea ice area and precipitation.
Shameless Plug: These and other model failings were presented in my ebook Climate Models Fail.
“APART FROM A FEW WHO THINK THAT OBSERVATIONS OF A DECADE OR THREE OF SMALL FORCING CAN BE EXTRAPOLATED TO INDICATE THE RESPONSE TO LONG-TERM LARGER FORCING WITH CONFIDENCE”
A few? In effect, that’s all the climate models used by the IPCC do with respect to surface temperatures. Figure 1 shows the annual GISS Land-Ocean Temperature Index data and linear trend (warming rate), for the Northern Hemisphere, from 1975 to 2000, a period to which climate models are tuned. The linear trend of the data has also been extrapolated until 2100. Also shown in the graph is the multi-model ensemble member mean (the average of all of the individual climate model runs) of the simulations of Northern Hemisphere surface temperature anomalies for the climate models stored in the CMIP5 archive. The CMIP5 archive was used by the IPCC for their 5th Assessment Report.

Figure 1
The model simulations of 21st Century surface temperature anomalies and their trends have been broken down into thirds to show that there was little increase in the expected warming rate through two-thirds of the 21st Century with the constantly increasing forcings. In other words, the models simply follow the extrapolated data trend through about 2066, in response to the increased forcings. See Figure 2 for the forcings.
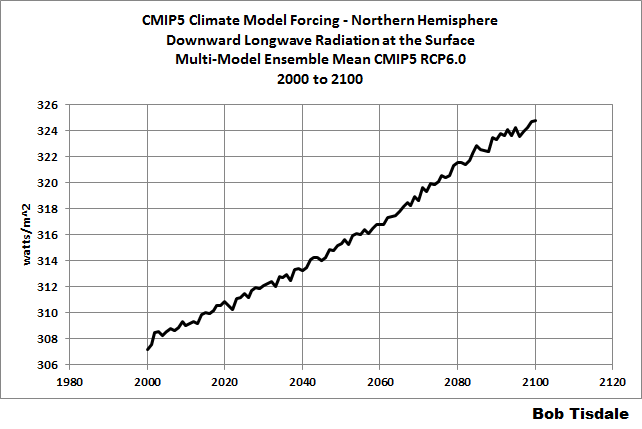
Figure 2
So, Dr. Betts’s “a few” appears to, in reality, be the consensus of the climate science community…the central tendency of mainstream thinking about climate dynamics…the groupthink.
And the problem with the groupthink was that the climate science community tuned their models to a naturally occurring upswing in surface temperatures. See Figure 3.

Figure 3
Should the modelers have anticipated another cycle or two when making their pre-programmed prognostications of the future? Of course they should have. The models are out of phase with reality.
But why didn’t they tune their models to the long-term trend? If they had tuned their models to the long-term trend, there’s nothing alarming about a 0.07 deg C warming rate in Northern Hemisphere surface temperatures. Nothing alarming at all.
A NOTE
You may be wondering why I focused on Northern Hemisphere surface temperatures. Well, it’s well known that climate models can’t simulate the warming that took place in the Southern Hemisphere during the recent warming period. See Figure 4. The models almost double the warming that took place there since 1975.

Figure 4
CLOSING
Dr. Betts noted:
A primary aim of developing GCMs these days is to improve forecasts of regional climate on nearer-term timescales (seasons, year and a couple of decades) in order to inform contingency planning and adaptation (and also simply to increase understanding of the climate system by seeing how well forecasts based on current understanding stack up against observations, and then futher refining the models).
In order for the climate science community to create forecasts of regional climate on decadal timescales, the models will first have to be able to simulate coupled ocean-atmosphere processes. Unfortunately, with their politically driven focus on CO2, they are no closer now at being able to simulate those processes than they were two decades ago.
SOURCE
The GISS LOTI data and the climate model outputs are available through the KNMI Climate Explorer.
Really? Somebody really ought to let the alarmists know that, I think they missed the memo.
the hypocrisy in the assertion about GCM’s is that if they were working the climate crisis community would be promoting their accuracy on a continuous loop.
Looks like blatantly disingenuous blameshifting on Betts’ part.
It’s his job to just churn out numbers that his boss wants. He’s just following orders, he’s not responsible for what those numbers are used for. It’s crappy data, but it’s none of his business what happens after he prepares his reports.
AnonyMoose
August 26, 2014 at 9:53 am It’s crappy data, but it’s none of his business what happens after he prepares his reports.
“Once the rockets are up
who cares where they come down
that’s not my department,”
says Wernher von Braun.
“We don’t know what we’re doing,,, but give us a couple of trillion dollars and let us wreck the world economies anyway!!”
“**Apart from a few who think that observations of a decade or three of small forcing can be extrapolated to indicate the response to long-term larger forcing with confidence”
Wait. Isn’t that exactly what is done by those hundreds of peer-reviewed papers that predict extinctions, sea ice free North pole, plagues, droughts, flood, famines, super storms, etc., etc.? Don’t all the peer reviewers agree? So they are all wrong?
About time a modeler admitted it. I look forward to a wave of retracted papers.
I met Dr Betts at a recent climate conference at Exeter university. It included many of the great and the good of the climate world including Thomas stocker.
I was impressed by dr Betts himself and his openness and his uncertainty of the past climate as well as the future climate.
I wrote at the time that he was more sceptical than I had expected and I would class him much more as a lukewarmer than an alarmist. Of the two or three scientists I know at the Met office there are none I would class an an out and out alarmist although the head of the Met office and Julia slingo I would put in a different and more politically motivated category.
Tonyb
Despite advertising himself foremost as a modeler, Betts was a lead author on AR5 WG2, not 1. Maybe he did not read WG1 chapter 9, wherein is said that “there continues to be very high confidence that models reproduce observed large scale mean surface temperature patterns.”
Except they didn’t, as the ‘pause’ continues to illustrate.
The bigger stunner is the admission that most of this is politics rather than ‘science’.
Dr. Betts must be one of the 3% of scientists that don’t agree with the consensus – I wondered where they were hiding.
The SS CAGW is sinking. Betts is getting cold, wet feet and looking for a reputational lifeboat. This post clearly shows he has no intention of participating in any more IPCC activities.
The socio-political drive, coupled with a PC interpretation of the Uncertainty Principle, is beautifully expressed in Betts’ comments. There is nothing per se wrong with what he says or supports – as long as you are as upfront with your social engineering purpose as he was. The problem is that the regulating class and the eco-green are not upfront with what they push. They want us to do what we would not want to do if we understood what was going on.
But ever since the WMD “cause” of the Iraq-Coalition War, I get the story: our Governors decide, and the rest of us better get on board or be marginalized.
America was created by those who wished to live their lives and make their decisions as made sense. Not just to them, but on a basic level. We have abandoned the founding concepts of not simply doing as we are told, and why? because when power and money speak, the interests of those others is more important than the interests of those of us who simply work and support families.
On the basis of many arguments on Bishop Hill; Richard knows full well that not everybody agrees that the Greenhouse effect is real; the operative word being ‘IS’.
Some of us believe that the effect is already played out and Richard knows that.
Technically this rationalization could qualify for a place on the list of ‘where is the missing heat?’. Dr. Betts’ excuse is basically that the models don’t count anyhow.
“Bish, as always I am slightly bemused over why you think GCMs are so central to climate policy.”
If the GCMs are not to be taken seriously, what’s left of AR5? It had no new physical evidence of any significance. And the first two sentences of his second paragraph are pure drivel. The earth is NOT a greenhouse, and CO2 is a trace gas essentially at saturation effect.
“The old-style enegy balance models got us this far.”
These would be the ones with all of Trenberth’s “missing heat”, that somehow in defiance of thermodynamics transfers itself to the bottom of the oceans without being detected on the way?
Dr. Betts frequently appears on Bishop Hill and is mostly welcomed there for his willingness to engage in a civilized manner. He’s really in a class by himself and shouldn’t be compared to run-of-the-mill AGW advocates. I think he may be closer to Judith Curry in outlook than anyone else who quickly comes to mind, though he operates under a different set of constraints.
“Everyone [who has thought about it to any reasonable extent] agrees that CO2 rise is anthropogenic.”
Define reasonable. I’ve thought about it considerably and don’t agree that all or even most CO2 rise is necessarily anthropogenic. The oceans’ ability to hold CO2 drops with increasing temperature, and those temperatures have risen since the end of the Little Ice Age. Furthermore, I believe volcanic CO2 emissions have been underestimated by at least one order of magnitude, possibly two.
No.
If you cannot be certain of large changes in the future, nor rule them out, if as you say” “It could be large, it could be small. We don’t know”, then you are in the state known as “ignorance” about climate. So, climate mitigation policy is a poitical judgement based on what policy makers want, irrespective of anything to do with climate whatsoever. Climate mitigation policy is just a surrogate, an excuse, a propaganda tool, for advancing the pre-existing left wing political agenda.
It has always been thus.
Sorry far to late , they spent years telling us that GCMs are unquestionable gods who can never be wrong and who have amazing powers of prediction. And anyone who said otherwise has been attacked and smeared .
Now we are just supposed to accept that GCMs do not matter , well given that is virtual all they got what are their actual claims based on then ?
“Once the rockets are up, who cares where they come down? That’s not my department,” says Wernher von Braun.
h/t Tom Lehrer
I did not see that you had posted that when I posted essentially the same comment somewhere above. Great minds think alike?
Martin
I hear tell that the 40-year trend in Antarctic sea ice increase is not very important too. I know this because a person who firmly believes in AGW told me so. So there!
This really ticks me off.
The missing part.
OK so Betts says,
“Everyone agrees that the greenhouse effect is real,
that CO2 is a greenhouse gas.
that CO2 rise is anthropogenic
that we can’t predict the long-term response of the climate to ongoing CO2 rise
We don’t know.”
He left out the most important part. Which leads me to believe they do not want to talk about it.
What matters and what’s missing in Betts’ little sermon is the proportion or percentage of the greenhouse effect (and climate) that can be attributed to human influence.
Betts must have some idea. Does he agree with this?
http://www.geocraft.com/WVFossils/greenhouse_data.html
“Water vapor, responsible for 95% of Earth’s greenhouse effect, is 99.999% natural (some argue, 100%). Even if we wanted to we can do nothing to change this.
Anthropogenic (man-made) CO2 contributions cause only about 0.117% of Earth’s greenhouse effect, (factoring in water vapor). This is insignificant!
Adding up all anthropogenic greenhouse sources, the total human contribution to the greenhouse effect is around 0.28% (factoring in water vapor).”
Is that why Betts makes no mention of what proportion he attributes to anthropogenic influence?
Does everyone now (quietly) agree that the human contribution to the greenhouse effect is really around .28%?
Or is the Team conveniently uninterested?
There must be some reason Betts et all never talk about the human percentage and proportionate role in the greenhouse effect. What is the answer?
I seems to me that the ONLY aim of the current/developing GCMs these days is to gin up hypothetical climate scenarios to justify funding busy work for the massive government planning sector that involves a greater arena of academia, NGOs, private consulting firms, every eco missions and alternative energy/tax schemes for all.
IPCC AR5 TS.6 is loaded down with “We don’t knows.”
As predicted this will be a slow retreat.The retreat is definitely occurring now but it will take perhaps another 2 years for its complete demise. Sorry guys, it will just fade away. There will be no great stories such as “DR Mxxx has been arrested in his office caught with his hands in da cookie jar”.LOL
You don’t need lots of computer models to extrapolate the data (but it helps to convince the politicians if you have used high tech computer models)..
In Australia after the BOM fiasco, people responsible for the fraud in BOM will just be moved sidewards or retired
Rud Istvan August 26, 2014 at 10:05 am
The bigger stunner is the admission that most of this is politics rather than ‘science’
====================================================================
Not even politics. CAGW and the politics thereof are simple one of – perhaps the major one – a number of battlegrounds within a larger war of culture and ideology. Free thinking versus group think might be ONE way to characterise this war.
If you have time, this article, and (102 page, but worth it) PDF are worth reading with regard to what I write above – they look at CAGW as a meme.
http://wearenarrative.wordpress.com/2013/10/27/the-cagw-memeplex-a-cultural-creature/
http://wearenarrative.files.wordpress.com/2013/10/cagw-memeplex-us-rev11.pdf
I’m 95% confident that they don’t know what their doing.
Without the models, they have nothing. Now one of the high priests is saying that the models are basically worthless. It’s dead, Jim.
So, Richard Betts being one of the lead authors of AR5, must have been aware of the following declaration by Thomas Stocker in a widely broadcasted video at the AR5 Summary For Policymakers in September 2013:
http://www.bbc.co.uk/news/science-environment-24292615
At 1:30 Stocker shows a graph (SPM 10) with modelled carbon emmisions vs temp out to 2100. He clearly states that this graph has been adopted “by governments through the IPCC process” and that there is a clear relationship between emmisions and temperature. This was the main graph shown to the world via their media conference on the day the SPM was released.
Stocker was stating unequivocally that:
a) these temperature/emmisions model outputs were rock solid evidence out to 2100, and
b) that governments had already acted to heed that information via their input into the SPM drafting process.
That puts modelled data to 2100 as the prime impetus for all government policy on global warming from the date of this video, henceforth.
(Of course, Stocker didn’t use the word, “model” in relation to this graph, making its apparent authority all the more impressive)
Sounds like the “precautionary principle” is in force. We don’t know if there will be a problem, but their might be one, so we must act.
Yup, that is their rationale. In reality of course if we don’t know what is happening, for all we know we could be preventing another ice age which might occur if we cut emissions. Their application of the precautionary principle is implicitly assuming they *do* know emissions are causing damaging warming despite their claims we should act “just in case”. In reality they are proposing action, when according to the precautionary principle no action should be taken unless it is proven to be harmless.
Of course in general the usually concept of a “precautionary principle” is nonsense since a change may be better than the status quo, the evidence for both the status quo and a change need to be factored in. The quality of the evidence and level of certainty needs to be factored in. If a crank came up with a theory that claimed if the public doesn’t stop drinking coffee and tea we will all be dead in 20 years, should we act just in case? In addition of course they pretend that action is innocuous without trading off the economic damage it can do. In addition of course principle needs to be factored in, whether with uncertain theories these people have a right to force us to go along.
Dr Betts is one of very few who is willing to engage in extended discussion with a sceptic, to admit to the uncertain state of climate science, the failings of models to model long range (or even short range over a few days) and to explain mechanics of the models themselves to a questioner.
Kudos to him on his honesty in the age of outright alarmist hyperbole.
I agree and he should be praised for his willingness to discuss the issues.
We will see more of this manuoevring in order to protect their government funded job and pension.
Let us not forget:
Dr Betts was one of many who remained silent when Al Gore gave us Inconvenient Truth. There was totally silence when the alarmism was at its height. They were silent when countries put forward pointless emission controls.
The Met Office continues with the CO2 meme and the extreme weather nonsense.
Julia Slingo has stated before that they could do better if they had more expensive computing. However, the models seem to have peaked at their most uselessness.
Should “we don’t know” become the new theme of climate science, their mantra?
Yes.
It’s funny, isn’t it, when these guys accidentally let the truth slip out? Where was Betts when climate policy was being debated? When people trot out GCM output as predictions of future climate and evidence we must do something now, why isn’t he speaking up?
Yes! I give him credit for engaging with the sceptical community but watching his work get used to such drastic effect without stepping up to clarify the uncertainty is a big strike against him. I’m sorry but you can’t divorce yourself from your work like that. The public pays for his work and if he thinks he can take our money producing this stuff and then sit on the couch while the results are used by politicians to worsen our lives, he has a twisted understanding of his place in this world. The fact that he is coming clean now about the uncertainty after the SFP does all the damage, represents in my view the selfish actions of someone looking out for number one. Perhaps it’s more complex but that is how it appears.
Or perhaps he just genuinely disagrees with sceptics but still wants to engage to challenge himself?
It is nice to think the best of people. And it confuses them on the internet.
“Everyone agrees that we can’t predict the long-term response of the climate to ongoing CO2 rise with great accuracy. It could be large, it could be small. We don’t know….We can’t be certain of large changes in future, but can’t rule them out either. So climate mitigation policy is a political judgement based on what policymakers think…”
Yes, as the facts continue to stack up against them, all that’s left is the Precautionary Principle, based entirely on “what policymakers think.” Now that’s one scary scenario!
Weaselling his way toward an exit?
Without the consensus of the average of the model outputs.
AKA Garbage in: Gospel Out.
The Cause has nothing.
There is no CAGW, no AGW, no need for the IPCC, nor these endless gabfests on the taxpayers dime.
But most sceptical people realized this quite early, about the same time we tried to make sense of the CAGW claims.
They said:”We have science”, But I could never find this elusive evidence.
They claimed the “Best Opinions”, I thought, Witchdoctors.
I read the IPCC reports, they said coulda,woulda, shoulda.. we have no clue, not measurements,but WE FEEL.
Then came those amazing “investigations” of Climategate.
Good enough for government I guess.
And I now know no one in my local government bothered to read the IPCC literature.
Just the Summary of talking points.
10 (last) years ago it was “it’s going to be large”, now they “can’t tell”, in 10 (1) more years it’ll be “never mind”.
IF the affect of CO2 was large, wouldn’t it be able to over power the other natural cycles?
Newly Retired Engineer
August 26, 2014 at 10:51 am Edit
Sounds like the “precautionary principle” is in force.
This goes back to Pascal’s Conundrum. The point being that mitigation to possible problems should be undertaken if the costs are negligible.
The costs are not negligible.
Therefore, the Precautionary Principle must yield to a sober cost/benefit analysis.
Seven, six, five, eleven, nine, and twenty-five, today,
Four, eleven, seventeen, thirty-two, the day before,
Boots, boots, boots, boots, moving up and down again;
There’s no discharge in the war.
Hi Bob and Anthony
Excellent post!
This text from Bishop Hill succinctly summarizes where we are with these multi-decadal climate models.[http://www.bishop-hill.net/blog/2014/8/24/gcms-and-public-policy.html]
“You can see that policymakers are getting a thoroughly biased picture of what GCMs can do and whether they are reliable or not. They are also getting a thoroughly biased picture of the cost of climate change based on the output of those GCMs. They are simply not being asked to consider the possibility that warming might be negligible or non-existent or that the models could be complete and utter junk. They are not told about the aerosol fudging or the GCMs’ ongoing failures.”
Roger Sr.
He’s saying, “We don’t know what’s going on – but let’s panic anyway!”
In the post on Bishop Hill, it reports on what Tim Palmer said
“Climate models are only flawed only if the basic principles of physics are, but they can be improved.”
Climate models are NOT basic physics models. Tim is incorrect. Except for a few effects; e.g. the pressure gradient forces, advection, gravity, ALL other physics, chemistry and biology are based on tuned parameterizations.
I discuss this separation of modeling components into these two parts in my book
.Pielke Sr, R.A., 2013: Mesoscale meteorological modeling. 3rd Edition, Academic Press, 760 pp. http://store.elsevier.com/Mesoscale-Meteorological-Modeling/Roger-A-Pielke-Sr/isbn-9780123852373/
in Chapters 7 and 8.
All parametrizations contain tuned coefficients and functions, usually based on a small subset of real world climate conditions.
If the climate and policy communities believe these models are fundamental physics, they are naive and being duped.
Very interesting. Thanks for enlightening me. I’ll be sure to buy your book.
John Robertson: I’ve always thought that climate change science is a bit like downtown Los Angeles. When you get there, there’s no there there.
“Weaseling towards and exit”. Excellent!
He is bemused. You silly deniers are just so childlike in your unsophisticated view of these matters, which are so obvious to us real scientists and our admirers.
‘It’s funny, isn’t it, when these guys accidentally let the truth slip out? Where was Betts when climate policy was being debated? When people trot out GCM output as predictions of future climate and evidence we must do something now, why isn’t he speaking up?’
————————————————————————————————————————————–
He does speak up, especially on twitter, this is a recent reply to me on Bishop Hills blog:
Lord Beaverbrook
I share your despair of the media. They are all as bad as each other, whether it’s the Guardian or the Daily Mail. They all have to shore up their end of the artificially-polarised debate.
Many of us who visit Bishop Hills blog have conversed with Dr Betts for years, he has my trust and respect and we may not always agree but he knows the science, and the IPCC.
Posts like this are a little disingenuous and put good people in awkward situations much the same way as those who wished to join the GWPF. Is this the intention of the post?
I accept the point you make about placing ‘good’ people in awkward positions; long term that may be to no one’s advantage.
However, I do not think that that is the intention of the post.
Most of us sceptics consider that the main problem with climate science is the certainty. The fact is that we do not know enough, and the data is so poor that it is very uncertain
It is the claims of certainty, rather than being honest and admitting that there are huge uncertainties and huge error margins, that so undermine claimate science, as a science.
It is good to see someone admit the truth, namely we do not know. And that should be published far and wide.
It’s agnorance.
Taphonomic August 26, 2014 at 9:56 am
“**Apart from a few who think that observations of a decade or three of small forcing can be extrapolated to indicate the response to long-term larger forcing with confidence”
Wait. Isn’t that exactly what is done by those hundreds of peer-reviewed papers that predict extinctions, sea ice free North pole, plagues, droughts, flood, famines, super storms, etc., etc.? Don’t all the peer reviewers agree? So they are all wrong?
Tap, I also thought of this and wrote up a boilerplate response, before reading the comments.
Instant resoponse to any modeled study utilizing climate models as data points.
Richard Betts, who heads the Climate Impacts area of the UK Met Office, claims his areas of expertise as a climate modeler and was one of the lead authors of the IPCC’s 5th Assessment Report (WG2). Says –
“Everyone (Apart from a few who think that observations of a decade or three of small forcing can be extrapolated to indicate the response to long-term larger forcing with confidence) agrees that we can’t predict the long-term response of the climate to ongoing CO2 rise with great accuracy. It could be large, it could be small. We don’t know. The old-style energy balance models got us this far. We can’t be certain of large changes in future, but can’t rule them out either.”
So your XXX study is based on “We Don’t Know.”
Bob – I don’t recall seeing the simple statement “We don’t know” anywhere in any IPCC report.
But they are 95 percent certain.
There is something about Betts.
The problem is that a heck of a lot of climate scientists remain silent rather than counter media hype.
Seems like an expert who works for the MET office like Mr Betts would be in a position to give a press release clarifying the innacuracies being put forth by offending journalists or media outlets. He can gently blame media but he has the power to change the situation like few of us have! Come on Mr Betts, time to do better.
So here we go with the “everyone agrees” and “reasonable” words. If I don’t agree with all you say I am not reasonable. Very similar to RGB’s rational wording.
There has been no evidence that CO2 can cause warming in the open atmosphere. In fact if you look at the ice core temperature vs. CO2 graph we see temperature goes up from the low before CO2 rises. And at the top temperature goes down before CO2 heads lower.
CO2 neither sufficient nor necessary for the temperature to change.
– – – – – – – – –
No, that is a mis-direction away from the problematic primary aim that has foundered on skeptical shores. The primary aim of the past 2+ decades of development of GCMs was to myopically emphasis / exaggerate an alarming basis for GAST increase concerns going all the way out to approx. the year 2100. That, in spite of what Betts says, remains the primary aim of current continuing efforts to develop GCMs by the IPCC centric advocates of the observationally unsubstantiated CAGW hypothesis.
Still, this whole dialog about Betts’ comment at the BH blog begs a question. Why is the main stream climate science focus predominately lacking in vigorous open and transparent critical dialog / debate of the observationally unsubstantiated CAGW hypothesis?
In skeptical discussions it is popular to obliquely refer to political expediencies as the root answer to my above ‘why’ question. { below comment* by Tisdale is an example } It is insufficient as a root cause. I think to understand why then we need to look at the last 150 or 200 years of increasingly non-objective trends found in the history of the philosophy of science. Politics is at best just a secondary manifestation of the root cause found in the philosophy of science. It is too convenient for scientists to point to the community of politics and say ‘it was them’.
* Tisdale said in his closing remarks, “In order for the climate science community to create forecasts of regional climate on decadal timescales, the models will first have to be able to simulate coupled ocean-atmosphere processes. Unfortunately, with their politically driven focus on CO2, they are no closer now at being able to simulate those processes than they were two decades ago.”
John
Uncle Gus August 26, 2014 at 11:25 am
“He’s saying, “We don’t know what’s going on – but let’s panic anyway!”
Besides not knowing “what” is going on he’s also saying, “We don’t even know if there is something, anything going on to begin with”.
Let alone what it may, may not, could or otherwise be consistent with any of their foolish notions.
HOST: So, you have a testable theory of AGW, but now that you’ve told us it isn’t any model, what, then, is your testable theory?
ANNE ELK: Oh, what is my theory?
HOST: Yes. Your testable theory, if not any model.
ANNE ELK: Oh what is my theory, that it is. Yes, well you may well ask, what is my theory.
HOST: (slightly impatient) I am asking.
ANNE ELK: And well you may. Yes my word you may well ask what it is, this theory of mine. Well, this theory that I have–that is to say, which is mine, this theory which belongs to me is as follows. Ahem. Ahem. This is how it goes. Ahem. The next thing that I am about to say is my theory. Ahem….
O/T, but too bizarre to ignore:
Clearly, it wasn’t hard. She just pulled it out of thin air…
Can someone make sure Senator Inhofe sees this?
MarkW August 26, 2014 at 11:10 am
IF the affect of CO2 was large, wouldn’t it be able to over power the other natural cycles?
>>>>>>>>>>>>>>
You’ve hit the nail on the head. It wasn’t many years ago that skeptics were arguing that the warming we were seeing (at that time) was well within natural variability. The alarmists responded that natural variability couldn’t possibly be that high, and that what we were seeing was natural variability being overcome by CO2.
Now that they cannot explain the pause, the alarmists are arguing that it is being overcome by natural variability, but that the long term trend is still there. If we accept that, it means that the long term trend exhibits a sensitivity well below that of natural variability. A sensitivity that low, cannot be construed as alarming. Consider on top of that the logarithmic nature of CO2, and more becomes simply less alarming still.
The last card they have to play is regional variability where they will attempt to show lop sided results due to the over all changes being more concentrated in some areas versus others.
jorgekafkazar
The oceans’ ability to hold CO2 drops with increasing temperature, and those temperatures have risen since the end of the Little Ice Age.
The CO2 pressure (pCO2) to escape the oceans increases with 17 μatm/°C. That is fully compensated by an increase of ~17 ppm in the atmosphere. Including the opposite reaction of plants on increased temperatures, the average change was 8 ppmv/°C over the past 800,000 years. The MWP-LIA drop in temperature was good for some 6 ppmv drop in CO2.
Thus you need some 12.5°C temperature increase of the ocean’s surface to give the 100+ ppmv CO2 increase…
About volcanic: the largest volcanic event of the past century was the 1992 Pinatubo, with as result a drop in CO2 rate of change: the dust caused more CO2 uptake by cooling and light diffusion (= more photosynthesis) than it emitted…
Thanks to Bob Tisdale we learned of this, he’s great!
davidmhoffer has it exactly right, in my opinion,
The mere existence of “The Pause”, or cessation of change (warming) is a strong indicator of small climate sensitivity to CO2.
Betts has been coached by the slimy wordsmiths at the UKMet Off along with slygo and the “consistent with ” meme.
Ferdinand Engelbeen
August 26, 2014 at 12:13 pm
You keep coming up with these stupid figures. How in hell’s name did you measure global sea/atmosphere/land co² exchange rates as accurately as you quote?
Unfortunately, with their politically driven focus on CO2, they are no closer now at being able to simulate those processes than they were two decades ago.”
John
and $200billions.
A good example is Professor Richard Betts, a climate scientist………But rather than defensively pull up the drawbridge, he routinely posts explanatory comments on blogs that are hostile to climate science and engages in debates on Twitter with sceptics.
JIMBO
That’s just a rubbish statement. That is not what Betts does at all. He does what he has done in this example. Civil Service weasel words. I’ve been there, done it and have the t-shirt.
If the models are crap THEN STOP FUNDING THEM.
Betts can work at a McDonalds and play with his climate models on his computer at home.
Steve Oregon
August 26, 2014 at 10:27 am
Anthropogenic (man-made) CO2 contributions cause only about 0.117% of Earth’s greenhouse effect, (factoring in water vapor). This is insignificant!
A few remarks on this:
Water vapor rapidly decreases with height/temperature, while CO2 is rather evenly distributed up to 30 km. Once passed the lower atmosphere, water becomes less important and other GHGs more important for IR absorbance.
The absorption/re-emissions of CO2 in the infra-red is mainly in a band where water is not absorbing, thus additional to water. A doubling of CO2 gives some ~0.9°C temperature increase, all other conditions (water vapor, other GHGs, cloudiness) being equal, which of course is never the case.
Models include a lot of positive feedbacks which gives the wide IPCC range, while skeptics (including me) see mainly negative feedbacks on a water/clouds planet…
Here is one reason why Betts says: “It could be large, it could be small. We don’t know.”
He goes onto say: ” Clearly, contingency planning and adaptation need to be done in the face of large uncertainty.” No Dr. Betts, modelled failed projections is exactly why we should not take any drastic action. Sea walls, Dutch polders and winter coats were created before the alarm – we recognized that climate changes.
Props to him for being on the early side to admit the errors in the IPCC and CAGW position, even if they are obvious to some of us.
However, I’m not sure how much of this is just to put a toe in the contrarian bathtub so he can later say he was always saying this – see this blog post!
I find it monumentally disingenuous to make the statement that models suck at what they are being used to do, but only to do it after AR5 and on a blog comment. If he really believes this, he really should be writing a paper to correct the perception that “Models are King”. From his bio, it seems he has the clout to do so and get published. As far as I can tell, everyone*** believes the models are the best science available and a valuable tool for predicting long-term climate patterns. I find it extremely unlikely that he believes this view is widespread and an accurate reflection of what modeling is used for.
*** at least 97% of politicians/scientists/people
Ferdinand Engelbeen
August 26, 2014 at 12:36 pm
“Water vapor rapidly decreases with height/temperature, while CO2 is rather evenly distributed up to 30 km. Once passed the lower atmosphere, water becomes less important and other GHGs more important for IR absorbance.”
BUT, at lower pressures the probability for re-emission of absorbed IR photons – instead of thermalization – also becomes vastly more probable. Therefore there’s not much of a greenhouse effect anyway at low pressures.
Ferdinand Engelbeen
August 26, 2014 at 12:36 pm
But the average depth of the troposphere is ~17 km. in the middle latitudes, deeper in the tropics, up to 20 km., and shallower near the polar regions, down to ~7 km. in winter. Moreover, GASTA, the measure of “global warming”, applies to the lower troposphere, ie close to the surface.
Also, the IR absorption bands of CO2 & H2O do overlap quite a bit.
The models are addressed in AR5. The IPCC concludes that the models all failed to predict the pause. And they all failed on the warm side.
E.g. There is a systematic failure in the understanding of the climate represented by the models.
If I had a career based on a systematic failure I might claim it wasn’t an important failure too.
But in doing so I’d be claiming that they were never an important success.
And then there is nothing left.
Bish, as always I am slightly bemused over why you think GCMs are so central to climate policy.
I can speak only for myself, but Richard Bett’s openness (now and in the past) is very much appreciated. However, the opening line of his comment raises the questions if he too lives in some kind of alternate reality. What else could be more central to climate science turning policy, if not models?
Where does the idea come from, that it’s models all the way down?
Naomi Oreskes: Why we should trust scientists.
So one of the big questions to do with climate change, we have tremendous amounts of evidence that the Earth is warming up. This slide here, the black line shows the measurements that scientists have taken for the last 150 years showing that the Earth’s temperature has steadily increased, and you can see in particular that in the last 50 years there’s been this dramatic increase of nearly one degree centigrade, or almost two degrees Fahrenheit.
So what, though, is driving that change? How can we know what’s causing the observed warming? Well, scientists can model it using a computer simulation. So this diagram illustrates a computer simulation that has looked at all the different factors that we know can influence the Earth’s climate, so sulfate particles from air pollution, volcanic dust from volcanic eruptions, changes in solar radiation, and, of course, greenhouse gases. And they asked the question, what set of variables put into a model will reproduce what we actually see in real life? So here is the real life in black.
Here’s the model in this light gray, and the answer is a model that includes, it’s the answer E on that SAT, all of the above. The only way you can reproduce the observed temperature measurements is with all of these things put together, including greenhouse gases, and in particular you can see that the increase in greenhouse gases tracks this very dramatic increase in temperature over the last 50 years. And so this is why climate scientists say it’s not just that we know that climate change is happening, we know that greenhouse gases are a major part of the reason why.
http://www.ted.com/talks/naomi_oreskes_why_we_should_believe_in_science/transcript?language=en#t-649880
Matthew England:
There are people actually out there trying to say that the IPCC has overstated or overestimated climate change. This report shows very clearly that the projections have occurred.
And so anybody out there lying that the IPCC projections are overstatements or that the observations haven’t kept pace with the projections is completely offline with this. The analysis is very clear that the IPCC projections are coming true.
http://www.abc.net.au/am/content/2012/s3650773.htm
Deny no more, Richard.
“I can speak only for myself, but Richard Betts’ openness (now and in the past) is very much appreciated. ”
I agree here.
M Courtney
Please prepare for a shock.
Ready? OK. Here it comes.
I completely agree with your post at August 26, 2014 at 12:54 pm and write to draw attention to it.
Pater
I must be wrong then.
No. You are merely growing older. 🙂
Stephen Richards
August 26, 2014 at 12:30 pm
How in hell’s name did you measure global sea/atmosphere/land co² exchange rates as accurately as you quote?
Basic physics: seawater mixtures can be (and are) measured for CO2 pressure in equilibrium with the atmosphere. 1°C increase gives 17 ppmv more CO2 in the atmosphere at equilibrium. See:
http://www.ldeo.columbia.edu/res/pi/CO2/carbondioxide/text/LMG06_8_data_report.doc
with the full description of a ship’s measurements of pCO2(eq), including the methods and calculations at chapter 2 and especially 2e.
The dynamics of the exchange rates don’t change the equilibrium: no matter if the exchange rate is near zero or 40 GtC/year, at a certain moment the pCO2(oceans) and pCO2(atmosphere) will be in equilibrium for a given temperature, where the in and out fluxes will be equal. Here for 40 GtC/year and 1°C temperature increase:
http://www.ferdinand-engelbeen.be/klimaat/klim_img/upwelling_temp.jpg
Feely e.a. estimated the ocean-atmosphere fluxes, based on lots of ship’s surveys. The area weighted average pCO2 was 7 μatm higher in the atmosphere than in the ocean surface, thus the net CO2 flux is from the atmosphere into the ocean’s surface, not reverse:
http://www.pmel.noaa.gov/pubs/outstand/feel2331/exchange.shtml
Ferdinand Engelbeen
I write to provide an amendment to your post at August 26, 2014 at 1:09 pm.
You write
Ferdinand, as you and I have often discussed that should say;
Feely e.a. estimated the ocean-atmosphere fluxes, based on a completely inadequate number of ship’s surveys from a very inadequate spatial distribution.
Richard
M Courtney
August 26, 2014 at 12:54 pm
========
We have a winner…………….
“We can’t be certain of large changes in future, but can’t rule them out either. So climate mitigation policy is a political judgement based on what policymakers think carries the greater risk in the future – decarbonising or not decarbonising.”
There might be dragons coming to kill us, or there might not. We can’t prove a negative hypothesis that there are no dragons. So based on the risk of dragon attack, we should all remain underground until the risk has abated.
DirkH
August 26, 2014 at 12:45 pm
and
milodonharlani
August 26, 2014 at 12:47 pm
Not my best part of knowledge, but the 0.117% attributed to CO2 looked a bit underestimated.
The ~0.9°C extra increase is what is needed to restore the outgoing radiation for 2xCO2 (280 to 560 ppmv), according to Modtran for a “standard” 1976 atmosphere, looking down at 70 km height:
http://climatemodels.uchicago.edu/modtran/
Richard
You Agree with him completely?
I think your son might have made you redundant. As you go out of the door Please collect from the mods a small token of our appreciation for all the effort you have put in here over the years
Tonyb
richardscourtney
August 26, 2014 at 1:14 pm
Feely e.a. estimated the ocean-atmosphere fluxes, based on a completely inadequate number of ship’s surveys from a very inadequate spatial distribution.
Which doesn’t change the fact that the ocean’s warming of less that 1°C since the LIA can’t be responsible for the 100+ ppmv increase in the atmosphere. Except if Henry’s Law is not applicable anymore…
Moru H.
August 26, 2014 at 1:01 pm
“Naomi Oreskes: Why we should trust scientists.”
TED obviously has become PC crap. Rupert Sheldrake got invited by a TEDx event to speak about the limits of science and the anonymous PC-scientific council of TED raised a stink and called his talk pseudoscience – while he was explicitly talking about the LIMITS of the scientific method. The video then got shoved into a naughty corner of the TED website so it’s not quite censored but nearly.
OTOH, Oreskes can use TED to explain to everyone that they should trust never validated models with no demonstrated predictive skill.
A moneymaking machine of the progressives.
Actually Richard Betts is wanting it both ways:
He agrees with skeptics that models are not important.
Yet Richard also wants to blame skeptics for ever having said that the climate obsessed think the models are important at all.
Ferdinand Engelbeen says:
…warming of less that 1°C since the LIA can’t be responsible for the 100+ ppmv increase in the atmosphere.
Ferdinand, the <1ºC temperature fluctuation since the LIA can't be responsible for much of anything. It is down in the noise. We are very lucky to be living in such a benign climate. Whether you admit it or not, that is the truth. The LIA was a time of mass deaths from starvation and exposure during one of the coldest episodes in the entire Holocene. Now the planet is finally getting back to normal. It’s all good.
The entire AGW debate amounts to spitting hairs; arguing about how many angels can dance on a pinhead. There is no reason to be alarmed. The current planetary climate is wonderful. And the more CO2 that is emitted, the better for the biosphere and everyone in it — unless you can identify any global harm, or damage, due to the rise in CO2. Can you? If you can’t show harm, then you must admit that CO2 is ‘harmless’.
You may be right about the oceans’ response to CO2 and temperature. But where is the harm?
Richard Betts ‘decarbonized’ the models. The synonym in organic chemistry is ‘exterminated’.
DirkH
August 26, 2014 at 1:39 pm
Oreskes can use TED to explain to everyone that they should trust never validated models with no demonstrated predictive skill.
And people believe her (and all other scientists that say “we know, because models”) , which makes Richard’s ‘bemusement’ all the more stranger.
Maybe the headline to next the IPCC reports reads: It’s worse than we thought; because we don’t know!
Nothing a couple more £50,000,000 supercomputers won’t fix, I’m sure!
And here’s me thinking the science was settled 20 years ago…
“…We can’t predict the long-term response of the climate to ongoing CO2 rise with great accuracy. It could be large, it could be small. We don’t know.”
IPCC AR5 TS.6 is pretty much “We don’t know.” about most everything including sea levels, ice caps, extreme weather, and even the magnitude of CO2 feedback. Whomever wrote TS.6 apparently didn’t compare notes with the authors of the summary.
Ferdinand Engelbeen
August 26, 2014 at 1:33 pm
What about a possible centuries-long lag effect? I’m willing to credit most of the past 100 ppm rise in CO2 to human activity, but am interested in your opinion as to the effect of ocean warming not since the end of the LIA c. 1850 but since its depths, c. 1690.
North Atlantic sediments show 1–2 °C cooling since the Little Ice Age. But in sediments off Africa, cooling in Bond Cycles appears larger, ranging between 3–8 °C. So my questions are, has there really been only a one degree cooling since c. 1700, & if more, then couldn’t a larger share of observed CO2 have originated in the oceans rather than from human emissions?
“we can’t predict the long-term response of the climate to ongoing CO2 rise with great accuracy. It could be large, it could be small.
I disagree with this. The Right Climate Stuff Team says in their Feb, 2014 report, “increasing levels of GHG in the atmosphere cannot cause more than 1.2 C of additional warming“.
This is beyond belief. The argument was never about whether AGW was “technically correct”, always about how much doubling CO2 would raise temperatures. The alarmist position was always based on modelling results. The warmists did not just confine themselves to “there could be a problem” – they insisted they KNEW there was a catastrophic problem and that society needed to be restructured based on their say so. This article is an admission the warmists have blatently and massively misrepresented the situation to attempt to coerce government policy and the data suggests the warmists have also deliberately distored the historical temperature record to re-inforce their case. I would suggest that by normal standards of business that would be regarded as fraud and deception.
The article says we dont know how big the effect is. That is rubbish, its not as hard or as complex as they make out. The only greenhouse impact of CO2 is to reduce Earth’s energy loss to space (measured as outgoing long wave radiation or OLR) and OLR is monitored. It is the reduction in energy loss that creates the energy imbalance that causes warming. So we can simply see how much OLR has fallen for a given rise in atmospheric CO2 and that will give us at least a ball park estimate of the impact of CO2. A pretty good first pass estimate of the climate sensitivity would be to treat earth as a grey body with emissivity = actual total OLR/OLR for a black body at Earths surface temperature. Trouble is, when we look at OLR we find that between 1970 and 2010 OLR did not fall, it rose!!!! That tells us two things, firstly rising CO2 is NOT the dominant impact on our climate as claimed, something else is driving OLR in the opposite direction and that something else is more significant. Secondly, if temperatures are rising while OLR is increasing it means energy input is increasing not remaining constant as claimed by warmists and it is this rise in energy input that is driving any warming NOT falling OLR due to rising CO2.
This needs to be investigated and understood before any claim regarding the impact of CO2 can be made. To claim we have an idea of what is going on while not resolving this issue is utterly unscientific and unsupportable. To try to sweep the issue under the carpet as warmists have done is again in my opinion deception and fraud.
Warmists have taken something which is “technically correct but practically insignificant” and exaggerated the impact by more than an order of magnitude to support their political agenda. Again in my opinion, an exceptionally dangerous and unscruplous movement with a totalitarian agenda.
Dear Mr. Betts, you have got to read the following and discover the fatal flaw of the global warming theory :
http://wattsupwiththat.com/2014/08/10/the-diminishing-influence-of-increasing-carbon-dioxide-on-temperature/
milodonharlani
August 26, 2014 at 2:26 pm
What about a possible centuries-long lag effect?
The (very) long term effect over the past 800,000 years as seen in ice cores is ~8 ppmv/°C and surprisingly linear, but with a variable lag. The lag is 800+/- 600 years during a glacial-interglacial transition and several thousands of years the other way out.
Most of the fast changes are from the direct response of the ocean surface and vegetation (seasonal to multi-year 4-5 ppmv/°C). For longer time scales like the MWP-LIA transition, the 8 ppmv/°C can be reached with a lag of ~50 years as can be seen in the medium resolution (~20 years) Law Dome DSS core:
http://www.ferdinand-engelbeen.be/klimaat/klim_img/law_dome_1000yr.jpg
In the long-time changes, both the deep oceans and the expansion of land vegetation / ice cover area play a role, which need much longer time frames. But I have the impression that these largely compensate each other as there is little change in the maximum 8 ppmv/°C between the 50 years lag of the several hundred years MWP-LIA transition and the 10,000/100,000 years interglacial/glacial time frames with 800 years and more lag.
In general, only the ocean surface temperature is of interest, as that is in direct contact with the atmosphere and shows a rapid equilibrium of CO2 and temperature (1-3 years) with each other. In balance, more deep ocean circulation has little effect on CO2 levels.
Ferdinand Engelbeen
August 26, 2014 at 3:25 pm
Thanks.
So if the average ocean temperature change since c. AD 1700 has been, let’s say, two to five degrees C (average of tropical, temperate & polar gains), the upper limit for natural CO2 increase should be around 40 ppm (5 degrees max gain X eight ppm per degree), but could be as little as 16 ppm.
That assumes that the lag is only ~300 years.
The failure of the UN IPCC climate models to provide any useful or meaningful scientific connection between man made CO2 emissions and global temperatures is well document in the AR5 WGI report particularly in Chapter 11 Near-term Climate Change: Projections and Predictability. Also the failures of these UN IPCC AR5 WGI climate models is addressed in three prior WUWT posts noted below.
http://wattsupwiththat.com/2014/04/07/un-wgii-report-relies-on-exaggerated-c
limate-model-results/
http://wattsupwiththat.com/2014/04/15/un-ipcc-ar5-climate-reports-conjecture
-disguised-as-certainty/
http://wattsupwiththat.com/2014/04/16/un-ipcc-ar5-report-infected-with-fatal
-technical-and-procedural-flaws/
Furthermore the UN IPCC AR5 report Technical Summary clearly establishes that these climate models are considered to provide only “plausible and illustrative” results with “no probabilities” associated with their outcomes. This is explicitly stated in the AR5 WGI Technical Summary Box TS.6 as “These RCPs represent a larger set of mitigation scenarios and were selected to have different targets in terms of radiative forcing at 2100 (about 2.6, 4.5, 6.0 and 8.5 W m–2; Figure TS.15). The scenarios should be considered plausible and illustrative, and do not have probabilities attached to them. {12.3.1; Box 1.1}”
Additionally the “likelihood” finding provided in the UN IPCC AR5 WGI report results is based on subjective assessments devoid of analytical analysis as noted in the AR5 WGI Technical Summary Box TS.1 as “Each key finding is based on an author team’s evaluation of associated evidence and agreement. The confidence metric provides a qualitative synthesis of an author team’s judgement about the validity of a finding, as determined through evaluation of evidence and agreement.”
The fact that the UN IPCC AR5 WGII and III reports utilized the WGI climate models to assess and determine future climate risks associated with global CO2 emissions is shear scientific incompetence.
The UN IPCC climate models are worthless for use in addressing any assessment of the impacts of global CO2 emissions on global temperatures. Those who ignore the demonstrated and proven flaws in these climate models and utilize them to propose governmental actions on “climate” issues are pushing nothing but politically motivated actions which completely disregard the results of valid climate science which documents the huge scientific shortcomings of these models.
Ferdinand Engelbeen said: “…The CO2 pressure (pCO2) to escape the oceans increases with 17 μatm/°C. That is fully compensated by an increase of ~17 ppm in the atmosphere. Including the opposite reaction of plants on increased temperatures, the average change was 8 ppmv/°C over the past 800,000 years. The MWP-LIA drop in temperature was good for some 6 ppmv drop in CO2.
Thus you need some 12.5°C temperature increase of the ocean’s surface to give the 100+ ppmv CO2 increase…
About volcanic: the largest volcanic event of the past century was the 1992 Pinatubo, with as result a drop in CO2 rate of change: the dust caused more CO2 uptake by cooling and light diffusion (= more photosynthesis) than it emitted……”
Comparing a laboratory beaker to the entire ocean is an extrapolation.
Basing your argument on a single volcano also lower its credibility.
I think you’ve assumed that the ocean’s CO2 content is globally constant, and ignored the possibility of 3,000,000 volcanic seeps adding more CO2 to the system.
Re Tisdale, A Lead Author … 8/20/14,quoting Betts:
”Everyone* agrees that CO2 rise is anthropogenic[.]
“*OK so not quite everyone, but everyone who has thought about it to any reasonable extent[.]”
Here’s a response in 20 tweets or less:
(1) If an argument contains a false premise, any conclusion can follow.
(2) Question: Where is the principle of science that what everyone agrees upon is valid? Answer: In Post Modern Science.
(3) IPCC says that about 90 GtC/yr flows out of the ocean to be reabsorbed by the ocean every year. The fate of 120 GtC/yr off the land is the same. Similarly, and presumably, the 270 GtC/yr between leaf water and the atmosphere. However, IPCC puts the flux of CO2 from burning fossil fuels at about 6 GtC/yr into the air, but only 3 GtC/yr back to — where, all of the above? Why is the fate of natural CO2 emissions different than the fate of manmade emissions?
(4) The only difference between the CO2 from the two sources is the isotopic mix, so maybe the absorption coefficients for the three isotopes causes 100% of natural CO2 to be absorbed but only 50% of ACO2? However, the equations for that fractionation have no solution!
(5) IPCC says the rate, net or not, of anthropogenic emissions matches the rate of increase in the atmosphere, therefore the former is the Cause and the latter the Effect. Anyone who has thought about this for even an instant will recognize IPCC’s application of the faux principle that Correlation Proves Causation. Correlation Proves Coincidence.
(6) The fate of ACO2 is exactly the same as the fate of nCO2 in the atmosphere. In fact the two species remix to form a distribution of other isotopic mixes which suffer exactly the same fate, estimated to the first, second, and maybe more order. (The dissolution coefficient should depend on isotopic weight, but the effect is relatively too small to have been measured as yet.)
(7) IPCC experts say the surface of the ocean is a bottleneck to the absorption of CO2, with their fingers crossed behind their backs. This is based on the carbonate equations, which depend on the pH of the surface layer, and on the condition of the surface layer being in thermodynamic equilibrium. Thanks to David 35Kyr Archer. Only isolated, dead planet’s have any part of their climate system in thermodynamic equilibrium. The finger crossing is because the alleged bottleneck would apply equally to nCO2. Pay no attention to the man behind the curtain.
(8) Henry’s Law applies to the flux of CO2 between the ocean and the air. Henry’s Coefficients are known only for thermodynamic equilibrium, but for all practical purposes on climate, if not meteorological, timescales, the flux is instantaneous. Atmospheric CO2 is the Effect of temperature changes in the surface layer, not the Cause. This is demonstrated in the paleo record from Vostok.
(9) What does IPCC say about Henry’s Law? When it appeared in IPCC’s attempt to resurrect the failed Revelle Factor, it concealed the discovery: The diagram showing the T dependency of the buffer factor was omitted now in order not to confuse the reader.
(10) Conclusions: atmospheric ACO2 is no more a Long Lived GHG than is nCO2. Neither ACO2 nor nCO2 is “well-mixed” in the atmosphere. Global temperature is the Cause and atmospheric CO2 the Effect, not the reverse.
(10) (Almost) everyone, the Consensus, is wrong. All Betts are off.
@ Moru H Aug 26th at 1.01 PM.
Re. Naomi Ordskes’ TED video
Could you explain why it is that, despite referring to the temperature rise matching the models so faithfully “for the last 50 years”, Oreskes uses a graph that stops in 1994, fully 20 years before the date of her lecture (May 2014)?
Could you also furnish us with a graph comparing the IPCC models to the instrumental data from 1994 to May 2014 so we can properly verify her claim?
Thanks
Ferdinand Engelbeen
August 26, 2014 at 1:33 pm
“Except if Henry’s Law is not applicable anymore…”
It is applicable for the static conditions for which it is intended. Not for the dynamic flows of the ocean, however.
Ferdinand Engelbeen August 26, 2014 at 12:36 pm
Steve Oregon
August 26, 2014 at 10:27 am
“Anthropogenic (man-made) CO2 contributions cause only about 0.117% of Earth’s greenhouse effect, (factoring in water vapor). This is insignificant!”
A few remarks on this:”
#########################################
Ferdinand,
Your few remarks made no connection to the quotation you were responding to. I can’t tell if you are agreeing with, disputing or ignoring the human role that was calculated here:.
http://www.geocraft.com/WVFossils/greenhouse_data.html
I do not know what it takes to get my main beef answered but I want to know why the human percentage (proportion/role) of the greenhouse effect is no where to be found among the AGW Team.
I hate to keep repeating myself but if it is true and accurate that the “Anthropogenic (man-made) CO2 contributions cause only about 0.117% of Earth’s greenhouse effect, (factoring in water vapor)” then why isn’t this insignificance more significant to the debate?
If it is untrue then what is the human contribution percentage?
It’s something?
If “they” don’t know is that why their models fail?
Please explain with sufficient specificity.
“””””…..
Ferdinand Engelbeen
August 26, 2014 at 12:36 pm
Steve Oregon
August 26, 2014 at 10:27 am
Anthropogenic (man-made) CO2 contributions cause only about 0.117% of Earth’s greenhouse effect, (factoring in water vapor). This is insignificant!
A few remarks on this:
Water vapor rapidly decreases with height/temperature, while CO2 is rather evenly distributed up to 30 km. Once passed the lower atmosphere,
“””””…..Water vapor rapidly decreases with height/temperature, while CO2 is rather evenly distributed up to 30 km. Once passed the lower atmosphere, water becomes less important and other GHGs more important for IR absorbance……”””””
So why do all the popular meteorology texts, say that “low clouds cool” and “high clouds warm”, and show graphs that claim, that “the higher the clouds, the greater the warming.” ??
Why do they preach that ?? If “””…water becomes less important and other GHGs more important for IR absorbance….””” ?? Why ??
We’ve even had citations on WUWT, that “Noctilucent clouds” are an important ingredient of GHG warming.
What is the height of noctilucent clouds, up where water is less important.
In any case, WATER VAPOR is ONLY important, when and if, IT LIES BETWEEN THE SUN, AND THE OCEANS, where it can block a lot of solar spectrum EM radiant energy from reaching the safety of the deep ocean storage, where some of it can be converted to stored “heat” (noun) !!
It isn’t particularly germane to the problem, just where WATER VAPOR does its cooling, by converting deep ocean storing, solar spectrum, beam energy, into non-deep ocean storing LWIR isotropic radiation; only half of which proceeds towards the surface (where it will just promote more surface evaporation.)
The WATER VAPOR only needs to stop the solar spectrum energy from getting within a kilometer, meter, millimeter, micron, of the ocean surface; and that kills it !!
George, clouds also block the IR path to space, and therefore their bottoms are a lot warmer than the IR temp of clear skies.
I’ll assume that Geometric Optics, is not your forte.
Solar energy arrives at earth’s atmosphere as a nearly collimated laser like beam (divergence 0.5 deg; no it’s not a coherent beam). So WATER VAPOR in those CAVU skies, absorbs significant amounts of direct solar energy, WITHOUT scattering it, so you get a one dimensional absorption path, that in a certain way DOES behave according to the Beer-Lambert Law: Ts = To.exp(-alpha.s)
That is the transmission to the ocean surface, of direct solar spectrum energy; with the absoption loss being in the near IR >700nm where water absorbs. That energy goes into the deep ocean, with a 1/e absorption depth of about 100 meters for the peak of the solar energy spectrum (green-blue).
However, the absorbed solar energy due to WATER VAPOR in clear air, does not stay dead. It is re-incarnated as ISOTROPICALLY EMITTED LWIR EM radiation, which only half of, is directed towards the sea surface, the other half to space (in clear air).
That does not mean that half of that lost solar spectrum energy, makes it to the surface, disguised as LWIR.
Because of the density, and temperature gradients, in the atmosphere, and the consequent reduction in line broadening, with altitude, the escape path is favored over the surface path; so less than half of the water vapor clear air solar energy absorbed energy, can make it to the ocean surface. But because of the wavelength shift by a factor of ten or more, the ocean surface is virtually opaque, with alpha changing from around 1E-4 cm^-1, for the blue green solar energy, up to around 1E+4 cm^-1 at 3 microns, and about 1E+3 for the ten micron LWIR, which corresponds to the surface emitted 288 K emissions as well.
So that LWIR energy, is all absorbed in less than 50 microns of surface water, and simply promotes increased evaporation.
Now when it comes to your cloud bottoms, they are NOT WATER VAPOR, they are liquid water drops and ice crystals, both of which are also totally absorbing, of 10 micron LWIR emissions from the surface. They do NOT reflect, that LWIR radiation, they absorb it.
Then being a near black body absorber, for that wavelength range, the water / ice of those clouds, re-radiates a thermal emission spectrum of LWIR, radiation, with a spectrum characteristic, of the cloud temperature. Need I add, that this new cloud radiation, is also directionally isotropic, unlike the laser like half degree divergence, of the arriving solar beam, so once again, only half of that re-radiation is headed down, and less than half, will reach the surface, for the same gradient reasons already explained, and what does reach the ocean surface, will suffer the same fate, as the re-incarnated lost solar energy.
And just to add insult to injury, the tops of those fuzzy clouds, are transparent at the micro level, to the solar spectrum, visible wavelengths, so the water droplets and ice crystals refract and transmit, in a highly scattered fashion, that incident solar energy, rendering it a virtually Lambertian radiating source, or even isotropic, so something in the 40-80% range of the solar radiation, incident on the cloud tops, is re-scattered towards outer space, and total escape.
So good luck in trying to make that look like a warming, positive feedback effect..
For the benefit of Kevin Trenberth, and others unfamiliar with the solar system, the sun beats down on half of the earth 24 hours a day 365 1/4 days per year at an orbital average power rate of 1362 watt/m^2; and for 100% of that time, that incoming solar energy has to run the gauntlet of atmospheric water vapor, and atmospheric ozone, and atmospheric CO2, all of which nibble away chunks of that incoming energy, and stop it from reaching the deep ocean storage system.
It is somewhat irrelevant, just how much solar spectrum energy lands in Kevin Trenberth’s back yard on any given day. Somewhere, some place else, ALL of the incoming solar radiant energy, is undergoing attenuation by atmospheric clear air WATER VAPOR, all the time; continuously, and other solar energy is redirected by cloud top refractive scattering, back into space; also on a continuous basis.
Atmospheric water NEVER warms this planet, it ALWAYS reduces earth’s solar energy collection, and it ALWAYS COOLS.
george e. smith commented on A Lead Author of IPCC AR5 Downplays Importance of Climate Models.
Nope, and I accept that clouds absorb then re-emit IR down.
But my point still stands, cloud bottoms are much much warmer than clear blue skies, and when calculating SB equations, the surface radiates more energy to blue skies, than to clouds, therefore clouds reduce surface cooling, even if clouds have already reduced incoming solar energy. Our normal experience with weather shows this, cloudy nights in general don’t get as cold as clear nights.
I talk about this because I want more people to go out and point an IR thermometer at the sky. Remember this is directly what Co2 is required to warm, to cause surface warming.
For “passed” read “past” .
The Catholic Church during the period between Copernicus to post-Galileo, sponsored Ptolemaic mathematicians to churn out ever more epicircles on epicircle models to support an geo-centric universe. It was a belief system driving pursuit of ever more failing scientific explanations. Sounds like today’s AGW in pursuit of a carbon demon.
Today, we only know the names of the great scientist dissenters of the orthodoxy of that era, Kepler, Copernicus, Galileo, and Newton.
The Ptolemaic believers and their models are forgotten to history except for the one name that is identified as a perojerative adjective for failure, Ptolemy (much like Ponzi is a perjorative name today).
As for Dr. Betts, I really can’t imagine the feeling of one’s life work, that at one time seemingly was so correct and lauded by the political powers, to watch it slowly crumble to dust and see nothing but forgotten discarded models and failed efforts in your wake.
To say the life’s work of today’s professional climate modelers have taught us something about climate would be akin to saying Ptolemy taught us something about how to planets moved around the sun.
Ferdinand Engelbeen August 26, 2014 at 12:13 pm
…
LOL, I can increase pH in my aquarium by 0.3 by merely turning on the circulation pumps … imagine the effect of wind on the ocean pH?
Betts’ bet on the climate models should have him mopping the floors of the casino. But then he’s connected with the current powers that be. That may change.
Could it also be that we are experiencing the 700-1000 year overturning circulation that has brought up CO2 from the Medieval Warming Period (there was a LOT of vegetation back then) that sank to the bottom and slowly meandered along the bottom pathway way back then until it was brought to the surface once again? It seems like such an incredibly steady outgassing that is usually not seen in noisy nature or predicted on the up and down industrialization of the world. Things got pretty cold after the MWP and I would imagine we had a lot of CO2 enriched surface water sinking to the abyssal “snail’s pace” bottom current. The timing is about right for that stuff to reappear.
I’ve been saying that for years.
It sounds right.
But I can’t prove it.
That is a plausible mechanism which fits all the data.
I especially liked this paragraph from Betts comments:
‘A primary aim of developing GCMs these days is to improve forecasts of regional climate on nearer-term timescales (seasons, year and a couple of decades) in order to inform contingency planning and adaptation (and also simply to increase understanding of the climate system by seeing how well forecasts based on current understanding stack up against observations, and then futher refining the models). Clearly, contingency planning and adaptation need to be done in the face of large uncertainty.’
Sounds really great (in theory). Part of what I do for a living is surface hydrography and catchment hydrologic modeling. For example, critical to that work is a clear understanding of levels of underlying PET (Potential Evapotranspiration) and actual ET (Evapotranspiration) applying. Yet I can easily prove that here is Australia, in age of satellites and sophisticated sensing technology there are (still) veritable gulfs in agreement on the details of how these are most accurately measured or estimated (regionally) between the two major bodies which are actively engaged in the development and application of GCMs (BOM and CSIRO). Furthermore, there are also groups of scientists associated with various universities who may also be associated with BOM and/or CSIRO who differ widely between themselves or their groupings on how this may best be done. When I was younger and more naive I used to think such irritating gulfs didn’t really matter in science. As the years have gone and I have periodically weathered the mutual admiration/masturbation group dynamics and prejudices that can so boringly often pass under the guise of ‘peer review’ I have come to the reluctant conclusion that science – in particular climate science, is a deeply flawed field populated by groups of tribally arranged, often fanatically prejudiced, individuals. These groups can display about as high a level of mature agreement and consensus on major issues as a bunch of squabbling central african states…
‘…improve forecasts of regional climate on nearer-term timescales (seasons, year and a couple of decades) in order to inform contingency planning and adaptation (and also simply to increase understanding of the climate system by seeing how well forecasts based on current understanding stack up against observations, and then further refining the models).
Phooey I say! In your dreams!
Committed Warming called, he says now he’s not so sure.
I am reminded of one of my very, very, very favorite articles from The Onion. Methinks Richard Betts has given up, but doesn’t quite know how to say so.
http://www.theonion.com/articles/amish-give-up,19587/
The models are bound to have wrong results, because model INPUT is incomplete, there
are always 5 climate macrodrivers missing in the input. As long as those 5 macrodrivers are not
taken into account [http://www.knowledgeminer.eu/climate_papers.html] all warmist papers
are straight for the dustbin……
What an amazing thing to say. Perhaps he is trying to say that he is a good guy, but it is other people who are saying bad things which are hurting his reputation as a living human being.
The hide of the human to say there is no on-flow from his work and his work can be ignored because of this and that.
Reading my local news source which has bought into the green politics of this issue it is easy to prove that his research does matter:
http://www.smh.com.au/environment/climate-change/climate-change-may-disrupt-global-food-system-within-a-decade-world-bank-says-20140827-108w8x.html
“”Unless we chart a new course, we will find ourselves staring volatility and disruption in the food system in the face, not in 2050, not in 2040, but potentially within the next decade,” she said, according to her prepared speech” [snip] A two-degree warmer world – which may occur by the 2030s on current emissions trajectories – could cut cereal yields by one-fifth globally and by one-half in Africa, she said.
All based off his work! So to deny that his work is bring upon doom and gloom articles guilt tripping us into changing our values to the current flavour-of-the-day diets, changes based off his work’s predictions, speaks volumes…
Scute
August 26, 2014 at 4:30 pm
Could you explain why it is that, despite referring to the temperature rise matching the models so faithfully “for the last 50 years”, Oreskes uses a graph that stops in 1994, fully 20 years before the date of her lecture (May 2014)?
Propaganda disguised as science. Richard Betts seems to imply, it’s merely a skeptics’ idea that climate models are central for policy making.
If that was true, then ‘gigantic communication failure’ would probably be the understatement of the century.
Someone posted a link to Oreskes TED talk in the comments to Bob’s posts about the Rigbey paper, if that was you then thanks for bringing it up.
Bob,
Take care with Richard Betts’ statements. Just recently he has been involved in a conference in Oxford promoting a 4 Deg. C rise in global temperatures by 2100. So, on one hand he attempts to engage skeptics at Bishop Hill, and on the other he promotes warming way above most estimates of climate sensitivity. He also justifies it all with the usual “we all believe CO2 is a GHG” etc. That is fine but the feedbacks are what might make it dangerous and the data suggest that is not happening.
Ferdinand Engelbeen
Your post at August 26, 2014 at 1:33 pm says in total
Ferdinand, you have repeatedly made that false assertion to me and I have repeatedly told you it is wrong over the years. This time I don’t need to explain why Henry’s Law is not applicable because others have already done it in this thread.
I make especial reference to the post of Jeff Glassman at August 26, 2014 at 4:30 pm because it provides his explanation of issues I have been saying for years. This link jumps to his post. And Bart makes a similar point at August 26, 2014 at 5:59 pm.
You and I have argued these issues for many years. For much of that time I was ‘a voice crying in the wilderness’ when I pointed out that the recent rise in atmospheric CO2 may have an anthropogenic cause, a natural cause, or some combination of anthropogenic and natural causes: almost everybody ‘KNEW’ the cause is anthropogenic.
I am pleased that things have moved so many people other than me are now willing to assess the assumptions underlying the attribution of the recent rise in atmospheric CO2 concentration to human activities. The human emissions may be the cause but other effects could be the cause and recovery from the Little Ice Age (LIA) is the most likely cause.
This matter goes to the crux of this thread.
The climate models downplayed by Richard Betts use atmospheric CO2 concentration as the ‘control knob’ of climate temperature; refs.
Courtney RS ‘An assessment of validation experiments conducted on computer models of global climate using the general circulation model of the UK’s Hadley Centre’ Energy & Environment, Volume 10, Number 5, pp. 491-502, September 1999
and
Kiehl JT, ‘Twentieth century climate model response and climate sensitivity’. GRL vol.. 34, L22710, doi:10.1029/2007GL031383, (2007).
If the cause of the rise in atmospheric CO2 is not anthropogenic then the models’ predictions and projections of anthropogenic warming cannot be correct.
Richard
PS tonyb, As this post demonstrates, I stand by my view that Matt’s post is the most important in the thread but have decided not to immediately leave WUWT (I will wait to see if it is our host or my heart failure or my lung failure which is first to remove me).
Are computer models reliable?
Yes. Computer models are an essential
tool in understanding how the climate will
respond to changes in greenhouse gas
concentrations, and other external effects,
such as solar output and volcanoes.
Computer models are the only reliable
way to predict changes in climate. Their
reliability is tested by seeing if they are able
to reproduce the past climate, which gives
scientists confidence that they can also
predict the future.
Met Office Publication dated 2011
Martin A:
Thanks for that hilarious quote.
I especially enjoyed this piece of nonsense concerning the climate models
No! It only gives pseudoscientists “confidence that they can also predict the future”.
Scientists know that an ability to model the past indicates nothing about ability to predict the future.
There is an infinite number of ways to model the one past that happened
and
there are an infinite number of possible futures that may happen
but
there is only one future that will happen.
A prediction of the future is a forecast. And forecast skill can only be determined by comparing a series of predictions to outcomes which subsequently happened. No climate model has existed for sufficient time for it to have demonstrated forecast skill.
No climate model has any demonstrated forecast skill; none, zilch, nada.
Richard
Counterexample: FIO-ESM shows skill, but only globally. It gets regions completely wrong.
Scott Basinger
You say
The global variation is fixed as an input of arbitrary cooling attributed to aerosols. Failure to get regional variation right indicates no ability to forecast.
I repeat that no climate model has existed for sufficient time for it to have provided a series of forecasts so no model has demonstrated forecast skill.
Richard
Their reliability is tested by seeing if they are able to reproduce the past climate.
That is a necessary, but by far insufficient condition for their reliability… It is very easy to reproduce the past if you have a lot of control knobs which allow you to fit the curve. Only with the (human) aerosols/CO2 sensitivity tandem you can have the same fit of the past, while the future warming may be halve the middle estimate of the IPCC.
See: http://www.ferdinand-engelbeen.be/klimaat/oxford.html
Yes. I have a lotus 1-2-3 spreadsheet that reproduces the past precisely (by reading from a table). But it cannot predict anything at all.
Seeing if the models can reproduce the past is the fallacy known as “testing on the training data” (since the past was also used in the parameterisation of the models).
jorgekafkazar
August 26, 2014 at 4:17 pm
Comparing a laboratory beaker to the entire ocean is an extrapolation.
Confirmed by over 2 million direct measurements of oceanic waters…
Basing your argument on a single volcano also lower its credibility.
That single volcano emitted 100 times as much debris (and CO2) as any other outbreak of the past century. If that doesn’t give some extra CO2, you can forget the rest. Volcanic vents are at maximum just after an outbreak and go down over time.
Anyway, it would be a hell of a coincidence that all volcanoes over the world are suddenly emitting more CO2 completely in parallel with human emissions over the past 160 years, while there is not the slightest indication that they did do something similar over the past 800,000 years…
Jeff Glassman
August 26, 2014 at 4:30 pm
Jeff, we have been there before. You are misinterpreting a lot of points:
(3) …IPCC puts the flux of CO2 from burning fossil fuels at about 6 GtC/yr into the air, but only 3 GtC/yr back to — where, all of the above? Why is the fate of natural CO2 emissions different than the fate of manmade emissions?
The IPCC doesn’t say or imply that the fate of the human emissions is different from natural emissions, they only say that the natural cycle is negative: more sink than source and therefore the human contribution is the (near) only cause of the increase.
Same for (4).
(5) IPCC says the rate, net or not, of anthropogenic emissions matches the rate of increase in the atmosphere, therefore the former is the Cause and the latter the Effect.
Not only the rates match, the anthro emissions are about double the increase in the atmosphere. Seems quite clear to me which causes what. I don’t think that the increase in the atmosphere causes the human emissions…
(6) Agreed, but the IPCC also agrees with that.
(7) IPCC experts say the surface of the ocean is a bottleneck to the absorption of CO2
Which is proven by a few longer series of measurements: the increase in DIC (dissolved inorganic carbon) in the ocean surface at Bermuda and Hawaii is about 10% of the CO2 increase in the atmosphere. That is the Revelle/buffer factor. It doesn’t matter if the increase is by nCO2 or aCO2. From the isotopic changes one can see that the isotopic composition of the ocean surface simply follows the isotopic composition of the atmosphere:
http://www.ferdinand-engelbeen.be/klimaat/klim_img/sponges.jpg
(8) Atmospheric CO2 is the Effect of temperature changes in the surface layer, not the Cause. This is demonstrated in the paleo record from Vostok.
The long effect of Henry’s law on the dynamic deep ocean – atmosphere system is 17 ppmv/K. Including the opposite effect on vegetation, the average over the past 800,000 years is 8 ppmv/K as seen in ice cores. The warming since the LIA is not more than 1 K, thus the maximum increase of CO2 in the atmosphere caused by temperature is not more than 8 K. Not the 100+ increase which is measured…
(9) The diagram showing the T dependency of the buffer factor was omitted now in order not to confuse the reader.
It doesn’t matter if the buffer factor changes with temperature, a factor 8 or 12 makes no difference for the fact that the oceans are net absorbers for CO2, not net emitters.
(10) Conclusions: atmospheric ACO2 is no more a Long Lived GHG than is nCO2. Neither ACO2 nor nCO2 is “well-mixed” in the atmosphere.
The IPCC does fully agree with the first sentence. aCO2 and nCO2 are well mixed: a difference of 2% of full scale in 95% of the atmosphere, while the seasonal flux is 20% of all CO2 in and out, in my opinion is well mixed.
Ferdinand Engelbeen
August 26, 2014 at 1:33 pm
It is applicable for the static conditions for which it is intended. Not for the dynamic flows of the ocean, however.
It is applicable for all static and dynamic conditions. The dynamic fluxes in and out of the oceans are directly in ratio with the partial pressure differences of CO2 in seawater and the atmosphere. The partial pressure of CO2 in seawater is directly influenced by temperature as by Henry’s law (all other influences being the same). Thus the pressure difference and hence the fluxes directly respond to temperature. That makes some 3% difference at the main sink/source places for 1 K change in temperature:
http://www.ferdinand-engelbeen.be/klimaat/klim_img/upwelling_temp.jpg
which levels out at a 17 ppmv change in the atmosphere, the same for the dynamic as for the static equilibrium.
Reasserting it does not make it so. Note Pamela’s post above.
The CO2 levels during the MWP were ~285 ppmv. During the LIA ~280 ppmv. A difference of ~6 ppmv for ~0.8°C cooling. That is all difference you may get back from 500-1500 years ago, if the waters didn’t mix with the rest of the deep oceans. Seems quite unlikely to cause the current 100+ ppmv extra…
BTW, how do you think that the oceans react on increased CO2 levels in the atmosphere? Not at all?
Nobody really knows the CO2 levels during the MWP. And, even if we did, we do not know the dynamics globally which prevailed. The CO2 level in the atmosphere is a complex interplay of sinks and sources.
Bart, increased pressure of CO2 in the atmosphere increases the uptake of CO2 by the oceans and decreases the releases. Nothing complex, simple solubility and the direct application of Henry’s law. And I haven’t heard of any plants which are growing less fast with more CO2…
If ocean content is homogenous, of which there is no guarantee. You have a number of unstated, and unsupported, assumptions built into your model.
The negative feedback of the oceans (and vegetation) to increases of CO2 in the atmosphere is independent of the source of the extra CO2. If CO2 in the atmosphere increases, the oceans will increase its uptake and decrease its releases. If the extra CO2 is from more upwelling (either concentration or ocean flux or both) or increased temperatures, the oceans (and vegetation) counteract that. That is because both uptake and release are directly proportional to the pCO2 difference between atmosphere and ocean waters.
That makes that for any disturbance in the balance, the CO2 levels in the atmosphere will integrate to a new level that compensates for the disturbance. In the case of increased upwelling to halve the change in influx (compensated by increased outflux), in the case of increased temperature to 17 ppmv/K increase in the atmosphere.
If the MWP/LIA CO2 levels were the cause, they should have been 200+ ppmv higher than pre-industrial level, but there is not the slightest indication that the upwelling increased over the past decade(s) to give the current 100+ ppmv increase…
There is.
curve fitting, not based on any real world process…
Oh, come on Ferdinand. That is some incredibly detailed correlation. The odds of it just happening randomly are vanishingly small.
Bart, you can have exactly the same curve by simply adding the CO2 increase caused by human emissions to the response of CO2 to any temperature variability.
The response of CO2 in the atmosphere to temperature changes is a simple integration to a new setpoint, due to the pCO2 response of the oceans (or vegetation) to the changed temperature. That makes that the CO2 response is always a 90 deg. shift after a temperature shift, regardless of frequency.
You misinterpreted that as a Bode response for a gain/feedback system, but there is no practical feedback of CO2 on temperature to make that true. The response of CO2 on temperature is simply straightforward, with a negative feedback on its own change.
I have bought Matlab (before WUWT announced the free course of R…) and I am experimenting with it, will show the first results of the above tomorrow…
I will be out of town for the weekend, and probably will not check back before Monday at the earliest.
You can get a 90 deg phase shift with a simple lag response, but not across all frequencies. Basically, what that means is, the system is acting as an integrator over intervals shorter than the dominant time constant. To get a 90 deg phase shift for very low frequency, that time constant has to become very long. If the dominant time constant is very long, then over any relatively short interval, the outcome is indistinguishable from a pure integration.
That is what we are dealing with, and what you will need to demonstrate to yourself. You will not be able to get a 90 deg phase shift across the entire frequency spread unless you effectively have an integrator for the given span of data. And, what we see in the data is a 90 deg phase shift even down to the lowest observable frequencies.
And, no, you cannot get the same curve – it will not have the appropriately scaled and shifted variations.
The time constant to reach a new equilibrium is in the decades, most of the temperature/CO2 variability is within 2-3 years. Thus no problem to maintain the 90 deg. shift for the variability (mainly caused by -tropical- vegetation), while the increasing trend is (proven) from a different process.
Nonsense. The CO2 variability has prominent components in the range of 3-30 years and longer.
Steve Oregon
August 26, 2014 at 6:07 pm
I hate to keep repeating myself but if it is true and accurate that the “Anthropogenic (man-made) CO2 contributions cause only about 0.117% of Earth’s greenhouse effect, (factoring in water vapor)”
A full answer needs a lot of pages, but let’s focus on the reference, which contains a lot of problems:
Table 1 shows a column of “natural additions”, but there is no column for “natural removals”, which are higher than the natural additions for all GHGs mentioned. Thus (near) 100% of the additions since the pre-industrial era are man-made…
Which makes that the 0.117% is wrong too…
‘Thus (near) 100% of the additions since the pre-industrial era are man-made…’
It never takes long for the long ago discredited pseudo-mass balance argument to rear its head again.
Bart, if the natural uptake of CO2/CH4/etc. is larger than the natural release and the authors only look at the releases, but “forget” to mention the uptake, who is fooling who? But anyway a mass balance still is valid, except if you have proof that the only alternative explanation: a fourfold increase in circulation of CO2/CH4 etc. completely paralleling human emissions did take place…
We do not know that “natural removals” would be higher than “natural additions” if anthropogenic inputs were not causing expansion of the natural sinks. This is the basic fallacy of the “mass balance” argument. I do not know why you continually fail to see it.
Over the past 800,000 years, there was a remarkable linear natural equilibrium (with a variable lag) between temperature and atmospheric CO2 levels. Thus over long(er) time frames the natural sinks were in equilibrium with natural sources. Natural sinks expand on total CO2 in the atmosphere above (temperature driven) equilibrium, regardless of the cause (anthro or natural). The current ~100 ppmv (~210 GtC) above pre-industrial equilibrium causes some 2 ppmv/year (4.5 GtC/year) extra uptake. Or an e-fold removal of slightly over 50 years or a half life time of ~40 years. The removed quantity is less than halve the yearly human emissions. Which means that the full increase is from human emissions…
So, you have imposed a constraint that the natural system cannot be responsible for the rise, and concluded that the rise is therefore not due to nature. Circular reasoning at its finest.
It can not be from natural causes, as that would add to the human releases with as result an increase higher than human emissions alone. Which isn’t what is observed. There is also not the slightest indication of increased releases from the oceans and the biosphere is a proven sink.
Incorrect. Even now, the rise isn’t as much as the virtual accumulation of human emissions, which says that sinks are active. If they are very active, and to all indications, they are, then they can take out everything that we add, and leave behind only the remnant of the much more powerful natural forcings.
Bart, the response of the natural cycle on the increase in the atmosphere (currently over 100 ppmv above the temperature dictated equilibrium) is between 10% and 90% of the human emissions. Thus while the sinks are quite variable, they didn’t take away all human emissions (in mass) over the past 55 years…
You don’t know that, Ferdinand. You are making unsupported assertions.
george e. smith
August 26, 2014 at 6:14 pm
My answer to Steve was based on vapor only, all other things being equal, but I fully agree that clouds are the most important problem in climate models: mainly seen as positive feedback, while the are mainly negative feedbacks as Willis has often repeated…
Pamela Gray
August 26, 2014 at 6:54 pm
Could it also be that we are experiencing the 700-1000 year overturning circulation that has brought up CO2 from the Medieval Warming Period
Hardly of influence: seawater temperatures might have been 1°C warmer during the MWP, but CO2 levels ~6 ppmv higher, so compensating each other in part. The same for LIA waters: colder, but less CO2 in the atmosphere. Even if that isn’t mixed with the rest of the deep waters, when it reaches the surface again, the difference may be at maximum 17 μatm at the upwelling places. At equilibrium that will give ~8 ppmv increase/decrease in the atmosphere…
All based on dodgy ice core data which cannot be verified, and assuming that no other processes occur in the deep oceans to modulate the concentration during their journey.
Not only based on ice core date (which are btw quite accurate, but averaged over some period): the carbon content of the deep ocean currents are enhanced by the fallout of carbonate shells from shell bearing plankton (coccoliths). But more important: there is no increase in pCO2 at the upwelling zones other than the increase caused by the increase in the atmosphere:
http://www.umeoce.maine.edu/docu/Fujii-JO-2009.pdf
Moreover, to dwarf the human input, the increase in pCO2 difference should be at least a fourfold, to give a fourfold outflux, for which is not the slightest indication. Not in the pCO2(oceans), not in the residence time, not in the δ13C trends…
“But more important: there is no increase in pCO2 at the upwelling zones other than the increase caused by the increase in the atmosphere:”
Which came first, the chicken or the egg? You are begging the question.
If the difference between the pCO2 of the oceans and the pCO2 in the atmosphere didn’t change over time, then the CO2 influx didn’t change. Thus no extra CO2 influx to increase the CO2 level in the atmosphere…
Non sequitur. The pCO2 on both sides is actively regulated to zero – that is what Henry’s Law is all about – so no change between the two is virtually tautological.
The pCO2 on both sides is actively regulated to drive the difference to zero.
[Snip. Invalid email address. To continue posting, use a valid email address, per site policy. ~ Mod.]
Please… Run along, Edward. Ferdinand and I are having a discussion.
[Snip. Invalid email address. To continue posting, use a valid email address. Simple. ~ Mod.]
Sorry Mr “Mod”
…
The email address is valid.
….
I’ll use a different “valid” email address if you like….
Just post your email address, and I’ll send an email to it with one of my “valid” email addresses.
[Reply: Use a valid email address in your posts. The one you are using is not valid. It comes back as: “Bad”. You may check it yourself with the site that Anthony uses: http://verify-email.org ~ mod.]
Edward Richardson,
Well you’ve had a couple of emails you’ve tried to use here, such as the “c_u_later”, “haxelgrouse” and a couple of names here too, such as “Chuck” and Mr “C_U_LATE_R” aka chucK”, all coming from the same place in Connecticut.
This “squeak” one you are using now doesn’t work, it comes up invalid in three different email validators.
So, since a valid email address is required, and you’ve been warned about that as a violation of our commenting policy, and since you’ve used three different names now in an attempt to shape shift, I’m declaring that you have officially reached troll status.
That means now all your comments, no matter which persona they come from, will be held for moderation. If they don’t have a valid email address, they go to the bit bucket.
Mr. Mod
…
You better get a different email checker.
…
I tested three of my email addresses.
1) My personal
2) My business
3) My brother’s
…
All came back “bad” but I use them every day.
REPLY: Funny that, some email addresses you use here are gmail, some are yahoo, all check bad with three different email verification services. That’s not a coincidence, that’s you.
No further comments of yours will be allowed. – Anthony
OK Mr Watts, this one passes your test
REPLY: this email address passes the test, but you just tried to change your name again. -you’ll remain on moderation until such time you stop such shenanigans. There won’t be any notice if you further violate our comments policy, you’ll simply be banned. -Anthony
richardscourtney
August 27, 2014 at 1:19 am
Ferdinand, you have repeatedly made that false assertion to me and I have repeatedly told you it is wrong over the years. This time I don’t need to explain why Henry’s Law is not applicable because others have already done it in this thread.
And I have repeatedly answered that Henry’s Law is applicable, as good for a static as for a dynamic system. Some longer answers to Glassman and Bart are under moderation, so will appear soon…
It is a pity to hear of your health conditions, our old generation of skeptics unfortunately is thinning out, but as long as we can have a good fight over ideas, we are staying alive (at least mentally)…
“And I have repeatedly answered that Henry’s Law is applicable, as good for a static as for a dynamic system. Some longer answers to Glassman and Bart are under moderation, so will appear soon…”
Heavens be praised!!!! Let’s hope the moderation is swift!
Putting aside an Engelbeen response to Bart I’ve only been waiting about 4 years to get a truly coherent rebuttal by Engelbeen to Jeff Glassman’s discussion of the ‘CO2 problem’, in particular the δ13C problem here:
http://www.rocketscientistsjournal.com/2010/03/sgw.html
The response should be comprehensive, particularly including addressing the issue whether the atmosphere is well-mixed with respect to nCO2 and ACO2 (or not).
I draw Engelbeen’s attention to the fact that, ever since there has been a suite of reasonable coverage global CO2 measuring stations the discrepancy between the mean NH and SH atmospheric pCO2 levels has been steadily increasing and similar effects apply for pδ13C. Perhaps more importantly there are also marked regional gradients – especially in the SH and especially as the Southern Pole is approached.
Well mixed? I don’t think so. Particularly not in the water.
Thus I have also never been comfortable with Engelbeen’s assumption that Henry’s Law rules the global carbon mass flow model. The mass flow model must include the temperature-dependent flux of CO2 to and from the ocean to modulate the natural exchanges of heat and gases. In my view this also means the flux should take into account the reverse temperature-dependent uptake rate of oceanic cyanobacteria – particularly in those regions where cyanobacterial primary productivity is very high e.g. (you guessed it) – in the 40S band surrounding Antarctica i.e. surrounding the Southern Pole
Engelbeen’s assumption the mass flow is controlled by purely abiotic/chemothermodynamic factors is wrong. For example, it essentially assumes that the sinking flux of biologically fixed carbon is zero. It also takes no account of flux effects of aerobic decomposition in the ocean. Now I wonder what the cumulative mass of ignored peer reviewed literature is involved there? I’m amazed when people assume the oceans are biological deserts. By the same token I am also not impressed with arguments which use CO2 levels from a single polar ice core during LIA and MWP
Remember we are talking about an oceanic system here carrying, on average, about 100,000 cells/mL of Prochlorococcus and about 10,000 cells/mL of Synechococcus in the upper 20 m or so. In effect, the role of the biotic factors are partly why Jeff Glassman can suggest the δ13C for fossil fuel would have had to be considerably heavier, ~ -13.7‰ instead of -29.4‰, for the increase in atmospheric CO2 to have been caused by man.
Sorry to be skipping around. This is a big complex system – more complex that Engelbeen or IPCC can imagine it seems.
But, please, do go ahead – in the spirit of having a good fight over ideas, staying alive (at least mentally)…please make the day (asap) of this poor tired old, nearly retired….. isotope geochemist.
Steve Short:
Thanks for that.
You may want to search WUWT for the many interactions of Ferdinand and me disputing all the matters you raise. In particular, as an “isotope geochemist” you may be interested in my rebuttals of Ferdinand’s assertions concerning indications of 13C:12C isotope changes.
Richard
Steve, I have had several discussions with Glassman in the past. He is a master in misinterpretation of what others say or mean and his answers are extensive siting non-relevant items where the real answer is lacking or drown in the mass…
But to answer your “not well mixed” problem, here the yearly average increases of several stations for CO2 1959-2004 (needs an update):
http://www.ferdinand-engelbeen.be/klimaat/klim_img/co2_trends.jpg
The difference between stations from the North Pole down to the South pole over the past years is less than 5 ppmv, or less than 2% of full scale:
http://www.ferdinand-engelbeen.be/klimaat/klim_img/co2_trends_1995_2004.jpg
I call that well mixed, taking into account that about 20% of all CO2 goes in and out of the atmosphere over the seasons.
As the ITCZ limits the NH-SH atmosphere exchanges to about 10%/year, the lag of the SH increase shows that the source is in the NH.
The same for the δ13C trends:
http://www.ferdinand-engelbeen.be/klimaat/klim_img/d13c_trends.jpg
As aCO2 is readily mixed within the rest of the atmosphere, the influence of human emissions (of which 90% in the NH) is quite well mixed in the atmosphere all over the whole world, as the δ13C trends show.
The oceans are a different story: except for the ocean’s surface which simply follows the CO2 and δ13C trends of the atmosphere, in the deep oceans there is hardly any influence measurable except at downwelling places.
About the influence of Henry’s Law on the in/out fluxes between atmosphere and (deep) oceans:
The flux rate between oceans and atmosphere depends of two items: partial CO2 pressure difference and wind speed. Assuming the latter didn’t change that much over the past century, the flux rate is directly proportional to the pCO2 difference, see:
http://www.pmel.noaa.gov/pubs/outstand/feel2331/maps.shtml
The largest pCO2 difference is at the ocean sink and upwelling places, where the ocean flows bypass the ocean surface and go directly into the deep or return from the deep. That is less than 5% of ocean surface each way, where the atmosphere – deep ocean exchanges are concentrated.
From the δ13C and δ14C balances we have an estimated ~40 GtC/year deep ocean-atmosphere CO2 exchange. The absolute figure is not important, but can be used as a base for the calculations.
The pCO2 difference at the North Atlantic sink place is about 250 μatm. atmosphere higher than ocean. At the main upwelling places in the Equatorial Pacific, the difference is 350 μatm, ocean higher than atmosphere. Both generate the ~40 GtC/year fluxes (there is a slight difference of ~3 GtC more sink than source, but that is not of importance here).
What is the influence of temperature? Any increase of seawater temperature increases the pCO2(aqua) with about 17 μatm/K. That makes that with a worldwide increase in temperature of 1 K, the pCO2 difference, and thus the inflow at the upwelling places increases with 17 μatm thus from 350 to 367 μatm and thus the influx increases from ~40 GtC/year to ~41.9 GtC/year.
The opposite happens at the sink places: less pCO2 difference, from 250 reduced to 233 μatm, thus the outflux is reduced from ~40 GtC/year to ~37.3 GtC/year.
Net result: an initial increase of CO2 in the atmosphere with near 5 GtC or ~2.5 ppmv in the first year.
As the 2.5 ppmv extra after the first year opposes the pCO2 changes caused by the temperature increase, the inflow/outflow difference is reduced the second year etc… until the original fluxes are restored, which is when the atmosphere reaches the 17 μatm (~ppmv) extra in the atmosphere:
http://www.ferdinand-engelbeen.be/klimaat/klim_img/upwelling_temp.jpg
Consequencse:
– Any CO2 influx change from deep ocean upwelling (like from MWP or LIA waters) will be halved in effect in the atmosphere by the changes in downwelling.
– A constant CO2 increase caused by only a constant temperature difference is impossible, as that will be met with decreased releases and increased uptake from the increasing pCO2 in the atmosphere.
Forgot to answer (the rest was already long enough):
Engelbeen’s assumption the mass flow is controlled by purely abiotic/chemothermodynamic factors is wrong.
There are many works on the NPP (net primary production) of biotics in the oceans, including the influence of temperature, but the main influence is from upwelling nutritients. They tried to rise the NPP with iron seeding, which indeed caused algal blooms, but the net result in CO2 sink rate was quite modest.
Anyway, most of the ~40 GtC deep ocean-atmosphere exchange rate is inorganic and what sinks as organics is dispersed in the large deep oceans reservoir and hardly influences DIC in the deep.
The pCO2(aqua) measurements at the main source/sink places include the biotic use of CO2, thus that is accounted for.
why Jeff Glassman can suggest the δ13C for fossil fuel would have had to be considerably heavier, ~ -13.7‰ instead of -29.4‰, for the increase in atmospheric CO2 to have been caused by man.
Again a misinterpretation by Jeff (and by Richard):
If there was no exchange with other reservoirs, the drop in δ13C would be much faster than measured. But there are exchanges with
– vegetation: not so important, as most uptake comes back as release in the next season/years. Only the ~1 GtC/year more permanent uptake gives an increase in δ13C.
– ocean surface: not so important, as that is only 10% of the change in the atmosphere and slightly increases the δ13C level in the atmosphere (~2‰).
– deep oceans: important, as what goes into the deep oceans is the current isotopic composition (minus the isotopic shift at the boundary), but what comes out is the composition of the deep oceans from waters 500-1500 years old (minus the isotopic shift at the boundary). That allows us to estimate the deep ocean-atmosphere exchanges:
http://www.ferdinand-engelbeen.be/klimaat/klim_img/deep_ocean_air_zero.jpg
which is ~40 GtC/year. A similar exchange rate can be deduced from the 14C bomb spike decay rate.
Steve, the temperature correction factor is used for all on line ship’s measurements (over 2 million nowadays) all over the world oceans. Not my fault. But I have no problems using other (better?) factors.
I never said that CO2/bi/carbonate is well mixed in the oceans. CO2 and δ13C are well mixed in the atmosphere, that is what you asked for. And I have addressed the “problem” of the discrepancy of the δ13C drop over time as questioned by Glassman and Richard.
And the uptake/release of CO2 is directly proportional to the pCO2 difference between oceans and atmosphere. That includes the biological changes in the waters measured on many places of the earth.
Thus if the further discussion is about my – restricted – knowledge of biological processes in the oceans, then I have little to add. If the discussion is about the result of increased temperatures, then we can look at the probabilities.
All we know is that the short term variability (seasons to 2-3 years) is 4-5 ppmv/K for all processes on earth combined (but dominated by vegetation), while the long term variability (from a lot of ice cores) is 8 ppmv/K (dominated by the oceans).
As vegetation in general increases its uptake with higher temperatures (more uptake and more area), the 8 ppmv/K must be the lower bound for the oceans. Can you agree on that?
“The flux rate between oceans and atmosphere depends of two items: partial CO2 pressure difference and wind speed. Assuming the latter didn’t change that much over the past century, the flux rate is directly proportional to the pCO2 difference.”
The evidence is that wind speeds have been increasing over the oceans (but not, or the reverse, over the continents) over the last 40 – 50 years. See reviews by people like Farquhar and Roderick etc.
“What is the influence of temperature? Any increase of seawater temperature increases the pCO2(aqua) with about 17 μatm/K. That makes that with a worldwide increase in temperature of 1 K, the pCO2 difference, and thus the inflow at the upwelling places increases with 17 μatm thus from 350 to 367 μatm and thus the influx increases from ~40 GtC/year to ~41.9 GtC/year.”
I just ran the classic standard Nordstrom seawater composition through USGS PHREEQC with the default USGS database. At 14 C the log pCO2(aqua) is -3.41 and at 15 C it is -3.41 (to 2 significant figures). Thus at 20 C pCO2(aqua) is 389.0 μatm and at 15 C pCO2(aqua) it is also 389.0 μatm. Given the number of significant figures, this implies a difference of ~<4.4 μatm or effectively <4.4 μatm/K. The French BRGM database gave exactly the same results. Concerned, I ran the model again using the Lawrence Livermore database (just in case USGS and BRGM are wrong….). At 14 C the log pCO2(aqua) is -3.49 and at 25 C it is -3.48. Thus at 14 C pCO2(aqua) is 323.6 μatm and at 15 C pCO2(aqua) is 331.1 μatm. This is still a difference of only 7.5 (±4.4) μatm/K. I also checked at lower temperatures ( 9 – 10 C) and at higher temperatures (19 -20 C) and can't get values anywhere near your quoted 17 μatm/K using any reputable chemothermodynamic database.
Given the average temperature of the oceans is around 14.5 C it seems to me (1) your quoted value of pCO2(aqua) change with temperature of 17 μatm/K is quite wrong. This is going to have profound effects on your estimate of the change of annual influx for a 1 K change in temperature – even before (2) we get into discussion of the consequences of a true lower value at the same or lower temperatures e.g in the Antarctic Circumpolar Current in the presence of high cyanobacterial primary productivity. Looks to me like your world view is a bit shaky.
I just run this calculation again with a full Pitzer-optimized 2014 EQ3/6 database model at 17 C which seems to be the best consensual value for the mean temperature of the ocean surface (the 14.5 C value was a literature grab value trying to take account of upwelling). The actual temperature is not critical. This model gives a value around 4.0 – 4.4 μatm/K (depending upon some very minor assumptions) for the temperature dependence of pCO2(aqua) – only a quarter of your oft-quoted (above) and model-critical 7 μatm/K value.
Just a correction of a typo my previous final sentence: “This model gives a value around 4.0 – 4.4 μatm/K (depending upon some very minor assumptions) for the temperature dependence of pCO2(aqua) – only a quarter of your oft-quoted (above) and model-critical 17 μatm/K value.” (not 7 as I wrote). Please also note my model includes the all important borate which contributes nearly a quarter of the buffering of seawater above pH 7.5 and exhibits the correct Revelle factor.
Steve, my figures came from the direct measurements of seawater pCO2 where the measurements are corrected for the difference in temperature between measuring device and seawater inlet temperature. See chapter 2e of:
http://www.ldeo.columbia.edu/res/pi/CO2/carbondioxide/text/LMG06_8_data_report.doc
But in fact it doesn’t matter that much: even if it was halve the 17 μatm/K, that only halves the change in fluxes and the target in the atmosphere to restore the original fluxes. The principle remains the same: any change in ocean temperature will be met with a change in CO2 level in the atmosphere which restores the original fluxes.
If the wind speed changed over time, that only changes the fluxes (in both directions?) which influences the speed at which a new equilibrium is reached, but that doesn’t change the equilibrium itself (except if there is a disequilibrium in wind speed changes between source and sink places).
The change in atmospheric CO2 levels at equilibrium equals the average change in pCO2 of seawater. If the change in seawater pCO2 is less than 17 μatm/K, then the effect of ocean temperature on atmospheric CO2 levels is also smaller.
“my figures came from the direct measurements of seawater pCO2 where the measurements are corrected for the difference in temperature between measuring device and seawater inlet temperature.”
That is a 2014 report on a set of measurements conducted in 2006 on a ship. The practical measurements are complicated and easily subject to bias. They are also exclusively location dependent as you acknowledge – rather ironic in the context of your reliance on that a well mixed system. More importantly, given that as you claim Henry’s Law is well known and applies it makes much more sense to use critically reviewed databases which include the current best estimates of the Law’s parameters and of all important buffering reactions equilibria in the water. My approach is utterly commonplace.
“But in fact it doesn’t matter that much: even if it was halve the 17 μatm/K, that only halves the change in fluxes and the target in the atmosphere to restore the original fluxes.”
I am saying that using the above modeling methodology the correct value is only 25 – 44% of your value, probably nearer 25% but certainly not 50%.
“The principle remains the same: any change in ocean temperature will be met with a change in CO2 level in the atmosphere which restores the original fluxes.”
“The change in atmospheric CO2 levels at equilibrium equals the average change in pCO2 of seawater. If the change in seawater pCO2 is less than 17 μatm/K, then the effect of ocean temperature on atmospheric CO2 levels is also smaller.”
These are simply truisms any good quality college lecturer would say thus used by you used only to impress the naive. So what? Why state them? As you claim to be I too am relatively uninterested in people who employ misinterpretation of what others say or mean and/or provide answers which are extensive siting non-relevant items where the real answer is lacking or drowned in the mass…Please note I am not padding my text with student level truisms and would appreciate you doing the same.
I am making the valid points that (1) it is clear you are using a single significant overestimate of the mean abiotic temperature dependence of pCO3(aq) of seawater at the mean ocean temerature (17.6 C), and (2) you are also unaware of the modern trend in oceanic wind speeds.
Furthermore I contend that the biotic influence of phytoplankton is significant and raises a host of significant technical issues you have not properly considered (beyond a surficial scan of the literature leading to dogmatism). To take just one example what about marine surface films?
The biotic significance is increased by a lower abiotic temperature dependence of pCO3(aq) of seawater than you claimed. The NPP of biotics in the oceans, including a powerful influence of temperature – more significant that the abiotic, is most significant in the great circumpolar bands – particularly the southern band and particularly since the Drake Passage opened up 40 odd million years ago.
Satellite retrievals indicate increases in oceanic wind speed averaging 0.008 m s-1 a-1 for 1987–2006.
Wentz, F. J., L. Ricciardulli, K. Hilburn, and C. Mears (2007) Science, 317, 233–235
Sorry, used the wrong reply… see above
Data collected from ships and satellites has frequently been used to estimate trends in surface wind speed. Although these data sets consistently show an increase in global average wind speed over recent decades, the magnitude of this increase varies depending on the data source used. Observations of the ocean surface by satellites, namely altimeter and SSM/I, provide reasonably long datasets with global coverage. These well calibrated and validated datasets are analysed for linear trends of regional mean monthly time series and mean time series for each calendar month over the period from 1991 to 2008. Differences between the resulting trends are investigated and discussed. The data indicate that the observed global trend is not uniformly distributed and can be linked to a significant positive trend in regional average time series across equatorial regions and the Southern Ocean.
Zieger et al (2014) Deep Sea Research Part I: Oceanographic Research Papers 01/2014;
Steve Short
I have been observing your debate with Ferdinand and have resisted the temptation to join in because it would be unreasonable to ‘gang up’ on him.
However, I write to draw attention to your writing
I think it needs to be clearly understood that Ferdinand is well aware of the argument that Henry’s Law is not applicable because it is overwhelmed by biological effects in the ocean: I have repeatedly put this point to him over the years including on WUWT. Indeed, it is what I meant when I wrote in this thread saying to him
However, to date the only responses I have had from him on this matter is argument by assertion.
Hence, I sincerely hope your conversation with Ferdinand will elucidate a better answer to the issue than I have obtained.
The issue has extreme importance.
The observed dynamics of the carbon cycle are mostly driven by biological activity. Thus, how atmospheric CO2 is observed to vary is determined by biological activity. And biological activity varies with temperature and it changes between glacial and interglacial conditions. Nobody knows anything about these variations on a global scale.
The entire recent rise in atmospheric CO2 may be – and probably is – a result of temperature rise from the Little Ice Age (LIA).
Richard
Steve and Richard,
The discussion was started to see if Henry’s law still is valid for a dynamic system.
I don’t see any reason that it wouldn’t be valid: as long as there is a pCO2 difference, there is a CO2 flux, in or out, depending of the sign of the difference, which is influenced by a change in temperature.
The height of the change is a matter of temperature at one side and biological activity on the other side.
In general temperature is dominant, as the higher outflux in the tropical oceans and the higher uptake in the polar waters shows.
Biological activity does modulate the pCO2 of the oceans to a certain extent, but the measured pCO2 levels show the main releases in the tropical waters and the main uptakes in polar waters.
Wind speed changes do modulate the fluxes, but in general that only changes the time constant to reach the new equilibrium. An asymmetric wind speed change between upwelling and downwelling places can shift the equilibrium somewhat, but seems not that important to me.
What if the temperature increases? One source, used for the correction of millions of field measurements gives 17 ppmv/K for the average seawater temperature, other sources give smaller values. The exact value thus may differ, but the main point still is that the pCO2 of seawater increases with increased temperature.
That gives an increase of CO2 in the atmosphere which is the same as the average increase of pCO2 in the oceans which restores the previous fluxes.
The historical increase rate was 8 ppmv/K over very long time frames. As that is mainly caused by the oceans (vegetation being a net sink at higher temperatures), that is the minimum change in pCO2 of the oceans.
Thus, Richard, the warming since the LIA of less than 1 K is good for maximum 8 ppmv extra CO2 in the atmosphere. That is all. The more that a huge release of CO2 out of the oceans would increase the δ13C ratio of the atmosphere, while we see a firm decrease…
Ferdinand
Please be assured that I am not ignoring your having written
You and I have argued this many, many times without resolution.
Having iterated how and why I think the issue is important, I want to ‘stand back’ in hope that you and Steve can do better than you and me at obtaining a conclusion.
Richard
I’m sorry; due to work matters I can’t resume this discussion for a week. In the meantime, I think it would be very useful if Ferdinand could provide a mathematical critique (from his perspective) of the math which Dr. Jeff Glassman wrote back in 2010 regarding what IPCC had written in AR4 i.e. in his Section III: Fingerprints Part A – with respect to the δ13C ‘problem’.
http://www.rocketscientistsjournal.com/2010/03/sgw.html
Ferdinand’s earlier comments on this rely on a long deep ocean/atmosphere exchange rate (quoted timescale 500 – 1500 years) but according to his graph also varying from <<20 GtC/yr in only 1920 – 1940 to over twice that, 40 GtC/yr in 2000. This means the deep ocean reservoir is what? Not well mixed? Varies widely in it's rate of exchange with the atmosphere over multi-decadal decadal timescales? Ferdinand also says the 'ocean surface reservoir' only changes atmospheric δ13C by about ~2‰ noting his use of the term 'vegetation' seems to leave out the 47% of the living global photosynthetic biomass residing in the oceans. This material is a can of worms riddled with circular argument. But most importantly, in this case they are largely distractions used as debating tools (which of course Ferdinand abhors).
Jeff Glassman accepted the IPCC Gsubzero and Rsubzero values and also used the Battle. M. et al (2000) δ13Csuba and δ13Csubf coefficients which yield the rsuba(1995) and rsubf values so, in effect, the constancy of the rate of exchange with the deep ocean is assumed (for say the 50 years prior 2003). IPCC AR4 also quoted Battle et al (2000) extensively so even IPCC at least did not resile from their parameters. Notably, Ferdinand supported this in the graph he posted and by noting the constancy of 'this value' (by definition the ~40 GtC/yr) had been 'verified' by the decay of the ~1962 originating 14C bomb pulse 50 years ago. Jeff also accepted that, in 2003, the average atmospheric was around 8.080 ‰ i.e. in agreement with the figure Ferdinand displayed. Of course this all still assumes a ACO2 'well mixed' scenario.
I have gone carefully over Jeff's math and I can't find a significant flaw – nor would I have expected them from the inventor of one of the fastest and most famous FFT algorithms. But I am always open to argument on this. Murray Salby employed a comparable (but I think less clever) argument for essentially a similar outcome. But it's strange how none of the academic reviewers of Salby's well respected textbook picked-up his flawed thinking then and more recently either. Battle, M. et al (2000) is a well respected paper with an extremely high citation index, was supported by IPCC AR4 and has not been found to be wanting logically. I think; not only has Jeff Glassman identified a significant problem but also Ferdinand is (interestingly) not only 'boxed in' by his own statements but has not provided a logical rebuttal. To me it appears Ferdinand did not even bother to look closely at Jeff's math. Why should we accord Ferdinand the same courtesy? I hope you are reading this, Jeff (;-)
Typos in 2nd to last sentence 3rd paragraph. Sentence should read:
Jeff also accepted that, in 2003, the average atmospheric δ13C was around -8.080 ‰ i.e. in agreement with the figure Ferdinand displayed.
Ferdinand, why do you even say silly stuff like:
“What if the temperature increases? One source, used for the correction of millions of field measurements gives 17 ppmv/K for the average seawater temperature, other sources give smaller values. The exact value thus may differ, but the main point still is that the pCO2 of seawater increases with increased temperature….
The historical increase rate was 8 ppmv/K over very long time frames. As that is mainly caused by the oceans (vegetation being a net sink at higher temperatures), that is the minimum change in pCO2 of the oceans.”
(1) The Henry’s Law parameters embedded in e.g. the UC Berkeley EQ3/6 chemothermodynamic database suggest the value of the rate of change of pCO2(aq) with temperature is about 4.2 – 4.4 ppmv/K for the CURRENT average seawater composition (Nordstrom/USGS). Conversely, the Lawrence Livermore National Laboratory chemothermodynamic database says the correct value is about 7.5 ppmv/K. Therefore why do you keep insisting it should (now) be about 17 ppmv/K? Your value appears to be based upon one single field study but also, I have found, a few relatively crude online calculators (such as students might use). The latter leave out a lot of key refinements such as incorporating e.g. Pitzer coefficients to account for the ionic strength effects on species’ activities and in solution (noting seawater has an ionic strength of 0.645 molar and is close to the limit of the extended Debye-Huckel Equation) and/or fails to include borate which contributes about a quarter of the buffering of seawater above pH 7.5.
(2) Don’t you realize that this ppmv/K is already a TEMPERATURE DEPENDENCY RATE (of pCO2(aq)) and of itself a relatively CONSTANT thermodynamic value? As such, this rate of change itself does not increase at all significantly with temperature e.g. an increase of the water temperature to say 20 C does not change that /K (/C) temperature dependency RATE significantly. The fact that; as you say: “the historical increase rate was 8 ppmv/K over very long time frames” simply confirms for me that the value of 7.5 embedded in the Lawrence Livermore National Laboratory chemothermodynamic database is most probably the most correct/best value (to one significant figure). There is no fundamental reason why the thermodynamic rate of increase of pCO2(aq) with temperature should double to 17 ppmv/K unless the average seawater major ion composition had changed SIGNIFICANTLY since say the LIA, which it is has most assuredly not.
So, in effect, by saying; “The historical increase rate was 8 ppmv/K over very long time frames……that is the minimum change in pCO2 of the oceans.” you are even implying that Henry’s Law has somehow changed since the LIA!!!!!
Phooey!!!
A ghostly glowing light bulb appeared over my head! The dreaded Revelle Factor!!! Thank you for that off the cuff comment Jeff – I just knew in my bones there would have to be some dirty little fiddle somewhere in there for Ferdinand to effectively change Henry’s Law between the LIA and now (cough, choke).
So we have the laughable situation where all the well meaning old fashioned chemists who labored over more than 60 years of laborious lab studies to develop the critically reviewed data for all the famous modern aqueous EQUILIBRIUM chemothermodynamic databases like EQ3/6, WATEQ4F, LLNL, MINTEQ etc., have been marginalised to the extent of banishment from the oceans by a bunch of post modernist creeps who have no qualms about inserting fiddle factors and even (get this) ‘dimensionless factors’ into a relatively simple set of equilibrium thermodynanic equations dealing with gas phase CO2, dissolved CO2, bicarbonate, carbonate, various ion pairs etc. Clearly, Revelle and Suess (1957) have a lot to answer-for!
Post David Archer, Takahashi , Feely etc., etc., ad nauseum, allow me to quote this gem:
Numerical studies have indicated that the steady-state ocean-atmosphere partitioning of carbon will change profoundly as emissions continue. In particular, the globally averaged Revelle buffer factor will first increase and then decrease at higher emissions. Furthermore, atmospheric carbon will initially grow exponentially with emission size, after which it will depend linearly on emissions at higher emission totals. In this article, we explain this behavior by means of an analytical theory based on simple carbonate chemistry. A cornerstone of the theory is a newly defined dimensionless factor, O. We show that the qualitative changes are connected with different regimes in ocean chemistry: if the air-sea partitioning of carbon is determined by the carbonate ion, then the Revelle factor increases with emissions, whereas the buffer factor decreases with emission size, when dissolved carbon dioxide determines the partitioning. Currently, the ocean carbonate chemistry is dominated by the carbonate ion response, but at high total emissions, the response of dissolved carbon dioxide takes on this role.
http://onlinelibrary.wiley.com/doi/10.1029/2009GB003726/full
Dimensionless factor???? Oh my gawd, will this crap never end?
Steve, here an answer to what Jeff Glassman wrote:
IPCC’s argument is that the decline in O2 matches the rise in CO2 and therefore the latter is from fossil fuel burning. Every molecule of CO2 created from burning in the atmosphere should consume one molecule of O2 decline, so the traces should be drawn identically scaled in parts per million
Again something Glassman interprets that never was said or implied by the IPCC.
– He is wrong about the oxygen use by fossil fuels: for coal it is 1:1 carbon:oxygen. For oil it is ~1:1.5 and for natural gas it is 1:2. Glassman forgot that hydrogen in several fossil fuels also uses oxygen. Thus the changes in oxygen and CO2 are not equal.
– The IPCC also adds that in the balance, vegetation can add or use oxygen, depending of how much CO2 is released or taken away by the biosphere as a whole. Since the 1990’s, the oxygen balance shows that the biosphere is a net sink for CO2, thus a net source of O2. That gives the following graph for the 1990-2000 period:
http://www.ferdinand-engelbeen.be/klimaat/klim_img/bolingraph.gif
From IPCC TAR, Chapter 3, page 206, fig. 3.4
http://www.grida.no/climate/IPCC_tar/wg1/pdf/TAR-03.PDF
About the δ13C balance:
The result is a mismatch with IPCC’s data at year 2003 by a difference of 1.3‰, more than twice the range of measurements, which cover two decades.
As explained before, Jeff doesn’t take into account the “thinning” of the δ13C drop caused by human emissions from the deep ocean exchanges. He does mention them, but he doesn’t use that in his calculations.
Anyway:
– the oceans are not the cause of the δ13C drop over time, as any additional release of CO2 from the oceans would increase the δ13C level of the atmosphere.
– the biosphere is not the cause of the δ13C drop over time, as that is a net absorber of CO2, and thus preferentially of 12CO2, leaving relative more 13CO2 in the atmosphere.
– many other natural sources like volcanoes have δ13C levels higher than the atmosphere.
Thus in my informed opinion, the only cause of the δ13C drop is from human emissions…
The same for the pre-1950 nuclear bomb testing 14C decline: from 1890 on the carbon dating tables had to be corrected for the zero-14C releases from fossil fuels…
Therefore why do you keep insisting it should (now) be about 17 ppmv/K
Steve, it doesn’t interest me more than one minute if the factor is 17 ppmv/K or 4 ppmv/K. That is counting the dancing angles on a pin head. 17 ppmv/K is not my figure, if you have complaints, write Takahashi and others who use that figure for their measurements. But let’s agree on the ~8 ppmv/K change rate for a temperature change.
The only point of interest for me is that any increase of the global ocean surface temperature gives a limited increase of CO2 in the atmosphere. Which is what Bart and Salby deny: They insist that a sustained difference in temperature above a zero line gives a constant increase of CO2 in the atmosphere, which violates Henry’s law as good as for static as for dynamic systems.
I never said or implied that Henry’s law changed over time, which is simply impossible. But Henry’s law is only applicable to dissolved free CO2, not to bicarbonates or carbonates, be it that these influence the remaining dissolved CO2 in equilibrium, influenced by pH. That is where the Revelle factor comes in: the Revelle factor shows how much more CO2 dissolves in seawater than in fresh water for the same CO2 pressure in the atmosphere. That doesn’t influence the ratio as implied in Henry’s law, as that is about the same in fresh water as in seawater, but a lot more is getting into bicarbonates and carbonates in seawater. I don’t see how the Revelle factor would influence the pCO2 of seawater (besides marginally), as that is only related to free CO2 and salt(s) content.
Further you are misinterpreting my graph of δ13C thinning by deep ocean exchanges: the discrepancy in δ13C in the earlier years is from the biosphere: before 1990, the biosphere was a net contributor of (low δ13C) to the atmosphere, after 1990 a net absorber of CO2 (thus reducing the δ13C drop in the atmosphere). That is not accounted for in my calculations. That may decrease the real deep ocean-atmosphere exchange somewhat, but that doesn’t imply that the ~40 GtC/year exchange did change over time, only that the most recent figures are the most accurate, as the drop in δ13C is the fastest.
I do frequently use “vegetation” which implies vegetation in general, including ocean vegetation. That also includes the whole biosphere, CO2 users as well as CO2 producers, if the δ13C and O2 balances are involved, but I will be more careful to choose “biosphere” where appropriate.
The EPA’s Endangerment Finding rests on three “lines of evidence”: (1) physical understanding of climate (2) temperature records and (3) computer models:
TSD, Section 5, p. 47.
The absence of the hotspot, among many other deficiencies, proves they do not have a sufficient basic physical understanding. The hot spot predicted by theory is conclusively demonstrated not to exist by more than 50 years of balloon data and 35 years of satellite data. It’s not there. It’s dead, Jim. It’s joined the bleeding choir invisible.
Temperature records – it’s not warming; where it is warming it’s regional, not global; and it’s not setting new records. The instrumental record is too short, too incomplete and too corrupt to draw valid conclusions about causation.
Modeling: Betts is just another item in the overwhelming proof of the complete failure of the climate modeling enterprise.
EPA’s attribution of warming in is total BS because it rests on three invalid lines of evidence.
“… we can’t predict the long-term response of the climate to ongoing CO2 rise with great accuracy. It could be large, it could be small. We don’t know.)
But I thought that 93% of IPPC AR5 contributors are 95% CERTAIN of their warming catastrophe predictions/assumptions/knowledge-based guesstimates.
Over at Bishop Hills, Richard returns.
The final sentence of his comment “We are prodding an angry beast”, tells me never mind just another emotionally immature twit, paid to be a scientist.
Once again, good enough for government.
Anthony says to “Edward Richardson”:
…you’ve had a couple of emails you’ve tried to use here, such as the “c_u_later”, “haxelgrouse” and a couple of names here too, such as “Chuck” and Mr “C_U_LATE_R” aka chucK”, all coming from the same place in Connecticut.
I just knew this guy was playing games. So, he’s our old friend “H Grouse”, and “chuck”, among others.
That explains a lot. It explains why he argues incessantly, and never acknowledges that anyone has a legitimate point. ‘H Grouse’, heh. I should have known.